consumption impacts of who dietary norms in …ageconsearch.umn.edu/bitstream/24564/1/cp05sr01.pdfan...
TRANSCRIPT
An Assessment of the Potential Consumption Impacts of WHO Dietary Norms in OECD Countries
C.S. Srinivasan∗, Bhavani Shankar and Xavier Irz Department of Agricultural and Food Economics School of Agriculture, Policy and Development
The University of Reading UK
Paper prepared for presentation at the 11th Congress of the EAAE
(European Association of Agricultural Economists) on
The Future of Rural Europe in the Global Agri-Food System,
Copenhagen, Denmark: August 24-27, 2005
Copyright 2005 by authors. All rights reserved. Readers may make verbatim copies of this document for non-commercial purposes by any means, provided that this copyright notice appears on all such copies.
∗ Corresponding author. Contact address: Department of Agricultural and Food Economics, The University of Reading, Reading RG6 6AR, UK. email: [email protected]
1

An Assessment of the Potential Consumption Impacts of WHO Dietary Norms in OECD Countries
Abstract
The member countries of the World Health Organization (WHO) have recently endorsed its Global Strategy on Diet, Physical Activity and Health. The strategy emphasizes the need to limit the consumption of saturated fats and trans fatty acids, salt and sugars, and to increase consumption of fruits and vegetables in order to combat the growing burden of non-communicable diseases. Adherence to the norms recommended by the WHO would call for major changes in the consumption, production and trade of several key food products and several sectors of the food industry have expectedly raised serious concerns about the potential impact of these norms on their future growth prospects. This paper attempts a broad quantitative assessment of the consumption impacts of these norms in OECD countries using a mathematical programming approach. We find that adherence to the WHO norms would involve a significant decrease in the consumption of vegetable oils (30%), dairy products (28%), sugar (24%), animal fats (30%) and meat (pig meat, 13.5%, mutton and goat 14.5%) and a significant increase in the human consumption of cereals (31%), fruits (25%) and vegetables (21%). The paper also explains the apparent dilemma that some OECD countries face when simultaneously trying to liberalise agricultural markets and promote healthy diets.
2
An Assessment of the Potential Consumption Impacts of WHO Dietary Norms in OECD Countries
Introduction In May 2004, the member-countries of the World Health Organization (WHO) endorsed its
Global Strategy on Diet, Physical Activity and Health. The strategy document (WHO: 2004), adopted after considerable controversy and debate, calls for limiting the consumption of saturated fats and trans fatty acids, salt and sugars, and to increase consumption of fruit and vegetables in order to combat the growing burden of non-communicable diseases. The strategy is based on the report from a two year long joint WHO/FAO consultation (WHO: 2003) that reviewed the available scientific evidence on the relationship of diet, nutrition and physical activity to chronic diseases. The report concluded that a diet low in saturated fats, sugars and salt, and high in vegetables and fruits, together with regular physical activity, would have a major impact on combating the high toll of death and ill health caused by cardiovascular diseases, several forms of cancer, diabetes, obesity, osteoporosis and dental disease. Specific quantitative recommendations were made regarding desirable dietary composition. The dietary recommendations contained in the report, thus, form the basis of the WHO’s global strategy to combat these chronic diseases. The WHO also recognises that these chronic diseases are no longer just rich country problems, but are increasingly occurring in the developing world as well.
The adherence to the dietary norms envisaged by the WHO is likely to involve major changes in
the dietary and food habits for the population in almost all the countries of the world. The precise nature and magnitude of the dietary adjustments will depend on how the recommendations of the WHO/FAO are taken forward through legislative, regulatory or information measures in different countries. While enforcement of dietary norms is generally difficult, consumer choice can be influenced through fiscal measures (e.g., fat taxes), recommendations of health authorities and labelling requirements that may be put in place (e.g., labelling requirements related to sugar/fat content of processed foods). Major changes in consumption patterns are likely to have significant implications for the production and trade of food products, for the pattern of land use in agriculture and the environmental sustainability of food production. Understandably, producer associations and several sectors of the food industry have serious concerns about the potential impact of the WHO norms on their future growth prospects1. If the WHO’s global strategy entails major changes in consumption and production patterns of key food products, then clearly policies designed to promote adherence to these norms will have to take into account the impact of these norms on agricultural producers worldwide.
This paper attempts to assess the potential impact of the implementation of the WHO/FAO
norms on the consumption of certain important food products, viz, cereals, sugar, meat, dairy products and vegetable oils in OECD countries. We have chosen to focus on the impact in OECD countries, because developed countries are the ones most likely to adopt a policy and regulatory framework to promote the WHO strategy. Within the set of developed countries, a natural boundary for the scope of the intended analysis is provided by the OECD grouping. OECD countries also account for a significant proportion of world consumption for a number of key food products. In contrast, developing countries, faced with problems of malnutrition and food insecurity are less likely to enact or enforce a regulatory framework to promote adherence to WHO norms.
The paper proceeds by discussing the WHO dietary norms and their rationale. We then assess
the current status of each of the OECD countries relative to the norms, using cross-country data on
1 Some sections of the food industry have lobbied hard against the acceptance of the WHO norms and have attempted to question the scientific basis for these recommendations (see for instance the response of the sugar industry in the Guardian: 21/04/03).
3

average food consumption. Mathematical programming is subsequently applied to each country currently in violation of one or more norms, to provide a new, ‘optimised’ diet that satisfies the norms. The baseline and changed aggregate OECD consumption levels of key food products are then compared and analysed. The paper concludes by reflecting on current OECD policies pertaining to the food products analysed and how the policy framework helps or hinders potential movement towards satisfying the norms. The main contribution of this study is that it provides the first cross-country quantitative estimates of consumption changes likely to arise upon adherence to this major initiative proposed by the WHO. While the norms are being debated, there is little available by way of potential impacts. This research aims to help bridge this gap in knowledge.
WHO Dietary Intake Goals The WHO dietary recommendations for combating chronic diseases specify the share of energy
(calorie) intake that should be contributed by fats (and their various components), proteins and sugars. In addition they also prescribe certain absolute consumption levels for cholesterol, sodium chloride (salt), fruits and vegetables and dietary fibre. The range of population dietary intake goals contained in the WHO recommendations are summarised in Table-1 below. The norms recommended by the WHO have emerged after a wide-ranging consultation. However, these recommendations have led to a vigorous debate on the appropriateness of these norms for a wide range of populations in different countries and the extent to which these recommendations are based on definitive/conclusive scientific evidence.
Table-1: Ranges of Population Dietary Intake Goals Dietary factor Goals
Total fat 15-30% energy
Saturated fatty acids <10% energy
Polyunsaturated fatty acids (PUFAs) 6-10% energy
n-6 Polyunsaturated fatty acids (PUFAs) 5-8% energy
n-3 Polyunsaturated fatty acids (PUFAs) 1-2% energy
Transfatty acids <1% energy
Monosaturated fatty acids (MUFAs) By difference a
Total carbohydrate b 55-75% energy
Free sugars c <10% energy
Protein 10-15% energy
Cholesterol <300 mg/day
Sodium chloride (sodium) <5 g/day
Fruits and vegetables >= 400 g/day
Total dietary fibre From foods
Non-starch polysaccharides (NSP) a This means “total fat – (saturated fatty acids + polyunsaturated fatty acids + trans fatty acids)” b The percentage of total energy available after taking into account that consumed as protein and fat, hence the wide range. c The term “free sugars” refers to all monosaccharides and disaccharides added to foods by the manufacturer, cook or consumer, plus sugars naturally present in honey syrups and fruit juices. Source: (WHO: 2003)
4
The key recommendations relate to the share of total energy intake that should be obtained from
fat, sugars and proteins. In the case of total fat, the norms are intended to prevent obesity and unhealthy weight gain and reduce the risk of certain chronic diseases. The WHO reckons that highly active groups with diets rich in vegetables, legumes, fruits and whole grain cereals may sustain a total fat intake of up to 35% without the risk of unhealthy weight gain. The recommendations for total fat are formulated to include countries where the usual fat intake is typically above 30% as well as those where the usual intake may be very low, for example less than 15%. Total fat energy of at least 20% is consistent with good health. However, for countries where the usual fat intake is between 15% and 20% of energy, there is no direct evidence for men that raising fat intake to 20% will be beneficial. For women of reproductive age at least 20% has been recommended by the Joint WHO/FAO Expert Consultation on Fats and Oils in Human Nutrition that met in 1993. The key reasons advanced for recommendation relating to sugar intake are (1) free sugars threaten the nutrient quality of diets by providing significant energy without specific nutrients (2) free sugars contribute to the overall energy density of diets and induce higher levels of energy intake and (3) increased consumption of free sugars is associated with increased problems of oral health, especially dental caries. The WHO expert consultation report (WHO: 2003), however, acknowledges that a goal for free sugars of less than 10% of total energy is controversial.
This paper examines the impact of the norms relating to total fat, protein, sugar and fruit and
vegetable consumption. Norms related to intake of transfatty acids, saturated fats, cholesterol, salt and dietary fibre are not explicitly included in the model for the want of requisite data. But we do perform an informal check on whether the post-adjustment consumption patterns conform to the norms for consumption of saturated fats.
Data The assessment of changes in consumption across the world in response to the hypothetical
implementation of new WHO guidelines requires cross-country consumption data that are recent and consistently defined across countries. Ideally, data collected from dietary surveys, such as the National Diet and Nutrition Survey in the UK, and the National Health and Nutrition Examination Survey in the US, would form the basis of such analysis. However, such surveys are only available for a limited number of countries, and even those are subject to wide differences in definitions and data collection methodologies. Hence, we adopt FAO’s Food Balance Sheet (FBS) dataset (FAO: 2003) as the basis for this work, using the year 2000 as the base year.
The FBS dataset records the sources of supply of major foods in each country and their utilization. On the supply side, it accounts for production, imports and changes in stock during the year. On the utilization side, it records exports, livestock and feed uses, use in manufacture for food use and non-food uses and losses during storage and transportation, thereby arriving at estimates of food supplies available for human consumption (FAO: 2001). Thus, it provides estimates of ‘supplies available for per-capita consumption’ rather than registering actual household consumption itself. Its prime advantages from the point of view of this study are its international coverage, its consistency of definitions, categories and data across countries, and its ready availability. There is simply no other dataset that provides the cross-country features necessary for the scope of this study. In addition to food balances itself, the FBS also provides estimates of per capita calorie, fat and protein intake deriving from each food category, which are used to compute the conversion coefficients of our model.
However, the use of FBS data presents a number of drawbacks that should be acknowledged. The FBS dataset does not present consumption levels of processed food products themselves. Instead, it presents information on the basis of a limited set of ‘primary equivalents’ in order to keep the database to a limited size (FAO: 2001). For example, bread is converted into wheat equivalent in the
5
database made available to the public. Although total energy, fat and protein contents are computed from the original processed commodities and aggregated and presented alongside primary equivalents, information on saturated and unsaturated components of fat, or cholesterol and salt intakes is not presented. This prevents us from introducing all the nutritional guidelines in our model. Another major disadvantage in using the FBS dataset for our exercise is that food supplies available for per-capita consumption do not always reflect actual consumption accurately. For example, household waste and spoilage is not accounted for in these data, and the nutrient calculations do not take account of the transformation of nutrient composition during the process of cooking. In addition, the FBS data only present an average picture, not capturing the heterogeneity inherent in diets within a country. As discussed in the methodology section, when we extrapolate from these average figures for a country to the entire country, some inaccuracies can arise. For instance, using the average per capita food supplies in a country one may find that a dietary norm is not violated, and proceed to apply this result for the entire country. However, it may well be that certain sections of the population (for example, people in certain income groups or belonging to a certain ethnic classes) have diets that violate the norms, but this is not reflected when extrapolations are made from the average.
In spite of these drawbacks, it is our opinion that the FBS data do provide a good basis for an
international comparison. It has been put to such use previously by the FAO (FAO: 1994) and WHO (WHO: 2003) as well as academic research (Guo et al: 2000).
Methodology Overview We start by calculating the current nutritional status in each country relative to the proposed
WHO norms. In countries where the current consumption of fat, proteins or sugar exceeds the recommended norm, we estimate the dietary changes required to adhere to these norms. The WHO norms are expressed in terms of the nutrient and energy contents of diets and do not impose restrictions on the consumption of individual food items. Energy and nutrients are derived from a large number of food products and, therefore, a large number of diets that conform to the norms are theoretically possible. We use a mathematical programming approach to predict the changes in consumption of selected food products most likely to occur if consumers were to adhere to the WHO/FAO norms. Given the persistence of dietary patterns and preferences, our analysis will assume that in adjusting their consumption of food products to adhere to these norms, consumers will prefer to modify their current diet as little as possible. Estimating reformulations of diets in response to nutritional constraints, therefore, requires the construction of a model.
Linear programming (LP) has a long history in the analysis of human diets. In fact, diet optimization was one of the early uses to which linear programming techniques were applied, when the US Army attempted to formulate diets that would meet nutritional requirements of GIs at minimum cost. The classical diet LP problem has typically involved minimization of costs while meeting specific nutritional requirements. Since first being analyzed by Stigler (1945), such models have been constructed for several countries and diet optimization problems (e.g., Smith: 1959; Henson: 1991). Alternatives to LP techniques include multiple-objective programming and goal programming, where several considerations relating to diets are optimized simultaneously.
Another approach is that of quadratic programming (QP), where deviations from actual
consumption levels are minimised while satisfying nutritional considerations. This approach is based on the paradigm that consumer preference and palatability considerations are manifested in the observed food choice. Radical changes from the observed choices are unrealistic, and hence deviations from the original diet are made as small as possible when estimating the new diet that meets the nutritional constraints. QP and LP have been used both in conjunction with price/cost constraints, as well as without. For example, the USDA’s Thrifty Food Plan, a fundamental part of the US food guidance system, has been based on QP routines since 1975. The constraints and data include price information, and are periodically updated. A parallel literature has emerged that uses QP or LP
6

methods, but abstracts from price/cost considerations, primarily due to unavailability of suitable data. For example, Gedrich, et al. (1999) use QP to optimize diets based on information from the Bavarian Food Intake Survey. Darmon et al. (2002) use LP without price information in optimizing the nutrient density of diets in Malawi.
QP is the technique used in this study because of its intuitive appeal, described above, and its limited data requirements. In particular, the lack of availability of detailed cross-country information on food prices ruled out model specifications based on diet costs. Whilst recent food price data are readily available for a few countries, such as the USA and the UK, they are far more difficult to obtain for many other countries under consideration. Certainly, there are no datasets that provide detailed, comparably collected price information for individual foodstuffs for the entire set of OECD countries. An additional problem would arise in using price information, even if it were available. The FAO data are expressed in the form of constituent elements, such as wheat, instead of as consumed food products carrying relevant prices, such as pasta. Thus the cross-country comparisons made possible by the use of the FAOSTAT data incur the unavoidable penalty of abstraction from prices. However, there is some comfort to be taken in knowing that, since the new diet is chosen to deviate minimally from observed diets, the cost of the new diet is unlikely to stray radically from the observed one.
The first part of our QP model can be formally described as below:
∑∑∈
∈
=
−
Fiii
iii
Fi i
ii
x xexe
xxx
Min i
'i
αα where, 2'
(1)
The objective function (1) is simply the weighted sum of squared deviations between the components of the optimized diet xi’ and the observed one xi. Deviations are expressed in percentage terms. This prevents an unnatural situation where items that are consumed in relatively small amounts at the baseline expand or contract in large percentage terms when the diet is reformulated. The weights αi are the contributions of the food products to the original total energy intake, which are easily computed from the calorific coefficients ei for each food item2. This objective function is minimized over the whole set F of food items originally consumed in the country subject to several nutritional constraints. Two constraints simply state, in accordance with the WHO norms, that energy from fat and protein should not exceed 30% and 15% of total calorific intake respectively:
9 ∑∑
∈∈
≤Fi
iiFi
ii xexf '' 3.0 (2)
4 ∑∑∈∈
≤Fi
iiFi
ii xexp '' 15.0 (3)
where fi and pi denote the conversion coefficients of food item i into fat and protein. The third constraint restricts energy intake from sugar to a maximum of 10% of total energy intake:
∑∑∈∈
≤Fi
iiSi
ii xexe '' 1.0 (4)
where S is the subset of F corresponding to sugar (centrifugal as well as non-centrifugal) as well as other sweeteners. The fourth constraint imposes a minimum daily per capita consumption of 400 grams of fruits and vegetables:
2 In what follows, all quantities are expressed in grams per capita per day and energetic values are expressed in kcal.
7

∑∈
≤Vi
ix '400 (5)
where V is the subset of food items that are either fruits or vegetables. Finally, we add two constraints which are not formally part of the WHO guidelines:
(6) ∑∑
∈∈
≤Fi
iiFi
ii xexe '
(7) ii xxAi ≤∈∀ ' ,where A denotes the subset of F corresponding to alcoholic beverages. Constraint (7) is included in order to prevent the obviously undesirable new diet outcomes that may emerge if alcoholic beverages were allowed to freely expand within new diets. Such expansion is particularly likely if alcoholic items are unconstrained, since they typically are a source of calories with relatively modest fat content. Constraint (6) simply restricts total energy in the optimized diet to be no less than in the original diet so that the simulated changes in the diet can be solely attributed to the imposition of the WHO guidelines. In the absence of this constraint, i.e. if calorific reductions were allowed, it would become harder to attribute changes in diets solely to the guidelines. Additionally, changed diet scenarios involving significant reductions in energy intake are also unrealistic.
The model is applied to average food consumption data aggregated at the national level. Thus, the approach only simulates changes in dietary patterns due to WHO norms for those countries that are currently violating at least one of the nutritional constraints, on average. However, if there are large groups within countries whose intake is considerably higher than the average, the estimates of changes in consumption required, based on average intakes, could be biased downward. Using consumption data for the United Kingdom for different income groups, we will assess whether this downward bias is likely to be significant.
It must also be noted that even in countries that are currently in conformity with the norms on
average, there may be large sections of the population whose consumption patterns are not in conformity with the recommended norms. Our study does not attempt to estimate the adjustment in consumption required by these sections of the population in “conforming” countries. However, the “double burden of malnutrition” in developing countries, where malnutrition co-exists with excess consumption of nutrients and resulting obesity is now recognised in the literature (Gillespie and Haddad: 2003).
Finally, it should also be acknowledged that some sub-guidelines included in the FAO report are not explicitly included in our optimization model. The most important among these is the requirement that saturated fats provide no more than 10% of total energy intake. Here again, the primary reason for this omission is data non-availability, as discussed in the previous section. Nevertheless, it is recognized here that the saturated fat guideline is an important one. Hence, although an explicit constraint is not included in the QP model for saturated fat, we perform ex-post checks for estimated saturated fat content of the revised diets produced by the QP model as detailed in the next section3.
3 We are grateful for the comments of the referee on issues relating to the data. The referee has suggested that “the implications of the limitations due to the data (primary equivalents, saturated fat, waste and spoilage, within country heterogeneity) should be explored at least for one or two countries for which detailed data are available (USA and the UK for example). This would allow a more complete estimation of the bias due to the use of aggregate data than what has already been done at the end of the paper.” In our subsequent work, we have attempted to carry out the analysis using disaggregated demographic data for US, UK and France and including the WHO norms that were omitted in this analysis.
8
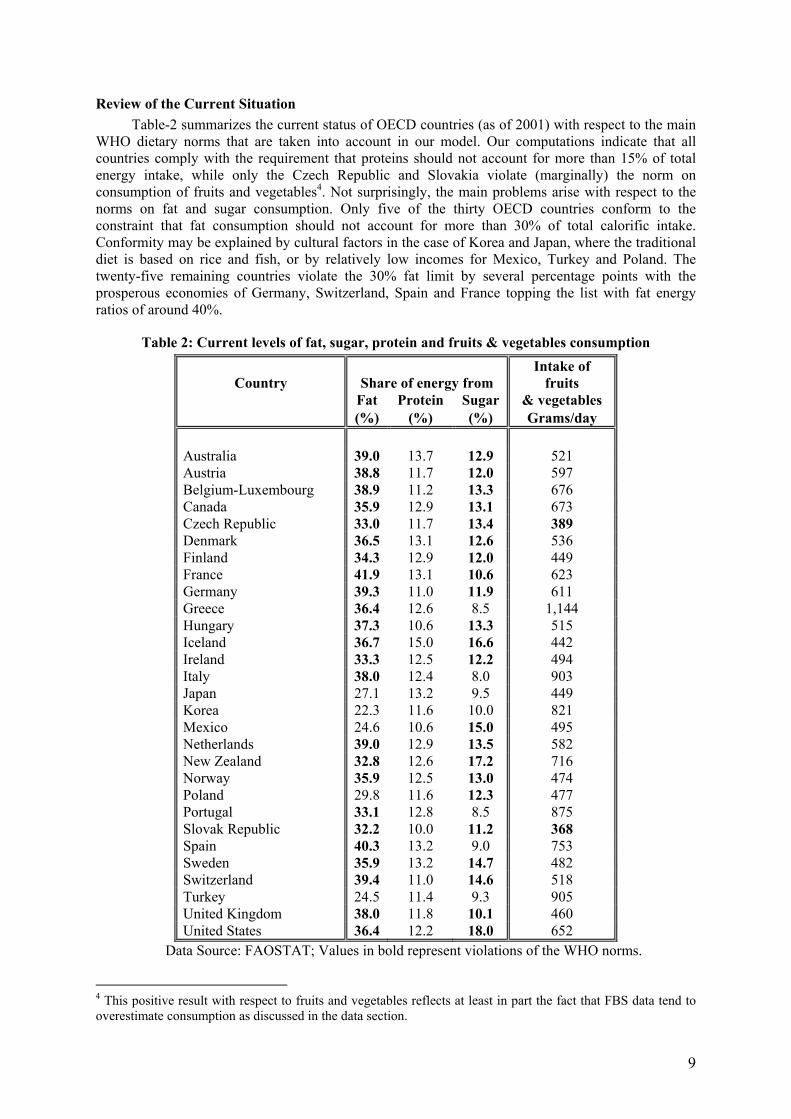
Review of the Current Situation Table-2 summarizes the current status of OECD countries (as of 2001) with respect to the main
WHO dietary norms that are taken into account in our model. Our computations indicate that all countries comply with the requirement that proteins should not account for more than 15% of total energy intake, while only the Czech Republic and Slovakia violate (marginally) the norm on consumption of fruits and vegetables4. Not surprisingly, the main problems arise with respect to the norms on fat and sugar consumption. Only five of the thirty OECD countries conform to the constraint that fat consumption should not account for more than 30% of total calorific intake. Conformity may be explained by cultural factors in the case of Korea and Japan, where the traditional diet is based on rice and fish, or by relatively low incomes for Mexico, Turkey and Poland. The twenty-five remaining countries violate the 30% fat limit by several percentage points with the prosperous economies of Germany, Switzerland, Spain and France topping the list with fat energy ratios of around 40%.
Table 2: Current levels of fat, sugar, protein and fruits & vegetables consumption
Country Share of energy from Intake of
fruits Fat Protein Sugar & vegetables (%) (%) (%) Grams/day
Australia 39.0 13.7 12.9 521 Austria 38.8 11.7 12.0 597 Belgium-Luxembourg 38.9 11.2 13.3 676 Canada 35.9 12.9 13.1 673 Czech Republic 33.0 11.7 13.4 389 Denmark 36.5 13.1 12.6 536 Finland 34.3 12.9 12.0 449 France 41.9 13.1 10.6 623 Germany 39.3 11.0 11.9 611 Greece 36.4 12.6 8.5 1,144 Hungary 37.3 10.6 13.3 515 Iceland 36.7 15.0 16.6 442 Ireland 33.3 12.5 12.2 494 Italy 38.0 12.4 8.0 903 Japan 27.1 13.2 9.5 449 Korea 22.3 11.6 10.0 821 Mexico 24.6 10.6 15.0 495 Netherlands 39.0 12.9 13.5 582 New Zealand 32.8 12.6 17.2 716 Norway 35.9 12.5 13.0 474 Poland 29.8 11.6 12.3 477 Portugal 33.1 12.8 8.5 875 Slovak Republic 32.2 10.0 11.2 368 Spain 40.3 13.2 9.0 753 Sweden 35.9 13.2 14.7 482 Switzerland 39.4 11.0 14.6 518 Turkey 24.5 11.4 9.3 905 United Kingdom 38.0 11.8 10.1 460 United States 36.4 12.2 18.0 652
Data Source: FAOSTAT; Values in bold represent violations of the WHO norms.
4 This positive result with respect to fruits and vegetables reflects at least in part the fact that FBS data tend to overestimate consumption as discussed in the data section.
9

Further examination of Table 2 reveals that twenty-three OECD countries also exceed the WHO norm for calorie intake for sugar and sweeteners. The worst violations are observed for countries such as New Zealand and the United States, while the conforming countries consist of Italy, Portugal, Greece, Spain, Turkey, Japan and Korea. Hence, as was the case for fat consumption, cultural factors are clearly important in explaining sugar consumption with only East Asian and Mediterranean countries conforming to the norm. However, the effect of income seems less relevant here with relatively low-income countries such as Mexico presenting high sugar energy ratios.
Altogether, only Japan, Korea and Turkey do not violate any of the four norms. The values reported in Table-2 also suggest that in the remaining twenty-seven OECD countries, the adjustments in consumption necessary to adhere to the WHO norms might be substantial. These are simulated in the next section. The model was run for each country individually, but the results are presented in aggregate.
Results
Sugar and Sweeteners Considering that 23 out of the 30 OECD countries presently violate the sugar consumption
norms, it is not surprising that our model requires a substantial reduction in sugar consumption (Figure 1). The total consumption of sugar and sweeteners5 is seen to decline by 12.4 million tons, a reduction of 30% over the current consumption. Note that the percentage reductions referred to here are relative to the baseline consumption in the 30 OECD countries, not relative to world consumption. The reduction in sugar consumption (raw equivalent) is 7.4 million tons (a decline of 20%) while the reduction in consumption of “other sweeteners” is 5 million tons (a decline of 33.3%). In the case of sugar, just two countries account for 73% of the total decline in consumption – the US contributing 54% and Mexico 19%. The other countries which make a significant contribution to the decline in sugar consumption are Germany (5.5%), Canada (4.4%) and Poland (4.1%). For “other sweeteners”, the US alone accounts for 93% of the total decline with the remaining 29 OECD countries accounting for just 7%. These figures are the consequence of the very high current consumption levels of sugar in US and Mexico.
0
5000
10000
15000
20000
25000
30000
35000
40000
Sugar (Raw Equivalent) Sweeteners, Other
Thou
sand
s of
met
ric to
ns
Initial Consumption Final consumption
Figure 1: Changes in Consumption of Sugar and Sweeteners
5 The changes in the consumption of non-centrifuged sugar and honey, which are included under “sugar and sweeteners” in the FAO food balance sheets are excluded from this analysis as their total consumption in OECD countries is very small.
10
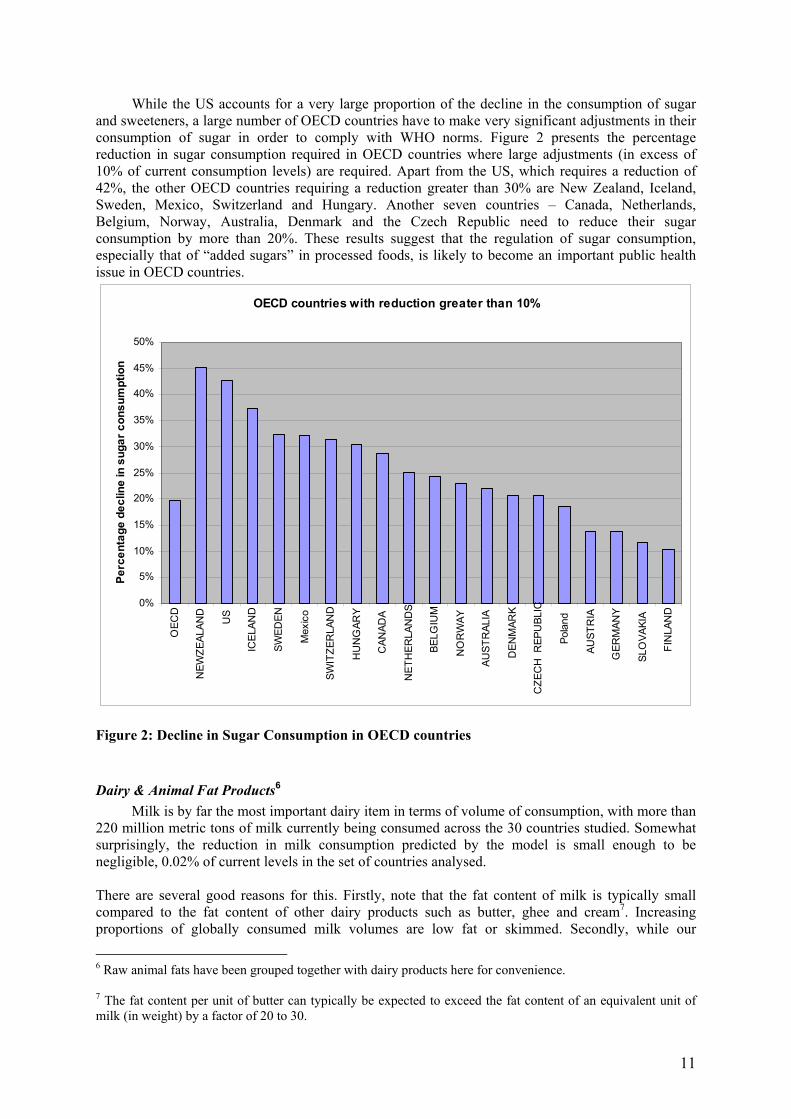
While the US accounts for a very large proportion of the decline in the consumption of sugar and sweeteners, a large number of OECD countries have to make very significant adjustments in their consumption of sugar in order to comply with WHO norms. Figure 2 presents the percentage reduction in sugar consumption required in OECD countries where large adjustments (in excess of 10% of current consumption levels) are required. Apart from the US, which requires a reduction of 42%, the other OECD countries requiring a reduction greater than 30% are New Zealand, Iceland, Sweden, Mexico, Switzerland and Hungary. Another seven countries – Canada, Netherlands, Belgium, Norway, Australia, Denmark and the Czech Republic need to reduce their sugar consumption by more than 20%. These results suggest that the regulation of sugar consumption, especially that of “added sugars” in processed foods, is likely to become an important public health issue in OECD countries.
OECD countries with reduction greater than 10%
0%
5%
10%
15%
20%
25%
30%
35%
40%
45%
50%
OEC
D
NEW
ZEAL
AND
US
ICEL
AND
SWED
EN
Mex
ico
SWIT
ZER
LAN
D
HU
NG
ARY
CAN
ADA
NET
HER
LAN
DS
BELG
IUM
NO
RW
AY
AUST
RAL
IA
DEN
MAR
K
CZE
CH
REP
UBL
IC
Pola
nd
AUST
RIA
GER
MAN
Y
SLO
VAKI
A
FIN
LAN
D
Perc
enta
ge d
eclin
e in
sug
ar c
onsu
mpt
ion
Figure 2: Decline in Sugar Consumption in OECD countries
Dairy & Animal Fat Products6 Milk is by far the most important dairy item in terms of volume of consumption, with more than
220 million metric tons of milk currently being consumed across the 30 countries studied. Somewhat surprisingly, the reduction in milk consumption predicted by the model is small enough to be negligible, 0.02% of current levels in the set of countries analysed. There are several good reasons for this. Firstly, note that the fat content of milk is typically small compared to the fat content of other dairy products such as butter, ghee and cream7. Increasing proportions of globally consumed milk volumes are low fat or skimmed. Secondly, while our
6 Raw animal fats have been grouped together with dairy products here for convenience. 7 The fat content per unit of butter can typically be expected to exceed the fat content of an equivalent unit of milk (in weight) by a factor of 20 to 30.
11

modelling predicts significant consumption reductions for some large consumers of milk, such as France and Italy (consumption reductions of 1.2 million tons each), it also predicts increases in milk consumption in some countries such as USA (3 million tons), Mexico (0.6 million tons) and Germany. Thirdly, note that our estimates refer only to the consumption of milk itself, and not products based on milk. If other dairy products were converted into their milk equivalents, the impacts on milk would be more pronounced. However, we analyse other dairy products separately from milk in this paper.
0
500
1000
1500
2000
2500
3000
3500
4000
4500
5000
Butter, Ghee Cream Fats, Animals, Raw
Thou
sand
s of
met
ric to
ns
Initial Consumption Final Consumption
Figure 3: Changes in Consumption of Dairy Products and Animal Fats
The aggregate consumption impact on dairy products and animal fats is summarised in Figure
3. Total consumption of raw animal fats is seen to decline considerably, by some 1.2 million tons, or about 28% of current consumption in the countries analysed. This volumetric decline is large particularly considering that two of the largest animal fat consumers, India and China, are non-OECD countries unaffected by the WHO norms. The country-wise break-up is shown in Figure 4 below. Almost a third of the predicted reduction comes from the consumption adjustment of another very large consumer of animal fats, the USA, while Germany and the US together account for almost half of the predicted reduction.
Total reduction : 1.2 million tons
GERMANY17%
FRANCE9%
US33%
OTHERS24%
UK5%
CANADA6% ITALY
6%
Figure 4: Reduction in Consumption of Animal Fats
12

Consumption of dairy products apart from milk (butter, ghee and cream aggregated together) is
seen to decline in the 30 countries by 1.42 million tons. The decline in butter & ghee consumption is more pronounced at 30% than that for cream, at 25%. As in the case of animal fats, half of this reduction derives from only two large consumers, in this case, France and Germany (Figure 5). This significant decline computed for butter, ghee and animal fat volumes is in spite of some of the largest consumers in the world not being affected by the WHO norms – for example, India accounts for almost 2 million tons, more than 30% of total world consumption.
Total reduction: 1.42 million tons
GERMANY25%
FRANCE24%US
14%
ITALY7%
CANADA5%
UK5%
OTHERS20%
Figure 5: Reduction in Consumption of Dairy Products
Meats About 90 million tons of meat were consumed across these countries in the year 2000. Pig meat
was the largest constituent, at 34 million tons of consumption, while poultry and bovine meats were almost as important, at 30 and 25 million tons each. Mutton, goat and other meats were relatively minor, making up the remaining 4 million tons. Our modelling revealed an asymmetric consumption change across these categories, however (Figure 6 below). Pig meat consumption registered a significant drop in response to adherence to the WHO norms, declining by a little less than 5 million tons, or 13.5%. Mutton and goat similarly declined by about 14.5% of their original, relatively modest levels. However, there was only a small effect on poultry consumption, with consumption shrinking by 646,000 tons, or 1.7% of the original intake in the 30 countries. Surprisingly, meat from bovine sources was predicted to increase in consumption by 1.05 million tons.
This seemingly curious result is explained by the fact that the fat content per (weight) unit of bovine meats, is on average, significantly lower than that for pig meat. Thus, although certain individual items under bovine meat may contain high levels of fat, the average of all the consumed bovine meat items has lower total fat content than the average for pig meat and mutton/goat items. Since meats are substitutes for each other, and are all significant providers of total energy and protein, the model predicts that many countries attempting to adhere to the WHO norms would substitute lower fat meats for higher fat meats in their diets. To take one example, our model predicts that Australia’s pig meat consumption would contract by 84,000 tons, while its bovine meat consumption would expand by 8,000 tons
13

Meat Consumption
0
5000
10000
15000
20000
25000
30000
35000
40000
Bovine Meat Mutton & GoatMeat
Pigmeat Poultry Meat Meat, Other
Thou
sand
s of
met
ric to
ns
Initial consumption Final consumption
Figure 6: Changes in Consumption of Meats in OECD Countries
We now restrict our attention to the meat products that are predicted to experience reduced
consumption, i.e., pig, poultry and mutton/goat meat, and consider them in an aggregated fashion. The total reduction in the consumption of these meats is about 5.2 million tons. The US, France and Germany account for half of this reduction (Figure 7), while Spain and the UK also experience significant declines. If the total reduction in meat consumption volumes appears more modest than expected, it is primarily due to the absence of China from the countries taken to be affected by the WHO norms. China alone consumes 41 million tons of pig meat a year, which is a little less than half of world consumption. It also accounts for almost a tenth of world bovine meat consumption and a fifth of poultry consumption.
Total reduction: 5.2 million tons
US23%
FRANCE16%
GERMANY13%
SPAIN11%
UK9%
ITALY8%
OTHERS20%
Figure 7: Reduction in Mutton, Pig and Poultry Meat Consumption in OECD Countries
14

Vegetable Oils Since oils are relatively high in fat content and are consumed in significant quantities across the
world, significant reductions of oil consumption in response to adherence to WHO norms might be expected. Although the saturated fat content of various oils can differ significantly (with Palm and Coconut Oils at the top of the saturated fat content list), the total fat composition per unit varies much less across various vegetable oils. Accordingly, our model predicts significant and fairly even reduction (in percentage terms) of vegetable oils across the board. As illustrated in Figure 8, all vegetable oil categories are forecast to experience a drop in consumption of 20 to 35% for the set of countries analysed.
Vegetable Oil Consumpton
0.00
2000.00
4000.00
6000.00
8000.00
10000.00
12000.00
Soya
bean
Oil
Gro
undn
ut O
il
Sunf
low
erse
ed O
il
Rap
e an
d M
usta
rd O
il
Cot
tons
eed
Oil
Palm
kern
el O
il
Palm
Oil
Coc
onut
Oil
Sesa
mes
eed
Oil
Oliv
e O
il
Ric
ebra
n O
il
Mai
ze G
erm
Oil
Oilc
rops
Oil,
Oth
er
Thou
sand
s of
met
ric to
ns
Initial Consumption Final Consumption
Figure 8: Changes in Consumption of Vegetable Oils in OECD Countries Soybean oil is the most consumed vegetable oil in the set of countries analysed and its current
consumption of 9.7 million tons in the 30 countries is predicted to contract to 7 million tons. Of this 2.7 million tonne reduction in global soybean oil consumption, 2.1 million tons would come from the US alone. Other prominent oils in this set of countries are sunflower oil, olive oil and rape/mustard oil. These oils are commonly consumed in the EU, and the source of the reduction in their consumption is therefore also mostly the EU. Rape/Mustard oil consumption is predicted to shrink globally by 949,000 tons, while sunflower and olive oils contract by 706,000 and 628,000 tons respectively. Some oils such as palm and coconut oils are primarily consumed in the developing world. With the majority of developing countries not being part of the 30 countries above the WHO food energy ratio norm, palm and coconut oils appear only as a minor item in the consumption analysis here. Their baseline consumption in the 35 countries is low, and although their percentage
15
reduction compared to baseline is similar to the other oils, it is a relatively small reduction in volumetric terms (219,000 tons for palm oil and 94,000 tons for coconut oil).
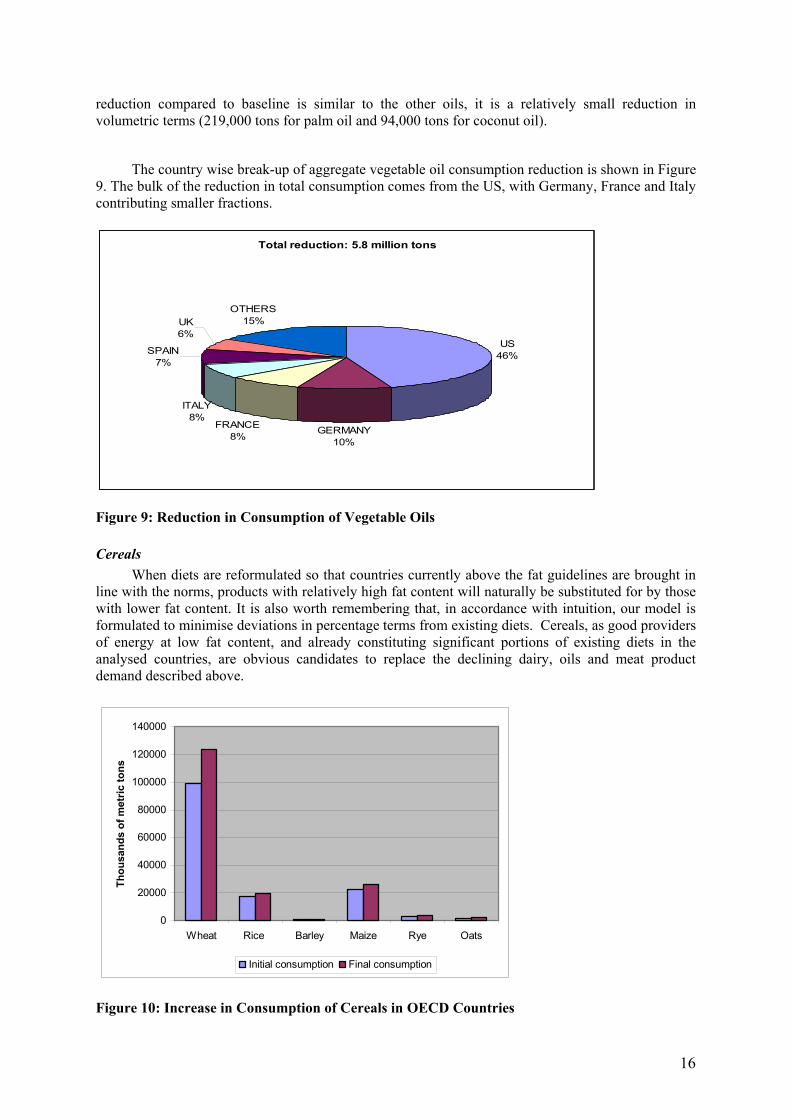
The country wise break-up of aggregate vegetable oil consumption reduction is shown in Figure
9. The bulk of the reduction in total consumption comes from the US, with Germany, France and Italy contributing smaller fractions.
Total reduction: 5.8 million tons
US46%
GERMANY10%
FRANCE8%
ITALY8%
SPAIN7%
UK6%
OTHERS15%
Figure 9: Reduction in Consumption of Vegetable Oils
Cereals When diets are reformulated so that countries currently above the fat guidelines are brought in
line with the norms, products with relatively high fat content will naturally be substituted for by those with lower fat content. It is also worth remembering that, in accordance with intuition, our model is formulated to minimise deviations in percentage terms from existing diets. Cereals, as good providers of energy at low fat content, and already constituting significant portions of existing diets in the analysed countries, are obvious candidates to replace the declining dairy, oils and meat product demand described above.
0
20000
40000
60000
80000
100000
120000
140000
Wheat Rice Barley Maize Rye Oats
Thou
sand
s of
met
ric to
ns
Initial consumption Final consumption
Figure 10: Increase in Consumption of Cereals in OECD Countries
16
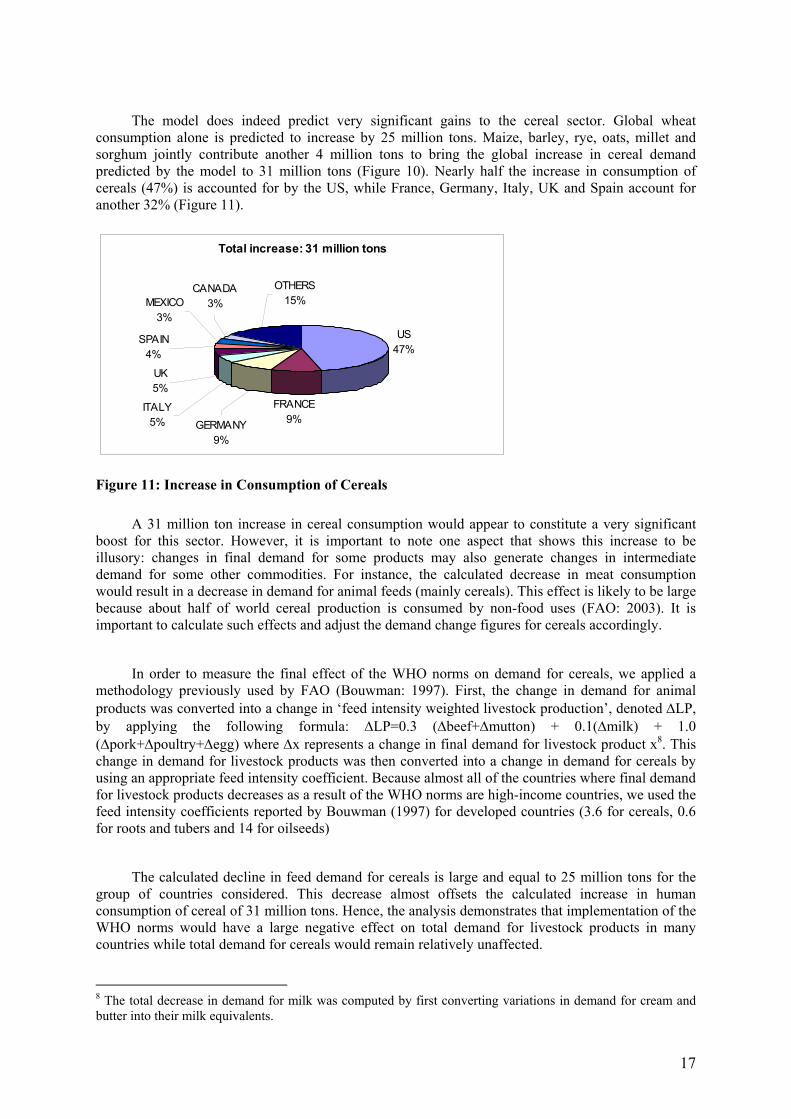
The model does indeed predict very significant gains to the cereal sector. Global wheat
consumption alone is predicted to increase by 25 million tons. Maize, barley, rye, oats, millet and sorghum jointly contribute another 4 million tons to bring the global increase in cereal demand predicted by the model to 31 million tons (Figure 10). Nearly half the increase in consumption of cereals (47%) is accounted for by the US, while France, Germany, Italy, UK and Spain account for another 32% (Figure 11).
Total increase: 31 million tons
US47%
MEXICO3%
SPAIN4%
CANADA3%
OTHERS15%
UK5%
ITALY5% GERMANY
9%
FRANCE9%
Figure 11: Increase in Consumption of Cereals
A 31 million ton increase in cereal consumption would appear to constitute a very significant boost for this sector. However, it is important to note one aspect that shows this increase to be illusory: changes in final demand for some products may also generate changes in intermediate demand for some other commodities. For instance, the calculated decrease in meat consumption would result in a decrease in demand for animal feeds (mainly cereals). This effect is likely to be large because about half of world cereal production is consumed by non-food uses (FAO: 2003). It is important to calculate such effects and adjust the demand change figures for cereals accordingly.
In order to measure the final effect of the WHO norms on demand for cereals, we applied a
methodology previously used by FAO (Bouwman: 1997). First, the change in demand for animal products was converted into a change in ‘feed intensity weighted livestock production’, denoted ∆LP, by applying the following formula: ∆LP=0.3 (∆beef+∆mutton) + 0.1(∆milk) + 1.0 (∆pork+∆poultry+∆egg) where ∆x represents a change in final demand for livestock product x8. This change in demand for livestock products was then converted into a change in demand for cereals by using an appropriate feed intensity coefficient. Because almost all of the countries where final demand for livestock products decreases as a result of the WHO norms are high-income countries, we used the feed intensity coefficients reported by Bouwman (1997) for developed countries (3.6 for cereals, 0.6 for roots and tubers and 14 for oilseeds)
The calculated decline in feed demand for cereals is large and equal to 25 million tons for the
group of countries considered. This decrease almost offsets the calculated increase in human consumption of cereal of 31 million tons. Hence, the analysis demonstrates that implementation of the WHO norms would have a large negative effect on total demand for livestock products in many countries while total demand for cereals would remain relatively unaffected.
8 The total decrease in demand for milk was computed by first converting variations in demand for cream and butter into their milk equivalents.
17
A similar quantitative exercise was carried out for roots & tubers as well as oilseeds. It revealed
that the ‘feed effects’ of the WHO norms were relatively small for these products and we therefore choose not to report them.
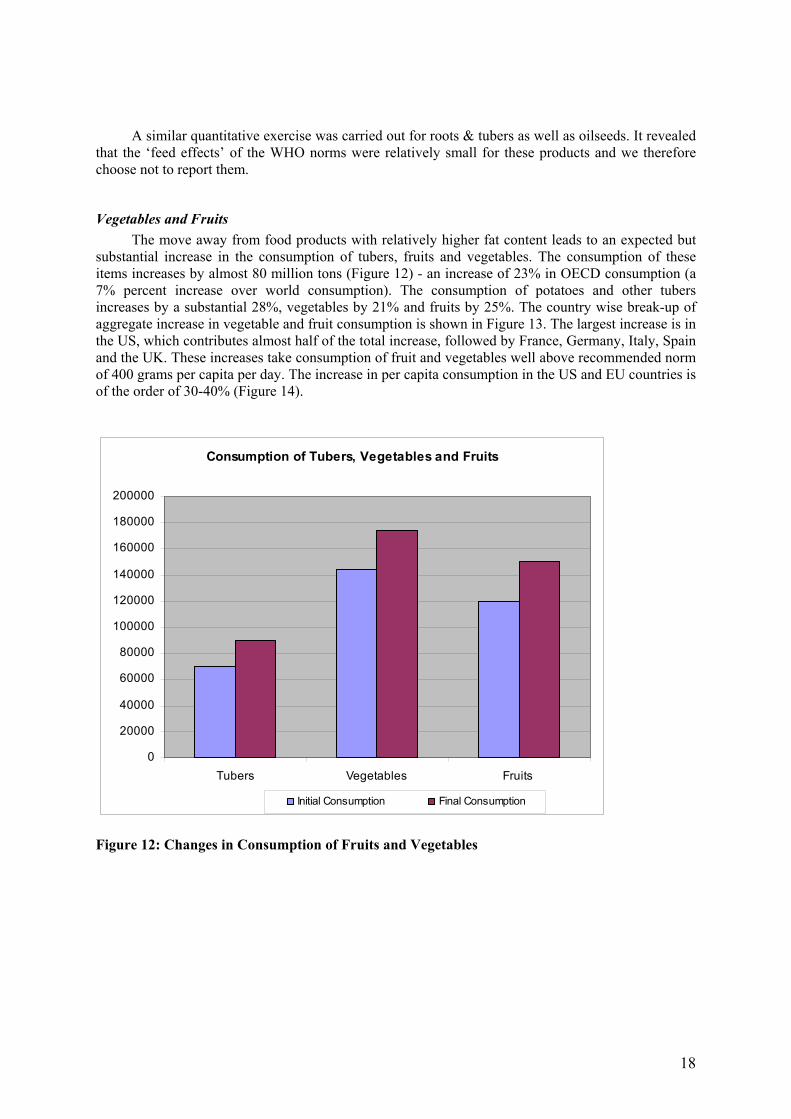
Vegetables and Fruits The move away from food products with relatively higher fat content leads to an expected but
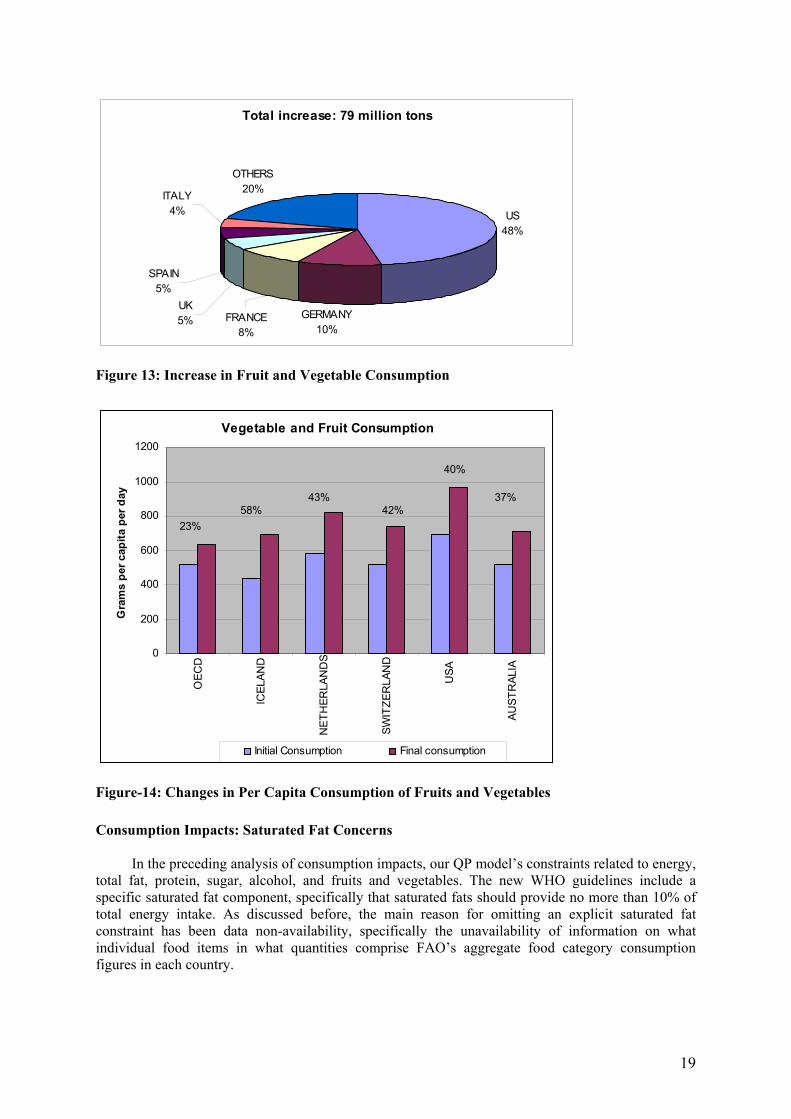
substantial increase in the consumption of tubers, fruits and vegetables. The consumption of these items increases by almost 80 million tons (Figure 12) - an increase of 23% in OECD consumption (a 7% percent increase over world consumption). The consumption of potatoes and other tubers increases by a substantial 28%, vegetables by 21% and fruits by 25%. The country wise break-up of aggregate increase in vegetable and fruit consumption is shown in Figure 13. The largest increase is in the US, which contributes almost half of the total increase, followed by France, Germany, Italy, Spain and the UK. These increases take consumption of fruit and vegetables well above recommended norm of 400 grams per capita per day. The increase in per capita consumption in the US and EU countries is of the order of 30-40% (Figure 14).
Consumption of Tubers, Vegetables and Fruits
0
20000
40000
60000
80000
100000
120000
140000
160000
180000
200000
Tubers Vegetables Fruits
Initial Consumption Final Consumption
Figure 12: Changes in Consumption of Fruits and Vegetables
18
Total increase: 79 million tons
US48%
GERMANY10%
OTHERS 20%ITALY
4%
SPAIN5%
UK5% FRANCE
8%
Figure 13: Increase in Fruit and Vegetable Consumption
Vegetable and Fruit Consumption
0
200
400
600
800
1000
1200
OEC
D
ICEL
AND
NET
HER
LAN
DS
SWIT
ZER
LAN
D
USA
AUST
RAL
IA
Gra
ms
per c
apita
per
day
Initial Consumption Final consumption
23%58%
43%42%
40%
37%
Figure-14: Changes in Per Capita Consumption of Fruits and Vegetables Consumption Impacts: Saturated Fat Concerns
In the preceding analysis of consumption impacts, our QP model’s constraints related to energy, total fat, protein, sugar, alcohol, and fruits and vegetables. The new WHO guidelines include a specific saturated fat component, specifically that saturated fats should provide no more than 10% of total energy intake. As discussed before, the main reason for omitting an explicit saturated fat constraint has been data non-availability, specifically the unavailability of information on what individual food items in what quantities comprise FAO’s aggregate food category consumption figures in each country.
19
Without the disaggregated data, it is impossible to ascribe saturated fat estimates for inclusion in the model. However, in recognition of the importance of the saturated fat constraint, we do an ex-post, informal check of approximate saturated fat composition of the reformulated diets produced by the model. This is achieved by matching each FBS food category with a representative food item in USDA’s nutrition database (USDA: 2003), and using the saturated fat levels given by the latter. Obviously, the reliability of this method is far better when there are not too many items that fit under a particular aggregate category. For instance, the category of eggs has limited variants, but a category such as bovine meat involves numerous constituents.
Using these proxy saturated fat numbers, we calculated the saturated fat to energy ratios for the
reformulated diets of 5 countries with relative fat-intensive diets. The results were as follows: France: 9%, US: 9%, UK: 10%, Spain 8%, Germany, 10%. Thus, there is at least weak evidence available to suggest that the reformulated diets estimated by our QP models for each country do broadly meet the WHO saturated fat constraints.
Consumption Impacts: Distributional Concerns
One remaining concern is that we are using population average dietary figures to make extrapolations to changes in aggregate consumption, production and trade in countries. Where these mean figures disguise substantial variation within the population, there is scope for extrapolations from the mean to be misleading. For instance, the average household in a certain country may have a diet that already conforms to the WHO guidelines. If we extrapolate from this average household to the entire country, we would conclude that no consumption changes need take place in that country in response to WHO guidelines. However, households in lower or higher income categories (the tails of the distribution) may indeed have diets that do not conform to the guidelines. Extrapolations from the mean would miss out the needed consumption changes for these households.
This issue cannot be tackled without detailed dietary survey data for each country, broken down
into various categories. This is simply not available on an international basis, and thus this concern cannot be tackled here. We did check survey results from one country for which such detailed results are indeed available: the UK. Results from the National Food Survey 2000, documents from which are archived at the UK Department of Environment, Food and Rural Affairs website, show that there is little evidence to indicate that the fat composition of diets varies by income groups in the UK. Thus, although there is little we can do about addressing these distributional issues here, they may equally not be a significant concern for many countries.
WHO guidelines and agricultural policy in OECD countries
Although government intervention in agricultural markets remains extensive in OECD countries, agricultural policies have changed over the last two decades. Some of the key characteristics of this evolution correspond to a general, albeit limited, liberalisation of agricultural markets and a shift from market support measures, that make consumers bear the bulk of the cost of supporting agricultural producers, towards decoupled policy instruments that entail direct transfers from taxpayers to producers. However, agricultural goods are not taxed equally, nor have they been affected by recent policy reforms in a uniform manner. Consequently, recent policy changes have influenced relative prices of food commodities and, as a result, modified the composition of food consumption in OECD countries. In light of our simulation results, we now ask what contribution (positive or negative) the recent evolution of agricultural policies in OECD countries has made towards the achievement of the WHO dietary norms. In other words, have policy changes been conducive to a shift away from the consumption of meats, vegetable oils and dairy products and towards the consumption of cereals, fruits and vegetables? And is the broad aim of liberalisation of agricultural markets consistent with the achievement of healthy consumption patterns in OECD countries?
20
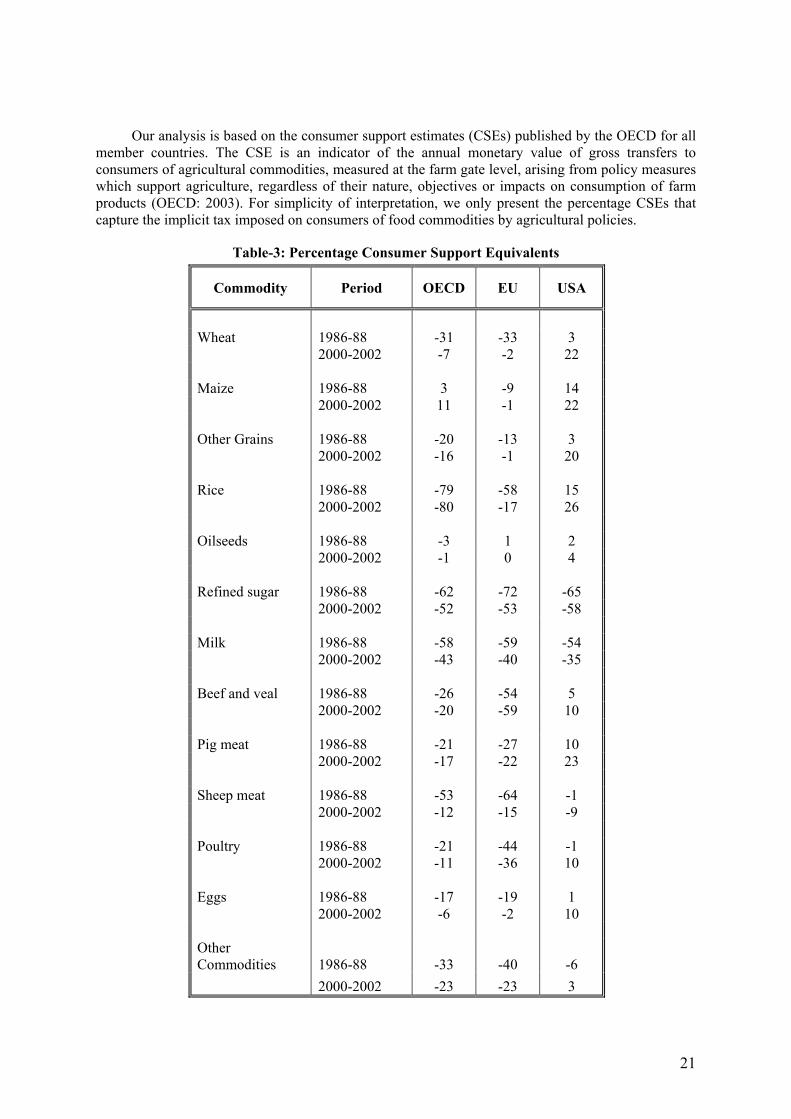
Our analysis is based on the consumer support estimates (CSEs) published by the OECD for all
member countries. The CSE is an indicator of the annual monetary value of gross transfers to consumers of agricultural commodities, measured at the farm gate level, arising from policy measures which support agriculture, regardless of their nature, objectives or impacts on consumption of farm products (OECD: 2003). For simplicity of interpretation, we only present the percentage CSEs that capture the implicit tax imposed on consumers of food commodities by agricultural policies.
Table-3: Percentage Consumer Support Equivalents
Commodity Period OECD EU USA
Wheat 1986-88 -31 -33 3 2000-2002 -7 -2 22 Maize 1986-88 3 -9 14 2000-2002 11 -1 22 Other Grains 1986-88 -20 -13 3 2000-2002 -16 -1 20 Rice 1986-88 -79 -58 15 2000-2002 -80 -17 26 Oilseeds 1986-88 -3 1 2 2000-2002 -1 0 4 Refined sugar 1986-88 -62 -72 -65 2000-2002 -52 -53 -58 Milk 1986-88 -58 -59 -54 2000-2002 -43 -40 -35 Beef and veal 1986-88 -26 -54 5 2000-2002 -20 -59 10 Pig meat 1986-88 -21 -27 10 2000-2002 -17 -22 23 Sheep meat 1986-88 -53 -64 -1 2000-2002 -12 -15 -9 Poultry 1986-88 -21 -44 -1 2000-2002 -11 -36 10 Eggs 1986-88 -17 -19 1 2000-2002 -6 -2 10 Other Commodities 1986-88 -33 -40 -6 2000-2002 -23 -23 3
21
Table-3 presents the percentage CSEs for the OECD as a whole, the EU and the United States
with respect to fourteen commodity groups. With the exception of rice, consumer taxation through agricultural policies has decreased over the sixteen-year period considered (i.e., CSE has become less negative), which reflects the liberalisation and decoupling of agricultural policies mentioned above. However, changes have occurred at different rates across commodities. For the OECD as a whole, major decreases in consumer taxation have occurred only with respect to wheat, sheep meat and milk. These changes have contributed, ceteris paribus, to a decrease in consumer prices of these commodities. In view of our simulations results, it is clear that an additional incentive to the consumption of cereals is desirable for the achievement of the WHO dietary guidelines. However, the potential nutritional gains from cheaper wheat products have probably been more than offset by decreases in taxation of milk/dairy products, as well as sheep meat, which represent important sources of fat. Hence, we conclude that the recent evolution of agricultural policies has probably had a mixed effect on the nutritional quality of diets in OECD countries. Table-3 indicates that the same conclusion applies to the two main agricultural producers of the OECD, the United States and the European Union.
We now turn to the implications of future liberalisation of agricultural markets for the
achievement of the WHO/FAO norms. Table-3 reveals that the commodities for which consumption is currently heavily taxed correspond to sugar, milk, beef and, to a lesser extent, pig meat9. It is striking that, with the exception of beef, these are precisely the items for which our model simulates declines in consumption as a way of conforming to the WHO norms. Our results therefore suggest that policy makers in OECD countries face an important dilemma. While the decoupling and phasing out of agricultural subsidies in OECD countries would undoubtedly result in increased resource efficiency, it would also modify relative food prices in a way that would encourage the consumption of commodities, which, from a nutritional point of view, are already consumed in excessive amounts. Hence, our analysis reveals a certain degree of incompatibility between the goals of liberalising agricultural markets and that of promoting healthy eating patterns in OECD countries. This is so because current policy regimes tend to tax consumption of ‘unhealthy’ products, while this is not the case for vegetables, cereals and tubers. At a time when tax instruments are increasingly being considered in order to influence consumers’ food choices, it is important to recognise that changes in agricultural policies have implications for food consumption patterns as well.
Conclusion
This paper has shown, based on a QP model calibrated from FBS data, that the new WHO dietary guidelines, if implemented, would have a profound impact on food consumption patterns in OECD countries. This follows from the fact that only Japan, Korea and Turkey do not currently violate any of the WHO dietary recommendations. For the twenty-seven remaining countries, the incompatibility of current food consumption patterns with the norms is explained primarily by excessive fat and sugar intakes. The direction of the simulated changes is fairly intuitive as the model predicts substitutions of fruits, vegetables and cereal products for items with relatively high fat contents (vegetable oils, meats, dairy products and animal fats). However, a major contribution of the paper consists in quantifying these potential changes, hence informing the ongoing debate about the implications of these norms for agricultural producers and the food industry. We establish that, in OECD countries, the norms would result in a large reduction in final demand for vegetable oils (30%), dairy products (28%), sugar (24%) and some meats (pig meat (13.5%), mutton and goat (14.5%)). These reductions would be compensated by large increases in human consumption of cereals (31%) and fruits and vegetables (23%). In the case of cereals, however, it is likely that the decrease in demand for feeds due to reduced consumption of animal products would almost offset the
9 We ignore rice as the very large percentage CSE for this item reflects primarily the policies of Japan and South Korea, two countries that do not violate any of the WHO dietary guidelines.
22

increase in human consumption. It is, therefore, clear that the dietary changes advocated by the WHO could have important impacts on the suppliers of food and agricultural commodities to OECD countries. Finally, we conclude by noticing that the ongoing process of agricultural trade liberalization in OECD countries is likely to make the achievement of the WHO nutritional goals even more difficult.
The analysis was intended as a first, broad cut impact assessment of the proposed norms.
Doubtless, alternative analysis could be conducted, and hopefully will be conducted, that is deeper. For instance, food surveys from individual countries could be used in conjunction with price information to conduct more precise diet optimisation exercises. Alternatively, econometric demand systems could also be employed to analyse this problem for individual countries. However, the focus of this paper is at a much broader, cross-country level. Given the data and tractability constraints, it is our view that the methodology employed here is the most attractive. That said, it is worth reiterating that our model only takes into account a sub-set of WHO dietary norms and that it ignores some dietary recommendations, for instance with regard to cholesterol and salt intakes. Consequently, the reported consumption changes should be interpreted as lower bounds. On the other hand, the simulations rely on the assumption of strict adherence to the WHO norms and ignore the difficult issue of implementation of these norms at national levels, which is likely to be very slow.
References Bouwman, A. F. (1997). Long-Term Scenarios of Livestock-Crop-Land Use Interactions in
Developing Countries. FAO Land and Water Bulletin 6, Food and Agriculture Organization of the United Nations (FAO). Rome: FAO.
Darmon, N., Ferguson, E., Briend, A. (2002). Linear and nonlinear programming to optimize the
nutrient density of a population’s diet: An example based on diets of preschool children in rural Malawi. American Journal of Clinical Nutrition 75: 245-253.
FAO (1994). Fats and Oils in Human Nutrition. Report of a Joint Expert Consultation. FAO Food and
Nutrition Technical Paper No. 57. Rome: FAO. FAO (2001). Food Balance Sheet. Explanatory Notes: accessed in May 2004 from
http://www.fao.org/waicent/faostat/agricult/fbs-e.htm FAO (2003). FAO Statistical Databases. FAOSTAT CD-ROM 2003. Rome: FAO. Gedrich, K., Hensel, A., Binder, I., Karg, G. (1999). How optimal are computer-calculated diets?
European Journal of Clinical Nutrition 53: 309-318. Gillespie, S., Haddad, L.J. (2003). The Double Burden of Malnutrition in Asia: Causes, Consequences
and Solutions. New Delhi: Sage Publications. Guo, X., et al. (2000). Structural change in the impact of food consumption in China 1989-93.
Economic Development and Cultural Change 48: 737-760. Henson, S. (1991). Linear programming analysis of constraints upon human diets. Journal of
Agricultural Economics 42: 380-393. OECD, 2003. Producer and Consumer Support Estimates, OECD Database 1986-2002. Paris: OECD.
Document available at www.oecd.org/document/23/0%2C2340%2Cen_2825_494504_4348119_1_1_1_1%2C00.html
23

24
Smith, V. (1959). Linear programming analysis of constraints upon human diets. Journal of Farm Economics. 31: 272-283.
Stigler, G. (1945). The cost of subsistence. Journal of Farm Economics 27: 303-314. USDA (2003). USDA National Nutrient Database for Standard Reference, Release 16. Washington
D.C.: United States Department of Agriculture. WHO (2003). Diet, Nutrition and the Prevention of Chronic Diseases: Report of a Joint WHO/FAO
Expert Consultation, Geneva, 28 January - 1 February 2002, WHO Technical Report Series: 916. Geneva: World Health Organization.
WHO (2004). Global Strategy on Diet, Health and Physical Activity. Strategy document No.
WHA57.17 dated 22 May 2004. Geneva: World Health Organization.