consumers awareness of the eu protected designations of
TRANSCRIPT
Consumers’ awareness of the EU’sprotected designations of
origin logoAlexandra Goudis and Dimitris Skuras
Department of Economics, University of Patras, Patras, Greece
Abstract
Purpose – Protected designation of origin (PDO) and protected geographical indication (PGI) products formthe core of the European Union (EU) quality food policy. Low and fragmented logo recognition perils the entireplan. This work aims to provide a “classification” of European consumers as regards logo awareness based ongeneric demographic and socio-economic characteristics and to test hypotheses relating PDO awareness withthe purchasing behaviour of consumers.Design/methodology/approach – The work utilises publicly available pan-European databases collectedfrom Eurobarometer in four rolling surveys from 2012 to 2017. The statistical analysis exploits the spatiallynested nature of the data.Findings – The “logo aware” consumer is distinctively different from the average representative Europeanconsumer. A range of demographic, human capital and socio-economic characteristics and behavioural andattitudinal traits differentiate the consumers who are aware of the logo. Country and region effects are vital.Research limitations/implications – Benefits of large and representative samples accrue by utilisingavailable Eurobarometer surveys. This comes at a cost. The individual researcher has no control over thequestions included in the questionnaire.Practical implications – Consumer classification forms the basis of awareness-raising strategies. It revealsthe numerous segments of aware and non-aware consumers and opens a discussion about tools andmethods toreach out to the European consumer.Originality/value – This analysis holds an exact pan-European perspective and incorporates consumers’characteristics, behaviour, attitudes and country and region effects.
Keywords Logo, Logo recognition, Logo awareness, Geographical indication, PDO, GI, EU
Paper type Research paper
1. IntroductionThe core of the European Union (EU) quality food policy consists of protecting the names ofagricultural, food and drinks products. Protection draws on the product’s uniquecharacteristics, such as their geographical origin and traditional know-how, skills andexpertise embedded in the production. Geographical indication (GI) refers to the protecteddesignation of origin (PDO), the protected geographic indication (PGI) and the GI of spiritdrinks and aromatised wines. Quality logos are appraised as strong marketing intimationspropping up less unique or less preeminent products. However, quality logos are equally, ifmore, relevant to renowned and esteemed products as they are, frequently, the only sign thatdistinguishes them from frauds. So undoubtedly, every successful food that commands aquality price premium attracts a wide range of fakes (Olmsted, 2016). In the last 25 years, the
Protecteddesignations of
origin
1
© Alexandra Goudis and Dimitris Skuras. Published by Emerald Publishing Limited. This article ispublished under the Creative Commons Attribution (CC BY 4.0) licence. Anyone may reproduce,distribute, translate and create derivative works of this article (for both commercial and non-commercialpurposes), subject to full attribution to the original publication and authors. The full terms of this licencemay be seen at http://creativecommons.org/licences/by/4.0/legalcode
The authors would like to thank two anonymous referees of this journal for their constructivecomments and the editor, Professor Louise Manning for her support and encouragement. The authorsacknowledge the excellent research support received by Ms Vasiliki Davari and Ms Aikaterini Davari.
The current issue and full text archive of this journal is available on Emerald Insight at:
https://www.emerald.com/insight/0007-070X.htm
Received 28 February 2020Revised 6 June 2020
15 July 2020Accepted 21 August 2020
British Food JournalVol. 123 No. 13, 2021
pp. 1-18Emerald Publishing Limited
0007-070XDOI 10.1108/BFJ-02-2020-0156

adoption of food quality labels, especially amongst Southern European producers, isspectacular (Albuquerque et al., 2018; Ruiz et al., 2018; Sad�ılek, 2020).
The Commission of the EU regularly initiated and financed promotionmeasures targetingthe internal market and third countries, especially in North America and Asia. RepeatedEurobarometer surveys show that awareness of the EU’s PDO logo is low and stagnantamongst European consumers, at an average of around 16% (European Commission, 2018)and highly biased towards specific segments of the European society. Meanwhile, 24 and37%, respectively, of European consumers recognise the EU organic agriculture logo and theFair Trade logo (European Commission, 2018) and 27%have seen or heard of the EUEcolabel(European Commission, 2017). Also, the rates of logo recognition vary enormously amongstEU countries and regions of the same country. Average proportions of PDO recognition rangefrom 5% for Denmark and the UK to around 34% for France and Italy.
These unjustifiably meagre recognition rates at the EU level called the attention of theEuropean Court of Auditors which noted that “The means available for promotion andinformation about the Geographical Indications (GI) scheme are unlikely to increase it. Theyare used to a limited extent only and does not reside on a clear strategy on how to raiseawareness of the GI scheme. Various measures are available with limited success” (EuropeanCourt of Auditors, 2011, paragraph 65). However, building “a clear strategy on how to raiseawareness”, at the European level, necessitates that policymakers have a goodunderstanding of the profile characteristics of the logo-aware and the logo-non-awareconsumers. Differences between logo-aware and logo-non-aware consumers can point to thecombination of tools that will make the strategy cost-efficient and cost-effective. The aim ofthiswork is twofold: first, to provide a “classification” of European consumers as regards logoawareness based on generic demographic and socio-economic characteristics; second, to testhypotheses relating PDO awareness with the purchasing behaviour of consumers.
To achieve this aim, we utilise EU broad, extensive and representative samples ofrespondents and appropriate classification methodology that decomposes and isolates thecontribution of a respondent’s attributes from the place of residency, national and regional.Data are collected from Eurobarometer surveys which are publicly available at the GermanSocial Science Infrastructure Services (GESIS) data repository. The use of Eurobarometerensures large samples and transparent sampling procedures that are highly homogenous andprofessionally conducted across member states. Multilevel logistic regression is a suitablestatistical method for classification able to take account of the spatial nesting of respondentsin regions and member states.
This work presents results related only to the recognition of the PDO logo. Results for thePGI logo are very similar and are available from the corresponding author upon request. Theanalysis shows an extensive fragmentation amongst European consumers. These results callpolicymakers to revisit conventional methods and tools for raising awareness.
2. Research hypothesesSeveral studies have considered consumers’ recognition of GIs’ logos and labels. Nonetheless,they do not provide a European-wide, clear and convincing answer to the observed lowrecognition rates. Furthermore,most of theworks have a national or even regional focus and so,they cannot claim to address the “European” consumer. The definition of the “aware” consumerdiffers and does not allow easy comparisons. Usually, the samples are small, and the ad hocsampling procedures do not make a good case for sample representativeness. Subsequently,some of the results are seemingly contradicting and their estimates are very far apart even forthe same or neighbouring countries. Grunert and Aachmann (2016) identify that much of theconfusion and doubt is due to the different methodologies, different definitions of the termawareness and sampling bias. Definitions of awareness span from the “recognition of certain
BFJ123,13
2

quality symbols, signs or logos” (LondonEconomics, 2008) to “ever heard about PDOproducts”(Verbeke et al., 2012) and “the knowledge of a product with a PDO label” (Skubic et al., 2019). Alldefinitions are valid, but some allow for acquiescence response bias. Sampling biases resultwhen the sample is not representative, especially in critical characteristics such as theeducational level. For example, surveys inflated with high educational-level respondents showhigh awareness levels. Sample selection also introduces bias. Studies carried out through theInternet exclude non-Internet userswith unknown consequences. Surveys targeting consumerswith a prior PDO purchase, not surprisingly, report high awareness levels.
The literature shows that several demographic, human capital and economiccharacteristics of consumers may be related to PDO awareness. Grunert and Aachmann(2016) review studies which provide evidence that consumers of average or older age have apreference for PDO-labelled products. Riivits-Arkonsuo et al. (2016) find higher awarenessrelated to middle-aged and female consumers and Verbeke et al. (2012) to older aged andmaleconsumers. Sad�ılek (2019) finds that the segment of Czech consumers who primarily seek forquality contains people who are mostly male and over 40 years of age. Skubic et al. (2019) findno age or gender differences. Likoudis et al. (2016) studied the consumers’ intentions to buyPDO and found no gender differences andweak age effects. Also, they show that respondentswho are aware of the term PDO score higher on the intention to buy PDO products.
Evidence on differences regarding family size and structure is sparse and indicates thatconsumers living in a family household show actual search behaviour for informationallabels (Sad�ılek, 2019). Kaczorowska et al. (2019) did not find clear evidence of differences infamily size between “mindful” and “sceptical” urban adult consumers of food marked bysustainability labels. Of course, family size and structure, i.e. a single or two-parent familywith or without children, may be related to PDO logo awareness through budget constraintsor search capacity, concepts that are the subject of mainstream food purchase decisionliterature. The place of residence can differentiate the level of PDO awareness inconclusivelyin one way or another. Rural consumers have a higher probability of being aware of a PDOproduct primarily if this is local but have a narrow choice set as concerns food outlets. Incontrast, urban consumers are more likely to shop in outlets that hold a greater variety ofproducts and thus, higher chances to come across PDO labels.
H1. PDO logo awareness levels differ amongst consumers with different socio-demographic characteristics.
H1a. PDO logo awareness is higher amongst middle- and old-aged consumers.
H1b. PDO logo awareness is higher amongst female consumers.
H1c. PDO logo awareness is lower amongst larger families.
H1d. PDO logo awareness is higher amongst two-parent families.
H1e. PDO logo awareness is lower among rural and small-town residents.
Human capital characteristics capture the knowledge, skills and ability of an individualconsumer to search for food quality information. The literature is unanimous that highereducational levels are related to a preference for regionally denominated food (P�ıcham andSko�rpa, 2018; Riivits-Arkonsuo et al., 2016; Sad�ılek, 2019; Skubic et al., 2019). Education is aparamount factor related to a consumer’s ability to search and retrieve information, perceiveand understand knowledge. Surprisingly, the literature has not examined the role of access tothe Internet and the frequency of its use as factors differentiating the PDO logo awareness.
H2. PDO logo awareness is higher amongst highly educated consumers.
H3. PDO logo awareness is higher amongst frequent Internet users.
Protecteddesignations of
origin
3

Consumers come across food logos not only when they actively search for or passivelyreceive information about food but also when they are engaged in food purchasing. However,not all consumers are equally likely to come across a product with a quality logo whileshopping since not all food outlets store the same variety and number of PDO-certifiedproducts. Jantyik and T€or€ok (2020) show, for the Hungarian market, that the number of GIproducts in discount retailers was less than 1% of their total food supply. Also, only a smallamount of food quality-certified items are included in the food discounters offers. Therefore,whether consumers shop at a convenience store, a low-end discount supermarket, a massmerchandiser, a high-end supermarket or a speciality/gourmet store, it affects the probabilityof coming across products carrying the PDO logo. The choice of outlet, in turn, influences thelikelihood that a search process will be triggered and that the logo will be recognised.
Occupation is not only related to income-generating capacity but also to the time availablefor searching food information. Riivits-Arkonsuo et al. (2016)contend that awareness ofquality labels amongst Estonian consumers is higher for certain occupations, includingentrepreneurs, managers and white-collar. Also, those in charge of housekeeping may paymore attention to food labels, including quality logos. Retired consumersmay havemore timeto search for food and probably show a higher awareness level. The ownership of durables,such as a car or a house, is a sign of wealth. Besides, car ownership also signals a consumer’sability to search for food and source it from distant outlets.
H4. PDO logo awareness is higher amongst certain occupations that are related either tohigher earnings (employed in the management, white-collar or self-employed) or ahigher responsibility for food sourcing (housekeeping) or imply time availability(retired consumers).
H5. PDO logo awareness is higher amongst consumers of wealthier and financiallyunconstrained households.
With very few exceptions, PDO products achieve a price premium over similar conventionalproducts. This price premium may range from 2–5% up to double or even triple the price ofthe same non-certified product (AND-International, 2012; Aret�e, 2013; London Economics,2008). Also, the overwhelming proportion of studies find that consumers are willing to pay aprice premium for PDO-registered products (Cei et al., 2018; Deselnicu et al., 2013; Grunert andAachmann, 2016; Leufkens, 2018). Only a few studies point to inconclusive or oppositeresults. For example, Hassan et al. (2011) find PDOs being as price elastic as or more thanstandard products. Also, income is associated with a product’s price. Even though moststudies provide evidence of a relation between logo awareness and middle or high income,certain studies found a small effect (Verbeke et al., 2012) or no association (Skubic et al., 2019).
H6. Price-sensitive consumers are less likely to be aware of the PDO logo.
H7. PDO logo awareness is associated with higher household income.
Of course, quality alone cannot explain price premiums and possible lower awareness levels.A range of non-quality associations such as uniqueness, social image, origin, environmentaland sustainability beliefs and perceptions may drive awareness and food purchasingdecisions. Anselmsson et al. (2014) take one step further to suggest that even willingness topay for a price premium is, first and foremost, guided by such factors. The Eurobarometerdata used in this work consistently report the respondent’s self-placement to a social class.These data provide an excellent opportunity to examine if consumers that identifythemselves with specific social categories are also more aware of PDO logos.
H8. PDO logo awareness is associated with consumers identified with middle and uppersocial classes.
BFJ123,13
4

Tregear (2007) identifies consumers of products that have a unique territorial characterconcerning their distance from the place of production in two categories. Consumers of “closetypicity” are the consumers who are proximate to the individual products which they consume.In contrast, consumers of “distant specialty” are distant to the place of production. The firstcategory, i.e. consumers of “close typicity” is part of local and regional markets and as Tregear(2007) points out, the role of the PDO logo and label may be redundant or, at worst, may imposean industrial identity. For “distant specialty” systems, PDO labels have the potentially mostinfluential role to play. This consumer typology, however, may be viewed through the foodmiles and environmental perspective, which adds a degree of complexity. Local, food miles-sensitive consumers may be aware of the PDO logo as part of climate-friendly consumptionbehaviour. Distant, consumers may be mindful of the PDO logo to avoid consumption.
H9. Food miles-sensitive consumers are more aware of the PDO logo.
High logo awareness is shown by countries that have registeredmanyGIs and havemade useof the policy, such as France, Italy, Spain, Greece from the older member states and the CzechRepublic and Slovakia from the newer (Albuquerque et al., 2018; Sad�ılek, 2020). On the otherhand, countries like Germany, which have made use of the PDO scheme show a weightedaverage of PDO-logo-aware respondents well below the EU’s grand average (EuropeanCommission, 2018). Thus, it is not clear whether registered PDO products are a decisivefactor, differentiating aware and non-aware consumers.
H10. The number of registered PDO products increases the probability that consumersare aware of the PDO logo.
Besides a direct fixed effect of the country of residence on awareness through the number ofregistered products, countries also may absorb unobserved heterogeneity that is due to theirculinary heritage, rural institutions or even the expression of national food identity. One-quarter of all PDOs are of an Italian origin. Arfini and Capelli (2009) report that 15designations represent 90% of Italian PDO products. Thus, intraregional inequalities stillexist even in countries with a tradition in registering PDO products.
H11. Country and region membership exercises a random effect that, depending on acountry’s culture and institutions, may increase or decrease PDO logo awareness.
Theoretical and empirical pieces of evidence support all the hypotheses mentioned above.The next section details the data and methodology used to test the hypotheses.
3. Data and methodsData for this workwere collected from four Eurobarometer surveys conducted inMarch 2012,November 2013, October 2015 and December 2017 across all EU member states. TheEurobarometer surveys showed a card of logos and asked the participants to respond to thefollowing question: “Which of the logos on this screen are you aware of?” (EuropeanCommission, 2012, 2014, 2016, 2017). The procedure followed by Eurobarometer provides anestimate for one type of consumer awareness called “logo recognition” or “aided recall”. Thelogos shown to Eurobarometer survey participants were the labels adopted by the EuropeanCommission for Organic Agriculture, for PDOs, PGIs and traditional specialty guaranteed(TSG). The Fair Trade logo completed the set of logos.
All surveys recorded a range of respondent-specific characteristics in the same way. Thesecharacteristics include demographics (age, gender, household size, etc.), human capital(education, Internet use, etc.) and economic characteristics (occupation and ownership ofdurables). A question capturing whether the respondents had difficulties in paying householdbills at the end of the month depicted households with cash flow and financial stress issues.
Protecteddesignations of
origin
5

Some of the surveys also included psychographic and behavioural characteristics. Thequestionnaires recorded the respondents’ place of residence in terms of the European hierarchyof spatial administrative units called NUTS (from the French – Nomenclature des Unit�esTerritoriales Statistiques). Within countries, some regions may have a proportion of awarerespondents well below or well above the national and EU averages. From a purely descriptiveperspective, it seems that besides the variability at the individual (respondent) level, there issome variability that may be due to either the regional or national clustering of consumers,which deserves some consideration. Eurobarometer also provides population stratificationweights for each of the participating countries. These weights ensure samplerepresentativeness regarding a series of socio-demographic criteria and the NUTS region.
Some of the surveys included additional questions which provide useful information forhypotheses testing. In the 2012 study, there is the question “When buying food, howimportant are the following for you personally. . .?” with potential answers for the price,quality and geographical origin on a four-scale variable from very important to not at allimportant. Price-sensitive respondents are those respondentswho choose the answer “price isvery important”. In the 2013 survey, there is a question recording if the respondent buyslocally produced and seasonal food whenever possible as an action against climate changethat was recorded only in this survey. We name this “Food miles”. In the 2017 study, aquestion reports the income quintile in which the respondent’s household belongs. The 2015and 2017 studies document the respondents’ self-placement to a social class.
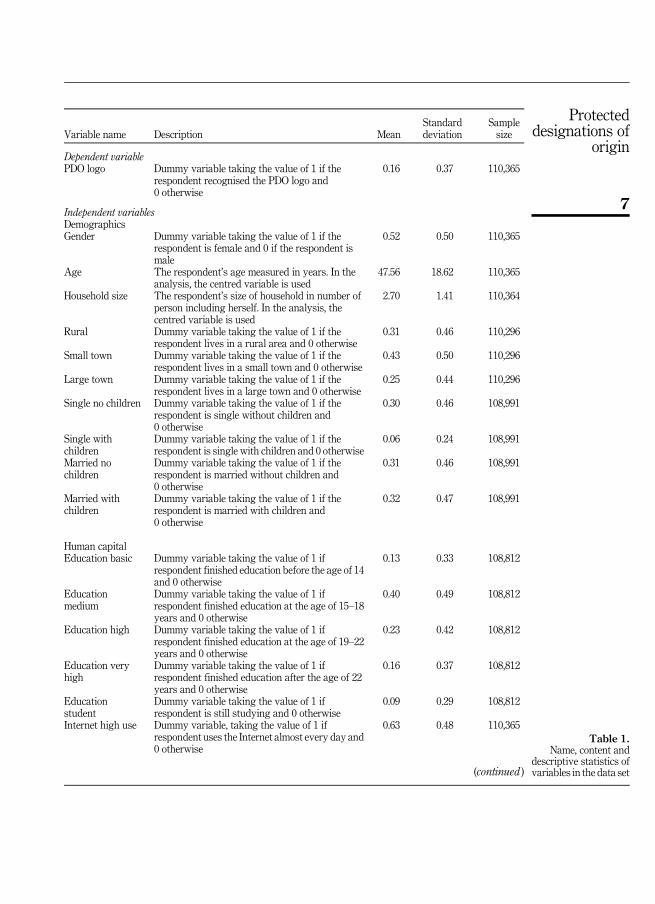
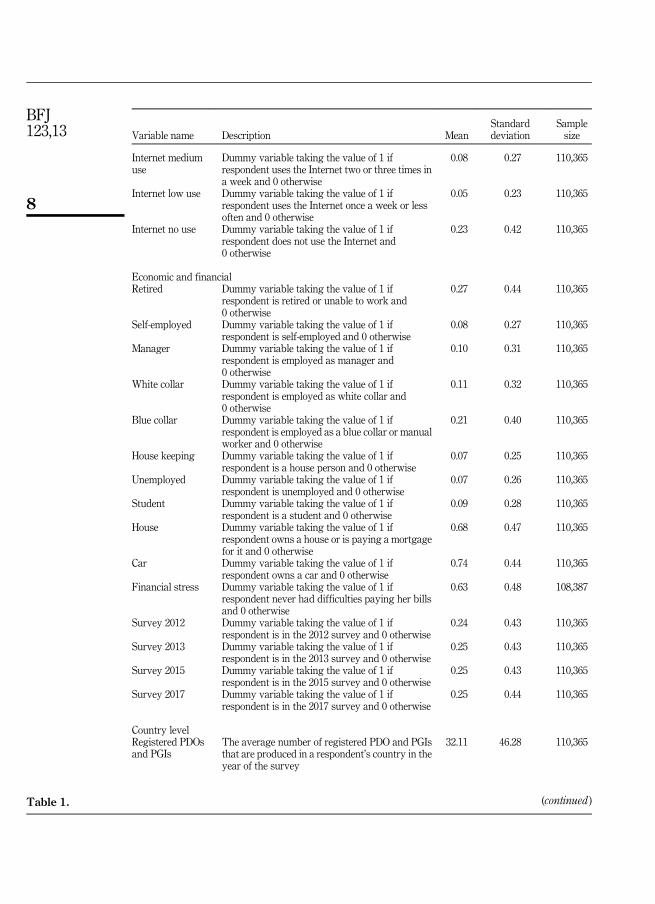
Thiswork aims to classifyEuropean consumers intoPDO logo aware or non-awarebasedon aseries of characteristics portrayed by hypotheses 1 to 9. Our data analysis strategy is to test eachone of the hypotheses by examining the relationship between the PDO logo recognitiondependent binary variable and the independent variables. To this end, we utilise all four surveysby pooling them into one large data set containing all common questions and correspondingsocio-demographic variables to test hypotheses 1 to 5. In this way, we can benefit from thestatistical power of large samples and extract very safe conclusions that are representative for thewhole EU and the individual member states. Then, to examine hypotheses 6 to 9, we utilise dataonly from the survey that contains the particular question that corresponds to the hypothesisunder consideration. Table 1 describes the variables that are commonacross the four surveys andthe variables that are included only in specific studies. Descriptive statistics are weighted usingthe population stratification weights provided by Eurobarometer.
Logistic regression is a fundamental and accessible and thus widely understoodalgorithm, especially for binary classification problems. Amongst the various statisticalmodels that can potentially take account of the hierarchical clustering of the data, we adoptthe multilevel logistic regression analysis ( three-level) with random intercept that is ofextensive use in market research (Hox et al., 2017; Wieseke et al., 2008). This modelacknowledges that two randomly chosen European consumers in the same area of the samecountry will tend to be more alike in their awareness of the PDO logo, adjusted for theircharacteristics. Thus, country and region effects can condition the level of PDO logoawareness by equally influencing all residents. These country and region impacts may be aresult of several factors, including those associated with an area’s culinary heritage andculture, food trade networks, institutions, for example, how active they are in reaching out tothe general public and any other unobservable, to this study, factor. The significance ofcountry and region effects will assist us in testing hypotheses 10 and 11.
4. ResultsThe three-level random intercept logistic regressionwas estimated five times on five differentsamples. One sample pooled all surveys together and assessed the contribution ofdemographic and socio-economic variables which are common across them. A total of four
BFJ123,13
6
Variable name Description MeanStandarddeviation
Samplesize
Dependent variablePDO logo Dummy variable taking the value of 1 if the
respondent recognised the PDO logo and0 otherwise
0.16 0.37 110,365
Independent variablesDemographicsGender Dummy variable taking the value of 1 if the
respondent is female and 0 if the respondent ismale
0.52 0.50 110,365
Age The respondent’s age measured in years. In theanalysis, the centred variable is used
47.56 18.62 110,365
Household size The respondent’s size of household in number ofperson including herself. In the analysis, thecentred variable is used
2.70 1.41 110,364
Rural Dummy variable taking the value of 1 if therespondent lives in a rural area and 0 otherwise
0.31 0.46 110,296
Small town Dummy variable taking the value of 1 if therespondent lives in a small town and 0 otherwise
0.43 0.50 110,296
Large town Dummy variable taking the value of 1 if therespondent lives in a large town and 0 otherwise
0.25 0.44 110,296
Single no children Dummy variable taking the value of 1 if therespondent is single without children and0 otherwise
0.30 0.46 108,991
Single withchildren
Dummy variable taking the value of 1 if therespondent is single with children and 0 otherwise
0.06 0.24 108,991
Married nochildren
Dummy variable taking the value of 1 if therespondent is married without children and0 otherwise
0.31 0.46 108,991
Married withchildren
Dummy variable taking the value of 1 if therespondent is married with children and0 otherwise
0.32 0.47 108,991
Human capitalEducation basic Dummy variable taking the value of 1 if
respondent finished education before the age of 14and 0 otherwise
0.13 0.33 108,812
Educationmedium
Dummy variable taking the value of 1 ifrespondent finished education at the age of 15–18years and 0 otherwise
0.40 0.49 108,812
Education high Dummy variable taking the value of 1 ifrespondent finished education at the age of 19–22years and 0 otherwise
0.23 0.42 108,812
Education veryhigh
Dummy variable taking the value of 1 ifrespondent finished education after the age of 22years and 0 otherwise
0.16 0.37 108,812
Educationstudent
Dummy variable taking the value of 1 ifrespondent is still studying and 0 otherwise
0.09 0.29 108,812
Internet high use Dummy variable, taking the value of 1 ifrespondent uses the Internet almost every day and0 otherwise
0.63 0.48 110,365
(continued )
Table 1.Name, content and
descriptive statistics ofvariables in the data set
Protecteddesignations of
origin
7
Variable name Description MeanStandarddeviation
Samplesize
Internet mediumuse
Dummy variable taking the value of 1 ifrespondent uses the Internet two or three times ina week and 0 otherwise
0.08 0.27 110,365
Internet low use Dummy variable taking the value of 1 ifrespondent uses the Internet once a week or lessoften and 0 otherwise
0.05 0.23 110,365
Internet no use Dummy variable taking the value of 1 ifrespondent does not use the Internet and0 otherwise
0.23 0.42 110,365
Economic and financialRetired Dummy variable taking the value of 1 if
respondent is retired or unable to work and0 otherwise
0.27 0.44 110,365
Self-employed Dummy variable taking the value of 1 ifrespondent is self-employed and 0 otherwise
0.08 0.27 110,365
Manager Dummy variable taking the value of 1 ifrespondent is employed as manager and0 otherwise
0.10 0.31 110,365
White collar Dummy variable taking the value of 1 ifrespondent is employed as white collar and0 otherwise
0.11 0.32 110,365
Blue collar Dummy variable taking the value of 1 ifrespondent is employed as a blue collar or manualworker and 0 otherwise
0.21 0.40 110,365
House keeping Dummy variable taking the value of 1 ifrespondent is a house person and 0 otherwise
0.07 0.25 110,365
Unemployed Dummy variable taking the value of 1 ifrespondent is unemployed and 0 otherwise
0.07 0.26 110,365
Student Dummy variable taking the value of 1 ifrespondent is a student and 0 otherwise
0.09 0.28 110,365
House Dummy variable taking the value of 1 ifrespondent owns a house or is paying a mortgagefor it and 0 otherwise
0.68 0.47 110,365
Car Dummy variable taking the value of 1 ifrespondent owns a car and 0 otherwise
0.74 0.44 110,365
Financial stress Dummy variable taking the value of 1 ifrespondent never had difficulties paying her billsand 0 otherwise
0.63 0.48 108,387
Survey 2012 Dummy variable taking the value of 1 ifrespondent is in the 2012 survey and 0 otherwise
0.24 0.43 110,365
Survey 2013 Dummy variable taking the value of 1 ifrespondent is in the 2013 survey and 0 otherwise
0.25 0.43 110,365
Survey 2015 Dummy variable taking the value of 1 ifrespondent is in the 2015 survey and 0 otherwise
0.25 0.43 110,365
Survey 2017 Dummy variable taking the value of 1 ifrespondent is in the 2017 survey and 0 otherwise
0.25 0.44 110,365
Country levelRegistered PDOsand PGIs
The average number of registered PDO and PGIsthat are produced in a respondent’s country in theyear of the survey
32.11 46.28 110,365
Table 1. (continued )
BFJ123,13
8

samples, one for each survey, assessed the contribution of additional variables which are notcommon amongst surveys. All continuous variables, e.g. age and family size, are centred tothe sample’s mean and from all categorical variables, the analysis excludes one category toavoid complete multicollinearity. The appropriateness of the proposed three-level structurewas tested by estimating models without any covariates, i.e. a “null”model, as a single-levellogistic regression, as a two-level model with respondent nested in countries, i.e. no cluster(regional) effects, as a two-level model with respondents nested in regions, i.e. no supercluster(country) effects and as a three-level model with respondents clustered in regions and regionsclustered in countries. Due to the nested sample structure of the models, log-likelihood ratio
Variable name Description MeanStandarddeviation
Samplesize
Survey-specific variablesPrice Dummy variable taking the value of 1 if
respondent considers price to be a very importantfactor and 0 otherwise, recorded in the 2012 survey
0.65 0.48 26,541
Food miles Dummy variable taking the value of 1 ifrespondent buys locally produced and seasonalfood whenever possible as an action againstclimate change and 0 otherwise, recorded in the2013 survey
0.36 0.48 27,919
Income low Dummy variable taking the value of 1 ifrespondent’s household income is in the lower-income quintile and 0 otherwise, recorded in the2017 survey
0.28 0.45 22,763
Income secondquintile
Dummy variable taking the value of 1 ifrespondent’s household income is in the secondincome quintile and 0 otherwise, recorded in the2017 survey
0.27 0.44 22,763
Income thirdquintile
Dummy variable taking the value of 1 ifrespondent’s household income is in the thirdincome quintile and 0 otherwise, recorded in the2017 survey
0.20 0.40 22,763
Income fourthquintile
Dummy variable taking the value of 1 ifrespondent’s household income is in the fourthincome quintile and 0 otherwise, recorded in the2017 survey
0.14 0.35 22,763
Income upper Dummy variable taking the value of 1 ifrespondent’s household income is in the upperincome quintile and 0 otherwise, recorded in the2017 survey
0.11 0.31 22,763
Social classworking
Dummy variable taking the value of 1 if therespondent places herself in the working class and0 otherwise, recorded in the 2015 and 2017 surveys
0.29 0.45 53,715
Social class low Dummy variable taking the value of 1 ifrespondent places herself in the low class and0 otherwise, recorded in the 2015 and 2017 surveys
0.18 0.38 53,715
Social classmedium
Dummy variable taking the value of 1 ifrespondent places herself in the middle class and0 otherwise, recorded in the 2015 and 2017 surveys
0.45 0.50 53,715
Social class upper Dummy variable taking the value of1 ifrespondent places herself in the upper middle orhigh class and 0 otherwise, recorded in the 2015and 2017 surveys
0.09 0.28 53,715
Table 1.
Protecteddesignations of
origin
9
tests provide substantial evidence that the three-level structure is superior to both, the two-level and the single-level structures. Results are robust against various sample structureswhich exclude certain countries or regions. Ad hoc tests for multicollinearity, including acomparison of standard errors under the inclusion of seemingly correlated variables did notreveal any notable problem. All test results are available from the corresponding author uponrequest. Table 2 shows the estimated odds ratios.
The interpretation of the odds ratios is straightforward. The odds show the probabilitythat a randomly chosen respondent will recognise the logo, to the probability that therespondent does not recognise the logo. The odds ratio is the ratio of the odds under twodifferent conditions. The odds ratio indicates howmuch the odds that a consumer recognisesthe PDO logo increase (odds ratio higher than 1) or decrease (odds ratio less than 1) betweenthe two values of a dummy variable or by increasing a continuous variable by one unit. Forexample, the odds ratio of the variable “Education Very High” in model 1 is 1.821. If theconsumer has a high educational level, the odds that he/she recognises the PDO logo are 1.821times higher or 82.1% higher than the odds of a consumer who only has compulsoryeducation, which is the educational category excluded from the analysis. Of course, with allother variables held constant and no random effects. For the continuous variable householdsize, the odds ratio in model 1 is 0.973. For an increase of one member above the household’ssample average of 2.70, the odds that the consumer recognises the PDO logo decreases by2.7% [i.e. (1–0.973) 3 100%], holding constant all other variables and random effects at 0.
Hypothesis 1 (1a to 1e) tests the effects of demographic variables across all models. Ageshows a consistently statistically significant quadratic inverted U-shape relation across allmodels. The odds that a consumer is aware of the PDO logo increase up to middle age andthen slightly decrease. Thus, hypothesis 1a is accepted to the part of middle-aged consumers.There is a definite answer of no “gender” effects and therefore, hypothesis 1b is rejected.Household size reduces the odds that the consumer is PDO logo conscious, but this is notconsistent across models. So, hypothesis 1c is accepted. From all marital status categories,only married without children have higher odds of PDO logo awareness, but this is notconsistent. Accordingly, hypothesis 1d is rejected. Place of residence effects are consistentlynot statistically significant across all models; therefore, hypothesis 1e is rejected. Thequantitative impact of all demographic factors, even when statistically significant, isminimal.
Education is consistently significant with a considerable quantitative effect across allmodels. As the educational level of the respondent increases, the odds that the consumer isPDO logo aware increase significantly. Therefore, hypothesis 2 is accepted. The effect ofInternet use is impressive. Table 1 shows that, across Europe, almost one-quarter ofconsumers do not use the Internet or do not have access to it. This fact raises some concernsabout Internet-based surveys. All Internet use categories have statistically significant oddsratios indicating that Internet use increases the probability that consumers are PDO logoaware. Thus, hypothesis 3 is accepted. However, there is not a clear linear relationshipbetween the intensity of Internet use and awareness as there is for education.
Self-employed, white-collar or those involved in the management have statisticallysignificant higher odds ratios of being PDO aware. This result may just reflect the fact thatthese occupational categories address more educated and skilful consumers. The same holdsfor retired consumers, but this may be due to more time available for food search. Therefore,hypothesis 4 is only partly accepted because for those consumers who deal withhousekeeping is rejected. Consumers who own a house, a car or do not face financialissues are more likely to be PDO logo aware. So, hypothesis 5 is accepted.
The odds ratio of the “price-sensitive” consumer in the column for model 2 of Table 2 is0.795. In otherwords, the odds of being logo aware are 20.5% less than the odds of a consumerwho has not stated price as a critical determinant. Therefore, hypothesis 6 is accepted. Results
BFJ123,13
10

Model 1 (allsurveystogether)
Model 2 (2012survey)
Model 3 (2013survey)
Model 4 (2017survey)
Model 5 (2015and 2017surveys)
Fixed effectsGender 0.974 1.035 0.932 0.867*** 0.958Age_centred 0.995*** 0.996** 0.991*** 0.993** 0.995***Age_ centredsquared
1.000*** 1.000*** 1.000** 0.999*** 1.000***
Householdsize
0.973** 0.965 0.953* 1.005 0.973
Rural 0.964 1.130 1.013 1.033 0.877Small town 1.033 1.039 1.009 1.061 0.963Single withchildren
0.922 1.034 1.153 0.962 0.759*
Married nochildren
1.090*** 1.144*** 1.165** 0.933 1.028
Married withchildren
1.023 1.080 1.115 0.943 0.976
Educationmedium
1.180** 1.329*** 1.044 1.053 1.192***
Educationhigh
1.608*** 1.532*** 1.472*** 1.613*** 1.732***
Educationvery high
1.821*** 1.782*** 1.762*** 1.738*** 1.827***
Educationstudent
1.690*** 1.526*** 1.942*** 1.719** 1.553***
Internet highuse
1.471*** 1.469*** 1.253* 1.731*** 1.588***
Internetmedium use
1.535*** 1.591*** 1.231 1.576*** 1.618***
Internet lowuse
1.517*** 1.663*** 1.389** 1.230 1.483***
Retired 1.124* 1.256** 1.172 1.322*** 1.053Self-employed 1.292*** 1.106 1.382** 1.461** 1.284***Manager 1.175*** 1.254* 1.174 1.098 1.072White collar 1.156** 0.928 1.345** 1.252 1.152*Blue collar 1.012 0.881 1.301 0.892 0.958House keeping 0.945 0.828 1.071 0.829 0.948Houseownership
1.139** 0.980* 1.146 1.276** 1.187**
Car ownership 1.107** 1.149* 0.904 1.108 1.164**Financialstress
1.125** 0.983 1.143 1.022 1.131***
Survey 2012 0.825Survey 2013 0.688**Survey 2015 1.139 1.205***RegisteredPDOs andPGIs
1.005 1.012*** 1.010*** 1.010*** 1.010***
Price 0.795***Food miles 1.613***Income secondquintile
1.000
Income thirdquintile
1.288***
(continued )
Table 2.Estimated odds ratiosfrom the three-level
logistic models
Protecteddesignations of
origin
11

in the column for model 4 of Table 2 provide supporting evidence that household income ispositively related to PDO logo recognition. The odds ratios that a respondent whosehousehold income is in the third-, fourth- and upper-income quintiles recognises the logo are1.288, 1.441 and 1.281, respectively. So, hypothesis 7 is accepted. Social class self-placementwas coherently measured only in the 2015 and 2017 surveys. Consumers who identifythemselves as being “middle class”, show a statistically significant odds ratio that the logo isrecognised as 1.129 as shown in the column for model 5 of Table 2. Therefore, hypothesis 8 ispartly accepted for consumers identified as “middle class” and rejected for those identified as“upper class”. Food miles sensitive is a consumer who considers buying local food as anaction against climate change. The column for model 3 in Table 2 shows that the odds ratiothat a “food miles sensitive” respondent recognises the PDO logo is 1.613. This odds ratiomeans that the “food miles sensitive” respondent has 61% odds higher to be logo aware. So,hypothesis 9 is accepted.
The number of registered products at the national level is statistically significant in all butmodel 1. The relationship between this variable and logo recognition is statisticallysignificant and quantitatively prominent but still ambiguous due to its failure in the largesample of model 1. Therefore, hypothesis 10 is inconclusive. However, the analysis of therandom effects that follows sheds light on the country and region variation in the levels oflogo recognition.
Table 2 also shows the effects of living in specific countries and regions on logorecognition. The estimated intraclass correlation coefficients (ICCs) show that a verysignificant part of the data variation is due to their clustering in regions and countries.Predicted random effects for countries and regions average to 0.We call a “typical” region or a
Model 1 (allsurveystogether)
Model 2 (2012survey)
Model 3 (2013survey)
Model 4 (2017survey)
Model 5 (2015and 2017surveys)
Income fourthquintile
1.441**
Income upper 1.281***Social classlow
1.015
Social classmedium
1.129**
Social classupper
1.137
Constant 0.057*** 0.050*** 0.036*** 0.044*** 0.047**
Random effectsEstimatedvariance ofcountry effect
0.339* 0.266*** 0.290*** 0.458*** 0.404***
Estimatedvariance ofregional effect
0.163*** 0.268*** 0.248*** 0.602*** 0.340***
ICC (%) 13.24 13.96 14.05 24.37 18.44
StatisticsLog-likelihood �40,817.502 �8,945.247 �8,960.361 �8,397.939 �21,343.830Observations 105,657 25,323 26,515 22,315 52,010Regions 208 206 208 205 206Countries 28 27 28 28 28
Note(s): Three, two and one asterisk indicate significance at 1, 5 and 10%, respectivelyTable 2.
BFJ123,13
12

“typical” country, the region or country whose random effects are 0, respectively. If arespondent lives in a “typical” country, the odds ratio of recognising the logo is determinedonly by individual characteristics. Contrarily, if the respondent lives in a country whoserandom effects are significantly different from 0, the odds ratio of recognising the logo isdetermined by the consumer’s characteristics plus the effect of the country.
Panel (a) of Figure 1 shows a caterpillar of the predicted country random effects. Randomeffects for countries range from �1 for the UK and Denmark to þ1 for France. Thus, arespondent who lives in a typical region of France has almost triple the odds of recognisingthe PDO logo from a respondent with precisely the same personal characteristics who lives ina “typical” region of a “typical” country. It is important to note that for 17 out of the 28 EUcountries, random effects are not statistically different from 0 as their confidence intervalsinclude 0. From the rest of the countries, four have negative random effects and seven havepositive random effects. Of course, positive effects refer to countries like France or Greece,which excel in consumers’ PDO logo recognition. For Slovakia and the Czech Republic whoserandom effects are around 0.65, the corresponding odds ratio is 1.91 or almost double the oddsof recognising the PDO logo. The exciting story to tell out of the regional effects is outside thespace limits and scope of the present work. The interested reader can observe the panel (b) ofFigure 1. Thus, hypothesis 11 is accepted especially for those countries and regions whoseestimated country and region random effects are statistically different from 0.
5. Conclusions and discussionThe introduction chronicled the recommendation of the European Court of Auditors’ (2011,paragraph 65) to the Commission of the EU for building “a clear strategy on how to raiseawareness”. The classification of European consumers is a baseline and starting point forcreating such a strategy. Each one of the hypotheses provides material and ideas fordiscussion. However, there are three “take-home messages” useful in designing futureawareness-raising efforts. First, consumers are highly fragmented to numerous segments.This fact calls for more targeted and “tailor-made” reaching-out activities. Second, thesegmentation requires multiple tools and methods and an increase in European collaborativeactivities. Third, quality products and their labels and logos already face and should continueto look out on new challenges.
The numerous consumer segments are evident by observing the alluvial diagrams ofFigure 2. These diagrams portray the concurrent relationship between PDO logo recognition,Internet use and other personal characteristics.
The panel at the top left utilises the full sample of 110,000 respondents and is indicative ofthe real opportunities to enlarge the “logo awareness” segment. From the segment of the19,942 well-educated respondents, 18,608 use the Internet frequently or infrequently. The toplight and dark grey alluvials connecting, from left to right, the “Very High” educationcategory to the Internet “Yes” use category depict this relation. From those 18,608respondents, 15,570 (84%) did not recognise the PDO logo as illustrated by the grey alluvialconnecting the “Very High” education category to the “Yes” Internet category and the “No”logo recognition category. These 15,570 respondents form a suitable segment to be targetedby promotion efforts aiming to increase logo recognition. Almost 6,000 (38%) of theserespondents live in Sweden, Denmark, Finland and The Netherlands, and 10% live in France,Italy, Spain, Greece and Portugal. As a result, it is plausible to think of reaching out effortsbased on collaborative activities between south-European producers that will aim to targetthe Scandinavian educated and Internet-literate consumer.
The plethora of segments and evidence provided by this work should make marketingdesigners reconsider the marketing research methods and tools for reaching out to theEuropean consumer. Almost a quarter of the European consumers never use the Internet, andthis proportion is highly variable amongst countries. Thus, conventional information
Protecteddesignations of
origin
13

dissemination tools ormarketing researchmethods can have a place alongside Internet-basedtools. In the top-left panel of Figure 2, there is a very small dark grey alluvial of 692respondents connecting the “Basic” education category with the “No” Internet use and the“Yes” PDO logo recognition category. Similar to this, at the top-right panel of Figure 2, a verysmall alluvial (dark grey alluvial) captures 158 “low” quintile income respondents who do not
Figure 1.Predicted randomeffects
BFJ123,13
14

Figure 2.Segments of logo-
aware and non-awareconsumers
Protecteddesignations of
origin
15
have access to the Internet but they recognise the PDO logo. These two groups of respondentsbehave “against the odds” of this work’s classification rules. It may be very informative toknow the conditions which defy the odds for two reasons. First, to guide the design of verytargeted awareness-raising campaigns and second, to support the make-up of marketresearch focus groups with “outliers”. The panel at the bottom left of Figure 2 unfolds somelogo recognition segments of the price-sensitive respondents. One explanation is that theprice-sensitive consumer usually shops at outlets that do not hold a large number and varietyof PDO products. So, the chance to be exposed to the PDO logo through actual shopping issmall. In this case, marketing efforts should consider targeting directly discount and similaroutlets rather than the consumer.
Finally, evidence from this work shows that food miles-sensitive consumers are morelikely to be PDO logo aware. Nevertheless, food-mile-thoughtful consumers may beconsumers of local or of distant PDO products. In the first case, logo awareness will have apositive effect on purchasing decisions. However, in the case of the distant consumer, PDOlogo awareness may prevent purchase. Marketing efforts should face this challenge byreforming the PDO logo to a sustainability and climate change friendly assurance label andcalling attention to the low total carbon footprint of local products and their support to thenatural environment and the rural landscape. In general, quality food labelling and thevoluntary or compulsory use of logos together with the emergence and growth of manyalternative food supply chains should meet consumer concerns about the environment,climate change and a range of ethical or political issues spanning over fair trade, workconditions, animal welfare and the political economy of local and rural development.
This work categorised European consumers as concerns their PDO logo awareness. Atotal of four consecutive Eurobarometer surveys from 2012 to the end of 2017 drawing up acumulative sample of over 110,000 European consumers reaffirm the indisputably lowrecognition rates in comparison to organic and Fair Trade logos. This work revealed thesignificant demographic, human capital, socio-economic characteristics, price considerationsand attitudes that differentiate aware from non-aware consumers. It also exposed theinfluence of geography on awareness, in terms of country and region effects.
References
Albuquerque, T., Oliveira, M.B. and Costa, H. (2018), “25 years of European Union (EU) qualityschemes for agricultural products and foodstuffs across EU Member States”, Journal of theScience of Food and Agriculture, Vol. 98, pp. 2475-2489, doi: 10.1002/jsfa.8811.
AND-International (2012), “Value of production of agricultural products and foodstuffs, wines, aromatisedwines and spirits protected by a geographical indication (GI)”, External study financed by theEuropean Commission, available at: https://ec.europa.eu/agriculture/external-studies/value-gi_en.
Anselmsson, J., Bondesson, N.V. and Johansson, U. (2014), “Brand image and customers’ willingness topay a price premium for food brands”, The Journal of Product and Brand Management, Vol. 23No. 2, pp. 90-102, doi: 10.1108/JPBM-10-2013-0414.
Aret�e, Research and in Economics, Consulting (2013), “Study on assessing the added value of PDO/PGI products”, External study financed by the European Commission, available at: https://ec.europa.eu/agriculture/external-studies/added-value-pdo-pgi_en.
Arfini, F. and Capelli, M. (2009), “The resilient character of PDO/PGI products in dynamic foodmarkets”, Paper Presented at the 113th EAAE Seminar “A Resilient European Food Industryand Food Chain in a Challenging World”, 3-6 September, Chania, Crete, available at: https://www.researchgate.net/publication/46473227_The_resilient_character_of_PDOPGI_products_in_dynamic_food_markets.
Cei, L., Defrancesco, E. and Stefani, G. (2018), “From geographical indications to rural development: areview of the economic effects of European union policy”, Sustainability, Vol. 10, p. 3745, doi: 10.3390/su10103745.
BFJ123,13
16

Deselnicu, O., Costanigro, M., Souza-Monteiro, D.-M. and McFadden, D.-T. (2013), “A meta-analysis ofgeographical indication food valuation studies: what drives the premium for origin-basedlabels?”, Journal of Agricultural and Resource Economics, Vol. 38 No. 2, pp. 204-219, doi: 10.22004/ag.econ.158285.
European Commission (2012), “Europeans’ attitudes towards food security, food Quality and thecountryside”, Wave EB77.2, Report, Special Eurobarometer 389, available at the EuropeanCommission’s Public Opinion Portal at: http://ec.europa.eu/commfrontoffice/publicopinion/index.cfm/Survey/getSurveyDetail/search/389/surveyKy/1054.
European Commission (2014), “Europeans, agriculture and the common agricultural policy (CAP)”,Special Eurobarometer 410, Wave EB80.2, Report, available at the European Commission’sPublic Opinion Portal at: http://ec.europa.eu/commfrontoffice/publicopinion/index.cfm/Survey/getSurveyDetail/search/410/surveyKy/1081.
European Commission (2016), “Europeans, agriculture and the CAP”, Special Eurobarometer 440,Wave EB84.2, Report, available at the European Commission’s Public Opinion Portal at: https://ec.europa.eu/commfrontoffice/publicopinion/index.cfm/Survey/getSurveyDetail/search/410/surveyKy/2087.
European Commission (2017), “Attitudes of European citizens towards the environment”, SpecialEurobarometer 468, Wave EB88.1, Report, available at the European Commission’s PublicOpinion Portal at: https://ec.europa.eu/commfrontoffice/publicopinionmobile/index.cfm/Survey/getSurveyDetail/surveyKy/2156.
European Commission (2018), “Europeans, agriculture and the CAP”, Special Eurobarometer 473,Wave EB88.4, Report, available at the European Commission’s Public Opinion Portal at: https://ec.europa.eu/commfrontoffice/publicopinion/index.cfm/Survey/getSurveyDetail/search/410/surveyKy/2161.
European Court of Auditors (2011), “Do the design and management of the geographical indicationsscheme allow it to be effective?”, Special report No 11/2011 (pursuant to Article 287(4), secondsubparagraph, TFEU), available at: http://register.consilium.europa.eu/doc/srv?l5EN&f5ST%2017245%202011%20INIT.
Grunert, K.G. and Aachmann, K. (2016), “Consumer reactions to the use of EU quality labels on food products: areview of the literature”, Food Control, Vol. 59, pp. 178-187, doi: 10.1016/j.foodcont.2015.05.021.
Hassan, D., Monier-Dilhan, S. and Orozco, V. (2011), “Measuring consumers’ attachment togeographical indication”, Journal of Agricultural and Food Industrial Organisation, Vol. 9No. 1, doi: 10.2202/1542-0485.1335.
Hox, J., Moerbeek, M. and van de Schoot, R. (2017), “Multilevel analysis”, in The QuantitativeMethodology Series, 3rd ed., Routledge, New York.
Jantyik, L. and T€or€ok, �A. (2020), “Estimating the market share and price premium of GI foods—the caseof the Hungarian food discounters”, Sustainability, Vol. 12, p. 1094, doi: 10.3390/su12031094.
Kaczorowska, J., Rejman, K., Halicka, E., Szczebyło, A. and G�orska-Warsewicz, H. (2019), “Impact offood sustainability labels on the perceived product value and price expectations of urbanconsumers”, Sustainability, Vol. 11, p. 7240, doi: 10.3390/su11247240.
Leufkens, D. (2018), “The problem of heterogeneity between protected geographical indications: ameta-analysis”, British Food Journal, Vol. 120 No. 12, pp. 2843-2856.
Likoudis, Z., Sdrali, D., Costarelli, V. and Apostolopoulos, C. (2016), “Consumers’ intention to buyprotected designation of origin and protected geographical indication foodstuffs: the case ofGreece”, International Journal of Consumer Studies, Vol. 40, pp. 283-289, doi: 10.1111/ijcs.12253.
London Economics (2008), “Evaluation of the CAP policy on protected designations of origin (PDO) andprotected geographical indications (PGI)”, External study financed by the European Commission,available at: https://ec.europa.eu/agriculture/evaluation/market-and-income-reports/2008-pdopgi_en.
Olmsted, L. (2016), Real Food/Fake Food, Algonquin Books of Chapel Hill, Chapel Hill, North Carolina,ISBN-13: 978-1616207410.
Protecteddesignations of
origin
17

P�ıcham, K. and Sko�rpa, L. (2018), “Preference to food with a regional brand”, Quality, Vol. 19 No. 162,pp. 134-139.
Riivits-Arkonsuo, I., Leppiman, A. and Hart�senko, J. (2016), “Quality labels in Estonian food market.Do the labels matter?”, Agronomy Research, Vol. 14 No. 3, pp. 896-906.
Ruiz, X.F.Q., Forster, H., Penker, M., Belletti, G., Marescotti, A., Scaramuzzi, S., Broscha, K., Braito, M.and Altenbuchner, C. (2018), “How are food Geographical Indications evolving? – an analysis ofEU GI amendments”, British Food Journal, Vol. 120 No. 8, pp. 1876-1887, doi: 10.1108/BFJ-02-2018-0087.
Sad�ılek, T. (2019), “Consumer preferences regarding food quality labels: the case of Czechia”, BritishFood Journal, Vol. 121 No. 10, pp. 2508-2523, doi: 10.1108/BFJ-03-2019-0150.
Sad�ılek, T. (2020), “Utilisation of food quality labels included in the European union quality schemes”,International Journal on Food System Dynamics, Vol. 11 No. 1, pp. 72-83, doi: 10.18461/ijfsd.v11i1.40.
Skubic, M., Erjavec, K. and Klop�ci�c, M. (2019), “Consumer awareness of PDO-labelled food inSlovenia”, Italian Journal of Animal Science, Vol. 18 No. 1, pp. 366-371, doi: 10.1080/1828051X.2018.1530959.
Tregear, A. (2007), “Proximity and typicity: a typology of local food identities in the marketplace”,Anthropology of Food, No. S2, [Online]. doi: 10.4000/aof.438.
Verbeke, W., Pieniak, Z., Guerrero, L. and Hersleth, M. (2012), “Consumers’ awareness and attitudinaldeterminants of European Union quality label use on traditional foods”, Bio-based and AppliedEconomics, Vol. 1 No. 2, pp. 213-229, (online), ISSN 2280-6172.
Wieseke, J., Lee, N., Broderick, A., Dawson, J. and van Dick, R. (2008), “Multilevel analyses inmarketing research: differentiating analytical outcomes”, Journal of Marketing Theory andPractice, Vol. 16 No. 4, pp. 321-339.
Corresponding authorDimitris Skuras can be contacted at: [email protected]
For instructions on how to order reprints of this article, please visit our website:www.emeraldgrouppublishing.com/licensing/reprints.htmOr contact us for further details: [email protected]
BFJ123,13
18