consumer trends - bord iascaigh mharaand,events/jonathan,banks.pdf · consumer trends jonathan...
TRANSCRIPT


4 7 7 7
5
11 12 13
26
2
1 1 2 6
1 0 1
0 Inflation
Unemployment
Are we happy?
5.7
7.8 8.0 8.9
10.5 11.8 13.4
25.8 Misery Index
Sources: Haver Analytics/The Economist March 2014/CSO Ireland
11.9

Consumer Confidence Index
124
115
114
111
110
110
109
105
105
102
101
100
Indonesia
India
Philippines
China
UAE
Brazil
Thailand
Hong Kong
Denmark
Peru
Saudia Arabia
New ZealandSource: Nielsen Global Online Survey Q4 2013
77

Wealth and life expectancy...
IndiaIndonesia
China
Brazil
MexicoMalaysia
Korea
JapanR
2 = 0.91
0
5
10
15
20
25
30
35
69 71 73 75 77 79 81 83
Life expectancy
GD
P $
k p
er
cap
ita (
PP
P)
R² = 0.63
45
50
55
60
65
70
75
80
85
0 10000 20000 30000 40000 50000 60000
Source: CIA 2014
Life e
xpecta
ncy a
t bir
th
Per capita GDP (PPP)

The growth of modern retailing and economic development are highly correlated
GD
P P
er
Capita,
US $
Modern Format Retailing
India Indonesia
Malaysia
Thailand Philippines
Korea
Argentina
Taiwan
Singapore
U.K.
Germany
France
Brazil
33% 66% 100%
China

Evolution of formats in Europe
14% 15% 16% 17% 18% 19% 20% 22% 23% 24% 26% 27% 28% 29% 30% 31% 32% 32% 33% 34% 34% 35% 35% 35% 35% 36% 36% 36% 36% 12% 12%
13% 13% 15% 16%
17% 18%
19% 19% 20% 20%
21% 21% 21% 21% 22% 22% 22% 22% 23% 23% 22% 22% 23% 23% 23% 24% 24%
25% 26%
26% 27%
26% 25% 25%
25% 24%
25% 25%
26% 26% 26% 26%
27% 27% 27% 27% 27% 26% 27% 27% 28% 28% 28% 27% 28% 28%
22% 22%
21% 21%
21% 21% 20%
19% 19%
18% 17%
16% 16% 15% 15% 14% 14% 13% 12% 12% 12% 12% 11% 11% 10% 10% 10% 10% 9%
26% 25% 23% 22% 20% 19% 18% 16% 15% 14% 12% 10% 9% 8% 8% 7% 6% 6% 5% 5% 5% 4% 4% 4% 4% 3% 3% 3% 3%
1980 1981 1982 1983 1984 1985 1986 1987 1988 1989 1990 1991 1992 1993 1994 1995 1996 1997 1998 1999 2000 2001 2002 2003 2004 2005 2006 2007 2008
Trad Supret SSM LSM HMSource: Nielsen

Convenient to get to
Good value for money
Everything I need in the one shop
Display of products
Always wellstocked
High quality brandsWide range of well known brands
High quality prepared meal
Attractive andinteresting
promotions
Easy to quickly find
Low Price
Clean and hygienic Ease of parking
High quality fresh food
Efficient checkout countersPrivate
Labels
Loyalty Programs
Long opening hours
Wide range of freshmeat & fish
Page 7
Subliminal
Say it, mean it
Low
discriminators
High
DER
IV
ED
IM
PO
RTA
NC
E
High STATED IMPORTANCE
Low
Say it, don’t
mean it
23 attributes that differentiate
Source: Nielsen ShopperTrends GB

Discounters
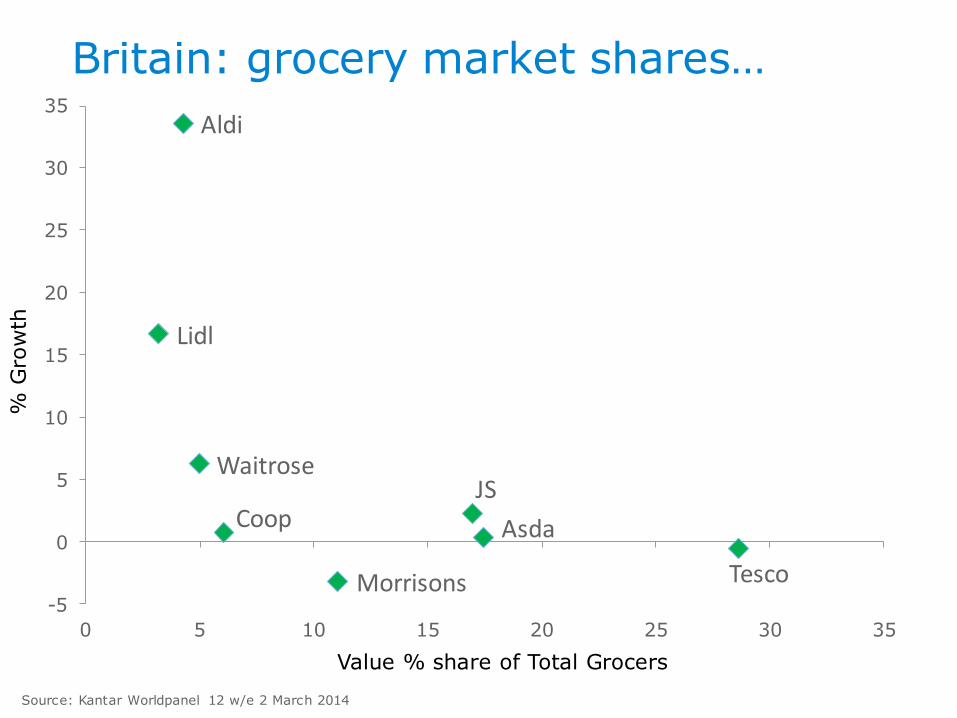
Britain: grocery market shares…
Source: Kantar Worldpanel 12 w/e 2 March 2014
-5
0
5
10
15
20
25
30
0 5 10 15 20 25 30
% G
row
th
Value % share of Total Grocers
Tesco
Asda
JS
Morrisons
Aldi
Lidl
Waitrose
Coop
-5
0
5
10
15
20
25
30
35
0 5 10 15 20 25 30 35

Consumer confusion
• “Salad options are less fattening”
• “Organic (Bio) is better for me”
• “GM is bad for me”
• “Banning ads to kids will reduce obesity”
• “I’m too busy to eat/exercise properly”
• “Vegetarian options are healthier”
• “I need to eat more fruit and veg, but:
–an apple contains 4 tsp of sugar
–a third of all produce contains pesticide residue
–the fruit looks unappetising”
• “If it’s cheap it must be rubbish”
• “Moving food half-way round the world is wrong”
• “Fair trade can only be a good thing”


Consumer confusion

Source: The Daily Telegraph UK 16/9/12


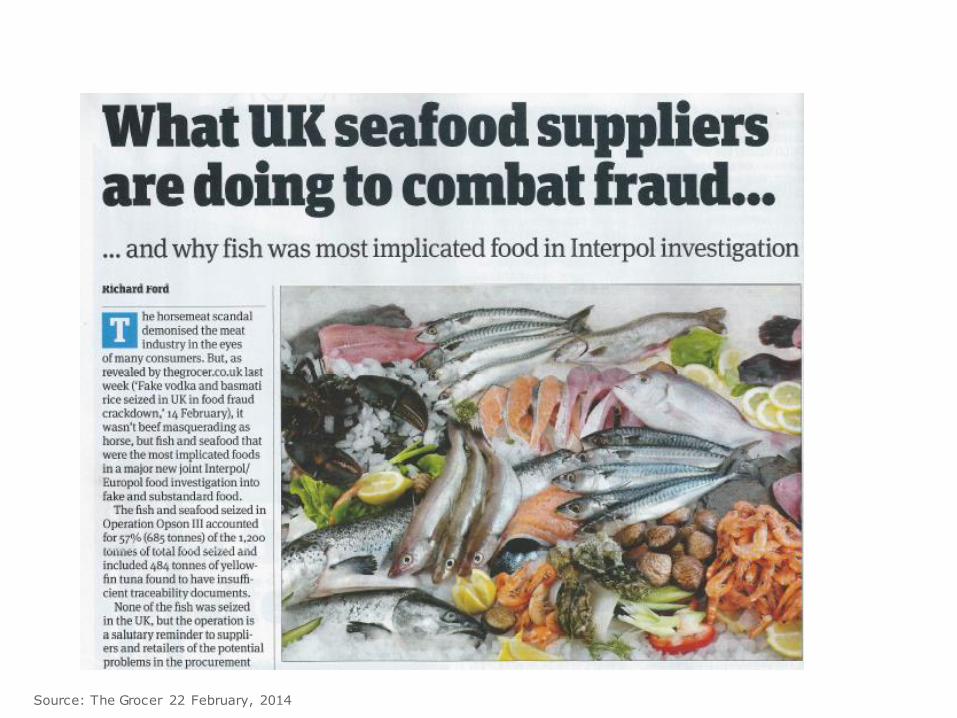
Source: The Grocer 22 February, 2014

On average, how often do you eat fish (including seafood)?
3.3
3
2.9
2.8
2.8
2.7
2.6
2.6
2.3
2.3
2.1
1.9
1.9
1.7
1.7
1.7
1.7
Philippines
Malaysia
Singapore
Portugal
Thailand
Hong Kong
Indonesia
Japan
Spain
Taiwan
Vietnam
China
Norway
Denmark
South Korea
Russia
UAE
1.4
1.3
1.3
1.3
1.3
1.3
1.3
1.2
1.2
1.2
1.2
1.1
1.1
1.1
1
0.9
0.8
Latvia
Belgium
Brazil
Chile
NZ
Switzerland
Venezuela
Canada
Turkey
US
Colombia
Netherlands
Czech
Pakistan
Argentina
India
Hungary
Source: Nielsen Global Online Survey 2008
Occasions per week
Global average 1.6
1.6
1.5
1.5
1.5
1.5
1.5
1.5
1.5
1.5
1.5
1.4
1.4
1.4
1.4
1.4
1.4
1.4
Israel
France
Ireland
Italy
Poland
Sweden
UK
Estonia
Lithuania
Egypt
Australia
Austria
Finland
Germany
Greece
Mexico
S Africa
100
110
120
130
140
150
160
170
180
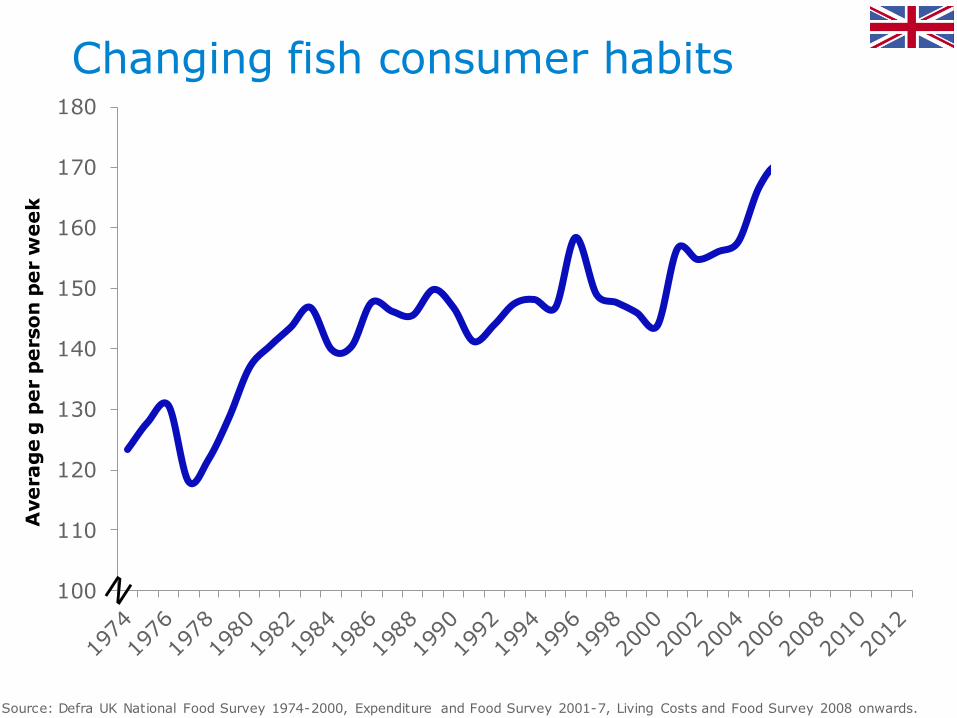
Changing fish consumer habits
Source: Defra UK National Food Survey 1974-2000, Expenditure and Food Survey 2001-7, Living Costs and Food Survey 2008 onwards.
Total fish
Avera
ge g
per
pers
on
per
week

Long term consumption changes
9
11
13
15
0
400
800
12001
974
19
76
19
78
19
80
19
82
19
84
19
86
19
88
19
90
19
92
19
94
19
96
19
98
20
00
20
02
20
04
20
06
20
08
20
10
20
12
Avera
ge g
per
pers
on
per
week
Fis
h %
sh
are
of p
rote
in
Meat
Fish
Source: Defra UK National Food Survey 1974-2000, Expenditure and Food Survey 2001-7, Living Costs and Food Survey 2008 onwards.

1,768 1,824 1,872 1,960 2,032
609 598 567 598 645 821 815 842 840 849
2,040 2,098 2,259 2,395 2,536
1,598 1,622 1,686
1,734 1,814
-
1,000
2,000
3,000
4,000
5,000
6,000
7,000
8,000
9,000
2009 2010 2011 2012 2013
£m
reta
il s
ale
s v
alu
e
Source: Kantar Worldpanel
Beef
Fish
Poultry
Pork
Lamb
Robust competition from other proteins

Changing fish consumer habits
0
10
20
30
40
50
60
Ave
rage
g/p
ers
on
/we
ek
Ready meals
Take away fish
Salmon
White fish
Source: Defra UK National Food Survey 1974-2000, Expenditure and Food Survey 2001-7, Living Costs and Food Survey 2008
onwards
0
10
20
30
40
50
601974
1976
1978
1980
1982
1984
1986
1988
1990
1992
1994
1996
1998
2000
2002
2004
2006
2008
2010
2012
Ready meals
White fish
Salmon
Shellfish
Takeaway fish
Avera
ge g
per
pers
on
per
week

Spend looks better than tonnage
705 721 749 760 766
187 192 181 181 192
705 709 755 793 856
0
200
400
600
800
1,000
1,200
1,400
1,600
1,800
2,000
2009 2010 2011 2012 2013
Wet/Smoked Fish
Shellfish
Frozen Fish£m
reta
il s
ale
s v
alu
e
Source: Kantar Worldpanel

Private Label evolution: brand architecture
Basic
Regular
Premium Better for you
Better for the planet
Health & Wellness
Value for
money
Responsible consumption


80% of CEO’s believe their brand provides a superior customer experience
8% of their customers agree
Source: Bain & Company

How much do you agree with the following statements?
31%
32%
31%
40%
39%
37%
I would prefer to do business withcompanies that implemented
programs to give back to society
I would prefer to work for a companythat implemented programs to give
back to society
I would prefer to invest in companiesthat implemented programs to give
back to society
Source: Nielsen Global Online Survey October 2009:
Base: those who think it important that companies implement programs that contribute to improving society
Agree
strongly Agree

Closing thought: Profits, people, planet...
“It is not your duty to finish the work, but neither are you free to neglect it.”
Source: Rabbi Tarfon, Pirke Avot, The Talmud