consumer perceptions of the fast food...
TRANSCRIPT
CONSUMER PERCEPTIONS OF THE FAST FOOD INDUSTRY IN SWEDEN.
A QUANTITATIVE RESEARCH STUDY
by Aytan Mammadli
A thesis is submitted to Graduate faculty of
The School of Economics and Management
Department of Business Administration
LUND UNIVERSITY
In
Partial Fulfillment of the Requirements
For the degree of
Master of Science in Management
August, 2016

ACKNOWLEDGEMENT
I was successful in completing this research study thanks to a few amazing people who
encouraged me, listened to my worries with their heart and supported me along the way. I give
my sincere thanks to my research advisor professor Stein Kleppesto who provided incredible
support, generosity of time and constant encouragement throughout my academic journey. His
patience granted me the opportunity to complete my study. He was always available for guidance
and thoughtful feedback. His wisdom, kindness and patience are a few of his admirable traits and
I cannot thank him enough for all his support.
I also want to extend my appreciation to my family and friends. Especial thanks to my mom,
grandma Irina, to Mahmoud, Seva and Amira for their endless love and constant support.
Table of Contents
List of Tables ............................................................................................................................... i
List of Figures ............................................................................................................................. i
Abstract ...................................................................................................................................... ii
Chapter 1. Introduction ............................................................................................................. 1
1.1 Background of the Study ....................................................................................................... 1
1.2 Problem Statement ................................................................................................................ 2
1.3 Significance of the Study ...................................................................................................... 3
1.4 Purpose of the Research ........................................................................................................ 4
1.5 Research Questions ............................................................................................................... 4
Structure of the Thesis ................................................................................................................. 5
Chapter 2. Literature Review .................................................................................................... 6
2.1 Classification of Restaurants ................................................................................................. 6
2.2 Fast Food Industry ................................................................................................................. 8
2.3 Relationship Marketing Paradigm. Customer Satisfaction and Retention .......................... 11
2.4 Research Gap ....................................................................................................................... 13
Chapter 3. Methodology ........................................................................................................... 15
3.1 Research design ................................................................................................................... 15
3.2 Data Collection .................................................................................................................... 16
3.2.1 Survey ....................................................................................................................... 16
3.3 Validity of the Research ...................................................................................................... 17
3.3.1 External Validity .............................................................................................................. 17
3.3.1.1 A Researcher’s Bias .............................................................................................. 18

3.3.1.2 Participants’ Bias ................................................................................................. 19
3.3.2 Internal Validity ............................................................................................................... 19
3.4 Reliability of the Research .................................................................................................. 20
3.5 Generalizations .................................................................................................................... 20
3.6 Data Analysis ...................................................................................................................... 21
3.7 Limitations .......................................................................................................................... 21
3.8 Ethical considerations ......................................................................................................... 22
Chapter 4. Findings and Discussion ........................................................................................ 23
Demographics of Participants ................................................................................................... 23
Consumer Behavior ................................................................................................................... 24
Restaurant Selection Criteria ..................................................................................................... 26
Likert Scale Calculation Method ............................................................................................... 28
Customer Satisfaction Level ..................................................................................................... 28
Implications for Improvement ................................................................................................... 32
Chapter 5. Conclusion .............................................................................................................. 33
5.1 Managerial Implications ...................................................................................................... 34
5.2 Recommendations for Future Research .............................................................................. 35
References ................................................................................................................................. 36
Appendix A: Survey Questions ................................................................................................. 43
i
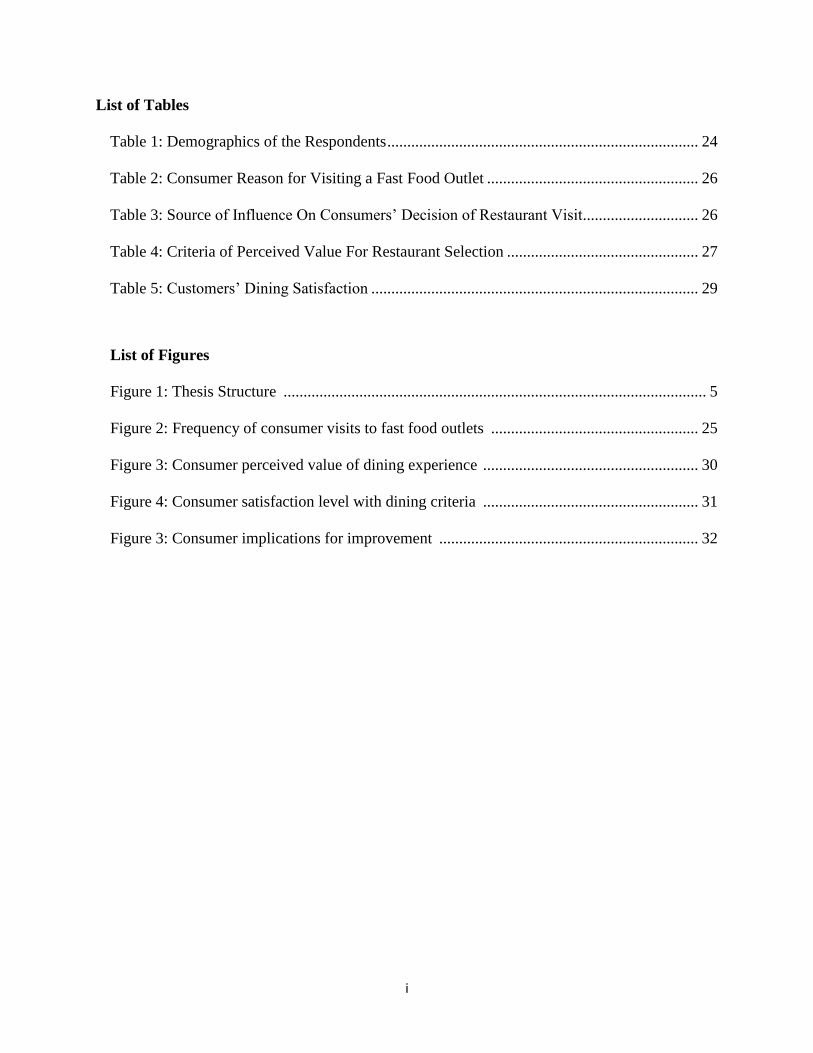
List of Tables
Table 1: Demographics of the Respondents .............................................................................. 24
Table 2: Consumer Reason for Visiting a Fast Food Outlet ..................................................... 26
Table 3: Source of Influence On Consumers’ Decision of Restaurant Visit............................. 26
Table 4: Criteria of Perceived Value For Restaurant Selection ................................................ 27
Table 5: Customers’ Dining Satisfaction .................................................................................. 29
List of Figures
Figure 1: Thesis Structure .......................................................................................................... 5
Figure 2: Frequency of consumer visits to fast food outlets .................................................... 25
Figure 3: Consumer perceived value of dining experience ...................................................... 30
Figure 4: Consumer satisfaction level with dining criteria ...................................................... 31
Figure 3: Consumer implications for improvement ................................................................. 32

ii
ABSTRACT
The fast food industry is one of the important and growing segments of the overall
restaurant industry. At the same time, it is a very dynamic and competitive business where too
many vendors are chasing too few clients. To maintain sustainable growth and long-term success
it is crucial to meet consumer needs and offer value to them. In order to achieve this, fast food
providers must first evaluate customer satisfaction level to determine the extent of satisfaction
with given products and services, as well as identify the key attributes of value for consumers
and evaluate consumer behavior. Eventually, satisfaction with market transaction leads to repeat
purchases which benefits the business operators and helps to build loyal consumer base.
This paper seeks to investigate perception of the fast food industry by exploring
consumer behavior, determining key attributes of perceived value and by assessing customer
satisfaction level.
To successfully achieve the purpose of the study a quantitative research design was
applied to collect the data. I entailed utilizing the survey method which was used to collect the
statistical evidence regarding the objects of the study.
The results revealed that consumers of local fast food outlets are overall satisfied with
their fast food restaurant experience. The primary purpose of a visit to a fast food outlet is for
social activities such as friends get together, for convenience or for change and fun. Additionally,
consumers exhibited high importance towards certain attributes such as quality and nutritional
value of products, cleanliness and hygiene of the dining premise, quality and speed of the service
handling, menu variety were amongst perceived important value attributes.
Consequently, it is recommended that fast food providers focus on the key attributes of
value for consumers and systematically review the customer needs and expectations in order to

iii
increase customer satisfaction and deliver value. Moreover, for maintaining loyal consumer base
and increasing customer retention, it is important to direct resources towards improving and
strengthening the relationship marketing strategy.
Keywords: quick service restaurants; fast food industry; consumer behavior; consumer
perceptions; attributes of perceived value; customer satisfaction.

1
CHAPTER 1. INTRODUCTION
This chapter provides a summary of the thesis. The chapter begins with the background
of the study, followed by the problem statement, the significance of the research, the purpose of
the study, and research questions. The chapter concludes with the structure of the thesis.
1.1 BACKGROUND OF THE STUDY
Restaurant and hospitality industry is undoubtedly one of the significant industries in the
Swedish economy. It is reported that in Sweden restaurant industry generates over 56 billion
Swedish kronas in annual turnover, and employs over 75,000 people (The Local, 2006).
However, this number rose to 117 billion kronas in December, 2015 (SCB, 2015). As Stockholm
is Sweden’s capital city, it dominates the industry. The report indicates that on average a person
spends 6,196 kronas per year for dining-out while in Stockholm this number rises to 10,146
kronas per person. Fast food restaurants make up the significant share of the overall restaurant
industry. In March of 2016, the Swedish Statistics Bureau reported that for the corresponding
month fast food restaurants observed a rise in volume of sales by 9.1% while another segment of
restaurants such as hotel restaurants experienced an increase of 3.6% and entertainment
restaurants only experienced a 1.6% increase in sales. Clearly, fast food is one of the profitable
and growing segments of the restaurant industry.
Arguably, the history of the first fast food restaurant in Sweden dates back to 1932 when
a butcher shop owner Oscar Lithell decided to launch a hot dog shop called “Sibylla”. However,
the first international fast food restaurant opened in the country was McDonalds. Its first outlet
opened in Sweden in 1973. Since then many famous international fast food chains such as
Burger King and Subway have opened numerous outlets in the country. Nevertheless, there are

2
also many local varieties of fast food establishments. Founded in 1968, Max’s Hamburgers is the
local nationwide popular family-owned fast food chain with 120 restaurants and 5,400
employees worldwide. It is one of the most profitable restaurant business with 220 million EUR
turnover (Maxburgers.com, 2016). According to the corporation’s statement, it is outperforming
McDonald’s and Burger King in terms of sales volume.
KFC first opened its outlet in Sweden in 1981 but it was closed due to poor profitability.
However, because of raising consumer demands and growing success of the fast food industry it
was reopened in 2015. In the same year, another famous fast food chain Dunkin’ Donuts opened
its first outlet in Sweden. The fast food industry is predicted to grow by expanding their outlets
further, i.e. both chains are predicted to expand their networks. Allegedly, KFC is intended to
increase its outlets across the country and open four to six outlets each year (Euromonitor, 2016).
However, just like in many other successful industries there is also a fierce competition in this
industry. Dynamic business environment and growing competition among market players force
fast food operators to sustain competitive advantage, utilize their resources and enhance their
operation. And one way to achieve that is to constantly strive for improvement, keep up with
changing customer needs, perceptions, habits, and retain market share through a carefully built
marketing strategy.
1.2 PROBLEM STATEMENT
‘As quick-service restaurant (QSR) managers move into the 21st century, they face an
unprecedented challenge: too many food outlets chasing too few patrons’ (Swanger, 1998, p.1).
By the increasing customer demands and expectations, competition among market players gets
even tougher. Furthermore, several studies (Enz, 2010; Parsa, Gregory & Terry, 2011; The
3
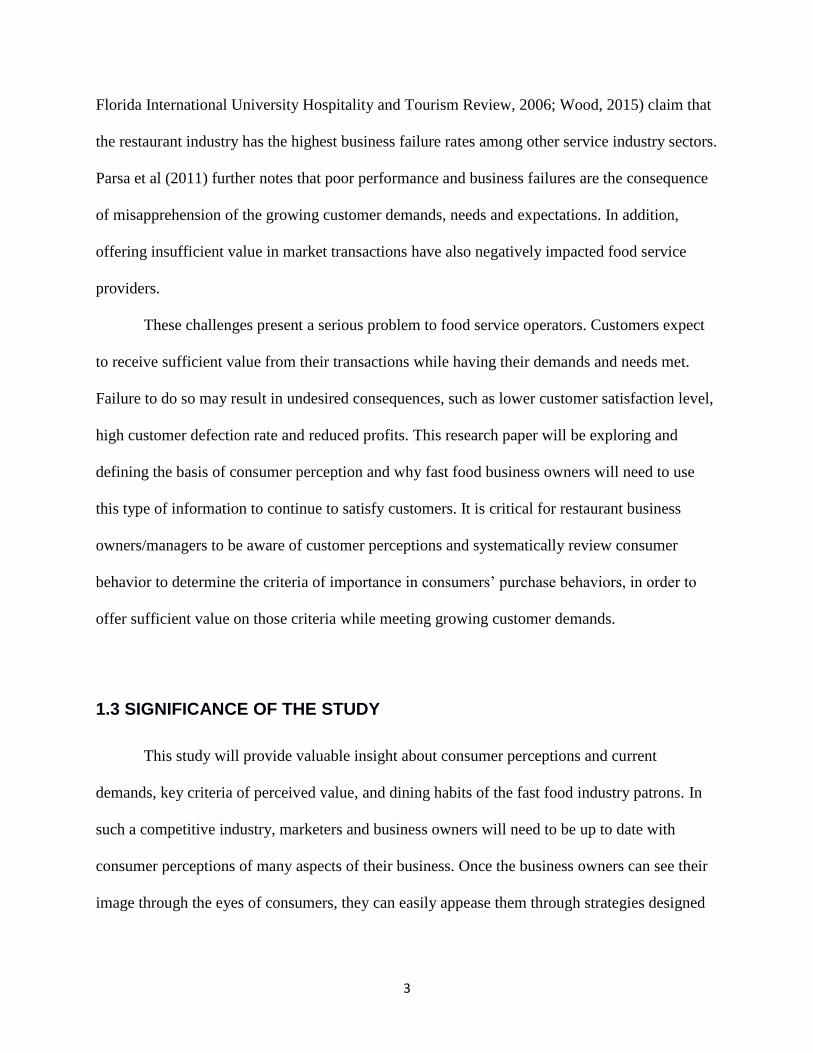
Florida International University Hospitality and Tourism Review, 2006; Wood, 2015) claim that
the restaurant industry has the highest business failure rates among other service industry sectors.
Parsa et al (2011) further notes that poor performance and business failures are the consequence
of misapprehension of the growing customer demands, needs and expectations. In addition,
offering insufficient value in market transactions have also negatively impacted food service
providers.
These challenges present a serious problem to food service operators. Customers expect
to receive sufficient value from their transactions while having their demands and needs met.
Failure to do so may result in undesired consequences, such as lower customer satisfaction level,
high customer defection rate and reduced profits. This research paper will be exploring and
defining the basis of consumer perception and why fast food business owners will need to use
this type of information to continue to satisfy customers. It is critical for restaurant business
owners/managers to be aware of customer perceptions and systematically review consumer
behavior to determine the criteria of importance in consumers’ purchase behaviors, in order to
offer sufficient value on those criteria while meeting growing customer demands.
1.3 SIGNIFICANCE OF THE STUDY
This study will provide valuable insight about consumer perceptions and current
demands, key criteria of perceived value, and dining habits of the fast food industry patrons. In
such a competitive industry, marketers and business owners will need to be up to date with
consumer perceptions of many aspects of their business. Once the business owners can see their
image through the eyes of consumers, they can easily appease them through strategies designed

4
with these conclusions in mind. Moreover, the study will provide recommendations to managers
to enhance their business performance.
1.4 PURPOSE OF THE RESEARCH
The purpose for conducting the study is to investigate the consumer perception of the fast
food industry using survey data from Sweden, in order to enrich the knowledge in this field and
provide recommendations for outlet owners/managers. To live up to the purpose of the study, it
is aimed to assess the overall customer satisfaction level amongst fast food consumers, to
analyze consumer behavior in terms of frequency of restaurant visits, restaurant selection criteria,
sources of immediate influence on customers’ decisions, etc., and to determine key attributes of
perceived value for consumers, e.g., quality of food, variety of menu, etc.
1.5 RESEARCH QUESTIONS
The study investigates the consumer perception of the fast food industry and therefore, will be
guided by the following research questions:
R.Q. 1: What attributes consumers perceive valuable for choosing a dining premise?
R.Q. 2: How satisfied are the customers with their experience of fast food restaurants?
R.Q. 3: What behavior do consumers exhibit in terms of frequency of visits and reasons for
dining in fast food restaurants?
R.Q. 4: What areas need improvement to increase customer satisfaction?
5
Introduction
LiteratureReview
Methodology
Findings
Conclusion
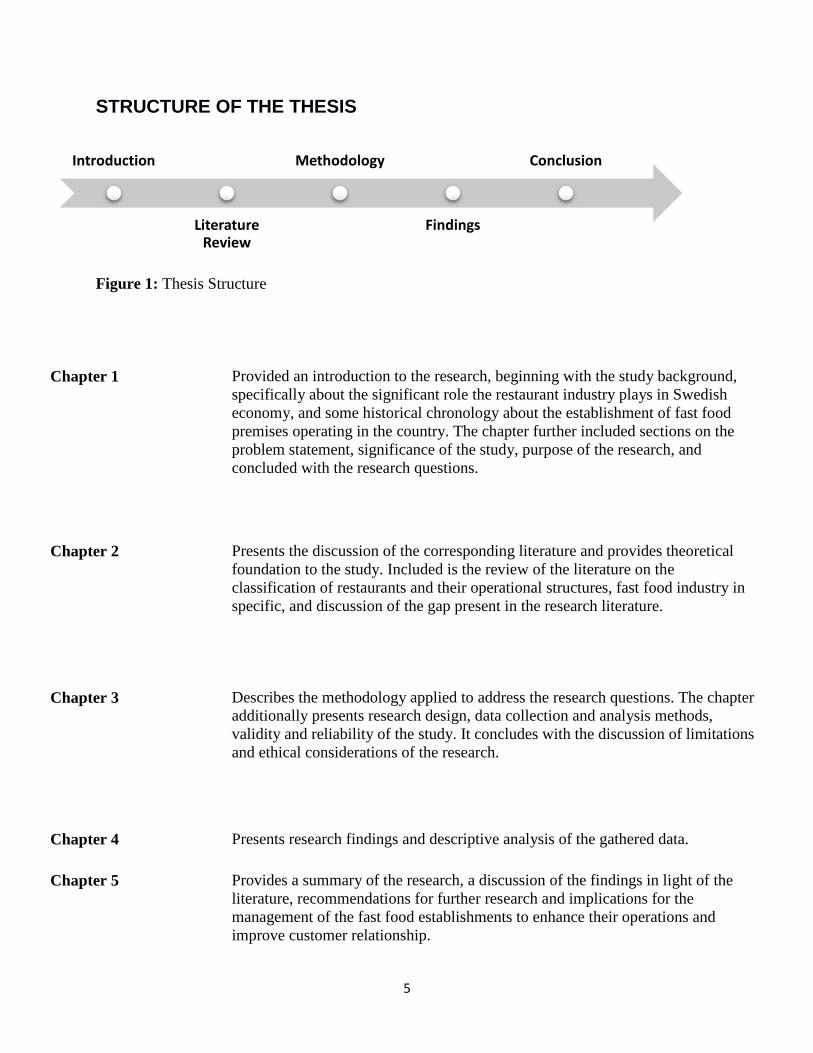
STRUCTURE OF THE THESIS
Figure 1: Thesis Structure
Chapter 1 Provided an introduction to the research, beginning with the study background,
specifically about the significant role the restaurant industry plays in Swedish
economy, and some historical chronology about the establishment of fast food
premises operating in the country. The chapter further included sections on the
problem statement, significance of the study, purpose of the research, and
concluded with the research questions.
Chapter 2 Presents the discussion of the corresponding literature and provides theoretical
foundation to the study. Included is the review of the literature on the
classification of restaurants and their operational structures, fast food industry in
specific, and discussion of the gap present in the research literature.
Chapter 3 Describes the methodology applied to address the research questions. The chapter
additionally presents research design, data collection and analysis methods,
validity and reliability of the study. It concludes with the discussion of limitations
and ethical considerations of the research.
Chapter 4 Presents research findings and descriptive analysis of the gathered data.
Chapter 5 Provides a summary of the research, a discussion of the findings in light of the
literature, recommendations for further research and implications for the
management of the fast food establishments to enhance their operations and
improve customer relationship.

6
CHAPTER 2. LITERATURE REVIEW
This chapter presents a review of the related literature on the research topic. The chapter
begins with the background literature concerning the classification of the restaurants, followed
by the overview of the literature on fast food industry. The chapter further provides a theoretical
foundation and concludes with the discussion of the research gap.
2.1 CLASSIFICATION OF RESTAURANTS
Restaurants differ based on a variety of attributes such as menu style, experiences they
offer, price structures, food quality, service type and atmosphere created on the premises. Wood
& Brotherton (2008) divided the restaurants into two categories: full-service and limited-service
restaurants. Full-service restaurants offer complete table service to customers, whereas, in
limited-service restaurants minimal table service is offered. Full-service restaurant category
includes ‘fine/formal dining (e.g. Michelin-starred restaurants), casual dining (e.g., family
restaurants)’ (Chen, 2014, p. 9), dinner houses, while the limited-service restaurant category is
represented by quick-service restaurants (e.g. fast food restaurants, catering trucks, salad bars),
‘fast-casual dining (e.g. cafés)’ (Chen, 2014, p. 9), cafeterias and buffets. This paper focuses on
the latter category, specifically fast food restaurants.
Fine dining restaurants are upscale dining premises which offer full table service and
target up-market clientele. They provide the highest service level by well-trained serving staff
and meals made of high-quality food ingredients which results in high-priced menu items.
According to Wood & Brotherton (2008) this segment of restaurants sets itself apart with top
class décor and visually appealing food portions.

7
As opposed to fine dining restaurants, literature suggests that, casual dining restaurants
are usually family-friendly establishments which offer full table service, and wide range of menu
selection for moderate prices. The dining environment of the restaurant is casual and relaxed
(Chen, 2014; Wood & Brotherton, 2008)
Conversely, quick-service restaurants (QSR) are characterized by minimum or rare table
service, limited menu choices, and low cost meal options. Bujisic, Hutchinson & Parsa (2014)
describes ‘customer-self-service, low labor costs, finished good inventory, process driven
technology, development of habit forming purchases and advertising effectiveness’ to be among
the unique characteristics of QSRs (p. 1272).
According to literature another major type of restaurant segment is fast-casual dining
premises. Fast casual restaurant is a category between casual and fast food restaurant. It doesn’t
offer full table service. However, it offers food made with higher quality and more nutritious
ingredients than fast food restaurants, and as anticipated, the menu is priced accordingly. But, as
in a fast food restaurant, the customers wait in line to place their orders, pick up their own food
and locate their own sitting table (Albala, 2015; Smith, 2013). Smith (2013) further explains
that, fast casual restaurants usually focus on ethnic foods, salads and bakery products, which has
influenced fast food restaurants to modify their menus to include salads, smoothies, premium
coffee, sandwich wraps and so on.
Besides the various types, restaurants also differ in terms of their legal/operational
structures. Literature classifies restaurants into four types of management/ownership structure,
which are sole proprietorship, partnership, limited liability company (LLC) and corporation;
(Chen, 2014; Parpal, 2015). In a sole proprietor restaurant one person owns and runs the
establishment; partnership restaurants operate based on partnership agreement between two or

8
more individuals; LLCs combine characteristics of partnership and corporation, and governed by
a partnership agreement where one partner is in charge of the establishment while other members
can serve in management board. LLCs are usually comprised of many small to mid-sized or
family-owned restaurants; corporate restaurants are independent legal entities whose operation is
separate from its shareholders. They usually include large chain restaurants or reserved for
franchises. According to Lesonsky (2012) and Cannon (2005) in chain restaurants all of the
locations are owned, and all operations are handled by one parent company through central
management system, whereas, in a franchise structure, a parent company sells the rights to use its
trade name, brand concept and business formula to the investor(s). According to Payne (2014)
quick-service restaurants are usually associated with chain or franchise structure.
2.2 FAST FOOD INDUSTRY
According to Akira & Saunier (2009) industrialization and global capitalism has
encouraged the emergence of a new global cuisine. The implied type of cuisine is fast-food.
Payne (2014) describes fast food as a category of food which is cooked and served within
minimal time. Brehm (2015, p. 288) goes further by suggesting that ‘fast food refers to
inexpensive food that is prepared and served quickly and easily and sold in restaurants and at
snack bars’. A fast food restaurant is a type of quick-service premise that serves fast food cuisine
and provides no table service, though it may provide a seating area (Payne, 2014). Food served
in fast food restaurants is typically prepared in bulk ahead of time and kept warm/cold until
purchased; packaged and served to customer for takeout or take-away. Payne (2014) mentions
that fast food restaurants usually belong to a franchise or restaurant chain, which uses
standardized foods, flavors, cooking methods, and/or partially prepared produces which are

9
shipped to each restaurant from central supply networks to avoid the handling costs, preparation
time, and to ensure the consistency of product quality.
Literature review reveals that modern fast food industry is relied highly on standardized
procedures and production techniques which mainly utilizes on soft technology and requires less
skill (Funnell & Rogers, 2011; Jones, 2002). Numerous research studies indicate that simplicity
of the service, uniformity in terms of content and preparation, consistency of quality and value,
standardization of procedures is the integral part of the success of fast food industry (Croslin,
2010; Funnell & Rogers, 2011; Hogan, 1999; Tannock, 2001). Similar to the findings presented
by other researchers, Croslin (2010) views consistency as a key to customer return in the fast
food industry. His research indicates that customers expect the value and quality of the food to
be consistent in all vendors. Otherwise, the transformative value of the product is lost, and
customer may not return.
Menus in most fast food outlets are usually comprised of burgers, fried potatoes, fried
chicken pieces, sandwiches, carbonated soft drinks, coffee, along with healthier options such as
salads, fruit juices, grilled chicken, and baked potatoes. Food is usually served in plastic or
carton boxes, or paper wrapping in order to reduce the operational costs. This type of packaging
keeps food warm for a longer time, avoids the transfer of bacteria, promotes easy storage and
transportation (Payne, 2014; Schlosser, 2001). According to Smith (2011) and Lodha (2014)
many multinational fast food corporations have modified their menu to match the local dietary
preferences. For instance, vegetarian burgers are offered on menus in India, pork is not served in
Muslim countries, instead halal food is offered to customers, salmon sandwiches appear on
menus in Norway, and a number of fast food restaurants offer kosher items on their menus in
Israel.
10
However, the industry is subject to a passionate and controversial debate. Opponents of
fast food are concerned with its dietary shortcomings while others criticize it for ‘destroying
local culinary values’ (Smith, 2013, p. 625). Some critics associate fast food with less healthy
diet and obesity (Donkersloot, 2002; Etingoff, 2014; Ferry, 2011; Keller, 2008; Schlosser, 2001).
Donkersloot (2002) argues that fast food is not nutritionally balanced, and contains a lot of fat
and calories, which affect our health negatively. Similar to Donkersloot (2002), Keller (2008)
considers that overconsumption of fast food can lead to greater risk of chronic diseases.
However, Johansen (2012) shares the opposite view on the subject, and claims that fast food is
not the only culprit of society’s health issues. According to the author, the industry in general
offers quality products safe for consumption. Additionally, the author considers fast food
industry as a positive force in society which creates many jobs, and revenues towards local
economies. Furthermore, the study conducted by Ferry (2011) indicates that despite all the
criticism, fast food consumption has significantly increased over the years.
Today fast food is a multibillion-dollar industry spread to every corner of the world.
Leading fast food chains such as McDonald’s, Burger King, KFC are multinational businesses
with outlets across the globe (Schlosser, 2001). Schlosser (2001) reports that ‘Americans now
spend more money on fast food than on higher education, personal computers, computer
software or new cars. They spend more on fast food than on movies, books, magazines,
newspapers, videos, and recorded music-combined’ (p. 3). Likewise, Jones (2002) views fast
food industry as an important segment within a state economy: “today the fast food industry
generates large revenues for its providers and a valuable contributor to government income,
economic growth, the balance of payments and employment” (p. 201). Ultimately, these studies
11
reveal the significance fast food industry holds within the global economy and people’s
consumption choices.
2.3 RELATIONSHIP MARKETING PARADIGM. CUSTOMER SATISFACTION
AND RETENTION
Every company is looking for ways of retaining existing customers and attracting new
ones while remaining competitive and profitable. As consumers today have more choices than
ever before, they are more flexible in their decisions, and are always looking for new
experiences. In order to build profitable and lasting relationship with customers, it is important
for the management of the service companies to understand the attributes which customers
perceive as valuable, and consider important when making decisions (Walter, 2011).
Fast food restaurants operate in highly competitive and dynamic environment. Therefore,
in order to survive it is important to gain competitive advantage and long term success. This can
be achieved by maintaining lasting relationships with customers, meeting their needs and
creating value for them (Mason, Jones, Benefield, and Walton, 2011). Relationship Marketing
(RM) (sometimes called ‘customer relationship management’ (Baron, Conway & Warnaby,
2010, p. 5)) is a concept that focuses on attracting, maintaining and enhancing customer
relationships (Brink & Berndt, 2008; Hennig-Thurau & Hansen, 2000; Shaw & Reed, 1999). It is
a new shift in marketing school of thought which emerged in 1980s (Baron, Conway &
Warnaby, 2010). Gronross (1990) who is one of the leading writers and researchers in services
marketing and management, defined the term of relationship marketing as ‘establishing,
maintaining, and enhancing relationship with customers and other partners, at a profit, so the

12
objectives of the parties involved are met. This is achieved by a mutual exchange and fulfillment
of promises’ (p. 138 as cited in Sheth, Parvatiyar & Shainesh, 2008, p.5).
Allison (2010, p. 31) states that relationship marketing underlines the importance of
building long-term relationship with customers as opposed to the individual transaction
perspective, and involves understanding the customers’ needs as they go through the life cycle.
Brink & Berndt (2008) share the similar view and add that RM is designed to provide increased
value to the customer, which ultimately yields a lifetime value for the marketer (p.13).
According to Buttle (1996) RM initiative is particularly suitable for service sectors such as
hospitality, health care, banks, etc.
Across the literature, there is wide agreement on the importance of customer loyalty for
the success of relationship marketing. Many researchers (Brink & Berndt, 2008; Buttle &
Maklan, 2011; Cahill, 2007; Hennig-Thurau & Hansen, 2000; Malekian, 2009; Mason et al.,
2011; Shaw & Reed, 1999) consider the customer loyalty to be the primary target of relationship
marketing. According to Malekian (2009) customer loyalty is very significant element for the
financial wellbeing of a company and ‘potentially the greatest source of competitive advantage’
(p. 6). The researchers claim that customer loyalty brings more certainty and stability to the
business, increases revenues and reduces costs over time, moreover, it is less costly to maintain
already existing customer base than acquiring new ones. A review of literature shows that, in
addition, there are other benefits of customer retention. Brink & Berndt (2008), Malekian (2009)
and Cahill (2007) mention numerous factors that cause loyal customers to be more profitable
than occasional customers. With that being said, the authors indicate that loyal customers tend to
purchase more frequently from the same vendor, they are more likely to provide word-of-mouth
advertising (verbal referral), furthermore, Malekian (2009) adds that loyal customers tend to be

13
more willing to try other products/services offered by a vendor, this group of customers reduce
operational costs- since they are familiar with the brand less expenditure is required on
advertising, moreover, retaining customers increases the market share of a company.
Customer satisfaction is defined to be the key to customer retention and loyalty, and is
one of the main techniques of relationship marketing (Brink & Berndt, 2008; Hennig-Thurau &
Hansen, 2000; Mason et al., 2011; Mckenna, 1993; Velnampy & Sivesan, 2012). Naturally, the
more satisfied and happier the customers, the more sustainable is the relationship. And as long as
this lasts, the business continues to make a profit. McKenna (1993) adds that keeping customers
satisfied, prevents them from switching over to competitors and encourages repeat transactions.
Therefore, in order to be competitive and successful, it is crucial for the companies to be
customer-conscious and to have knowledge about their customers. Ultimately, acquiring and
continuously updating knowledge about customer needs, motivation and behavior helps to
improve business performance. It leads companies to build durable relationship with customers
and deliver high satisfaction (Gronroos, 2007; Mckenna, 1993; Shaw & Reed, 1999).
2.4 RESEARCH GAP
Consumer perceptions has been the subject of increasing interest, especially in the service
industry. An abundance of research has been produced on the subject. Since fast food industry
makes up the significant share of the service industry and the restaurant market, it has been at the
center of attention of scholarly inquiry. The substantial amount of research studies has been
carried out to investigate the service quality, satisfaction factors, perceived value and consumer
behavior in the fast food industry.

14
Mason et al. (2011) have analyzed the consumer perception of quick service restaurants
in the USA. The researchers have studied the behavioral intention of college students. The study
was designed to acquire better understanding of consumer perception of value in quick service
restaurants. However, the findings are limited exclusively to college students and to particular
geographical area.
Similar study was conducted by Goyal & Singh (2007) among young consumers to
explore the consumer perception of fast food restaurants located in India. However, the survey
population was limited only to “young unmarried population” as stated by the authors (Goyal &
Singh, 2007, p.194).
Additionally, Bujisic, Hutchinson & Parsa (2014) analyzed the influence of ambience,
food and service quality on the consumer intention of return in QSRs and upscale dining
premises. Nevertheless, the study focuses only on specific attributes of influence.
Although these studies yield valuable contribution towards literary knowledge, there are
still some limitations, i.e. age group or occupational background of survey population. Therefore,
this study provides valuable insight for the fast food operators in terms of consumer behavior,
perception of value attributes, satisfaction factors from the consumer perspective and moreover,
it contributes to the enrichment of the research literature on this subject. In addition, this study
seeks to include people of different age groups and of different occupational backgrounds.
Moreover, as many countries adhere to varied cultural and philosophical beliefs, consumers will
act and behave different in different settings.
Lastly, despite the significance of this industry within Swedish economy, little research
has been conducted exploring consumer perception of fast food restaurants in Sweden.

15
CHAPTER 3. METHODOLOGY
The purpose of this research was to analyze the key factors that contribute to the success
of fast food industry, to highlight the criteria which consumers value the most while selecting
dining premise, to measure customer satisfaction and to apply the knowledge to enhance
business operation, improve marketing strategies and increase the customer satisfaction and
retention within the fast food industry. The following sections describe the rationale for the
application of methodological procedures used to design the study, to collect and analyze the
data, to determine the sample. Additionally, limitations, validity, reliability and ethical
considerations of the study will be addressed. The research is guided by the following questions:
R.Q. 1: What attributes consumers perceive valuable for choosing a dining premise?
R.Q. 2: How satisfied are the customers with their experience of fast food restaurants?
R.Q. 3: What behavior do consumers exhibit in terms of frequency of visits and reasons for
dining in fast food restaurants?
R.Q. 4: What areas need improvement to increase customer satisfaction?
3.1 RESEARCH DESIGN
Quantitative research design was employed since the primary goal of the paper was to
identify and measure the factors which consumers perceive to be important. It is said that “you
can’t manage what you can’t measure”. In order to manage customer relationship which is a
route to success, it is important to identify and measure its key aspects. Therefore, quantitative
research is best suited for this purpose. It allows collecting information from a large number of
population in a standardized way, which in turn enables the information to be treated, analyzed

16
and interpreted statistically (Nykiel, 2007). Nykiel (2007) justifies the adoption of quantitative
design and claims that it is the most useful approach from a marketing perspective, since it
allows to collect ‘measurable information that can be tracked over time’ (p.55). Therefore,
quantitative research approach was employed as the research seeks to study the behavior, opinion
and attitude of a larger population and generate statistically conclusive results.
3.2 DATA COLLECTION
The research involved two types of data collection method: primary and secondary. The
primary data were collected through the survey and the secondary data were collected from
books, journals, magazines and etc. The two approaches of data collection complement each
other and improve the validity and reliability of the data.
3.2.1 SURVEY
A survey research technique was employed as the primary type of data collection method.
It was used as the major tool to collect quantitative data. The survey contained eleven structured
and close-ended questions. The survey questions were established based on the literature review
and academic publications of the similar nature, i.e. Goyal & Singh, 2007; Mason et al., 2011.
Review of the corresponding literature served as the foundation for establishing, guiding and
utilizing the survey questions. The survey was pilot-tested to assess the clarity, consistency and
quality of the questions. Later, it was distributed to target audience through social media and on-
spot locations such as shopping malls and fast food outlets. One of the advantages of using
survey is that it gives respondents a sense of anonymity which encourages honest and critical
responses (O’Leary, 2010). Moreover, the role of online survey is indispensable in reaching a
17
large number of population. Hence, Google Forms online surveying tool was used by the
researcher. Currently it is one of the widely used survey tools in academia.
The quantitative data were collected for one month, from July 1st, 2016 until August 1st,
2016. Dimensions of the survey questions included the demographic characteristics of
respondents such as their age, current occupation, gender; behavioral intentions, such as
frequency of visiting fast food outlets; overall satisfaction level, and questions related to key
drivers of satisfaction such as restaurant selection criteria, and etc. Data were collected through
multiple choice questions, three and five points Likert type summative rating scale. A sample of
one hundred and fourteen respondents was surveyed based on convenience sampling technique.
The population of this survey was the fast food consumers and the customers of fast food
restaurants.
3.3 VALIDITY OF THE RESEARCH
The quality of a research study is primarily assessed based on two criteria which are
validity and reliability (Bryman & Bell, 2015; Kumar, 2011; Muijs, 2010; Pellissier, 2008; Smart
& Paulsen, 2011). According to Kumar (2011) validity refers to ‘a situation where the findings
of your study are in accordance with what you designed it to find out’ (p. 186). In other words, it
means, whether the research instrument is measuring what it is devised to measure. Validity is
divided into two categories: internal and external.
3.3.1 EXTERNAL VALIDITY
External validity refers to the extent which study's findings are generalizable to an entire
population (Berg & Latin, 2008; Macnee & McCabe, 2008; Smart & Paulsen, 2011). According
to Berg & Latin (2008) to ensure a high degree of external validity, ‘it is important that the
18
subjects be the representatives of the population’ (p. 212). Gathering sufficient data, undertaking
measures to reduce non-response and ensuring standardized procedures for data collection can
assist in reducing the threat to external validity.
It is claimed that the research is externally valid, and it can be generalizable to the entire
population. Because the study collected a considerable amount of data from a large number of
sample who is conceivably a good representation of the target population. Furthermore, in order
to reduce the threat to external validity the researcher has taken several steps towards minimizing
a researcher bias, avoiding non-return of the questionnaire by asking the respondents to fill it out
on the spot, and standardizing the data collection instrument and procedure.
3.3.1.1 A RESEARCHER’S BIAS
Smart & Paulsen (2011) considers that ‘the researcher’s bias needs to be confronted
before claiming to make the valid research” (p. 61). The researcher bias was largely reduced by
the use of the survey, especially online survey as a data collection tool. Since there was no close
interaction between the researcher and the respondents the risk of bias was minimized. Crooks &
Baur (2016, p. 35) argue that ‘filling out a form affords greater anonymity than facing an
interviewer, subjects might be considerably more likely to answer questions honestly, with
minimal distortion … Finally, because most written questionnaires can be evaluated objectively,
their data are less subject to researcher bias than are data from interviews’.
Other step taken towards reducing the researcher’s bias was the randomization of the
survey population. In order to increase the validity of the study, the survey was conducted in
different days and times, and in different locations. To ensure the random selection of survey
population, the researcher approached every customer waiting on the queue line of the outlets.

19
Only those who agreed to take part were given the survey. However, those who were willing to
take part were reminded that if they are under 18, they are not eligible for participation in this
study.
Nevertheless, there is a slight possibility of a researcher bias. It may have been present in
terms of word choice or rephrasing of the questions.
3.3.1.2 PARTICIPANTS’ BIAS
Likewise, there could have been a possibility of participant bias or external factors which
could have affected the effectiveness of the assessment. The participant reluctance of answering
questions honestly for different reasons such as mood, outside influence, or being in a rush could
have decreased the effectiveness of the assessment.
Moreover, there could have been a possibility of different interpretation of “fast food” by
survey population. However, the researcher believes that the consumer understanding of “fast
food” was shaped by the environment surrounding them. Since the survey was distributed
mostly on fast food outlets, it is believed that consumers have the same definition of “fast food”
as intended in the survey by a common sense. Moreover, several examples of fast food were
given on the survey paper in order to reduce the misinterpretations.
3.3.2 INTERNAL VALIDITY
‘Internal validity refers to the confidence we have that the results of a study accurately
depict whether one variable is or is not a cause of another’ (Rubin & Babbie, 2010, p.157).
Threat to independent variable refers to things which can affect or manipulate the results of the
study, i.e. instrumentation changes, historical events, maturity or passage of time-the change in

20
subject’s behavior, attitude or opinion over the time (Macnee & McCabe, 2008; Rubin & Babbie,
2010, etc.).
In order to minimize threats to internal validity of the study, all research participants were
administered the same standardized survey instrumentation. However, there are factors which
might have affected the internal validity that cannot be controlled by the researcher, such as
extraneous events which can affect the opinion of the respondents. However, most of the threat
identified in the research literature doesn’t extensively apply to this study, since it is a short term
study and isn’t of the experimental character.
3.4 RELIABILITY OF THE RESEARCH
Reliability refers to the ability of the study to produce consistent measurement and
replicable results each time (Kumar, 2011; McBride, 2012; Pellissier, 2008). Kumar (2011,
p.186) explains that, ‘when we administer an instrument under the same or similar conditions to
the same or similar population and obtain similar results, we say the instrument is 'reliable' - the
more similar the results, the greater the reliability’. In fact, previous studies which have been
done in a similar setting yielded results more or less similar to the ones obtained from this study.
Therefore, undoubtedly if conducted in similar environments under the same conditions the
similar results can be achieved.
3.5 GENERALIZATIONS
Since the study focused on the restaurant industry, consumer perception of fast food
restaurants, and aspects of customer satisfaction, the findings were generalizable only to similar
settings and hospitality establishments. Choosing Sweden as a study scope and fast food industry
in particular as a research subject was deliberate and explicit. Therefore, generalizations may

21
apply to similar restaurant segmentation, but it may not extend to additional hospitality
establishments or restaurant industry segmentation which operate in opposite setting and within
different environments.
The term “fast food” has been used for particular restaurants in the industry, so a
generalized notion that my survey sample interpreted questions in their intended meaning is
believed. The questions were designed to focus on specific aspects within common fast food
settings.
3.6 DATA ANALYSIS
The data analysis procedure was guided in accordance with quantitative research design.
The raw data were analyzed using IBM SPSS Statistics v.24.0 software. Data collected from on-
spot locations were manually inserted into the data analysis software. Further, both types of data
(online and on-spot survey data) were combined for analysis. Out of 114 sample size only 103
were valid for analysis.
3.7 LIMITATIONS
A few limitations were encountered during the research process. Firstly, the research was
limited to a particular geographical area (south of Sweden) which to some extent affected the
generalizability of the study to similar environments. Second, survey technique was used to
collect the data. However, surveys are generally susceptible to limited number of questions.
Moreover, surveys are incapable of revealing the motives behind the particular behavior or
opinion (Mitchell & Jolley, 2013).

22
3.8 ETHICAL CONSIDERATIONS
This research study was conducted strictly in accordance with ethical standards and
principles. Participation in the study was voluntary and it was carried out with the consent of the
participants. All prospective participants were informed about the nature of the study and they
were reminded that it was optional to take part in the survey. If agreed, they could proceed to
survey questions. The respondents were able to withdraw from participation at any time without
any risk or fear of reprisal.
The survey didn’t require respondents’ personal information such as names, phone
numbers or email addresses. All collected data were stored in the Google Forms survey database
and were kept under password protection. Confidentiality and anonymity of research participants
were maintained at all times.

23
CHAPTER 4. FINDINGS AND DISCUSSION
The research was conducted with customers of fast food restaurants and the results
addressed their patterns of visiting fast food outlets, consumption habits, satisfaction level, main
attributes of influence on their choice of restaurant and perceptions of the industry. The obtained
results outline the behavioural intentions, consumer perception and satisfaction level among the
customers of the fast food industry. The descriptive analysis and results of the survey are
presented in the following subsections. A total of one-hundred and fourteen (114) respondents
were surveyed in this study, however, eleven (11) response papers were eliminated for being
invalid. The data were subjected to statistical analysis to achieve a meaningful outcome.
Demographics of participants
The data was collected in regards with three variables of demographic segmentation of
respondents, i.e. age (18-25 years, 26-35 years, 36-45 years, and 46+ years), gender and occupation
(full-time employed, part-time employed, unemployed, student, and pensioner). Based on the
statistical analysis of the data, it was found that majority of the respondents were males. Out of the
total of 103 respondents 54.4 % were males and 45.6 % were females. A total of 47.6% of respondents
were between the age of 18 and 25, with the following largest group being between age of 26-35 years
(33%), followed by the 36-45 years (12.6 %) and 46+ years (6.8%). In respect to occupation,
unsurprisingly, most of the respondents identified themselves as “student” (40.8 %), while 27.2 %
identified as full-time employed, 22.3 % part-time employed, 8.7% unemployed and only 1%
identified himself as a pensioner (See Table 1). Demographic information is the basis of many
marketing strategies at a macro and micro level so establishing this information first is important.

24
Table 1. DEMOGRAPHICS OF THE RESPONDENTS
Demographics Number of
respondents
Percentage %
Gender Male 56 45.6 %
Female 47 54.4 %
Age
18-25 years 49 47.6 %
26-35 years 34 33 %
36-45 years 13 12.6%
46+ years 7 6.8 %
Occupation
Student 42 40.8 %
Full-time employed 28 27.2 %
Part-time employed 23 22.3 %
Unemployed 9 8.7 %
Pensioner 1 1%
Consumer behaviour
This set of questions were asked in order to identify the consumer behaviour. Knowing
how consumers behave is crucial for businesses for developing successful marketing strategies to
meet organizational objectives and gain competitive advantage (Samli, 2013; Hawkins &
Mothersbaugh, 2012). According to Samli (2013) in order to sustain competitive advantage and
influence consumer decision, studying consumer behaviour is extremely important. The author
further notes that ‘successful international marketing is based on knowing consumer needs and
catering to these needs’ (Samli, 2013, p.16). Therefore, a set of questions was asked to

25
46.6%
38.8 %
8.7 %5.8%
FREQUENCY OF CONSUMER VISITS
1 or 2 times a week (48 respondents) 1 or 2 times a month (40 respondents)
3 or more times a week (9 respondents) daily (6 respondents)
Figure 1. Frequency of consumer visits to fast food outlets
understand the consumer behaviour in respect to the frequency of visits, purpose of the visits,
factors influencing the visits and restaurant selection criteria.
Statistical analysis of the data presented in figure 2 indicates that consumers visit fast food
restaurants one to two times in a week (46.6%) or in a month (38.8%). Based on response
ratings, 34% of participants indicated that they mostly dine at fast food outlets for friends get
together and while 24.3 % dines for convenience. By contrast, 3.9 % indicated “other” as a
reason for dining at fast food outlets, some specifying it as “working there”. (See Table 2)
In order to understand the reasoning behind consumer behaviour when it comes to
visiting a restaurant, they were asked to pick a factor which influences their decision the most.
The vast majority of consumers (47.6%) reported that their preference of particular restaurant
visit was mostly influenced by their friends, followed by 19.4% was influenced by family
members, while 13. 6% have been influenced by advertising/media, and the rest of the
participants were influenced by children (8.7%) and other (10.7%) reasons, some relating it to
“particular cuisine”, etc. (See Table 3)

26
Reasons for visiting a fast food outlet Number of respondents Percentage %
Friends get together 35 34%
For convenience 25 24.3%
For fun 14 13.6%
For change 13 12.6%
Family Outing 12 11.7%
Other 4 3.9 %
Table 2. Consumer reason for visiting a fast food outlet
Table 3. Source of influence on consumers’ decision of restaurant visit
Restaurant Selection Criteria
Furthermore, the study assessed the criteria which consumers perceive most valuable for
selecting a restaurant. Mason et al. (2011) explains that consumers’ perception of value in any
transaction is based upon consumers’ expectations on perceived important criteria being realized
during the transaction. The author further notes that ‘the ability of quick service restaurant
establishments to satisfy these criteria ultimately leads to the level of customer satisfaction,
which promotes repeat business and drives profits’ (p.111).
Source of influence Number of respondents Percentage %
Friends 49 47.6%
Family members 20 19.4%
Advertising/Media 14 13.6%
Children 9 8.7%
Other 11 10.7%

27
Thus, in order to identify these criteria Likert scale questions were established based on
restaurant characteristics mentioned in the service literature which might be potentially important
to consumers. A list of nine characteristics was established. Then, respondents were asked to
rank those characteristics from most important (5) to least important (1). Each level of
importance was assigned a weighted value (the most important = 5 points, important= 4 points,
neither important nor unimportant = 3 points, etc.). Then weighted average score was calculated
for each criterion separately (See Calculation Method). Lastly, the weighted average score for
each criterion was compared in order to identify the level of importance from one criterion to
another. The results indicate that consumers place higher importance on the quality & taste of
food (4.62), cleanliness & hygiene (4.46), and quality of service (4.03), followed by the menu
variety (3.64), service speed (3.52), location (3.31), price (3.17), ambience/interior (3.15) and
brand name or reputation of the restaurant (2.81) (See Table 4). Some of these findings are in
line with the findings of other research works (Goyal & Singh, 2007; Mason et al., 2011).
Table 4. Criteria of Perceived Value for Restaurant Selection
Criteria
Not
important
Very
important Weighted
Average Score 1 2 3 4 5
Quality & taste of food 1 1 6 20 75 4.62
Cleanliness/Hygiene 1 3 13 17 69 4.46
Quality of service 3 12 9 34 45 4.03
Menu variety 2 12 26 44 19 3.64
Service speed 5 10 32 38 18 3.52
Location 11 12 32 30 18 3.31
Price 10 22 29 25 17 3.17
Ambience/Interior 8 24 30 27 14 3.15
Brand
name/Reputation 23 17 32 19 12 2.81

28
Likert Scale Calculation Method:
In order to calculate the weighted average score, firstly, number of votes were multiplied
by the assigned weight of the importance level. Second, multiplication products were summed
up. And lastly, the sum was divided by the total number of votes (see Table 1).
Note that Price’s weighted average score is 3.17. Here is the formula:
(Number of votes * Weighting for column 1) + (Number of votes * Weighting for column 2) +
Number of votes * Weighting for Column 3) + (Number of votes * Weighting for column 4) +
(Number of votes * Weighting for column 5) / Total Number of Votes
Here is the equation for Price:
(10 * 1) + (22 * 2) + (29 *3) + (25 * 4) + (17 * 5) / 103 = 3.17
Customer satisfaction level
Keeping customers satisfied is the number one goal of any profit organization. Therefore,
it is important to assess the satisfaction level of consumers in order to improve the quality of the
products and/or services offered. Satisfaction from any transaction leads to repeat behavior
which results in profit for businesses. ‘Satisfied customers form the foundation of any successful
business as customer satisfaction leads to repeat purchase, brand loyalty, and positive word of
mouth’ (Angelova & Zekiri, 2011, p.232).
Numerous questions were established in order to determine the satisfaction level amongst
the consumers. As shown in Table 5, the majority of research participants indicated that they are
overall satisfied with their dining experience at fast food premises. It is a predictor of the future
transactions, which indicates that they are more likely to return and make repeat purchases. 63.1
% of survey respondents were positive about their QSR dining experiences. According to Mason

29
et al. (2011) if consumers’ dining experience meets or exceeds their expectations, they are likely
to be satisfied and return.
Table 5. Customers’ Dining Satisfaction
Overall, I am satisfied with my dining experience at fast food restaurant, and my
expectations are met
Number of respondents Percentage %
Strongly Disagree 2 1.9 %
Somewhat Disagree 10 9.7%
Neither Agree nor Disagree 26 25.2 %
Somewhat Agree 46 44.7 %
Strongly Agree 19 18.4 %
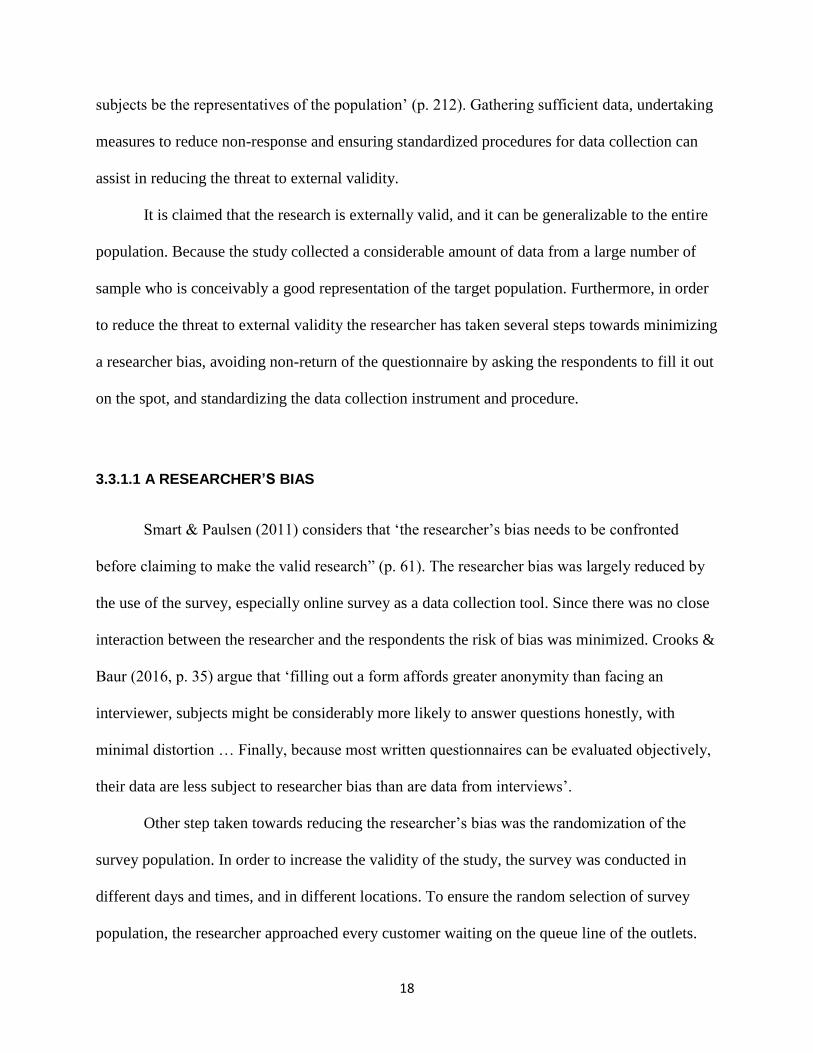
Consumers were further asked to evaluate the perceived value of their transaction with
the quick service restaurants (aka fast food restaurants). 64.1 % of respondents indicated that the
value of their transaction is worth equal of the money they paid for this experience. 18.4 % stated
the value of the transaction to be worth more than the amount they had paid, while 17.5%
considered the value of transaction to be less than the amount paid for it. The overall results
show that consumers primarily perceive the value of their transaction with fast food restaurants
as valuable. The chart in Figure 3 illustrates the consumers’ perceived value of dining
transactions in percentages.
30
Figure 3. Consumer perceived value of dining experience
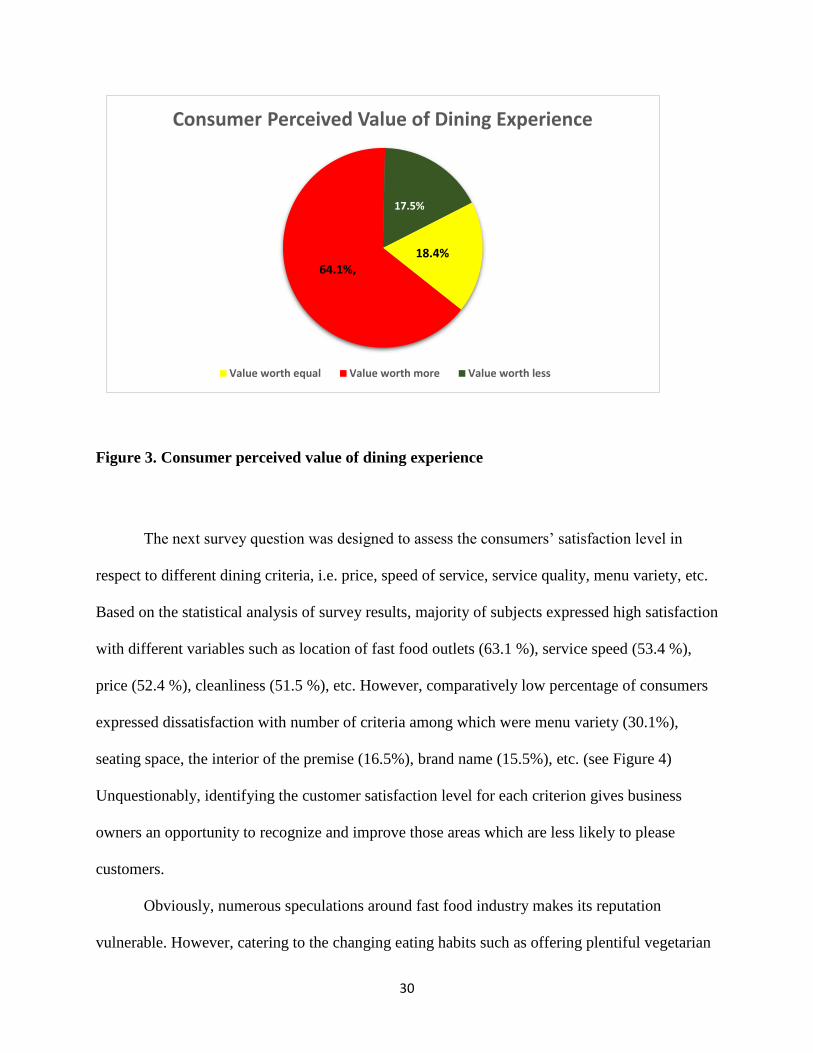
The next survey question was designed to assess the consumers’ satisfaction level in
respect to different dining criteria, i.e. price, speed of service, service quality, menu variety, etc.
Based on the statistical analysis of survey results, majority of subjects expressed high satisfaction
with different variables such as location of fast food outlets (63.1 %), service speed (53.4 %),
price (52.4 %), cleanliness (51.5 %), etc. However, comparatively low percentage of consumers
expressed dissatisfaction with number of criteria among which were menu variety (30.1%),
seating space, the interior of the premise (16.5%), brand name (15.5%), etc. (see Figure 4)
Unquestionably, identifying the customer satisfaction level for each criterion gives business
owners an opportunity to recognize and improve those areas which are less likely to please
customers.
Obviously, numerous speculations around fast food industry makes its reputation
vulnerable. However, catering to the changing eating habits such as offering plentiful vegetarian
18.4%64.1%,
17.5%
Consumer Perceived Value of Dining Experience
Value worth equal Value worth more Value worth less
31
menus, increasing the number of healthy options, using quality ingredients can help improve the
image of fast food brands in the mind of consumers.
Figure 4. Consumer satisfaction level with dining criteria
5.8%
9.7%
7.8%
5.8%
11.7%
4.9%
30.1%
16.5%
15.5%
41.7%
36.9%
41.7%
31.1%
55.3%
43.7%
42.7%
51.5%
46.6%
52.4%
53.4%
50.5%
63.1%
33.0%
51.5%
27.2%
32.0%
37.9%
0.0% 10.0% 20.0% 30.0% 40.0% 50.0% 60.0% 70.0%
Price
Service Speed
Quality & taste of food
Location of restaurant
Quality of service
Cleanliness/Hygiene
Menu Variety
Ambiance/Interior
Brand name/Reputation
How satisfied are you with the following criteria?
Satisfied Neutral Dissatisfied
32
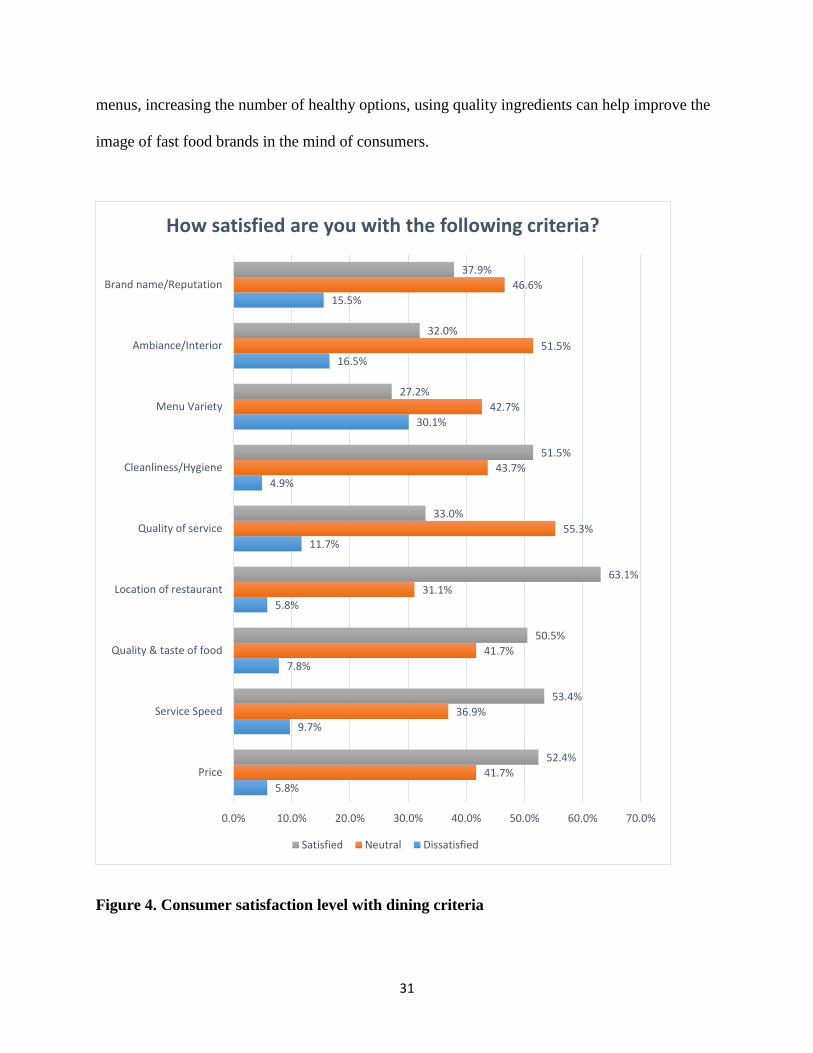
Implications for improvement
Survey was finalized by having consumers provide implications about the areas where
they desire to see improvements. Allowing consumers to provide suggestions for improvement
enables businesses to identify the areas which consumers perceive important and helps them to
serve customers better by improving those areas. The vast majority of survey respondents
suggested to increase the number of healthier menu options (58.3 %). The rest suggested to
increase the variety of menu items (34 %), improve seating space (32 %), indicate the nutritional
value of items (29.1%), increase the number of services (i.e. home delivery) (30.1 %), offer
ethnic/local food options (20.4%), and 6.8 % suggested other improvements, such as adding
vegetarian menu options, etc. (See Figure 5)
Figure 5. Consumer Implications for Improvement
6.8%
20.4%
29.1%
30.1%
32%
34%
58.3%
0.0% 10.0% 20.0% 30.0% 40.0% 50.0% 60.0% 70.0%
OTHER
ETHNIC/LOCAL FOOD
INDICATION OF NUTRITIONAL VALUE OF ITEMS
INCREASED NUMBER OF SERVICES
IMPROVED SEATING SPACE
INCREASED VARIETY OF MENU ITEMS
MORE CHOICES OF HEALTHIER MENU ITEMS
Consumer Implications for Improvement

33
CHAPTER 5. CONCLUSION
Chapter 4 presented the research findings and descriptive analysis of the quantitative data
used in this research study. The primary purpose of this study was to examine the consumer
behaviour and the perception of the quick service restaurant industry, in particular fast food
segment. The quantitative data was analyzed in terms of demographics, consumption habits,
factors that influence on decision making, customer satisfaction level, frequency and purpose of
restaurant visit and consumer implications concerning the future improvements. Moreover, the
findings also helped to address the research questions set in the beginning of the study. A cross
platform and generalized approach of asking questions within the greater fast food industry
ensures that these are concerns in many establishments.
The results revealed that while choosing a restaurant consumers value the quality and
taste of the food in the first place, along with the cleanliness and hygiene in the food production
as well as in the dining area. Consumers also give importance to the quality of service and menu
variety along with a service speed (speedy handling of orders). It implies that fast food vendors
principally need to focus on those parameters besides other service attributes. Even though the
vast majority of customers expressed satisfaction with their dining experience at fast food
premises, the results clearly show that consumers don’t visit these premises only for food, but
for fun, for change and for social activities such as meeting friends, for convenience, for fun and
change. When asked what improvements they would like to see, the majority of consumers
reported seeing more choices of healthier menu options, as well as improved seating space,
indication of the nutritional value of items, increased menu variety and vegetarian meal options.
Therefore, in order to maintain sustainable growth and competitive advantage, it is necessary
for fast food providers to consider the consumer desires and expectations. Consequently,

34
successful restaurants are perceived to be the ones which deliver value to customers on key
factors of perceived value. Knowing what customers value the most can lead to increase in
satisfaction level, sales and raise in the brand value.
5.1 MANAGERIAL IMPLICATIONS
Customer satisfaction is considered the ultimate path to a firm’s profits and is
significant element in establishing marketing relationship (Mason et al., 2011). It involves
fulfilling customers’ demands (needs/expectations) and offering value on the perceived
important product and service attributes. Peterson (1995, pp.278-281) states that ‘consumers
enter into a marketing relationship because they expect to receive positive value from their
participation’. The study revealed that even though majority of consumers are content with
many service and product parameters such as outlet locations, price and menu deals,
nevertheless, they desire to see more of menu items made with quality and fresh ingredients,
fast service speed, increased variety of meal options such as vegetarian and/or vegan meals,
improved seating space, etc. Therefore, it is recommended that fast food providers pay special
attention to these factors. It is also suggested to keep consumers abreast of cleanliness/hygiene
conditions and nutritional value of items. It will help to increase the trust between the food
providers and the consumers. Taking steps towards strengthening ties with customers will lead
to higher customer satisfaction and retention rate, enhanced market share, brand equity, and
loyal customer base which are the core of the successful relationship marketing strategy. Once
customers feel welcomed, they can expand their reasons for visiting these establishments.
35
5.2 RECOMMENDATIONS FOR FUTURE RESEARCH
This research has investigated the consumer perception of fast food industry in terms of
behavioral intentions, customer satisfaction and attributes of perceived value within a specific
geographical area. It is recommended that future research studies expand to cover a larger
geographic area and increase the number of participants. Further recommendation is made in the
light of previously mentioned major recommendation, about applying a mixed method approach,
i.e. using both qualitative and quantitative data to bring depth and utility to the study. It is not
possible to find out the underlying reason behind certain consumer decision by using quantitative
survey alone. Therefore, mixed method study would be favorable for further investigations in
terms of understanding the rationale behind consumer reasoning, attitude and opinion.
Lastly, it would also be beneficial to conduct a study focusing on the individual fast food
brands, since this study focused on the perceptions of fast food industry in general.
36
References
Akira, I. & Saunier, P.-Y. (2009). The Palgrave Dictionary of Transnational History. From the
Mid-19th Century to the Present Day, edited by A. Iriye & P.-Y. Saunier, 1st edn, [e-book]
London: Palgrave Macmillan UK, Available Online:
https://books.google.se/books?id=bKAYDAAAQBAJ&pg=PA232&dq=fast+food+cuisine
&hl=en&sa=X&ved=0ahUKEwj0wKO19rPNAhWFEiwKHcNlAj4Q6AEIMzAE#v=onepa
ge&q=fast food cuisine&f=false [Accessed 19 June 2016].
Albala, K. (2015). The SAGE Encyclopedia of Food Issues, SAGE Publications, Inc; annotated
edition edition (March 27, 2015).
Allison, C. U. (2010). A Study of Relationship Marketing and Effective Customer Patronage in
Fast Food Industry in Enugu Metropolis.
Angelova, B. & Zekiri, J. (2011). Measuring Customer Satisfaction with Service Quality Using
American Customer Satisfaction Model (ACSI Model), International Journal of Academic
Research in Business and Social Sciences, [e-journal] vol. 1, no. 3, pp.2222–6990,
Available Online: www.hrmars.com/journals [Accessed 6 August 2016].
Baron, S., Conway, T. & Warnaby, G. (2010). Relationship Marketing a Consumer Experience
Approach., Sage Publications.
Berg, K. E. & Latin, R. W. (2008). Essentials of Research Methods in Health, Physical
Education, Exercise Science, and Recreation, 3rd edn, Wolters Kluwer Health/Lippincott
Williams & Wilkins.
Brehm, B. A. (2015). Nutrition [2 Volumes]: Science, Issues, and Applications, Greenwood.
Brink, A. (Annekie) & Berndt, A. (Adele). (2008). Relationship Marketing and Customer
Relationship Management, Juta Academic.
37
Bryman, A. & Bell, E. (2015). Business Research Methods, 4th edn, New York: Oxford
University Press.
Bujisic, M., Hutchinson, J. & Parsa, H. G. (2014). The Effects of Restaurant Quality Attributes
on Customer Behavioral Intentions, International Journal of Contemporary Hospitality
Management, [e-journal] vol. 26, no. 8, pp.1270–1291, Available Online:
http://www.emeraldinsight.com/doi/abs/10.1108/IJCHM-04-2013-0162.
Buttle, F. A. (1996). Relationship Marketing: Theory and Practice, edited by F. A. Buttle,
London: Paul Chapman Publishing Ltd.
Buttle, F. & Maklan, S. (2011). Customer Relationship Management: Concepts and
Technologies, Taylor and Francis.
Cahill, D. L. (2007). Customer Loyalty in Third Party Logistics Relationships: Findings from
Studies in Germany and the USA, Physica-Verlag.
Chen, B. (Shih-Y. (2014). Lessons Learned: A Qualitative Case Study of Restaurant Success in
Auckland, New Zealand.
Crooks, R. & Baur, K. (2016). Our Sexuality, 13th edn, Cengage Learning.
Croslin, D. (2010). Innovate the Future: A Radical New Approach to IT Innovation, 1 edition.,
Prentice Hall.
Donkersloot, M. (2002). The Fast-Food Diet: Quick and Healthy Eating at Home and on the Go,
Fireside., Simon and Schuster.
Enz, C. A. (2010). Hospitality Strategic Management: Concepts and Cases, 2nd edn, John Wiley
& Sons.
Etingoff, K. (2014). Healthy Fast Foods (Understanding Nutrition: A Gateway to Physical
& Mental Health), Mason Crest.

38
Euromonitor.com. (2016). Fast Food in Sweden. [online] Available at:
http://www.euromonitor.com/fast-food-in-sweden/report [Accessed 7 Aug. 2016].
Ferry, R. J. (Robert J. (2011). The Management of Pediatric Obesity and Diabetes, Humana
Press.
Funnell, S. C. & Rogers, P. J. (2011). Purposeful Program Theory Effective Use of Theories of
Change and Logic Models, Jossey-Bass.
Goyal, A. & Singh, N. P. (2007). Consumer Perception about Fast Food in India: An Exploratory
Study, British Food Journal, [e-journal] vol. 109, no. 2, pp.182–195, Available Online:
http://www.emeraldinsight.com/doi/abs/10.1108/00070700710725536 [Accessed 6 August
2016].
Gronroos, C. (2007). Service Management and Marketing: Customer Management in Service
Competition, 3rd ed., John Wiley & Sons Ltd.
Hawkins, D. I. & Mothersbaugh, D. L. (2012). Consumer Behavior: Building Marketing
Strategy, 12th edn, McGraw-Hill Irwin.
Hennig-Thurau, T. & Hansen, U. (2000). Relationship Marketing: Gaining Competitive
Advantage through Customer Satisfaction and Customer Retention, Springer.
Hogan, D. G. (1999). Selling ’Em by the Sack. White Castle and the Creation of American Food,
New York University Press.
Johansen, L. T. (2012). Fast Food Vindication: The Story You Haven’t Been Told, J. Murray
Press.
Jones, G. (2002). Introduction to Hospitality Operations, edited by P. Jones, 2nd Revise.,
Cengage Learning EMEA.
Keller, K. (2008). Encyclopedia of Obesity, Sage Publications.

39
Kumar, R. (2011). Research Methodology: A Step-by-Step Guide for Beginners, 3rd edition,
SAGE Publications Ltd.
Lodha, H. (2014). The A to Z of Entrepreneurship, Panchsil Prakashan.
Macnee, C. L. (Carol L. & McCabe, S. (2008). Understanding Nursing Research: Using
Research in Evidence-Based Practice, Wolters Kluwer Health/Lippincott Williams &
Wilkins.
Malekian, R. (2009). Customer Loyalty: Cost vs. Benefits - A Quantitative Approach.
Mason, K., Jones, S., Benefield, M. & Walton, J. (2011). Consumer Perceptions of Quick
Service Restaurants, Journal of International Business and Economics, vol. 13, p.116.
Maxburgers.com. (2016). About Max | Max. [online] Available at:
http://www.maxburgers.com/Home/about-max/About-Max/ [Accessed 5 July 2016].
McBride, D. M. (2012). The Process of Research in Psychology, 2nd edn, SAGE Publications,
Inc.
Mckenna, R. (1993). Relationship Marketing: Successful Strategies For The Age Of The
Customer, Basic Books (May 21, 1993).
Mitchell, M. L. & Jolley, J. M. (2013). Research Design Explained, Wadsworth Cengage
Learning.
Muijs, D. (2010). Doing Quantitative Research in Education with SPSS, 2nd edn, SAGE
Publications Ltd.
Nykiel, R. A. (2007). Handbook of Marketing Research Methodologies for Hospitality and
Tourism, Haworth Hospitality & Tourism Press.
O’Leary, Z. (2010). The Essential Guide to Doing Your Research Project, Sage Publications Ltd.
Parpal, M. (2015). Legal Structures in the Restaurant: Sole Proprietorships, Corporations,

40
Partnerships and LLCs | FSW. [online] FSW Season'd. Available at:
http://www.foodservicewarehouse.com/blog/restaurant-legal-structures/ [Accessed 7 Aug.
2016].
Parsa, H. G., Gregory, A. & Terry, M. ‘Doc’. (2011). Why Do Restaurants Fail? Part III: An
Analysis of Macro and Micro Factors, Dick Pope Sr. Institute Publications , [e-journal],
Available Online: http://stars.library.ucf.edu/dickpope-pubs/15 [Accessed 13 July 2016].
Payne, W. (2014). E-Study Guide for: Understanding Your Health, 10th edn, Cram101 Textbook
Reviews.
Pellissier, R. (2008). Business Research Made Easy, Juta Academic.
Peterson, R. A. (1995). Relationship Marketing and the Consumer, Journal of the Academy of
Marketing Science, [e-journal] vol. 23, no. 4, pp.278–281, Available Online:
http://link.springer.com/10.1177/009207039502300407 [Accessed 8 August 2016].
Rubin, A. & Babbie, E. R. (2010). Essential Research Methods for Social Work, 2nd edn, [e-
book] Brooks Cole, Cengage Learning, Available Online: books.google.com [Accessed 5
July 2016].
Samli, A. C. (2013). International Consumer Behavior in the 21st Century : Impact on Marketing
Strategy Development, Springer.
Schlosser, E. (2001). Fast Food Nation: The Dark Side of the All-American Meal, London: Allen
Lane The Penguin Press.
Shaw, R. & Reed, D. (1999). Measuring and Valuing Customer Relationships: How to Develop
the Measures That Drive Profitable CRM Strategies, London, England: Business
Intelligence Ltd.
Sheth, J. N., Parvatiyar, A. & Shainesh, G. (2008). Customer Relationship Management:
41
Emerging Concepts, Tools, and Applications, [e-book] McGraw-Hill Professional,
Available Online: https://books.google.com [Accessed 28 June 2016].
Smart, J. C. & Paulsen, M. B. (2011). Higher Education: Handbook of Theory and Research,
Vol. 26, Springer.
Smith, A. F. (2011). Fast Food and Junk Food an Encyclopedia of What We Love to Eat, 1
edition., Greenwood Press.
Smith, A. F. (2013). Food and Drink in American History : A ‘full Course’ encyclopedia, ABC-
CLIO.
Statistiska Centralbyrån. (2015). Restaurangindex, december 2015. [online] Available at:
http://www.scb.se/sv_/Hitta-statistik/Statistik-efter-amne/Handel-med-varor-och-
tjanster/Inrikeshandel/Omsattning-inom-tjanstesektorn/6629/6636/Behallare-for-
Press/398670/ [Accessed 7 Aug. 2016].
Statistiska Centralbyrån. (2016).Restaurant Index, March 2016. [online] Available at:
http://www.scb.se/en_/Finding-statistics/Statistics-by-subject-area/Trade-in-goods-and-
services/Domestic-trade/Turnover-in-the-service-sector/Aktuell-Pong/6636/Behallare-for-
Press/402717/ [Accessed 7 Aug. 2016].
(Swanger, 1998)(Swanger, 1998)Goyal, A. & Singh, N. P. (2007). Consumer Perception about
Fast Food in India: An Exploratory Study, British Food Journal, [e-journal] vol. 109, no. 2,
pp.182–195, Available Online:
http://www.emeraldinsight.com/doi/abs/10.1108/00070700710725536 [Accessed 6 August
2016].
Mason, K., Jones, S., Benefield, M. & Walton, J. (2011). Consumer Perceptions of Quick
Service Restaurants, Journal of International Business and Economics, vol. 13, p.116.

42
Payne, W. (2014). E-Study Guide for: Understanding Your Health, 10th edn, Cram101 Textbook
Reviews.
Schlosser, E. (2001). Fast Food Nation : The Dark Side of the All-American Meal, London:
Allen Lane The Penguin Press.
Swanger, N. A. (1998). Quick Service Chain Restaurant Managers: Temperament and
Profitability, Available Online:
http://search.proquest.com.ludwig.lub.lu.se/pqdt/docview/304437802/abstract/FEC6EABB
A9A6470FPQ/1?accountid=12187.
Tannock, S. (2001). Youth at Work: The Unionized Fast-Food and Grocery Workplace, Temple
University Press.
The Florida International University Hospitality and Tourism Review. (2006). Florida
International University, School of Hospitality and Tourism Management, vol. 24-25.
The Local. (2006). Swedish Restaurant Industry Explodes, Available Online:
http://www.thelocal.se/20060731/4474 [Accessed 5 July 2016].
Velnampy, T. & Sivesan, S. (2012). Customer Relationship Marketing and Customer
Satisfaction: A Study on Mobile Service Providing Companies in Srilanka, Global Journal
of Management and Business Research, vol. 12, no. 18.
Walter, U. (2011). Drivers of Customer’s Service Experiences: A Customer Perspective on Co-
Creation of Restaurant Services, Processes and Activities.
Wood, R. C. (2015). Hospitality Management: A Brief Introduction, SAGE Publications Ltd.
Wood, R. C. & Brotherton, B. (2008). The Inter-Relationships between Leisure, Recreation,
Tourism, and Hospitality, in The SAGE Handbook of Hospitality Management, [e-book],
p.577, Available Online: http://books.google.es/books?id=MF6x6G_i9BkC.

43
APPENDIX A: SURVEY
Evaluation of consumer perception within fast food industry
Welcome!
Thank you for agreeing to take part in this important survey!
Your thoughts and opinions are valuable contribution towards evaluating consumer perception & customer satisfaction within fast
food industry. The survey should only take 2-3 minutes to complete. Be assured all the information provided will be kept in the
strictest confidentiality. Please, proceed to questions.
Fast food – hamburgers, fried chicken, cheeseburgers, French fries, etc.
Fast food restaurants – e.g. Mc Donald’s, Burger King, Subway, Max, etc.
What is your age?
18-25 26-35 36-45 46+
Please, state your gender:
Male Female
What is your occupation?
How often do you visit a fast food restaurant?
Which of the following influence your restaurant choice the most?
Friends Family Other_______________
Children Advertising/Media
Full-time employed Unemployed Pensioner
Part-time employed Student
daily 1 or 2 times a week
3 or more times a week 1 or 2 times a month
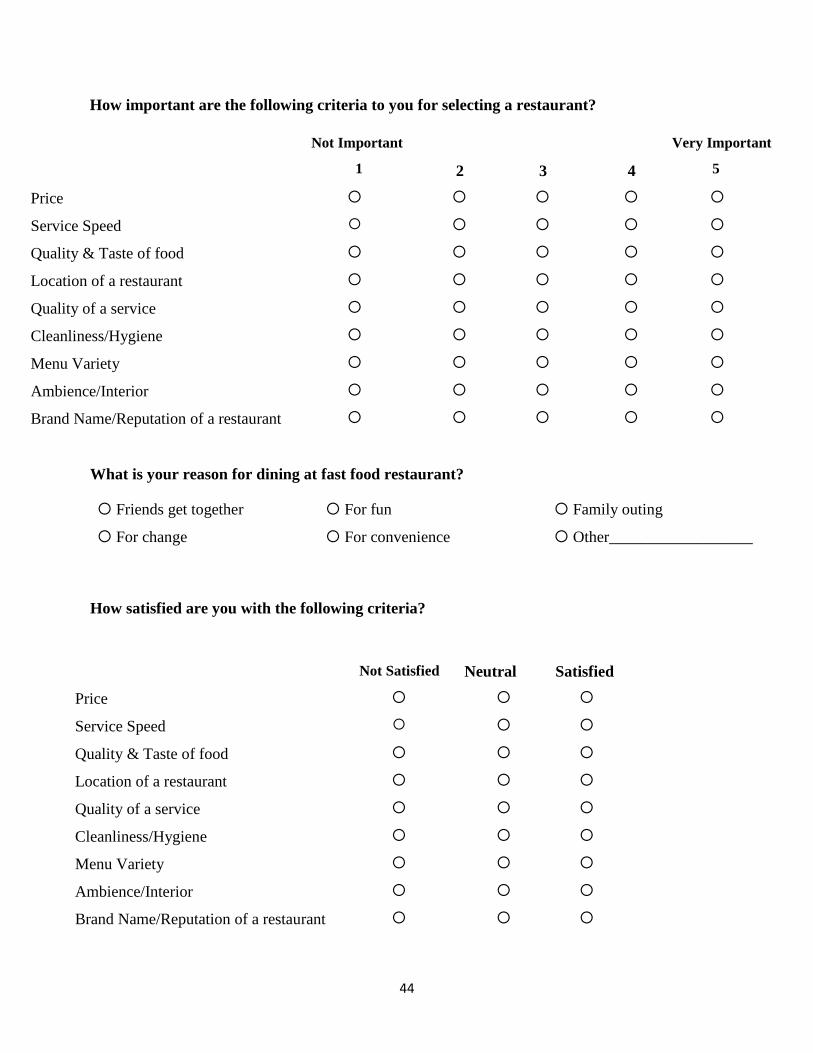
44
How important are the following criteria to you for selecting a restaurant?
Not Important
1
2
3
4
Very Important
5
Price
Service Speed
Quality & Taste of food
Location of a restaurant
Quality of a service
Cleanliness/Hygiene
Menu Variety
Ambience/Interior
Brand Name/Reputation of a restaurant
What is your reason for dining at fast food restaurant?
Friends get together For fun Family outing
For change For convenience Other__________________
How satisfied are you with the following criteria?
Not Satisfied Neutral Satisfied
Price
Service Speed
Quality & Taste of food
Location of a restaurant
Quality of a service
Cleanliness/Hygiene
Menu Variety
Ambience/Interior
Brand Name/Reputation of a restaurant

45
Overall, I am satisfied with my dining experience at fast food restaurant & my expectations are met.
Strongly Disagree Neither Agree nor Disagree Strongly Agree
Somewhat Disagree Somewhat Agree
How would you evaluate the value of your transaction?
Value worth more
Value worth equal
Value worth less
What improvements would you like to see in the future?
Note: You can select more than one option
Improved Seating Space
Indication of nutritional value of items
Increased variety of menu items
More choices of healthier menu items
Ethnic/Local food
Increased number of service (for ex. Home delivery)
Other___________________________