household consumer perceptions of the energy market
TRANSCRIPT

Household Consumer Perceptions of the energy market
Quarter 2 2021
Research conducted in May 2021

Contents
Background and method
Satisfaction with supplier
Complaints
Tariffs and information provision
Switching
1
2
4
5
6
7
Smart meters8
Supplier debt management processes
9 Annex
3
Summary of results

Summary of results

4
Summary of results
Overall satisfaction with supplier
Around three quarters (73%) of consumers are satisfied with their energy supplier overall, which is consistent with Q1 2021 but somewhat lower compared to the latter half of 2020.
As with previous quarters, significantly fewer consumers who pay for their energy with a prepayment meter (PPM) (69%) or by standard credit (65%) are satisfied with their supplier overall compared to those paying by direct debit (75%).
Significantly more who have a smart meter are satisfied overall (76%) compared to those without (69%).
Customer service
71% of consumers are satisfied with the overall customer service provided by their supplier.
30% contacted their supplier in the past 3 months, with the main reasons for contact being to give a meter reading (25%), to raise a query about a bill (21%) or to ask a question about a meter (17%).
Telephone remains the most commonly used contact channel (54%), followed by email (22%). Use of telephone to contact suppliers has declined since tracking commenced in Q4 2018, while use of email has increased.
Ratings for satisfaction with telephone service (65% are satisfied) or online service (69% are satisfied) are steady between Q1 and Q2 2021 but are significantly down compared to the commencement of tracking in Q4 2018.
Ratings for telephone response times are lower relative to most other areas of service. Just over half (52%) of consumers surveyed are satisfied with the time it takes to get through to someone who can resolve enquires made by telephone, while a third (34%) are dissatisfied.
5
Billing
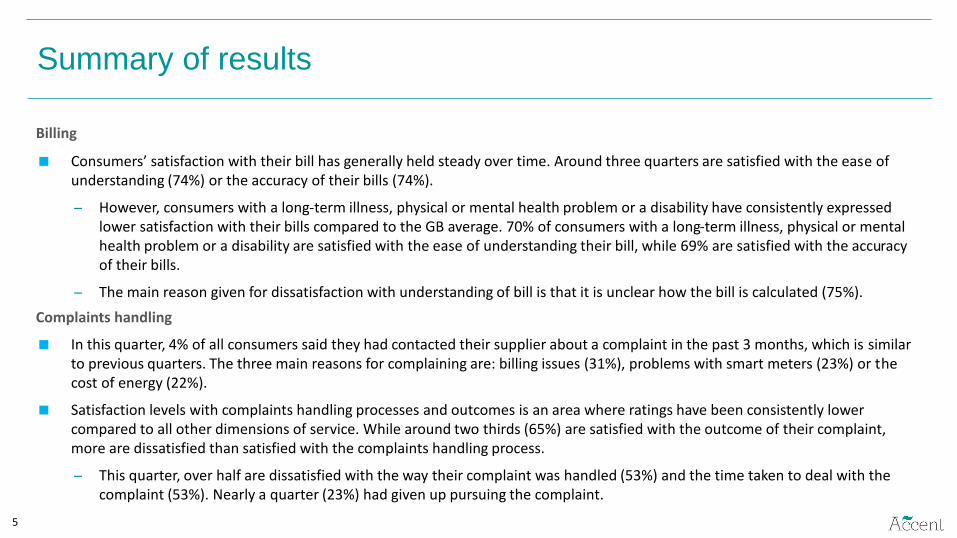
Consumers’ satisfaction with their bill has generally held steady over time. Around three quarters are satisfied with the ease of understanding (74%) or the accuracy of their bills (74%).
However, consumers with a long-term illness, physical or mental health problem or a disability have consistently expressed lower satisfaction with their bills compared to the GB average. 70% of consumers with a long-term illness, physical or mental health problem or a disability are satisfied with the ease of understanding their bill, while 69% are satisfied with the accuracy of their bills.
The main reason given for dissatisfaction with understanding of bill is that it is unclear how the bill is calculated (75%).
Complaints handling
In this quarter, 4% of all consumers said they had contacted their supplier about a complaint in the past 3 months, which is similar to previous quarters. The three main reasons for complaining are: billing issues (31%), problems with smart meters (23%) or the cost of energy (22%).
Satisfaction levels with complaints handling processes and outcomes is an area where ratings have been consistently lower compared to all other dimensions of service. While around two thirds (65%) are satisfied with the outcome of their complaint,more are dissatisfied than satisfied with the complaints handling process.
This quarter, over half are dissatisfied with the way their complaint was handled (53%) and the time taken to deal with the complaint (53%). Nearly a quarter (23%) had given up pursuing the complaint.
Summary of results

6
Supplier debt management processes
Just under three in five (57%) consumers who have fallen into arrears or run out of credit on their PPM had contact with their supplier to get help – this is similar to Q1 (61%).
While the majority agreed they were treated fairly by their supplier (60%), that the person spoken to was sympathetic (62%) and that the options provided to help manage bills were helpful (53%), around one in five disagreed with each of these statements.
Switching processes
Satisfaction with switching processes remains high. Nearly all (85%) are satisfied with the process overall while four in five (79%) are satisfied with the ease of comparing suppliers.
Consistent with the previous quarter, around two thirds of consumers who switched supplier used a price comparison website (PCW) (64%).
The use of PCWs appears to improve the switching experience. Significantly more consumers who used a PCW are satisfied with the ease of comparing and the process overall compared to those who did not.
Smart meters
Around half (52% )of consumers say they have a smart meter, with 15% stating it was installed in the last 6 months.
Three quarters (77%) of those who had their smart meter installed in the last 6 months are satisfied with the installation process but fewer (71%) are satisfied with the meter overall.
Summary of results
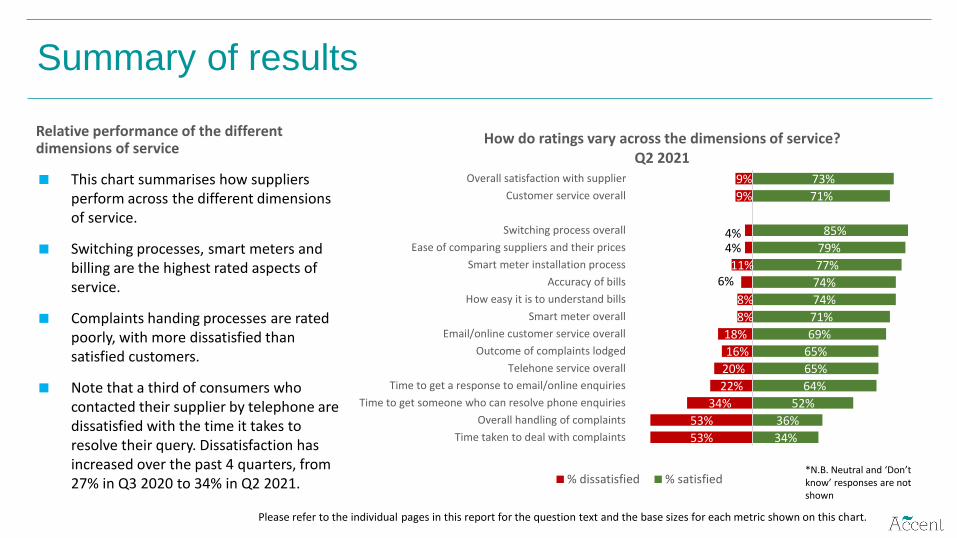
Relative performance of the different dimensions of service
This chart summarises how suppliers perform across the different dimensions of service.
Switching processes, smart meters and billing are the highest rated aspects of service.
Complaints handing processes are rated poorly, with more dissatisfied than satisfied customers.
Note that a third of consumers who contacted their supplier by telephone are dissatisfied with the time it takes to resolve their query. Dissatisfaction has increased over the past 4 quarters, from 27% in Q3 2020 to 34% in Q2 2021.
53%
53%
34%
22%
20%
16%
18%
8%
8%
6%11%
4%4%
9%
9%
34%
36%
52%
64%
65%
65%
69%
71%
74%
74%
77%
79%
85%
71%
73%
Time taken to deal with complaints
Overall handling of complaints
Time to get someone who can resolve phone enquiries
Time to get a response to email/online enquiries
Telehone service overall
Outcome of complaints lodged
Email/online customer service overall
Smart meter overall
How easy it is to understand bills
Accuracy of bills
Smart meter installation process
Ease of comparing suppliers and their prices
Switching process overall
Customer service overall
Overall satisfaction with supplier
How do ratings vary across the dimensions of service? Q2 2021
% dissatisfied % satisfied
Summary of results
Please refer to the individual pages in this report for the question text and the base sizes for each metric shown on this chart.
*N.B. Neutral and ‘Don’t know’ responses are not shown

Background and method

9
Background
This report presents findings from a tracking survey commissioned jointly by Ofgem and Citizens Advice.
The Gas and Electricity Markets Authority (GEMA) is the regulator of Britain’s gas and electricity markets, and its principalobjective is to protect the interests of both current and future consumers. Ofgem carries out the day to day functions of GEMA.
Citizens Advice helps millions of people every year to find a way forward, across all sectors, whatever their problems. This informs its role as the statutory energy consumer advocate, fighting for the best outcomes for current and future consumers.
The tracker is a representative survey of domestic energy bill-payers and provides Ofgem and Citizens Advice with ongoing measures of consumer engagement in, and experiences of, the energy market.

10
Research methodology
Data is usually collected using a mixed-mode survey of domestic energy bill-payers in Great Britain (GB), including 2,900 onlineinterviews and 300 face to face interviews. The latter are conducted to reach consumers who don’t have access to the internet.
However, in the light of the coronavirus outbreak, the face to face interviews were not conducted this quarter. Face to faceinterviewing for this survey in future quarters will only recommence when guidance from the Government Social Research profession changes to confirm that it is safe to do so.
Fieldwork was carried out in May 2021 via an online survey sourcing respondents from a commercial online market research panel (n = 3,203).
All participants were responsible (solely or jointly) for the energy bills in their household or for choosing their energy supplier.
* https://www.nomisweb.co.uk/datasets/st067

11
AB, 29%
C1, 27%
C2, 18%
DE, 26%
16 - 34, 18%
35 - 49, 30%50 - 64,
27%
65+, 25%
Male, 49%
Female, 51%
Sample profile
GenderSocial Grade
Age
Base: All Participants (3,203)
Scotland9%
NW12%
NE4%
Y&H9%
Wales5%
WM9%
EM7%
E9%
London13%SE
14%SW9%
The survey uses quotas to achieve a sample representative of the GB bill-payer population. Quotas are set on age, gender, social grade and region. Data is weighted to the known profile of the GB population. Quotas (other than gender) were based on census Household Reference Person (HRP)*, as a proxy for bill-payer.

12
Fieldwork dates
◼ Fieldwork dates for each of the 11 waves of the survey completed are indicated below:
Fieldwork Wave 1 (‘Q4 2018’)
Wave 2 (‘Q1 2019’)
Wave 3 (‘Q2 2019’)
Wave 4 (‘Q3 2019’)
Wave 5 (‘Q4 2019’)
Wave 6(‘Q1 2020’)
Wave 7(‘Q2 2020’)
Wave 8(‘Q3 2020’)
Wave 9(‘Q4 2020’)
Wave 10(‘Q1 2021’)
Wave 11(‘Q2 2021’)
Online 24th October –11th
November 2018
29th January –6th February
2019
26th March -15th April 2019
3rd July - 17th
July 20191st – 23rd
October 20196th - 22nd
January 20201st - 17th
April 202021st August –
16th September 2020
20th November – 15th
December 2020
5th – 20th
February 20215th – 20th May
2021
Face-to-Face*
24th October –13th
November 2018
31st January –17th February
2019
1st – 16th April 2019
1st July – 23rd
July 20193rd – 17th
October 20199th - 24nd
January 20201st - 24th
April 202024th August –28th September
2020
24th November – 14th
December 2020
None None
*Wave 7 (‘Q2 2020’) and part of Wave 8 (‘Q3 2020’) were conducted by telephone
13
Comparisons between survey waves
◼ This report presents results for the eleventh tracking wave (Q2 2021).
◼ As the survey involved sampling a selection of energy consumers (rather than the whole population), confidence intervals apply to the results. These confidence intervals indicate the degree of confidence we can have that the survey result is real and not due to random chance for a given sample size and a given survey result. For the total sample on which these results are based (n=3,203), there is a confidence interval of +/-2% (i.e. a survey result of 50% could lie between 48% and 52%).
◼ Confidence intervals also apply when comparing results between waves. Where there are statistically significant differences in findings compared to previous waves (i.e. we have statistical confidence that a real change has occurred), these are indicated. Where only wave 11 results are shown, there are no statistically significant differences in findings from previous waves.
◼ All measures of statistical significance have been tested at the 95% confidence level.

14
Abbreviations/terms used in this report
Tariffs / Payment:
◼ Fixed = Consumer is on a fixed tariff for their electricity and gas.
◼ SVT = Consumer is on a Standard Variable Tariff for their electricity and gas.
◼ Mixed tariff = on different types of tariff for gas and electricity.
◼ Dual Fuel = Consumer uses the same supplier for electricity and gas.
◼ PPM = Pre-Payment Meter.
Demographics:
◼ SEG = Socio-Economic grade.
◼ ABC1 = Consumers falling into the top three socio-economic bands.
◼ C2DE = Consumers falling into the bottom three socio-economic bands.
◼ Online = Survey sample sourced from an online consumer panel.
Other:
◼ PCW = Price Comparison Website.
◼ PPS = Percentage points.

Satisfaction with supplier

Overall satisfaction with supplier
73% of the consumers surveyed are satisfied with their supplier – unchanged from Q1 2021, although still lower compared to much of 2020.
Overall, how satisfied or dissatisfied are you with (...) as your supplier of (gas/electricity/gas and electricity)?Base: All Participants (3,203)16
Very dissatisfied,
4%Dissatisfied,
5%
Neither satisfied nor dissatisfied,
17%
Satisfied, 38%
Very satisfied,
35%
Unsure, 1%
75% 74% 73% 74% 75% 73%77% 76% 76%
73% 73%
7% 7% 9% 8% 8% 9% 7% 8% 7% 9% 9%
0%
10%
20%
30%
40%
50%
60%
70%
80%
90%
Q42018
Q12019
Q22019
Q32019
Q42019
Q12020
Q22020
Q32020
Q42020
Q12021
Q22021
Overall satisfaction over time
Satisfied Dissatisfied

Over time, there have been consistent trends in the types of customers who express lower levels of satisfaction with their supplier. The chart to the right shows overall satisfaction ratings for Q2 2021 by demography, but the differences shown have been apparent each wave of this tracker.
Fewer consumers paying by PPM, paying by standard credit, on an SVT or without a smart meter are satisfied overall compared to the overall average in Great Britain, and more are dissatisfied. By age, more consumers aged 16-64 are dissatisfied compared to those aged 65+.
Consumers who are less satisfied overall with their supplier are generally also less satisfied with each of the dimensions of service.
Overall satisfaction with supplier by demography
Overall, how satisfied or dissatisfied are you with (...) as your supplier of (gas/electricity/gas and electricity)?Base: All Participants (3,203). Base sizes vary from 371-2,213 for individual demographics
Consumers with a smart meter, on a fixed tariff or who pay by direct debit have higher levels of satisfaction than their counterparts.
69%65%
75%
71%74%
76%69%
72%74%
72%75%
73%
12%14%
8%
11%8%
8%10%
10%7%
12%8%
9%
PPMStandard Credit
Direct Debit
Have health problem or a disabilityNo health problem or a disability
Have a smart meterDon't have a smart meter
Aged 16-64Aged 65+
On SVTOn fixed tariff
All GB
Overall satisfaction with supplier Q2 2021
% satisfied % dissatisfied
The following two slides show the trends over time by payment type (a key differentiator of satisfaction) and among those who do and don’t have a long-term illness, physical or mental health problem or a disability (a group who may have unique customer service and accessibility needs).
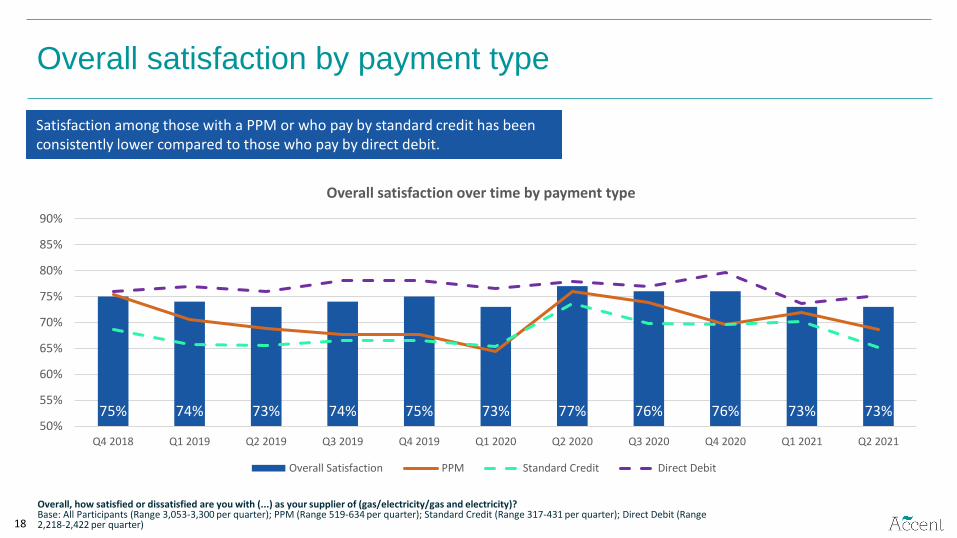
Overall satisfaction by payment type
Overall, how satisfied or dissatisfied are you with (...) as your supplier of (gas/electricity/gas and electricity)?Base: All Participants (Range 3,053-3,300 per quarter); PPM (Range 519-634 per quarter); Standard Credit (Range 317-431 per quarter); Direct Debit (Range 2,218-2,422 per quarter)18
75% 74% 73% 74% 75% 73% 77% 76% 76% 73% 73%50%
55%
60%
65%
70%
75%
80%
85%
90%
Q4 2018 Q1 2019 Q2 2019 Q3 2019 Q4 2019 Q1 2020 Q2 2020 Q3 2020 Q4 2020 Q1 2021 Q2 2021
Overall satisfaction over time by payment type
Overall Satisfaction PPM Standard Credit Direct Debit
Satisfaction among those with a PPM or who pay by standard credit has been consistently lower compared to those who pay by direct debit.
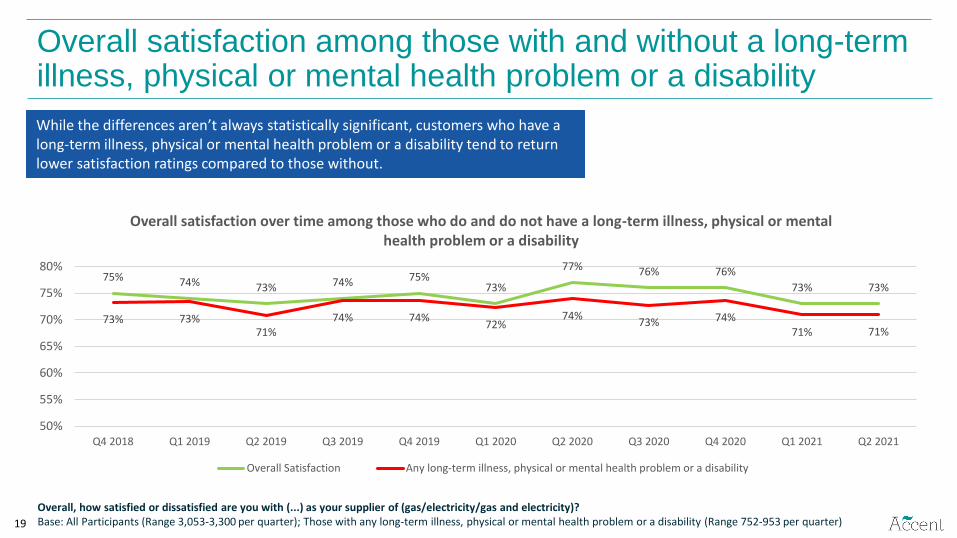
Overall satisfaction among those with and without a long-term illness, physical or mental health problem or a disability
Overall, how satisfied or dissatisfied are you with (...) as your supplier of (gas/electricity/gas and electricity)?Base: All Participants (Range 3,053-3,300 per quarter); Those with any long-term illness, physical or mental health problem or a disability (Range 752-953 per quarter)19
75% 74% 73% 74% 75%73%
77% 76% 76%
73% 73%
73% 73%71%
74% 74%72%
74%73% 74%
71% 71%
50%
55%
60%
65%
70%
75%
80%
Q4 2018 Q1 2019 Q2 2019 Q3 2019 Q4 2019 Q1 2020 Q2 2020 Q3 2020 Q4 2020 Q1 2021 Q2 2021
Overall satisfaction over time among those who do and do not have a long-term illness, physical or mental health problem or a disability
Overall Satisfaction Any long-term illness, physical or mental health problem or a disability
While the differences aren’t always statistically significant, customers who have a long-term illness, physical or mental health problem or a disability tend to return lower satisfaction ratings compared to those without.

◼ Consistent with previous quarters, satisfaction with customer service is higher among those using a smart meter (75% vs. 67% of those without).
◼ More consumers with a long-term illness, physical or mental health problem or a disability are dissatisfied (11%) compared to those without (7%).
Satisfaction with customer service
71% are satisfied with customer service which is similar to Q1 2021.
20
74% 73% 72% 72% 72% 71% 74% 73% 73% 69% 71%
7% 7% 8% 7% 7% 9% 7% 8% 6% 9% 9%
0%
20%
40%
60%
80%
Q42018
Q12019
Q22019
Q32019
Q42019
Q12020
Q22020
Q32020
Q42020
Q12021
Q22021
Overall satisfaction with customer service
Satisfied Dissatisfied
Very dissatisfied,
4%Dissatisfied,
5%
Neither satisfied nor dissatisfied,
18%
Satisfied, 36%
Very satisfied,
35%
Unsure, 3%
Overall, how dissatisfied or satisfied are you with the customer service you have received from your energy supplier?Base: All Participants (3,203)

In Q2 2021, those most likely to contact their supplier are customers who:
Are dissatisfied with their supplier (50%)
Switched in past 12 months (41%)
Are aged 16-34 (38%).
◼ And those most likely to have tried but failed to contact their supplier are those who:
Are dissatisfied with their supplier (16%)
Aged 16-34 (12%)
Pay by standard credit (11%).
Reason for contact with supplier (last 3 months)
Yes -contacted,
30%
Yes - tried to contact but wasn't able
to, 5%
Haven't tried to contact,
63%
Unsure, 1%
Similar to previous quarters, 30% contacted their supplier in the last three months, while 5% tried to make contact but were unable to. Rates of unsuccessful contact have not significantly changed during the COVID-19 pandemic.
Have you contacted, or tried to contact, your energy supplier within the last 3 months?Base: All Participants (3,203)
21

22
Giving meter readings and billing enquiries remain the most common reasons for contact.
Reasons for last contacting supplier
Thinking of the last time you (made/tried to make) contact with your energy supplier, what was it about? Base: Those who contacted / tried to contact their energy supplier (1,144)
25%
21%
17%
14%
14%
13%
12%
7%
7%
3%
2%
To give a meter reading
A query over a bill I received
A question about my smart meter*
To find out about changing my tariff
To seek help with paying my energy bills/ topping up my prepayment meter
To enquire about the products or services they offer
To make a complaint or about a previous complaint
To change the way I pay for my energy
About switching to a new supplier
Other reason
Unsure
*Contact relating to smart meters will include all forms of contact (e.g. installations, ongoing use, changing smart meter etc)

Reasons for contacting supplier by payment method
Those paying by PPM are the most likely to contact about seeking help with paying bills (29% - similar to Q1 2021, 30%).
Those paying by PPM are more likely to have made a complaint than those paying by direct debit.
Those paying by direct debit are more likely to contact about a meter reading.
Those paying by standard credit are more likely to contact about a query on a bill than those paying by direct debit.
*Highlighted percentages are statistically significant
Statistically higher than non-highlighted cells 23
PPM customers tend to contact about help with paying bills or topping up; while those paying by direct debit tend to contact to give meter readings or with billing queries.
Payment method
Any using standard
credit
Any using PPM
Any using Direct debit
To give a meter reading 18% 11% 30%
A query over a bill I received 30% 17% 21%
A question about my smart meter 16% 20% 17%
To find out about changing my tariff 12% 13% 15%
To seek help with paying my energy bills/with topping up my prepayment meter
19% 29% 9%
To enquire about the products or services they offer 15% 17% 12%
To make a complaint or about a previous complaint 16% 16% 10%
To change the way I pay for my energy 13% 8% 7%
About switching to a new supplier 11% 4% 7%
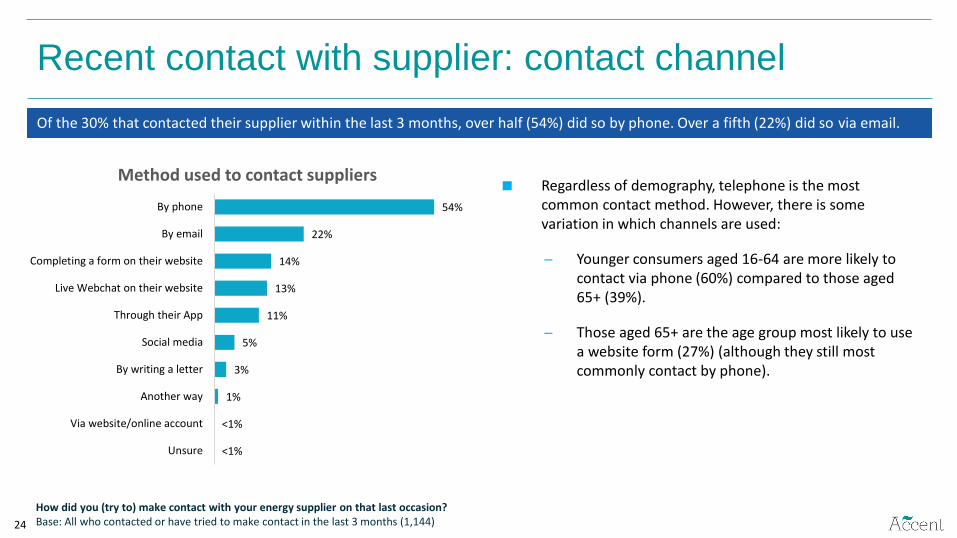
Regardless of demography, telephone is the most common contact method. However, there is some variation in which channels are used:
Younger consumers aged 16-64 are more likely to contact via phone (60%) compared to those aged 65+ (39%).
Those aged 65+ are the age group most likely to use a website form (27%) (although they still most commonly contact by phone).
Recent contact with supplier: contact channel
Of the 30% that contacted their supplier within the last 3 months, over half (54%) did so by phone. Over a fifth (22%) did so via email.
54%
22%
14%
13%
11%
5%
3%
1%
<1%
<1%
By phone
By email
Completing a form on their website
Live Webchat on their website
Through their App
Social media
By writing a letter
Another way
Via website/online account
Unsure
Method used to contact suppliers
How did you (try to) make contact with your energy supplier on that last occasion? Base: All who contacted or have tried to make contact in the last 3 months (1,144)24

25
Telephone remains the most common contact channel, followed by email.
Contact channels used over time
How did you (try to) make contact with your energy supplier on that last occasion? Base: All who contacted or have tried to make contact in the last 3 months (Sample sizes range from 994 to 1144 per quarter) Mentions over 10% in Q1 2021 shown in chart.
58% 59% 60% 62%57% 57% 55% 53% 51% 53% 54%
28%
10% 11% 11% 12% 13% 12% 11% 12% 12% 13%
20% 19% 18% 17% 19% 20% 20% 20% 21% 23% 22%
16% 16% 15%18% 17% 16% 15% 15% 13% 14%
10%11% 12% 11%0%
10%
20%
30%
40%
50%
60%
70%Main methods used to contact supplier
Phone Live webchat Email Completing a form on the website Through their app

Satisfaction with phone and email service
75% 74% 72% 72%68% 68% 70% 68% 68%
64% 65%
14% 14% 14% 14%19% 19% 18% 20% 19%
22% 20%
0%
10%
20%
30%
40%
50%
60%
70%
80%
Q42018
Q12019
Q22019
Q32019
Q42019
Q12020
Q22020
Q32020
Q42020
Q12021
Q22021
Satisfaction with telephone service
Satisfied Dissatisfied
75% 73% 72%76% 76%
71% 71% 73% 72%68% 69%
11%14% 14% 12% 14% 16% 16% 15% 14%
17% 18%
0%
10%
20%
30%
40%
50%
60%
70%
80%
Q42018
Q12019
Q22019
Q32019
Q42019
Q12020
Q22020
Q32020
Q42020
Q12021
Q22021
Satisfaction with online service
Satisfied Dissatisfied
Satisfaction with telephone and online service stabilised this quarter after significant drops in Q1 2021.
Please can you tell me how dissatisfied or satisfied you were with the service received by phone? Base: All who contacted or tried to contact their supplier by phone in the last 3 months (Base: 538 -651)
Please can you tell me how dissatisfied or satisfied you were with the service received online? Base: All who contacted or tried to contact their supplier by email/webchat/website form/app in the last 3 months (Base: 411 – 569)
26

71%67%
62% 64%
16% 17%23% 22%
0%
10%
20%
30%
40%
50%
60%
70%
80%
Q3 2020 Q4 2020 Q1 2021 Q2 2021
Satisfaction with time to respond to email/web mail/ app enquiry
Net satisfied Net dissatisfied
Satisfaction with response times
60%54%
57%52%
27%30% 31%
34%
0%
10%
20%
30%
40%
50%
60%
70%
80%
Q3 2020 Q4 2020 Q1 2021 Q2 2021
Satisfaction with time to get through to someone who could resolve your telephone query
Net satisfied Net dissatisfied
Please can you tell me how dissatisfied or satisfied you were with the following: The time it took to get through to someone who could resolve your queryBase: All who contacted or tried to contact their supplier by phone in the last 3 months (Base: 538 -651)
Please can you tell me how dissatisfied or satisfied you were with the following: The time it took for your supplier to respond to you queryBase: All who contacted or tried to contact their supplier by email/webchat/website form/app in the last 3 months (Base: 411 – 569)
Satisfaction with response times is lower relative to other dimensions of service. Dissatisfaction with telephone response times has been increasing over time, while the downward trend for satisfaction with response times to email or online enquires has stabilised.
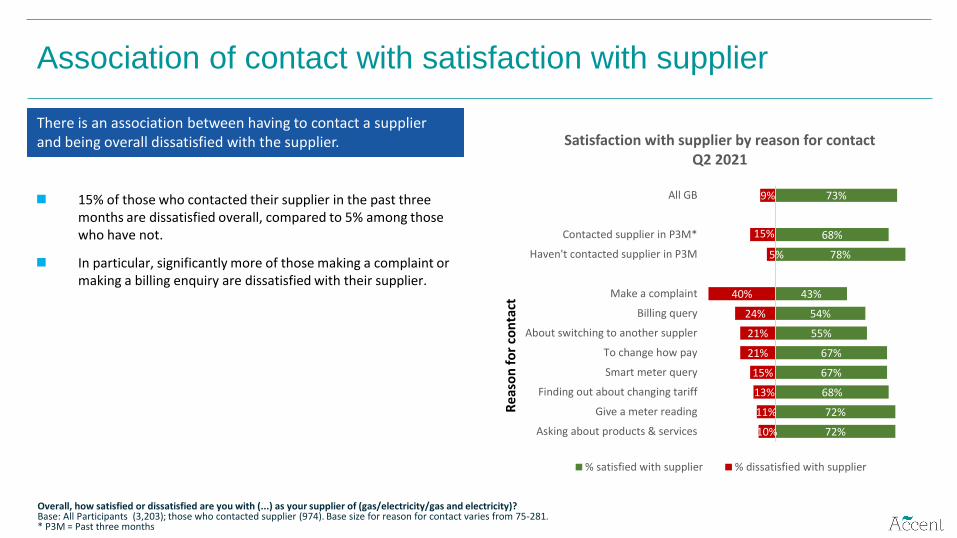
◼ 15% of those who contacted their supplier in the past three months are dissatisfied overall, compared to 5% among those who have not.
◼ In particular, significantly more of those making a complaint or making a billing enquiry are dissatisfied with their supplier.
Association of contact with satisfaction with supplier
72%
72%
68%
67%
67%
55%
54%
43%
78%
68%
73%
10%
11%
13%
15%
21%
21%
24%
40%
5%
15%
9%
Asking about products & services
Give a meter reading
Finding out about changing tariff
Smart meter query
To change how pay
About switching to another suppler
Billing query
Make a complaint
Haven't contacted supplier in P3M
Contacted supplier in P3M*
All GB
Satisfaction with supplier by reason for contact Q2 2021
% satisfied with supplier % dissatisfied with supplier
Overall, how satisfied or dissatisfied are you with (...) as your supplier of (gas/electricity/gas and electricity)?Base: All Participants (3,203); those who contacted supplier (974). Base size for reason for contact varies from 75-281.* P3M = Past three months
Re
aso
n f
or
con
tact
There is an association between having to contact a supplier and being overall dissatisfied with the supplier.

Satisfaction with bills
Around 3 in 4 are satisfied with the accuracy and ease of understanding bills.
29
2%
2%
6%
4%
16%
17%
42%
40%
32%
34%
2%
3%
Ease of understanding the bill
The accuracy of your bill
Very dissatisfied Dissatisfied Neither satisfied nor dissatisfied Satisfied Very satisfied Unsure
Please can you tell me how dissatisfied or satisfied you are with the following aspects of your energy supplier’s bills? Base: Those who pay for their energy with a regular direct debit or standing order or with cash/cheque/credit card/BACS/App (2,641)

Satisfaction with bill over time
73% 75% 73% 74% 74% 74% 73% 74% 77% 74% 74%
5% 6% 7% 7% 7% 7% 8% 7% 5% 7% 6%
0%
10%
20%
30%
40%
50%
60%
70%
80%
90%
Satisfaction with accuracy of bill
Satisfied Dissatisfied
72% 75%71% 73% 72% 72% 73% 74% 76% 74% 74%
9% 9% 11% 9% 10% 10% 9% 9% 7% 9% 8%
0%
10%
20%
30%
40%
50%
60%
70%
80%
90%
Satisfaction with ease of understanding bill
Satisfied Dissatisfied
Please can you tell me how dissatisfied or satisfied you are with the following aspects of your energy supplier’s bills? Base: Those who pay for their energy with a regular direct debit or standing order or with cash/cheque/credit card/BACS/App (c 2,700 each wave)
Satisfaction with billing is generally stable (apart from an improvement in Q4 2020, which has not been sustained).
30

Satisfaction with billing among those with a long-term illness, physical or mental health problem or a disability
Q37r1. Please can you tell me how dissatisfied or satisfied you are with the following aspects of (...)`s bills: Ease of understanding the bill Base: Those who pay with a regular direct debit or standing order or with cash/cheque/credit card/BACS/App (Range 2,573-2,969 per quarter); Those with any with a long-term illness, physical or mental health problem or a disability (Range 594-728 per quarter)31
72%
75%
71%73% 72% 72% 73% 74%
76%74% 74%
66%
73%
69%67% 67%
68%71%
69%71%
68%70%
40%
45%
50%
55%
60%
65%
70%
75%
80%
Q42018
Q12019
Q22019
Q32019
Q42019
Q12020
Q22020
Q32020
Q42020
Q12021
Q22021
Satisfaction with ease of understanding bill
All GB Any long-term illness, physical or mental health problem or a disability
Fewer consumers with a long-term illness, physical or mental health problem or a disability are satisfied with their bills.
73%75%
73% 74% 74% 73% 74% 74%
77%
74% 74%
69%
75%
69%72% 72%
70% 70%71%
74%
69% 69%
40%
45%
50%
55%
60%
65%
70%
75%
80%
Q42018
Q12019
Q22019
Q32019
Q42019
Q12020
Q22020
Q32020
Q42020
Q12021
Q22021
Satisfaction with accuracy of bill
All GB Any long-term illness, physical or mental health problem or a disability

32
Reasons for dissatisfaction with understanding the bill
Why are you very dissatisfied/dissatisfied with the ease of understanding your bill from your energy supplier? Base: Those who are dissatisfied with the ease of understanding their bill from their energy supplier (212)
75%
34%
33%
5%
2%
Unclear how the bill is calculated
Difficult to find key information quickly
Language used is too complicated
Font too small
Other
As seen in previous quarters, clarity of calculation of bill continues to be the most common problem. This is the most common issue across all demographic groups and all suppliers.

Complaints

As in previous quarters, the groups more likely to have complained (of all participants) are:
Dissatisfied overall with their supplier (18%) vs satisfied (2%) or neutral (11%)
Younger consumers: 16-34 (8%).
Complaints to suppliers
12% of recent contacts with suppliers were related to a complaint. This equates to 4% of all consumers complaining the last time they contacted their supplier (similar to previous quarters).
31%
23%
22%
16%
14%
11%
11%
11%
10%
10%
8%
7%
7%
5%
5%
5%
1%
A problem with my bill
A problem with my smart meter
Pricing/cost of energy
Attitude or behaviour of staff
Managing my payments
Missed appointment
A problem with my direct debit
Switching supplier
Price copmparison quote not the same
A discount not applied
Received marketing material I didn`t want
A problem with a refund
A problem with my meter
Received sales call I didn`t want
Privacy issue
Other
Unsure
Reasons for complaint (top 15)
Earlier you said that your last contact with your energy supplier was about a complaint. What was the complaint about?Base: Those who contacted / tried to contact their energy supplier about a complaint (134)34

38%
27% 25% 25%20%
28% 30%
21%
34%
50% 51%
65% 64%60%
51%59%
66%
53%
0%
10%
20%
30%
40%
50%
60%
70%
80%
Q42018
Q12019
Q42019
Q12020
Q22020
Q32020
Q42020
Q12021
Q22021
Satisfaction with time taken to deal with complaint
Satisfied Dissatisfied
38%
27%
37% 35% 34%
47%
24%
35% 33%
23%
36%
50% 51%44%
50%57%
41%
56%49%
55%
68%
53%
0%
10%
20%
30%
40%
50%
60%
70%
80%
Satisfaction with handling of complaint
Satisfied Dissatisfied
Satisfaction with the complaints process
*N.B. Neutral and ‘Don’t know’ responses are not shown
Around two thirds are satisfied with the outcome of their complaint, while those who are dissatisfied has fallen.
Dissatisfaction with the handling of complaints is significantly lower than in Q1 2021, and is now in line with previous quarters.
Satisfaction with the time taken to deal with complaints has increased this quarter though more remain dissatisfied than satisfied.
35
71% 71% 72%
63%59%
66%58%
70% 72%
63% 65%
14%9%
17% 18%24%
20%27%
9% 7%
27%
16%
0%
10%
20%
30%
40%
50%
60%
70%
80%
Satisfaction with complaint outcome*
Satisfied Dissatisfied
Please can you tell me how satisfied or dissatisfied you are with the following aspects of your complaint. Base: Those who contacted their energy supplier to make a complaint Q4 2020 (104) ; All other waves (96-111)*Note small base sizes: Those whose complaint reached an outcome Q4 2020 (36); All other waves (33-46)
Stage of complaint and time taken to process
Reached the end of a formal
complaints process, 38%
The process is still ongoing, 34%
I've given up pursuing the complaint,
23%
Unsure, 4%
15%
15%
24%
20%
12%
12%
2%
Up to 1 week
Between 1 and 2 weeks
Between 2 and 3 weeks
Between 3 weeks and a month
Between 1 and 2 months
Longer
Unsure
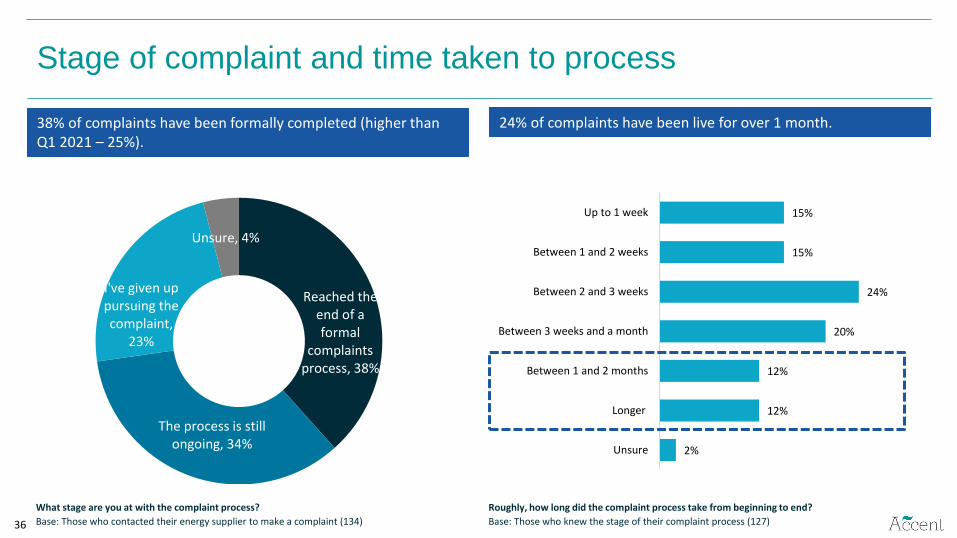
38% of complaints have been formally completed (higher than Q1 2021 – 25%).
24% of complaints have been live for over 1 month.
What stage are you at with the complaint process?
Base: Those who contacted their energy supplier to make a complaint (134)
Roughly, how long did the complaint process take from beginning to end?
Base: Those who knew the stage of their complaint process (127)36

Supplier debt management processes
Supplier support for customers who have fallen behind on bills
38
34%
30%
21%
15%
8%
12%
2%
Provided you with information about the organisations whichcan provide support or advice on managing bills
Asked you some questions about your income and bills andcreated a repayment plan (e.g. by changing your direct debit)
Offered you a bill repayment holiday
Extended the emergency credit on your prepayment meter
They did something else Please type in your answer here
None of these
Don`t know
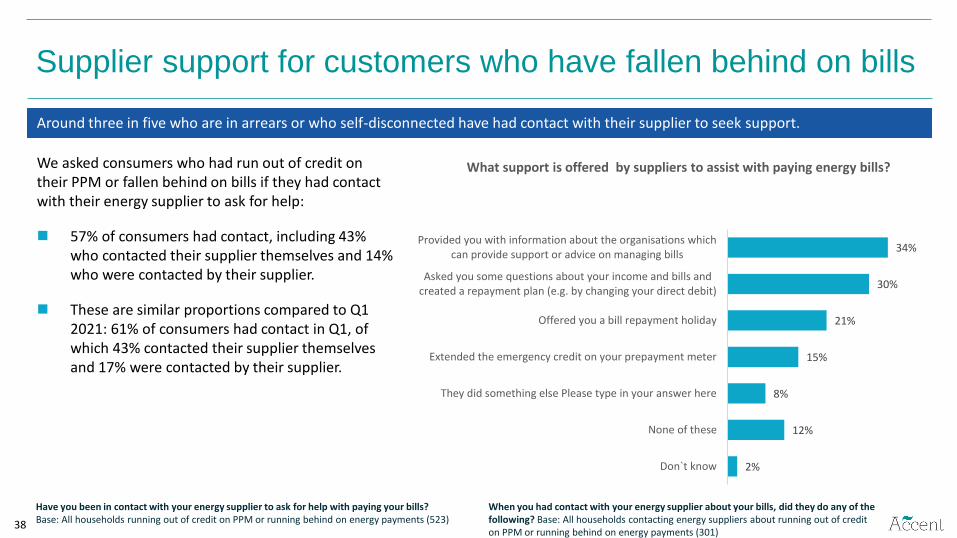
What support is offered by suppliers to assist with paying energy bills? We asked consumers who had run out of credit on their PPM or fallen behind on bills if they had contact with their energy supplier to ask for help:
◼ 57% of consumers had contact, including 43% who contacted their supplier themselves and 14% who were contacted by their supplier.
◼ These are similar proportions compared to Q1 2021: 61% of consumers had contact in Q1, of which 43% contacted their supplier themselves and 17% were contacted by their supplier.
Around three in five who are in arrears or who self-disconnected have had contact with their supplier to seek support.
Have you been in contact with your energy supplier to ask for help with paying your bills?Base: All households running out of credit on PPM or running behind on energy payments (523)
When you had contact with your energy supplier about your bills, did they do any of the following? Base: All households contacting energy suppliers about running out of credit on PPM or running behind on energy payments (301)

Supplier support when having issues paying bills
39
12%
10%
10%
10%
10%
9%
23%
17%
20%
31%
39%
35%
22%
23%
25%
1%
1%
The options they provided to help me manage my bills are helpful
The person I had contact with was sympathetic to my needs
My supplier treated me fairly
Strongly disagree Disagree Neither agree nor disagree Agree Strongly agree Don't know
A majority of those receiving support felt the contact was sympathetic, fair and helpful.
To what extent do you agree or disagree with the following statements about the contact you’ve had with your energy supplier about paying your bills: Base: All households contacting energy suppliers about running out of credit on PPM or running behind on energy payments (301)
Tariffs and information provision
Tariff type
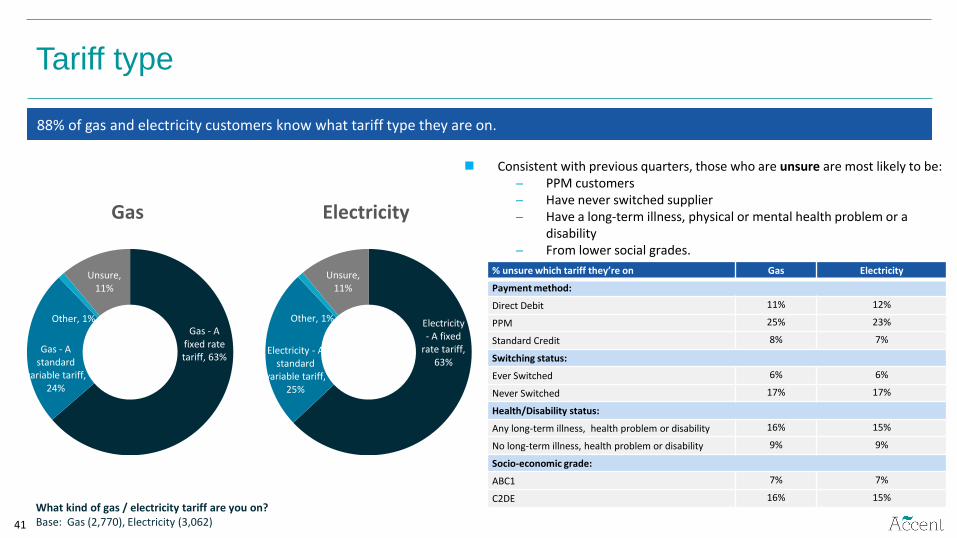
◼ Consistent with previous quarters, those who are unsure are most likely to be: PPM customers Have never switched supplier Have a long-term illness, physical or mental health problem or a
disability From lower social grades.
Gas Electricity
% unsure which tariff they’re on Gas Electricity
Payment method:
Direct Debit 11% 12%
PPM 25% 23%
Standard Credit 8% 7%
Switching status:
Ever Switched 6% 6%
Never Switched 17% 17%
Health/Disability status:
Any long-term illness, health problem or disability 16% 15%
No long-term illness, health problem or disability 9% 9%
Socio-economic grade:
ABC1 7% 7%
C2DE 16% 15%
41
Gas - A fixed rate tariff, 63%
Gas - A standard
variable tariff, 24%
Other, 1%
Unsure, 11%
Electricity - A fixed
rate tariff, 63%
Electricity - A standard
variable tariff, 25%
Other, 1%
Unsure, 11%
What kind of gas / electricity tariff are you on?Base: Gas (2,770), Electricity (3,062)
88% of gas and electricity customers know what tariff type they are on.
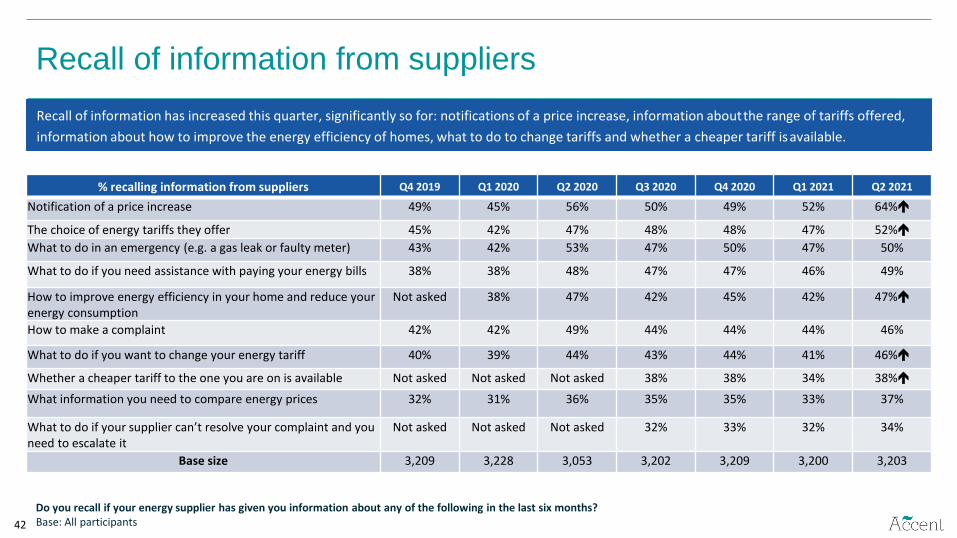
Recall of information from suppliers
42
% recalling information from suppliers Q4 2019 Q1 2020 Q2 2020 Q3 2020 Q4 2020 Q1 2021 Q2 2021
Notification of a price increase 49% 45% 56% 50% 49% 52% 64%
The choice of energy tariffs they offer 45% 42% 47% 48% 48% 47% 52%
What to do in an emergency (e.g. a gas leak or faulty meter) 43% 42% 53% 47% 50% 47% 50%
What to do if you need assistance with paying your energy bills 38% 38% 48% 47% 47% 46% 49%
How to improve energy efficiency in your home and reduce your energy consumption
Not asked 38% 47% 42% 45% 42% 47%
How to make a complaint 42% 42% 49% 44% 44% 44% 46%
What to do if you want to change your energy tariff 40% 39% 44% 43% 44% 41% 46%
Whether a cheaper tariff to the one you are on is available Not asked Not asked Not asked 38% 38% 34% 38%
What information you need to compare energy prices 32% 31% 36% 35% 35% 33% 37%
What to do if your supplier can’t resolve your complaint and you need to escalate it
Not asked Not asked Not asked 32% 33% 32% 34%
Base size 3,209 3,228 3,053 3,202 3,209 3,200 3,203
Do you recall if your energy supplier has given you information about any of the following in the last six months? Base: All participants
Recall of information has increased this quarter, significantly so for: notifications of a price increase, information about the range of tariffs offered,
information about how to improve the energy efficiency of homes, what to do to change tariffs and whether a cheaper tariff isavailable.

Switching

Satisfaction with the switching experience
◼ Satisfaction with switching remains higher among those who used a price comparison website.
Satisfied with ease of comparing suppliers
and prices
Satisfied with the switching process
overall
Did not use a PCW 67% 81%
Used a PCW only to compare suppliers
85% 88%
N.B. Neutral and ‘Don’t know’ responses are not shown
Those paying by direct debit tend to be
more satisfied (87% with the process
overall and 81% with ease of comparing
suppliers).
Whereas those with a long-term illness,
physical or mental health problem or a
disability tend to be less satisfied (72%
with ease of comparing suppliers and 81%
the process overall).
44
4%
4%
79%
85%
Ease of comparing suppliers and their prices
The switching process overall
Dissatisfied Satisfied
There is high satisfaction with the switching process and the ease of comparing suppliers and their prices (consistent with previous quarters).
Please can you tell me how dissatisfied or satisfied you were with the following aspects of your switch to another supplier?
Base: Those who switched their energy supplier (1,366), Did not use a PCW (425), Used a PCW to complete switch (879)

Use of price comparison websites (PCWs)
As with previous quarters, the proportion using PCWs is lowest among:
Those paying by PPM (39%)
Those aged 65+ (57%)
From C2DE social grades (59%)
Those who have a long-term illness, physical or mental health problem or a disability (58%).
45
Yes, 64%
No, 31%
Unsure, 4%
In line with previous quarters, around two thirds (64%) of consumers used a PCW to help switch supplier.
Did you use a price comparison website to help you switch energy supplier?Base: Those who have ever switched supplier (1,366)

Source of energy deal information
15% had heard of the Ofgem accreditation for price
comparison websites, and 13% had heard of the Ofgem
Confidence Code.
Over half of those aware of the Ofgem PCW
accreditation said this had at least some influence on
the comparison website they would use.
46
41%
14%
13%
10%
5%
4%
4%
4%
3%
2%
9%
5%
27%
32%
17%
20%
5%
PCWs remain the most commonly used source of information about energy deals.
How did you find out about the energy deal you switched to? Base: Those who switched their energy supplier (1,366)
To what extent does Ofgem accreditation influence which price comparison website you would use? Base: All aware Ofgem accreditation for price comparison websites (708)
Before today, had you ever heard of the Ofgem Confidence Code or Ofgem accreditation for price comparison websites? Base: All Participants (3,203)
A great deal of influence
Some influence
No influence at all
I haven't used a price comparison website when considering which energy company to use
Don't know
From a price comparison website
I looked at my supplier's website
From an energy deal scanning service
A friend or family member told me about it
I rang my supplier
I used an automated switching service
Through a collective (group) switching campaign organised by a third party
A supplier salesperson knocked at my door
I spoke to a supplier salesperson in the street/ shopping centre / public place
From direct mail
Other
Don't know
51%
42%
31%
18%
14%
19%
13%
11%
8%
4%
2%
5%
2%
18%
7%
6%
10%
7%
6%
3%
9%
They had a better tariff than my old supplier
They had a good/the best tariff
To get a fixed term /fixed price deal
They offered green energy
They have good customer service
They have a good reputation
They are a well known brand
They gave me an incentive for switching to them
To get a smart meter
They offered additional services beyond energy
I had no particular reason for switching to them
Other reason
Unsure
Main reason
Additional reason
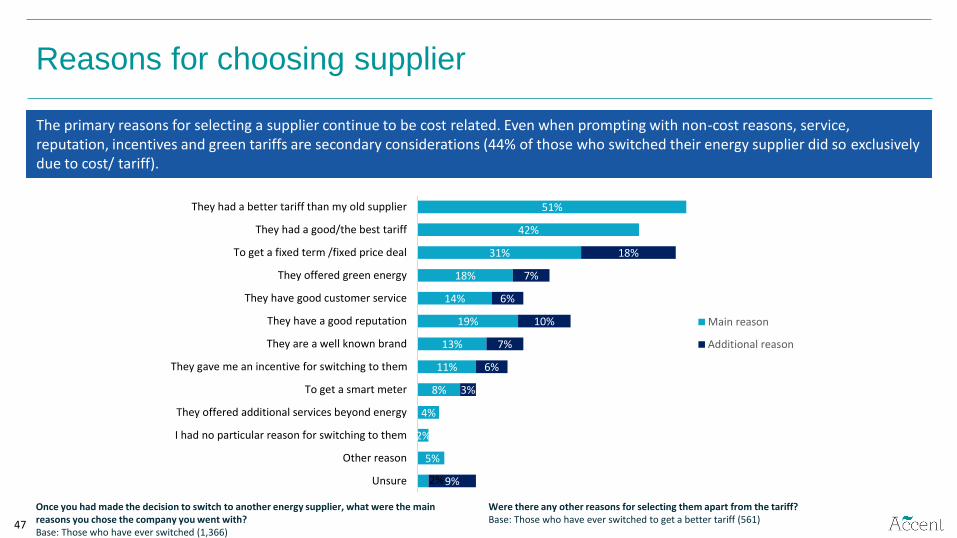
Reasons for choosing supplier
47
The primary reasons for selecting a supplier continue to be cost related. Even when prompting with non-cost reasons, service, reputation, incentives and green tariffs are secondary considerations (44% of those who switched their energy supplier did so exclusively due to cost/ tariff).
Once you had made the decision to switch to another energy supplier, what were the main reasons you chose the company you went with? Base: Those who have ever switched (1,366)
Were there any other reasons for selecting them apart from the tariff? Base: Those who have ever switched to get a better tariff (561)

Reasons for choosing supplier over time
48
Consistent with all previous quarters, the top reasons for choosing supplier remain having a better tariff and to get a fixed price or deal. Offering green energy and supplier reputation are still secondary reasons.
Once you had made the decision to switch to another energy supplier, what were the main reasons you chose the company you went with?Base: Those who have ever switched
Q1 2019 Q2 2019 Q3 2019 Q4 2019 Q1 2020 Q2 2020 Q3 2020 Q4 2020 Q1 2021 Q2 2021
They had a better tariff than my old supplier 52% 54% 57% 54% 54% 55% 55% 53% 54% 51%
They had a good/the best tariff 50% 46% 47% 49% 47% 48% 46% 44% 44% 42%
To get a fixed term /fixed price deal 33% 30% 30% 31% 31% 29% 32% 32% 40% 31%
They offered green energy 9% 13% 14% 16% 16% 19% 18% 19% 19% 18%
They have good customer service 16% 17% 14% 17% 16% 18% 14% 16% 19% 14%
They have a good reputation 16% 17% 16% 19% 17% 19% 17% 18% 17% 19%
They are a well known brand 15% 12% 14% 15% 14% 15% 13% 15% 15% 13%
They gave me an incentive for switching to them 13% 14% 14% 13% 13% 13% 10% 11% 15% 11%
To get a smart meter 7% 7% 6% 5% 8% 6% 7% 8% 12% 8%
They offered additional services beyond energy 3% 4% 4% 4% 4% 5% 4% 4% 9% 4%
I had no particular reason for switching to them 2% 2% 1% 2% 2% 2% 2% 2% 3% 2%
Base size 1,673 1,708 1,695 1,847 1,846 1,646 1,442 1,485 1,405 1,366

Consideration of switching
◼ As with previous quarters, the proportion considering
switching is highest among:
Dissatisfied customers (60%)
Those aged 16 to 64 (23% vs. 13% 65+)
Consumers from ABC1 social grades (23%).
20% are thinking of switching supplier, down from a peak of 23% in Q1 2021.
49
Yes, 20%
No, 60%
Unsure, 20%
20% 21% 22% 20% 20% 21% 18% 20% 18% 23% 20%
63% 61% 62% 64% 63% 60% 65% 61% 62%56% 60%
0%
20%
40%
60%
80%
Q42018
Q12019
Q22019
Q32019
Q42019
Q12020
Q22020
Q32020
Q42020
Q12021
Q22021
Considering switching over time
Yes No
Are you currently considering changing your energy supplier?Base: All Participants (3,203)

Smart meters

Very satisfied, 44%
Satisfied, 32%
Neither satisfied nor dissatisfied,
12%
Dissatisfied, 7%
Very dissatisfied, 4% Unsure, 1%
Smart meter use
51
6%
9%
15%
25%
36%
9%
In the last 3 months
Between 3 and 6 months ago
Between 6 and 12 months ago
Between 1 and 2 years ago
Over 2 years ago
Unsure
When was your smart meter installed?
52% now say they have a smart meter. Three quarters are satisfied with the installation process.
Of the two meters described below, which is the most similar to the one in your home? / When did you have your smart meter installed? Base: All Participants (3,203) / All with smart meter (1,674)
How dissatisfied or satisfied were you with the process you went through to have a smart meter installed? Base: All with smart meter installed in last 6 months (260)* Note rounding differences between the chart and the net satisfaction score
% of participants
3%
4%
7%
12%
18%
4%
Taken together 77% are satisfied or very satisfied with the installation*

Satisfaction with smart meter installation over time
52
76%73% 75% 73% 74%
80%
72%
80%76%
81%77%
7% 9% 11% 10% 11% 9% 11%5%
9% 9% 11%
0%
10%
20%
30%
40%
50%
60%
70%
80%
90%
Q4 2018 Q1 2019 Q2 2019 Q3 2019 Q4 2019 Q1 2020 Q2 2020 Q3 2020 Q4 2020 Q1 2021 Q2 2021
Satisfaction with smart meter installation process
Satisfied Dissatisfied
Satisfaction with smart meter installation is steady between Q1 2021 and Q2 2021.
How dissatisfied or satisfied were you with the process you went through to have a smart meter installed?
Base: All with smart meter installed in last 6 months (260)

Satisfaction with smart meter overall
◼ Satisfaction is higher among:
Customers who are satisfied with their supplier
(81%)
Those aged 16-34 (78%).
53
Very satisfied, 35%
Satisfied, 36%
Neither satisfied nor dissatisfied,
18%
Dissatisfied, 5%
Very dissatisfied, 3% Unsure, 3%
71% are satisfied with their smart meter.
Overall, how satisfied or dissatisfied are you with your smart meter?
Base: All with a smart meter (1,680)

Annex

Measuring smart meter use
Meter A Meter BMonitors energy use Monitors energy useAutomatically sends readings of how much energy has been used in your home to your supplier
You or someone else in your household personally send readings of how much energy has been used in your home to your supplier OR someone from your supplier visits your home to take meter readings
Shows how much energy has been used in pounds and pence on a display or an app or online account
Does not show how much energy has been used in pounds and pence on a display or an app or online account
Has been installed in the last 5 years Has been installed more than 5 years agoSHOW IF HAVE A PRE-PAYMENT METER Allow those who pre-pay for energy to top up via their mobile or online
SHOW IF HAVE A PRE-PAYMENT METER Those who pre-pay for energy must top up at a pay point, post office or other shop
◼ Use of smart meters is measured by asking participants to indicate which of the following best described the energy meters they have in their home.
◼ The question is asked separately of gas and electricity. The order of the meter descriptions was randomised across the surveysample.
◼ Those selecting the description for Meter A (the titles remained static) for either gas or electricity are deemed to have a smart meter.
55