consumer perception towards mobile marketing in …
TRANSCRIPT

ELK ASIA PACIFIC JOURNAL OF MARKETING & RETAIL MANAGEMENT ISSN 2349-2317 (Online); DOI: 10.16962/EAPJMRM/issn. 2349-2317/2018; Volume 9 Issue 4 (2018)
1
www.elkjournals.com
…………………………………………………………………………………………………
CONSUMER PERCEPTION TOWARDS MOBILE MARKETING IN NCR
& JAIPUR REGION
Neha Gupta
Research Scholar, Amity Business School,
Amity University Rajasthan, India,
Dr. Deepali Bhatnagar
Associate Professor, Amity Business
School, Amity University Rajasthan , India,
ABSTRACT
In today’s era, consumer perception totally getting change when these drivers with new
technologies occurred in market. Selling, buying of products and services and make consumers
life comfortable and time saving from which they even start up with their businesses online by a
wireless device. To know how consumers, perceive mobile marketing, an empirical study was
conducted. A survey questionnaire was administered, which measures consumer perception
towards mobile marketing in four different areas namely psychological, social, technological
and cognitive aspects. The Questionaries’ was used. Convenient sampling technique was used to
selection of 100 individuals who use mobile services. Among them 50 were from NCR region and
50 were from Jaipur, in each group 25 male were selected and 25 females were selected. Finding
of the study reveal Individuals from Delhi perceived to have headache problems, as compared to
individuals from Jaipur by using mobile based marketing apps. No significant differences were
found on other areas i.e. eye pain, ear pain or frustration and on overall scores. No gender
differences were found on overall ill health effects and its components i.e. eye, ear pain, head
ache or frustration. Perception of various mobile based applications for marketing shows that
individuals from Delhi shows higher use of Shopping App Lifestyle App, Women Safety App,
Social Networking apps as compared to individuals from Jaipur, where as individuals from
Jaipur reported higher use of Education Apps, Books App, Travelling App, Search Apps, Overall
Application as compared to individuals from Delhi. Gender difference are found, males
frequently use lifestyle apps, collage apps as compared to females, whereas females frequently
use of books app, travelling app, as compared to males. No gender difference was found
frequency of uses for Shopping, women safety, education, social networking, entertainment,
search and overall application use. Keywords: Consumer Perception, Mobile Marketing, Marketing Applications, consumer perception.

ELK ASIA PACIFIC JOURNAL OF MARKETING & RETAIL MANAGEMENT ISSN 2349-2317 (Online); DOI: 10.16962/EAPJMRM/issn. 2349-2317/2018; Volume 9 Issue 4 (2018)
2
INTRODUCTION:
In 2000s early when cell phones were used
as a Marketing tool in most popular tool was
SMS in those years. SMS use to spread
advertisement of product and services to the
consumer which help them to make their
positive or negative perception. (Direct
Marketing Association,2002) messages
experience was less positive around 65%,
telemarketing and door to door services was
30%, email, mail order and Internet
experience were 80%. In this study, it has
been indicated that perception of the
consumers is framed out with lesser
experience of SMS as there was high
percentage of emails, mail order and
Internet. Prasad and Raman (2003), argues
that mobile apps customer barely get a
chance to compare or review competitions
offerings. Framework of mobile marketing
is to build up sales promotion, enhancing
brand loyalty, invitation to the consumers or
updates for special events, consumer
perception can be improved through band
image, building of database of customers.
According to the Funk (2004) advertising is
the most effectual feasible selling message
to the legal prospects at the minimum cost.
Advertising is also called as paid form
promotion of goods, services and ideas and
its non-personal presentation through
electronic media likewise magazines,
television and newspapers. According to
Benedict & Geyskens (2006) consumers
using mobile marketing receives messages
related to coupons and discounts which are
further passed on to friend’s relatives and
family members this is how promotion keep
on spreading.
E-Online apps have offered consumers a
wide variety of choices. It enables
consumer to choose variety of products with
discounts and coupons even on a small
screen. Products are visible on
customizable lists more easily visible as per
the need of consumer. Based on the findings
of their study Frolick & Chen (2004) states
that customer mobile environment offered
plethora of modes, it can be ranging from
phone calls, promotional SMS, SMS, and
E-mails etc. Findings of Barnes, S.J. (2002),
states that mobile marketing, advertising
“wireless”, Marketing “wireless” and
advertising done “wireless”, Consumer
perception for new technology has changed.
It became more positive for mobile
marketing because it’s convenient way to
operate and get detailed notifications about
products, services and ideas easily and
wirelessly.

ELK ASIA PACIFIC JOURNAL OF MARKETING & RETAIL MANAGEMENT ISSN 2349-2317 (Online); DOI: 10.16962/EAPJMRM/issn. 2349-2317/2018; Volume 9 Issue 4 (2018)
3
Seth et, al 2010, argues that business is
growing on a high peek continuously
likewise Dominos, Food Panada, Zomato,
pizza hut, just dial and many more because
they provide much better deals on mobile
apps from which customers are tempting
more. This kind of businesses is earning
more profits. McCarthy (2012), argues that
mobile apps have removed plastic cards
may be its Credit, Debit, ATM cards from
the pockets and papers from the wallets.
Because all kind of transactions whether it
is big or small can be done through various
payment apps and banking apps.
Consumers can easily choose the rows they
want to sit in book tickets. Same booking
scenario realized for hotel booking,
booking a trip, tickets for fights, bus and
train etc.
Fesenmaier (2012), argues that perception
of the consumer affected by their
experiences, advertisement, social media,
and review of the people, personal
experiences and public relations. Marketing
through mobile phone perception has drawn
in customers mind when they experienced
themselves or getting aware from
advertisements. As the rating of marketing
tools (SMS, MMS, APPS, Calls, and
Emails) increased the discounts and
coupons start increasing gradually. People
are more of mobile savvy because of few
attributes like connivance, quick access
from anywhere, time saving, money saving
and services. Koenigstorfer & Groeppel-
Klein, (2012) research is to find out how
consumers personality in younger (vs.
older) men (vs. women) affects behavioral
choices of the mobile internet, as an
example of new technology, and how usage
time affects perceived ease of use of
innovative (vs. established) media.
Findings revealed that innovativeness, low
desire for social contact, and technology
optimism, in interaction with
demographics, determine whether
consumers choose mobile Internet services
over substitutes
Watson, McCarthy, & Rowley, (2013)
suggest that acceptance can be enhanced by
permission marketing, trust-building,
creating a sense of being in control, and
useful and entertaining website content.
Pull technologies seem to hold promise for
mobile marketing communications. Ease of
use, utility and incentives are drivers to
continued use whilst lack of knowledge
about how-to scan or of the benefits of QR
codes may hinder adoption. Hur, Lee, &
Choo, (2017) in a study based on
Technology Acceptance Model (TAM)
verify the relationship between variables
ELK ASIA PACIFIC JOURNAL OF MARKETING & RETAIL MANAGEMENT ISSN 2349-2317 (Online); DOI: 10.16962/EAPJMRM/issn. 2349-2317/2018; Volume 9 Issue 4 (2018)
4
related to technological innovativeness and
fashion innovativeness. It was found that
Consumers with a high degree of
technological innovativeness tended to find
the fashion app easy to use, derived
enjoyment from using it, and adopted it if
the app is useful. However, those with a
high degree of fashion innovativeness
adopted the fashion service simply because
it was fun to use rather than beneficial or
useful.
OBJECTIVES:
Based on the review of literature following
objectives were made for present study:
1. To study regional differences in
ill health effects using mobile-
based marketing application.
2. To study gender differences in ill
health effects using mobile-based
marketing application.
3. To study regional differences in
frequency by various applications
for mobile based marketing.
4. To study gender differences in
frequency of use of by various
applications for mobile based
marketing.
Hypothesis
Based on literature review following
hypothesis were drawn:
Ho.1 There will be no significant
regional differences in ill health
effects using mobile based
marketing application.
Ho.2 There will be no significant
gender differences in ill health
effects using mobile based
marketing application.
Ho.3 There will be no significant
regional differences by frequency
of use of various applications for
mobile based marketing.
Ho.4 There will be no significant
gender differences by frequency
of use of various applications for
mobile based marketing.
RESEARCH METHODOLOGY:
Variables:
Independent Variable for the study were
region (Delhi NCR & Jaipur) & gender
(Females/Males) where as consumer
perception due ill mental health and
frequency of mobile application use for
mobile based marketing is taken as
dependent variable.
ELK ASIA PACIFIC JOURNAL OF MARKETING & RETAIL MANAGEMENT ISSN 2349-2317 (Online); DOI: 10.16962/EAPJMRM/issn. 2349-2317/2018; Volume 9 Issue 4 (2018)
5
Tools Used:
Present study was conducted to find the
impact of consumer perception for mobile
marketing among individuals from NCR
and Jaipur region.
a) For this consumer views related to
Health Illness Effects were measured
on 5-point Likert scale ranging from
strongly agrees (5), Agree (4),
Neutral (3), Disagree (2) and Strongly
Disagree (1) respectively as per the
nature of questions asked.
b) The frequency of use of mobile
application was measured on 5-point
Likert scale ranging from Very
Frequently (5), Frequently (4),
Occasionally (3), Rarely (2), Never
(1).
Sample
Convenient sampling technique was
adopted in this empirical study for 100
individuals who use mobile & internet
services for marketing were selected.
Among them, 50 were from NCR region
and 50 were from Jaipur, in each group 25
male were selected and 25 females were
selected.
Region
Delhi (NCR) Jaipur
50 Individuals 50 Individuals
G
e
n
d
e
r
Males Females Males Females
25 25 25 25
Sample Distribution
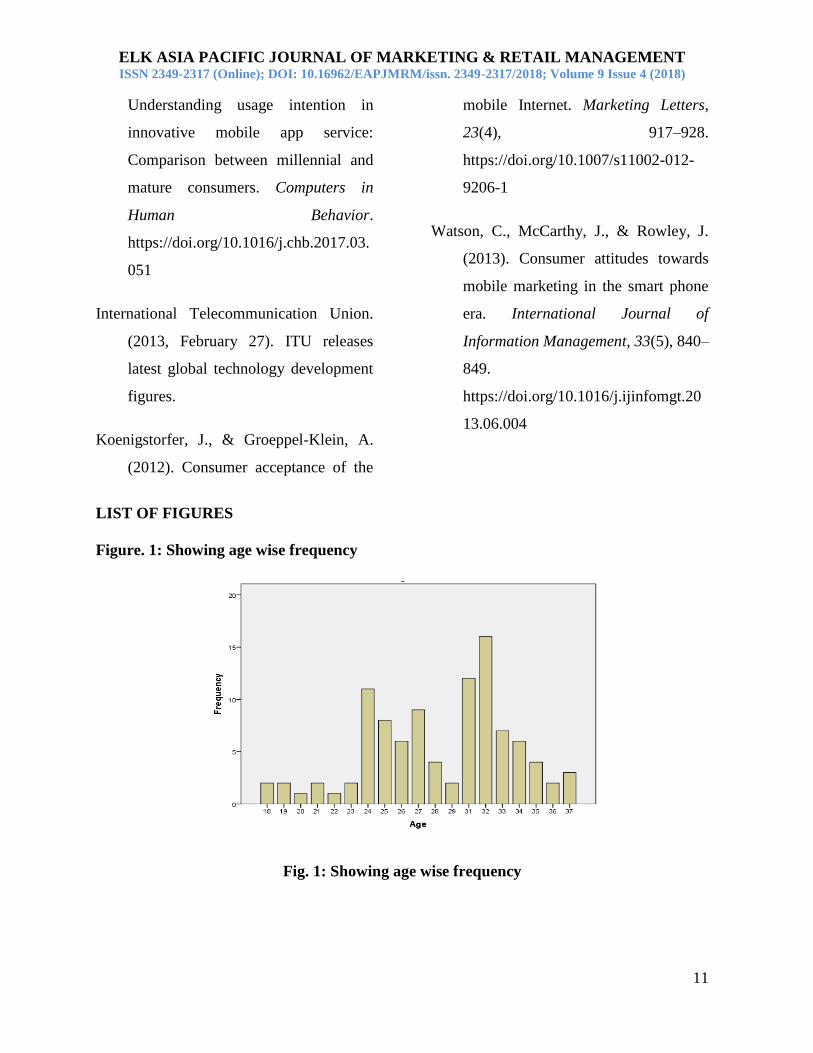
Age Group: The mean age of the sample of
100 individuals is 28.81 years among which
50 males with mean age 28.84 and 50
females mean age was 28.78. (Ref Figure-
1) & (Ref Table- 1)
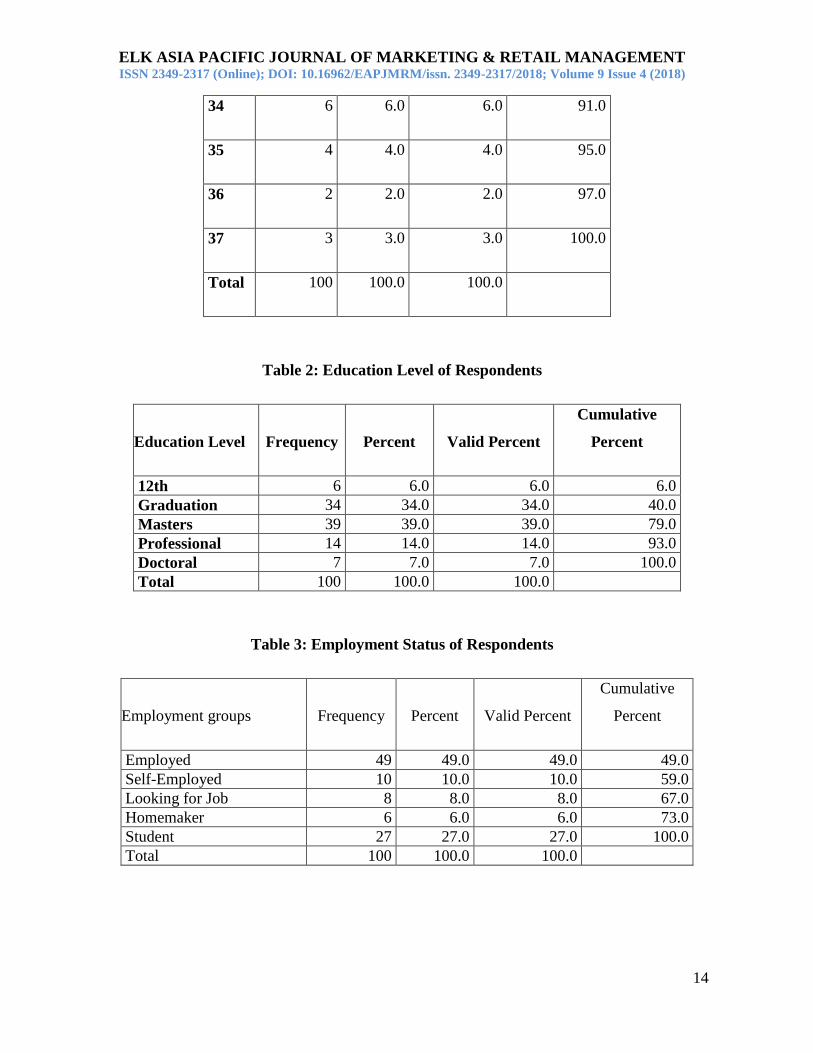
The table shows the percentage of
educational qualification status out of 100
respondents, 12th (6.0%), Graduation
(34.0%), Masters (39.0%), Professional
(14.0%), Doctoral (7.0%). (Ref Table- 2) &
(Ref Figure- 2)
Employment Status: The table shows the
percentage of Employment status out of 100
respondents, employed (49 %), self-
employed (10%) looking for job are, (8%)
homemaker (6%) and retired (27%)
respondents (Ref Table- 3) & (Ref Figure-
3)
Marital Status: In the overall sample of
100 individuals 40% respondents were
single and 40 % were married individuals.
(Ref Table- 4)
ELK ASIA PACIFIC JOURNAL OF MARKETING & RETAIL MANAGEMENT ISSN 2349-2317 (Online); DOI: 10.16962/EAPJMRM/issn. 2349-2317/2018; Volume 9 Issue 4 (2018)
6
Inclusion Criterion
1. Individuals between the age range of
20 – 40 years are included in the
study.
2. Individuals either working or residing
in NCR and Jaipur region are
included in the study.
Exclusion criterion
1. Individuals below 20 years and above
40 years are excluded.
2. Individual who don’t use smart
phones & mobile internet are
excluded.
Procedure
To achieve objectives of the study, the
Questionnaire was prepared on Google
form (online form) and URL link of this
questionnaire shared through emails and
mobile media and responses were also
collected through paper pencil
questionnaire and in total, 150
questionnaires distributed among the
respondents who are using the mobile as a
marketing tool in NCR and Jaipur region,
out of which 100 received from the
respondents, the information of 100
respondents coded and entered in the
Microsoft Excel Software.
Statistical Test
Descriptive statistics, t-test, ‘Pearson-r’
correlation and regression were
administered, Data analysis was done with
the help of Statistical Package for the Social
Sciences (SPSS) Software 22 Version.
RESULT AND DISCUSSION
The objective of the study was to find out
the Consumer Perception towards Mobile
based Marketing. The tables below show
the mean and Std. Deviation t- values of the
consumer perception of ill health effect and
their perception of how frequently they use
different type of mobile based marketing
apps.
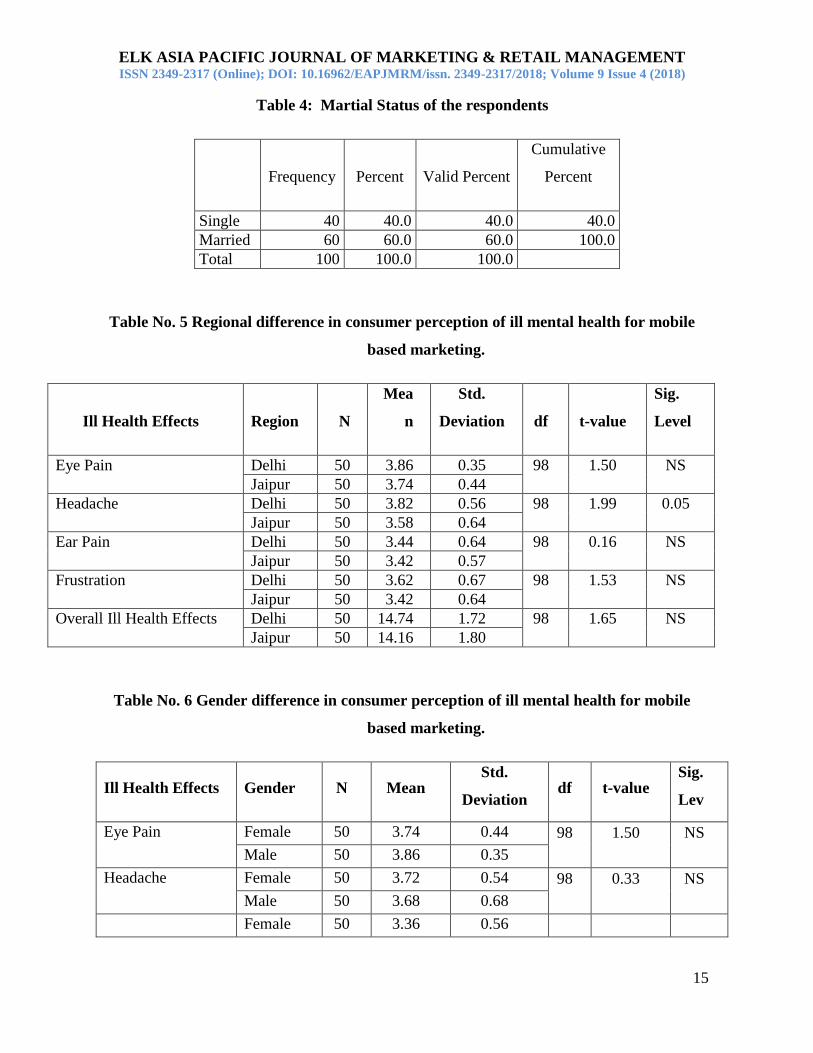
The first objective was to compare the
regional differences in consumer perception
of ill mental health for mobile based
marketing. It was hypothesized that there
will be no significant regional differences in
ill health effects using mobile based
marketing application. Findings of (Ref
Table 5) shows that among overall 4 ill
health effects individuals from Delhi and
Jaipur differ significantly in headache, as t
(98) =1.99. p<.05. Individuals from Delhi
reported more headache, µ1=3.82±.56 as
compared to individuals from Jaipur,
µ2=3.58±.64. This can be because people
from metro city like Delhi are more depend

ELK ASIA PACIFIC JOURNAL OF MARKETING & RETAIL MANAGEMENT ISSN 2349-2317 (Online); DOI: 10.16962/EAPJMRM/issn. 2349-2317/2018; Volume 9 Issue 4 (2018)
7
on mobile based technology is higher as
compared to people from Jaipur, as a result,
their exposure to headphones and screen
light of mobile phones is higher which
could be a probable cause for headache. No
significant differences are found in other
sub-components i.e. eye pain, ear pain or
frustration and on overall scores, thus the
null hypothesis is accepted.
The second objective was to compare the
gender differences in consumer perception
of ill mental health for mobile based
marketing. It was hypothesized that there
will be no significant gender differences in
ill health effects using mobile based
marketing application. The findings of (Ref
Table 6) show no significant difference in
overall ill health effects and components.
Thus, null hypothesis is accepted. Males
and females both have equal opportunity to
access mobile technology so there were no
gender differences.
Third objective was to compare regional
difference in frequency of use of various
applications for mobile based marketing. It
was hypothesized that there will be no
significant regional differences in
frequency of use of various applications for
mobile based marketing. The Findings of
(Ref Table 7) depicts that individuals from
Delhi show significantly higher use of
Shopping App, t (98) =3.16, p<.01, µ1 =
4.04±.75 > µ2 =3.52±.89, Lifestyle App, t
(98)=5.40, p<.01, µ1 = 4.14±1.03 > µ2
=3.18±.72, Women Safety App, t (98)=5.57,
p<.01, µ1 = 3.80 ± .70 > µ2 =2.62 ± 1.32,
Social Networking apps (WhatsApp ), t
(98)=3.21, p<.01, µ1 = 4.96±.20 > µ2
=4.74±.44, as compared to individuals from
Jaipur. Since, in metro cities individual are
trendier and updated in terms use of latest
fashion related product, so shopping is first
preference for them which become more
convenient by a mobile phone when the
delivery is available on door steps and with
easy payment option via mobile based apps.
Since, job opportunities are vast, due to
night shifts in offices, night life are common
in Delhi as compared Jaipur, leading to high
safety concerns for women, due to which
they are frequent user of women safety
apps. Even at workplace in Delhi
communication on social net-working apps
like WhatsApp. which is more convenient
over calls, is higher as compared to Jaipur
individuals. Whereas individuals from
Jaipur showed significantly higher use of
Education Apps, t (98)=3.16, p<.01,
µ2=3.56±1.03 > µ1=2.98±1.19, Books App, t
(98)=3.16, p<.01, µ2=3.92±.90 >
µ1=3.00±1.07, Travelling App, t (98)=3.16,

ELK ASIA PACIFIC JOURNAL OF MARKETING & RETAIL MANAGEMENT ISSN 2349-2317 (Online); DOI: 10.16962/EAPJMRM/issn. 2349-2317/2018; Volume 9 Issue 4 (2018)
8
p<.01, µ2=4.22±.82 > µ1=3.64±.94, Search
Apps, t (98)=2.43, p<.05, µ2=4.68±.47 >
µ1=4.32±.94, Overall Application, t
(98)=4.06, p<.05, µ2=37.62±4.39>
µ1=33.92±4.72 , use as compared to
individuals from Delhi. Thus, null
hypothesis is rejected. On other hand
individuals at Jaipur are more frequent user
of education related apps, search apps due
to less availability of such options.
Whereas, no significant difference was
observed in the use of Entertainment App,
Collage App among individuals from Jaipur
and Jodhpur. The frequency of these
application is equal among individuals from
Delhi or Jaipur.
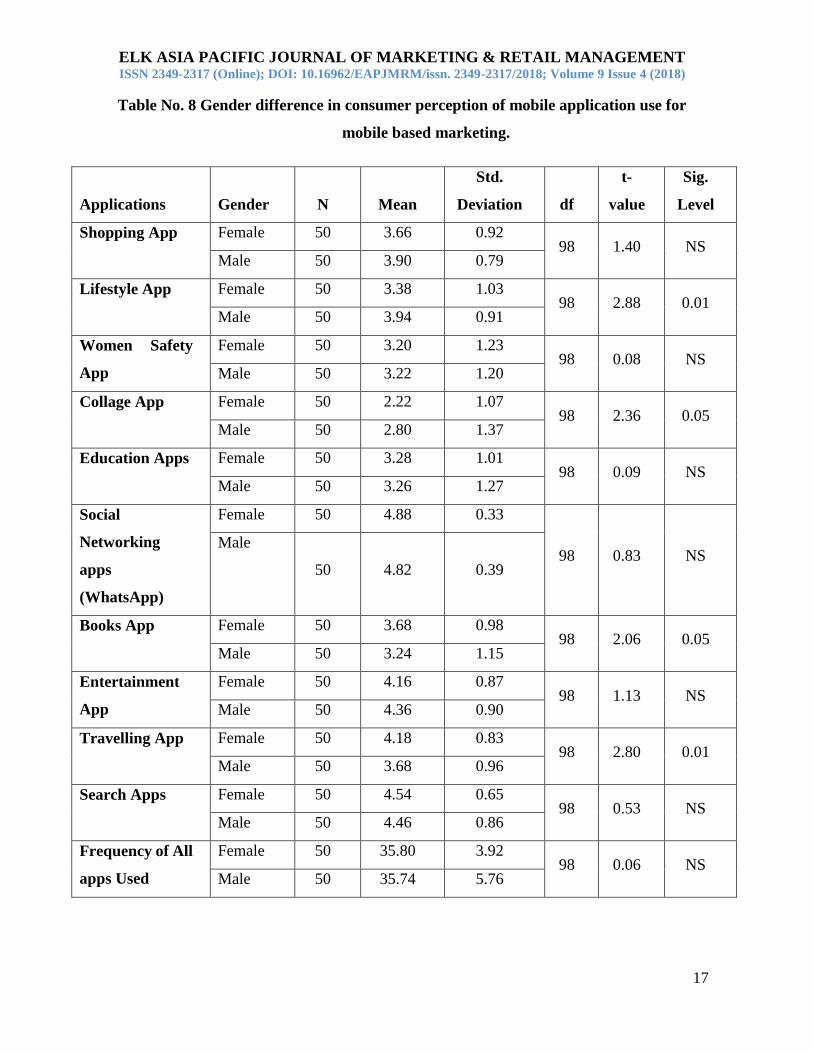
Fourth objective was to find gender
differences in frequency of use of various
applications for mobile based marketing. It
was hypothesized that there will be no
significant gender differences in frequency
of use of various applications for mobile
based marketing. Findings of (Ref Table 8)
reveal that significant gender difference
was found in the use of lifestyle apps,
collage app, book apps and travelling apps.
It was found that perception of frequency of
use by males (µ2 = 3.94 ± .91) for lifestyle
apps is significantly higher than that of
females (µ1= 3.38± 1.03) and t (98) =2.88,
p<.01. Similarly, on perception of
frequency of use by males (µ2 = 2.80 ±1.37)
for collage apps is significantly higher than
females (µ1 = 2.22 ±1.07) and t (98) =2.36,
p<.05. This can be because females prefer
to try outfits before purchase as compared
males, therefore male preference on mobile
based lifestyle related apps is found higher,
on other hand males are easily satisfied by
the information available related to
collages, and institutions whereas females
prefer to verify them in physical presence
which can be the probable cause for the
higher use of collage apps by males.
Whereas females reported higher scores on
perception of use of books app (µ1= 3.68±
.98) as compared to males (µ2 = 2.80 ±1.15)
and t (98) =2.06, p<.05. Similar were the
findings of travelling app, females reported
significantly higher scores (µ1= 4.18± .83)
as compared to males (µ2 = 3.68 ±.96) and t
(98) =2.80, p<.01. Females have less
opportunities to go out and purchase of new
books even for travelling they can’t go
alone, thus feel more secure reading books
online or e-books, and travelling through
application registered mobile based security
like Ola, Taxi wale, uber, e- booking via
train applications. Thus, fourth null
hypothesis is rejected for lifestyle apps,
collage app, book apps and travelling
applications. No significant gender
ELK ASIA PACIFIC JOURNAL OF MARKETING & RETAIL MANAGEMENT ISSN 2349-2317 (Online); DOI: 10.16962/EAPJMRM/issn. 2349-2317/2018; Volume 9 Issue 4 (2018)
9
difference was found on perception of use
of Shopping, women safety, education,
social networking, entertainment, search
and overall application use. This can be due
to equal importance of these application for
males and females so, significant
differences were found. Thus, fourth
hypothesis is accepted for these
applications.
CONCLUSION
Present study investigates regional &
differences and gender differences in the
perception of ill health effects and
perception of use of different types of
mobile application as marketing tools. It
can be concluded that mobile based
technology is equally accessible at all i.e.
places whether it is Delhi or Jaipur and
among males or females, so no difference is
present in terms of health ill effect of mobile
technology. Uses of shopping, lifestyle
social networking application are more
common among Delhiite as compared to
Jaipurians, this offers them a variety of
option to compare, choose and easy options
for purchasing via delivery at door steps and
cashless payments through shopping apps,
even for female’s security they rely and
prefer mobile based technology since they
are easily accessible and less time
consuming as they are more adaptable to
changes with markets trends. On other hand
there are variety of educational institutions,
advanced libraries and updated advanced
quality facilities are available for Delhiite
so it is more approachable for them to
physically enrol for such program, whereas
at Jaipur such facilities are no available and
they must depend on internet-based
facilities especially mobile technology
which is handy, easy to use and affordable
with easy subscriptions. Individuals from
different places of equally access need
information for educations even individuals
from all age group, gender or culture users
of Entertainment apps as a variety of
content matching their interest are available
on their fingertips. Males frequently use
lifestyle apps, college or institutional apps
as compared to females, males don’t have
variety choices in terms of clothes or other
lifestyle-related goods, since they have fix
choices so without trying they buy directly
in one go however females have variety of
option in all range of life style based
products and they are so particular for
colour combinations for which they take
more time in decision making and thus they
preferred to visit stores and physically
verify and feel the articles and then buy
after personal satisfaction. Females are
ELK ASIA PACIFIC JOURNAL OF MARKETING & RETAIL MANAGEMENT ISSN 2349-2317 (Online); DOI: 10.16962/EAPJMRM/issn. 2349-2317/2018; Volume 9 Issue 4 (2018)
10
frequent user of books app, travelling app,
as compared to males. No such gender
difference was found frequency of uses for
Shopping, women safety, education, social
networking, entertainment, search and
overall application use.
Limitations:
1. The present study was limited to
individuals to individuals from urban
areas of Delhi NCR and Jaipur.
2. The sample was small to generalize
the result on overall population.
3. Only regional and gender differences
were studied as independent
variables.
4. Only two aspects of consumer
perception for mobile based
marketing that is psychological as ill
health effects and technological
aspect in terms of ease and frequency
of use of various applications were
taken into consideration.
5. The age group selected was in the
range of 21-40 years, teenager was
not involved in the study.
Suggestions:
The findings of present study can be
replicated on other variables such as
different age group, culture, Qualifications,
individuals from different profession,
Frequency of time spent on internet, how
secured they feel on mobile marketing, ease
of payment mode, socialization through
long distance networking, type of
marketing message conveyed for
advertisement, Quality and authenticity of
content for marketing, Mobile network and
technology of mobile phone used in terms
of usage of smartphone devices, modes and
benefits of mobile phone services in terms
of calls, SMS, mobile applications, pop-up
notifications.
REFERENCES:
Barnes, S.J. (2002) the mobile commerce
value chain: analysis and future
developments. International Journal
of Information Management, 22 (2),
91-108.
Frolick, M.N., Chen, L.D. (2004).
Assessing m-commerce opportunities.
Information Systems Management 21
(2), 53-61.
Funk, J. L. (2004) Key technological
trajectories and the expansion of
mobile Internet applications, info, 6
(3), 208-215.
Hur, H. J., Lee, H. K., & Choo, H. J. (2017).
ELK ASIA PACIFIC JOURNAL OF MARKETING & RETAIL MANAGEMENT ISSN 2349-2317 (Online); DOI: 10.16962/EAPJMRM/issn. 2349-2317/2018; Volume 9 Issue 4 (2018)
11
Understanding usage intention in
innovative mobile app service:
Comparison between millennial and
mature consumers. Computers in
Human Behavior.
https://doi.org/10.1016/j.chb.2017.03.
051
International Telecommunication Union.
(2013, February 27). ITU releases
latest global technology development
figures.
Koenigstorfer, J., & Groeppel-Klein, A.
(2012). Consumer acceptance of the
mobile Internet. Marketing Letters,
23(4), 917–928.
https://doi.org/10.1007/s11002-012-
9206-1
Watson, C., McCarthy, J., & Rowley, J.
(2013). Consumer attitudes towards
mobile marketing in the smart phone
era. International Journal of
Information Management, 33(5), 840–
849.
https://doi.org/10.1016/j.ijinfomgt.20
13.06.004
LIST OF FIGURES
Figure. 1: Showing age wise frequency
Fig. 1: Showing age wise frequency

ELK ASIA PACIFIC JOURNAL OF MARKETING & RETAIL MANAGEMENT ISSN 2349-2317 (Online); DOI: 10.16962/EAPJMRM/issn. 2349-2317/2018; Volume 9 Issue 4 (2018)
12
Figure. 2: Distribution of Respondent based on Educational Level
Fig. 2: Distribution of Respondent based on Educational Level
Figure. 3: Distribution of Respondents Employment
.
Figure. 3: Distribution of Respondents Employment

ELK ASIA PACIFIC JOURNAL OF MARKETING & RETAIL MANAGEMENT ISSN 2349-2317 (Online); DOI: 10.16962/EAPJMRM/issn. 2349-2317/2018; Volume 9 Issue 4 (2018)
13
LIST OF TABLES
Table 1 Age Distribution of Respondents
Age Frequency Percent
Valid
Percent
Cumulative
Percent
18 2 2.0 2.0 2.0
19 2 2.0 2.0 4.0
20 1 1.0 1.0 5.0
21 2 2.0 2.0 7.0
22 1 1.0 1.0 8.0
23 2 2.0 2.0 10.0
24 11 11.0 11.0 21.0
25 8 8.0 8.0 29.0
26 6 6.0 6.0 35.0
27 9 9.0 9.0 44.0
28 4 4.0 4.0 48.0
29 2 2.0 2.0 50.0
31 12 12.0 12.0 62.0
32 16 16.0 16.0 78.0
33 7 7.0 7.0 85.0
ELK ASIA PACIFIC JOURNAL OF MARKETING & RETAIL MANAGEMENT ISSN 2349-2317 (Online); DOI: 10.16962/EAPJMRM/issn. 2349-2317/2018; Volume 9 Issue 4 (2018)
14
34 6 6.0 6.0 91.0
35 4 4.0 4.0 95.0
36 2 2.0 2.0 97.0
37 3 3.0 3.0 100.0
Total 100 100.0 100.0
Table 2: Education Level of Respondents
Education Level Frequency Percent Valid Percent
Cumulative
Percent
12th 6 6.0 6.0 6.0
Graduation 34 34.0 34.0 40.0
Masters 39 39.0 39.0 79.0
Professional 14 14.0 14.0 93.0
Doctoral 7 7.0 7.0 100.0
Total 100 100.0 100.0
Table 3: Employment Status of Respondents
Employment groups Frequency Percent Valid Percent
Cumulative
Percent
Employed 49 49.0 49.0 49.0
Self-Employed 10 10.0 10.0 59.0
Looking for Job 8 8.0 8.0 67.0
Homemaker 6 6.0 6.0 73.0
Student 27 27.0 27.0 100.0
Total 100 100.0 100.0
ELK ASIA PACIFIC JOURNAL OF MARKETING & RETAIL MANAGEMENT ISSN 2349-2317 (Online); DOI: 10.16962/EAPJMRM/issn. 2349-2317/2018; Volume 9 Issue 4 (2018)
15
Table 4: Martial Status of the respondents
Frequency Percent Valid Percent
Cumulative
Percent
Single 40 40.0 40.0 40.0
Married 60 60.0 60.0 100.0
Total 100 100.0 100.0
Table No. 5 Regional difference in consumer perception of ill mental health for mobile
based marketing.
Ill Health Effects Region N
Mea
n
Std.
Deviation df t-value
Sig.
Level
Eye Pain Delhi 50 3.86 0.35 98 1.50 NS
Jaipur 50 3.74 0.44
Headache Delhi 50 3.82 0.56 98 1.99 0.05
Jaipur 50 3.58 0.64
Ear Pain Delhi 50 3.44 0.64 98 0.16 NS
Jaipur 50 3.42 0.57
Frustration Delhi 50 3.62 0.67 98 1.53 NS
Jaipur 50 3.42 0.64
Overall Ill Health Effects Delhi 50 14.74 1.72 98 1.65 NS
Jaipur 50 14.16 1.80
Table No. 6 Gender difference in consumer perception of ill mental health for mobile
based marketing.
Ill Health Effects Gender N Mean Std.
Deviation df t-value
Sig.
Lev
el Eye Pain Female 50 3.74 0.44 98 1.50 NS
Male 50 3.86 0.35
Headache Female 50 3.72 0.54 98 0.33 NS
Male 50 3.68 0.68
Female 50 3.36 0.56

ELK ASIA PACIFIC JOURNAL OF MARKETING & RETAIL MANAGEMENT ISSN 2349-2317 (Online); DOI: 10.16962/EAPJMRM/issn. 2349-2317/2018; Volume 9 Issue 4 (2018)
16
Ear Pain Male 50 3.50 0.65 98 1.15 NS
Frustration Female 50 3.44 0.64 98 1.22 NS
Male 50 3.60 0.67
Overall Ill Health
Effects
Female 50 14.26 1.69 98 1.07 NS
Male 50 14.64 1.86
Table No. 7 Regional difference in consumer perception of mobile application use for
mobile based marketing.
Applications Region N
Mea
n
Std.
Deviation df t-value
Sig.
Level
Shopping App Delhi 50 4.04 0.75 98 3.16 0.01
Jaipur 50 3.52 0.89
Lifestyle App Delhi 50 4.14 1.03 98 5.40 0.01
Jaipur 50 3.18 0.72
Women Safety App Delhi 50 3.80 0.70 98 5.57 0.01
Jaipur 50 2.62 1.32
Collage App Delhi 50 2.32 1.19 98 1.52 NS
Jaipur 50 2.70 1.31
Education Apps Delhi 50 2.98 1.19 98 2.61 0.01
Jaipur 50 3.56 1.03
Social Networking
apps (WhatsApp)
Delhi 50 4.96 0.20 98 3.21 0.01 Jaipur 50 4.74 0.44
Books App Delhi 50 3.00 1.07 98 4.66 0.01
Jaipur 50 3.92 0.90
Entertainment App Delhi 50 4.18 0.98 98 0.90 NS
Jaipur 50 4.34 0.77
Travelling App Delhi 50 3.64 0.94 98 3.29 0.01
Jaipur 50 4.22 0.82
Search Apps Delhi 50 4.32 0.94 98 2.43 0.05
Jaipur 50 4.68 0.47
Overall Application
use
Delhi 50 33.9
2
4.72 98 4.06 0.00 Jaipur 50 37.6
2
4.39
ELK ASIA PACIFIC JOURNAL OF MARKETING & RETAIL MANAGEMENT ISSN 2349-2317 (Online); DOI: 10.16962/EAPJMRM/issn. 2349-2317/2018; Volume 9 Issue 4 (2018)
17
Table No. 8 Gender difference in consumer perception of mobile application use for
mobile based marketing.
Applications Gender N Mean
Std.
Deviation df
t-
value
Sig.
Level
Shopping App Female 50 3.66 0.92 98 1.40 NS
Male 50 3.90 0.79
Lifestyle App Female 50 3.38 1.03 98 2.88 0.01
Male 50 3.94 0.91
Women Safety
App
Female 50 3.20 1.23 98 0.08 NS
Male 50 3.22 1.20
Collage App Female 50 2.22 1.07 98 2.36 0.05
Male 50 2.80 1.37
Education Apps Female 50 3.28 1.01 98 0.09 NS
Male 50 3.26 1.27
Social
Networking
apps
(WhatsApp)
Female 50 4.88 0.33
98 0.83 NS Male
50 4.82 0.39
Books App Female 50 3.68 0.98 98 2.06 0.05
Male 50 3.24 1.15
Entertainment
App
Female 50 4.16 0.87 98 1.13 NS
Male 50 4.36 0.90
Travelling App Female 50 4.18 0.83 98 2.80 0.01
Male 50 3.68 0.96
Search Apps Female 50 4.54 0.65 98 0.53 NS
Male 50 4.46 0.86
Frequency of All
apps Used
Female 50 35.80 3.92 98 0.06 NS
Male 50 35.74 5.76