consumer empowerment survey · consumer empowerment survey report . report on a segmentation of the...
TRANSCRIPT

CONSUMER EMPOWERMENT SURVEY REPORT Report on a segmentation of the general public Research conducted on behalf of:
Prepared by: Bridget Williams, Claire Bhaumik, Anna Silk, GfK NOP Social Research Issue: FINAL Date: March 2015

Table of Contents
1 Overall summary ....................................................................................................................... 1 1.1 Introduction and methods 1 1.2 Segmentation overview 1
2 Introduction and objectives ..................................................................................................... 3 2.1 Programme of research 3 2.2 About this report 4
3 General confidence in the market ........................................................................................... 6
4 Choice of service supplier ....................................................................................................... 7 4.1 How consumers choose suppliers (Decision Styles) 7 4.2 Customer journey - services 10
5 Choice of supplier for major purchase ................................................................................. 14 5.1 How consumers choose suppliers (Decision Styles) 14 5.2 Customer journey – major purchase 17 5.3 Views on outcome – major purchase 19
6 Segmentation overview .......................................................................................................... 21
7 Constrained Strugglers .......................................................................................................... 22 7.1 Constrained Strugglers: Attitudinal characteristics 22 7.2 Constrained Strugglers: Demographic profile 24 7.3 Choice of service provider 25 7.3.1 Constrained Strugglers: Decision styles - services 25 7.3.2 Constrained Strugglers: Customer journey - services 26 7.4 Choice of supplier for major purchase 27 7.4.1 Constrained Strugglers: Decision styles– major purchase 27 7.4.2 Constrained Strugglers: Customer journey – major purchase 28 7.5 Constrained Strugglers: Views on outcome – major purchase 29
8 Consciously Unengaged ........................................................................................................ 31 8.1 Consciously Unengaged: Attitudinal characteristics 31 8.2 Consciously Unengaged: Demographic profile 32 8.3 Choice of service provider 33 8.3.1 Consciously Unengaged: Decision styles - services 33 8.3.2 Consciously Unengaged: Customer journey - services 34 8.4 Choice of supplier for major purchase 36 8.4.1 Consciously Unengaged: Decision styles– major purchase 36 8.4.2 Consciously Unengaged: Customer journey – major purchase 37 8.4.3 Consciously Unengaged: Views on outcome – major purchase 38
9 Worried Indecisives ................................................................................................................ 40 9.1 Worried Indecisives: Attitudinal characteristics 40 9.2 Worried Indecisives: Demographic profile 41 9.3 Choice of service provider 42 9.3.1 Worried Indecisives: Decision styles - services 42

9.3.2 Worried Indecisives: Customer journey - services 43 9.4 Choice of supplier for major purchase 45 9.4.1 Worried Indecisives: Decision styles– major purchase 45 9.4.2 Worried Indecisives: Customer journey – major purchase 46 9.4.3 Worried Indecisives: Views on outcome – major purchase 47
10 Traditional Value-seekers ....................................................................................................... 49 10.1 Traditional Value-seekers: Attitudinal characteristics 49 10.2 Traditional Value-seekers: Demographic profile 50 10.3 Choice of service provider 51 10.3.1 Traditional Value-seekers: Decision styles - services 51 10.3.2 Traditional Value-seekers: Customer journey - services 52 10.4 Choice of supplier for major purchase 54 10.4.1 Traditional Value-seekers: Decision styles– major purchase 54 10.4.2 Traditional Value-seekers: Customer journey – major purchase 55 10.4.3 Traditional Value-seekers: Views on outcome – major purchase 56
11 Leading Edgers ....................................................................................................................... 58 11.1 Leading Edgers: Attitudinal characteristics 58 11.2 Leading Edgers: Demographic profile 60 11.3 Choice of service provider 60 11.3.1 Leading Edgers: Decision styles - services 60 11.3.2 Leading Edgers: Customer journey - services 61 11.4 Choice of supplier for major purchase 63 11.4.1 Leading Edgers: Decision styles– major purchase 63 11.4.2 Leading Edgers: Customer journey – major purchase 64 11.4.3 Leading Edgers: Views on outcome – major purchase 65
12 Appendix .................................................................................................................................. 67 12.1 Programme design 67 12.2 Development stage (knowledge review and stakeholder workshop) 67 12.3 Questionnaire 67 12.4 Survey method 68 12.5 Analysis 69 12.5.1 Segmentation 69 12.5.2 Identifying how consumers choose providers – MaxDiff Statistical Approach 70 12.6 Results by segment 72 12.6.1 Variables that were used to create segmentation 72 12.6.2 Demographics and vulnerability indicators 75 12.7 Results by market – service suppliers 77 12.7.1 Decision making styles 77 12.7.2 Decision making styles – Maximising scores broken down by market and
demographics 78 12.7.3 Reasons why not checked to see whether on best deal 79 12.7.4 Sources of information/advice used to find out about suppliers 80 12.7.5 Whether negotiated on price or on the features that were included in the
deal/tariff/contract 81 12.8 Results by market – major purchase 82 12.8.1 Decision making styles 82 12.8.2 Number of major purchase supplier considered 83 12.8.3 Sources of information/advice used to find out about suppliers 84

12.8.4 Whether negotiated on price or what was included in the price 85 12.8.5 Views on outcome 85 12.8.6 Views on amount of information available and time spent shopping 86 12.9 Potential biases 87

Consumer Empowerment survey report 1
1 Overall summary
1.1 Introduction and methods
The Department for Business, Innovation and Skills (BIS) seeks to further empower all groups of consumers, with a particular interest in helping those that are currently struggling to engage fully with the market. With this in mind, BIS commissioned GfK NOP in autumn 2014 to carry out research to identify different groups of consumers – to gain a better understanding of attitudes, motivations and behaviours of each group, and to build a stronger picture about their characteristics and engagement levels: particularly those consumers in vulnerable situations and/or on low incomes.
To fulfil this objective a segmentation was developed by GfK NOP based a quantitative survey amongst a representative sample of the UK population (6,024 interviews were conducted with adults aged 16+). The interviews were conducted face to face between October 2014 and January 2015. The survey followed an extensive development stage which entailed a review of existing information on consumer engagement and consultation with BIS and its stakeholders.
1.2 Segmentation overview
The segmentation comprises 5 segments which are summarised in Chart 1. The chart shows the segment name, the estimated size of the segment in the population and a description of the key characteristics.
Chart 1 Summary: BIS Consumer Segments
Constrained Strugglers,
17%
They tend to have lower qualifications, belong to DE social grades (more than other groups) and find it hard to keep up with bills and commitments. They have low levels of self-efficacy in general. As consumers they lack confidence in their ability to find the best products and services, and don’t feel comfortable making decisions. They do not like shopping around or actively seek out the best deals. They lack confidence in their negotiation skills and ability to understand terms and conditions. Summary: Constrained Strugglers are the least empowered segment, who may be constrained by their personal traits and attitudes as well as their financial situation.
Consciously Unengaged,
15%
Older than average (and more likely to be retired) members of this segment are less likely than average to have problems keeping up with bills or commitments. They have little interest in shopping, or shopping around – not because of any particular financial or personal constraints – they just do not want to spend time shopping. They therefore prefer to stick with their current supplier, even if it means they aren’t on the best deals. Summary: While the Consciously Unengaged are similar to Traditional Value-seekers in profile (older and financially comfortable), they do not share their enthusiasm for shopping around or getting good deals. This lack of interest is a conscious choice rather than linked to any particular constraints and they say they would make the same decisions in the future.
Worried Indecisives,
22%
Slightly younger and more likely to be female, members of this segment like to spend time shopping around but tend to find it hard to make decisions and worry about making the right choice. They tend to have low levels of confidence as consumers: they like to seek advice from trusted sources (e.g. friends, family and consumer experts), and they don’t like to negotiate or feel confident understanding terms and conditions or making complaints. Summary: While their confidence and lack of decisiveness may hold them back, the Worried Indecisives do engage with the market to some extent (much more than the Constrained Strugglers who have similar attitudinal barriers) but it appears that members of this segment may need more support to empower them further as consumers.

Consumer Empowerment survey report 2
Traditional Value-
seekers, 24%
Older than average (and more likely to be retired) members of this segment are doing well financially. They really like to shop around to get the best deal and they don’t mind putting in lots of time and effort to achieve this. They feel confident making decisions and with all aspects of their consumer experience (e.g. making complaints, negotiating, understanding terms and conditions). They appear to feel satisfied with the outcome of their purchases as they would make the same decision again. They are inclined to be more conservative: they tend not to be early adopters, like to stick with the brands they know and like to visit physical shops more than other segments (although it is worth noting that their internet usage is about the same as average). Summary: Traditional Value-seekers are highly engaged and confident consumers, who enjoy shopping around and are prepared to spend the time to find the best value. This willingness to invest the time, and to negotiate for the best deal clearly differentiates the segment from the Consciously Unengaged.
Leading Edgers, 22%
Leading Edgers tend to have higher qualifications and be getting on well financially. They report much higher internet usage compared with other segments and this is borne out in their behaviours as they tend to shop around a lot online. They are not particularly brand loyal, but are instead early adopters who are happy to switch around and try something new. They like to share their views on their purchases. Members of this segment are confident consumers: successful negotiators and confident finding the best deals and products for them, negotiating and making complaints. Summary: Leading Edgers are one of the most empowered of all the segments (along with Traditional Value-seekers) in terms of their consumer behaviour and personal attributes. However, it is their willingness to try new things and lead the opinion of others that most differentiates this segment from the Traditional Value-seekers.

Consumer Empowerment survey report 3
2 Introduction and objectives
Department for Business Innovation and Skills (BIS) has a vital part to play in creating the right market framework to support consumer confidence, help business succeed and support growth. BIS ensure that a world class competition framework and modern consumer rights are in place – and that action is taken against those who are not playing fairly.
However, the market also requires empowered, active and informed consumers in order to flourish. Only then will the full benefits of competition - which include lower prices, greater innovation, efficiency and growth - be unlocked.
There is strong evidence that many consumers do not engage fully in their transactions; failing to shop around for major purchases such as home improvement or holidays, or find the best product in complex markets like utilities or communications. Reasons for this are many and complex; some consumers may lack motivation or knowledge, some may not have the confidence to negotiate with suppliers, some may lack the time to research the market or prioritise their expenditure. Other factors may also come into play, such as scarcity (e.g. low income, capacity), or time pressure (e.g. those who have caring responsibilities).
Whatever the barrier, it is the least engaged groups of consumers that are likely to miss out on the best deals, overpay for basic services, or even get ripped off. It is also thought that the more engaged consumers are those likely to avoid problems later in the process, by doing research prior to making the transaction.
BIS seeks to further empower all groups of consumers, with a particular interest in helping those that are currently struggling to engage fully with their transactions, or who are in an otherwise vulnerable position. As part of this process, BIS commissioned GfK NOP in Autumn 2014 to carry out research to identify the key target groups of consumers in need of greater empowerment. The survey aimed to provide a better understanding of the current attitudes, motivations and behaviours of different groups of consumers, and to build a stronger picture of their characteristics and engagement levels: particularly those consumers in vulnerable situations and/or on low incomes.
This report presents the findings from the study; the results may be used to help identify issues in markets and to inform future policy interventions effectively.
2.1 Programme of research Chart 2 summarises the overall programme of research; more detail can be found in the appendix about each of these stages including the development stage, the questionnaire, survey method, data analysis and segmentation process.
The segmentation was developed by GfK NOP based on data collected in a quantitative survey of a representative sample of the UK population (6,024 interviews were conducted with adults aged 16+). The interviews were conducted face to face between October 2014 and January 2015.

Consumer Empowerment survey report 4
Chart 2 Overview of Consumer Empowerment research programme
2.2 About this report The following points explain the way in which the results have been commented upon in this report.
• All of the differences which have been commented upon within this report are statistically significant. Where differences are interesting but not statistically significant, these are noted, but it is stated that the difference is not significant
• Where we comment on differences between segments, we either comment on whether a segment is the most or least likely segment to give an answer, or whether they are significantly different from the average of all segments.
• The survey method employed means that true statistical significance cannot be inferred but we have used it as a proxy for our analysis. The significance tests which have been used are two tailed and are based on a 95% confidence interval. This means that we are 95% certain of detecting a difference where one exists in the population.
• Different significance tests were used depending on whether comparisons were being made between mean scores or percentages or whether comparisons were being made between two independent samples or between a sub-sample and the total.
• Significance testing is not applied to the outcomes from the MaxDiff exercise. This is because MaxDiff scores are calculated for each attribute (more details on this analysis can be found in the appendices), so the scores are relative to each other and not independent. For this reason standard significance tests to interpret differences are not appropriate. Instead, differences between scores should be interpreted in the context of the other attributes. In the report we therefore report actual scores, and for which markets/segments scores are highest or lowest, rather than focussing on deviations from the average.
• Sub-groups which have an effective sample size below 30 are too small for statistical significance testing to be carried out and so no comment on these groups is made in this report.
• It should be noted that statistical significance is not intended to imply substantive importance • Throughout this report ‘*’ indicates a proportion of less than 0.5% but greater than zero. ‘-’ indicates
a zero proportion. • The report refers to differences by social grade. Social grade is a system of demographic
classification used in the United Kingdom which is maintained by the Market Research Society.

Consumer Empowerment survey report 5
Social grade is based on the occupation of the Chief Income Earner in the household1. • This report refers to means tested benefits. A means tested benefit is a payment available to
people who can demonstrate that their income and capital are below specified limits. For this report this is defined as including employment and support allowance/income support/ incapacity benefit, jobseekers allowance, universal credit, pension credit, carer's allowance, housing benefit, tax credits and council tax benefit. While child benefit is also means tested, only those on the highest incomes are ineligible to claim. Given that our measure aims to identify those who are the most financially constrained, child benefit has been excluded from our definition of means tested benefits.
1 For more information on social grade, please refer to http://www.mrs.org.uk/pdf/occgroups6.pdf

Consumer Empowerment survey report 6
3 General confidence in the market
A number of statements were included in the survey to provide an understanding of consumers’ levels of confidence when making purchases. Respondents were asked to answer on a scale from one to seven, where one means that they feel very confident, and seven that they feel very unconfident. Chart 3 shows the proportions giving a score of one or two, which indicates that they feel very confident.
Over half (57%) said they felt very confident about making complaints post-purchase, and a similar proportion (52%) that they felt very confident that they are able to find the best products and services to meet their needs.
Chart 3 Consumer confidence levels
There were no clear patterns in response by demographics, and the groups who were most likely to say that they felt very confident (i.e. giving a score of 1-2) varied from construct to construct:
• Older people were more likely than their younger counterparts to say they felt confident making a complaint about a product or service (51% 16-34s v 60% 35+s), and understanding the terms and conditions attached to a product (35% 16-34s v 42% 35+s)
• Men were more likely than women to say that they felt very confident finding the best products and services to meet their needs, (54% v 50% women) and that they would be able to negotiate the best deal (41% men v 31% women)
• Those in the DE social grade were less likely than others to say they felt very confident finding the best products and services to meet their needs (47% DEs v 54% ABC1C2s), and understanding the terms and conditions attached to a product or services (35% DEs v 41% ABC1C2s). Similar patterns were observed in relation to weight of internet use, with lighter users less likely to feel confident in both these areas, and it should be noted that DEs tended to be lighter internet users.
The lowest levels of confidence related to confidence that consumer law will protect you: 32% said they felt very confident. However, it should be noted that few said they felt very unconfident as only 12% gave a score of 6 or 7, and most respondents sat in the middle of the scale, perhaps indicating that they don’t know enough to be able to form an opinion.
Older respondents were the most likely to say they feel very confident about the protection consumer law would give them (28% 16-34s v 34% 35+s).

Consumer Empowerment survey report 7
4 Choice of service supplier
Respondents answered questions about their choice of supplier for services in regulated markets. They were asked to answer in relation to a category for which they had sole or joint responsibility for the choice of supplier for their household: where they had responsibility for decisions in more than one category, one was chosen at random.
The categories included in the interview were:
• Electricity supplier • Internet\broadband supplier • Mobile phone network supplier • Paid for TV, e.g. Sky or cable • Car insurance supplier • The bank/building society you have your main current account with
Respondents were initially asked about their decision styles in relation to their choice of supplier (what would you do if you were making this decision), and were then asked to describe their activities in the relevant market over the past two years.
4.1 How consumers choose suppliers (Decision Styles)
In order to assess decision styles the survey data was analysed using a technique called MaxDiff2. This analysis established a ranking of ‘decision styles’ from most likely to least likely - the higher the score allocated to a decision style, the more likely that decision style among consumers. While each respondent was asked questions in relation to just one of the six regulated service markets, based on which was appropriate to them, this section details responses based on all markets combined, and then looks at differences by market. Chart 4 shows the top five decision styles from the ten that were evaluated. Whilst the figures are taken from the combination of all markets, the chart also shows where there are key differences in patterns of response by individual market.
Looking first at all markets combined, choosing the cheapest supplier that meets their requirements was the decision style most likely to be used by consumers when choosing a service supplier. The next most likely decision style was maximising: going through all suppliers comparing them carefully before making a choice, so weighing up all options and making the optimal decision that maximises the benefit from choosing the best supplier. Choosing the same supplier they had used before was the third most likely decision style: the comfort of the known brand may be a useful short-cut for these consumers. Choosing a supplier with the best customer service was the fourth most likely decision style. In the sense that the decision is driven by one specific aspect of the retail offering, these customers are not dissimilar to the price driven, except that they are motivated by customer service rather than price. The fifth most likely style was a decision made on the basis of recommendations from a source I trust, these being consumers who typically place great value on the views of others before reaching a decision.
2 Please see appendix for more detail on the MaxDiff analytical method

Consumer Empowerment survey report 8
Chart 4 How consumers choose suppliers - Top 5 Decision styles
This hierarchy of response was reasonably consistent across each service market. Choosing the lowest price was more prevalent in relation to car insurance but less prevalent for personal bank current accounts. Respondents answering about current accounts were less likely to be maximisers, and were instead more likely to choose a supplier they had used before, which may indicate inertia in that particular market. A table in the appendices shows the decision style scores for each market.
The greatest difference in styles across markets was in maximising, and Chart 5 shows the scores for each service market. In addition to car insurance, maximising was also more likely in the choice of internet service provider and paid-for TV compared with the average, but less likely in the choice of mobile phone network, electricity supplier and personal bank current account.

Consumer Empowerment survey report 9
Chart 5 Maximising decision style by service supplier
Looking further at responses from different demographic groups, it became apparent that certain groups were more likely to report maximising behaviours than others, in particular:
• Men (all markets apart from mobile network provider and bank account) • 16-54s (all markets) • ABC1s (all markets) • Those buying their homes on a mortgage (all markets apart from internet and bank accounts) • Heavy internet users (all markets)
Chart 6 shows the bottom five decision styles (from the ten that were evaluated). Again, whilst the figures are taken from the combination of all markets, the chart shows patterns of response by individual market.
Choosing a recognised supplier (even if not used before) and the first that appeals were ranked as the least likely decision styles in the choice of service supplier. This suggest that recognition, or simple appeal/emotion, may not be key choice drivers in these markets. Similarly, choice based on a supplier being able to set up the service within the most convenient time frame, or one that a friend or family uses, or the one that just happens to be the first encountered that meets the customer’s requirements, ranked fairly low in comparison with other styles.
This was true across the majority of service markets investigated: the only exception related to the choice of current bank account supplier, for which a decision style based on what friends/family use was more likely.

Consumer Empowerment survey report 10
Chart 6 How consumers choose suppliers – Bottom 5 Decision styles
4.2 Customer journey - services
The survey also measured past shopping behaviour in relation to the choice of a service supplier for which the respondent had responsibility.
Respondents were asked whether, in the last two years, they had checked to see if they were on the best deal with their service supplier and, if so, what they did as a result. Just under half (49%) had checked to see whether or not they were on the best deal, and most of these customers had either changed supplier (22%) or had kept their current supplier but changed the tariff they were on (15%) (Chart 7).
Chart 7 Actions taken as a result of checking whether or not on the best deal – services
All
(5592) %
Checked whether on best deal consisting of… 49 …changed supplier 22 …changed deal but kept supplier 15 …currently gathering information 3 …looked into alternatives but decided not to change 10 I haven’t checked 41 Base: those who have responsibility for choosing a supplier; figures may not add up 100% as ‘don’t know’ responses have been excluded

Consumer Empowerment survey report 11
There were some very marked differences by market, however. Chart 8 shows that those answering in relation to car insurance were more likely to say they have checked whether they are on the best deal and have changed supplier (44%), whilst the opposite was true of those answering in relation to a personal current account (8%). The contrast is also illustrated by the different proportions checking to see whether they were on the best deal or not, highest in car insurance (70%) and lowest in personal current accounts (27%).
Chart 8 Actions taken as a result of checking whether or not on the best deal – by individual service market
Service market
All Ele
ctric
ity
Inte
rnet
Mob
ile p
hone
ne
twor
k
Pai
d fo
r TV
Car
insu
ranc
e
Ban
k ac
coun
t
(5592) %
(994) %
(1026) %
(961) %
(754) %
(925) %
(932) %
Checked whether on best deal- consisting of… 49 42 55 50 46 70 27
…changed supplier 22 21 21 19 15 44 8 …changed deal but kept supplier
15 11 21 18 18 11 8
…currently gathering information
3 3 3 4 3 1 3
…looked into alternatives but decided not to change
10 7 10 9 10 13 8
I haven’t checked 41 49 37 40 42 24 58 Base: those who have responsibility for choosing a supplier; figures may not add up 100% as ‘don’t know’ responses have been excluded Significantly higher/lower than average
Those who had not checked whether they were on the best deal were asked why this was the case. The most common reason mentioned was satisfaction with the current supplier (51%), whilst 19% said this was because switching suppliers takes too much effort and 16% that there was little difference between suppliers (Chart 9).
Responses were reasonably consistent across markets, although fewer respondents mentioned that they had not checked in the car insurance market because there was no difference between suppliers (9%), and were more likely to say that this was because they were satisfied with their current supplier (63%). The full breakdown can be found in the appendix.

Consumer Empowerment survey report 12
Chart 9 Reasons why not checked to see whether on best deal - services
All who did not check to see
whether they were on the best deal with their supplier
(2544) %
Already satisfied with supplier 51
Satisfied with the product 30 Satisfied with the customer services 21 Satisfied with the cost 11
Takes too much time/ hassle/complex to switch 19 Takes too long to research 6 Takes too long to go through the process of switching 6 Too much hassle to research new deals 6 Too much hassle to go through the process of switching 6
Makes no difference 16 No difference in the deals offered 6 No difference in price 7 No difference in customer service provided 5
Other reasons Prefer to stick with what you know – even if not best deal 42 You are not guaranteed a better discount 16 Do not trust other suppliers / catch with the a new deal 12 So many choices - hard to know where to start 12 Worried that will make wrong choice if change 8 Not aware you could get a new/better deal 7 Base: see table; responses under 5% not shown
Those who had checked to see whether they were on the best deal were asked where they had found out information about which supplier to use (Chart 10). Around a third (37%) said they obtained information from the website of the supplier they used, and a similar proportion (32%) from other provider websites. Usage of price comparison websites was also at about the same level (35%), whilst fewer looked at other review (8%) or advice sites (7%). The other main sources used were direct contact with the supplier (by phone/email/letter) (18%) or advice from family, friends or colleagues (15%).
There were some interesting differences by market, however. Use of price comparison websites was more common in the car insurance market (60%), and to a lesser extent in the electricity market (36%) compared with other markets (only 23% looked at price comparison sites to choose which current account to take up). Direct contact with the supplier was less common when shopping around for mobile phone network provider (12%) or personal current account (7%), and in both of these markets shop or branch visits were a more important source of information (23% for mobile phone provider, 21% for personal current account). Full breakdown can be found in the appendix (see 12.7.4).

Consumer Empowerment survey report 13
Chart 10 Sources of information/advice used to find out about suppliers - services
A count of the number of different information sources which had been consulted by consumers shows that more were used in the choice of mobile phone network provider (2.2) and fewer in the choice of electricity supplier (1.7) compared with the average across all sectors (2.0).
The survey investigated whether those who had checked whether they were on the best deal with their supplier had negotiated with their service supplier on price or what was included in the price. Just over half had tried to negotiate (52%), and in the vast majority of these cases the negotiation had been successful in that the customer had achieved a better deal (Chart 11).
There were though marked differences in the level of negotiation by sector, with fewer customers negotiating in transactions related to electricity (33%) or current account (22%). Customers were more likely to believe that it was not possible to negotiate on the price or features current account (20%) and slightly more likely for the electricity market (14%). The appendix has a full breakdown of the results by market (12.7.5).
Chart 11 Whether negotiated on price or on the features that were included in the deal/tariff/contract – services
All
(2414) %
Successfully negotiated price/deal 47 Negotiated but was unsuccessful 5 Did not negotiate 35 Not applicable – not possible to negotiate 11 Base: All who had checked to see whether they were on the best deal with their supplier; figures may not add up 100% as ‘don’t know’ responses have been excluded

Consumer Empowerment survey report 14
5 Choice of supplier for major purchase
Respondents answered about their choice of supplier for major purchases (of £100 or more) in the past two years. They were asked to answer in relation to a category for which they had made a major purchase of this level in the past two years and for which they had sole or joint responsibility for the choice of supplier: where they had responsibility for decisions in more than one category, one was chosen at random.
The categories included in the interview were:
• People doing work at your home - e.g. gardeners, plumbers, builders, other tradesmen (this can include the costs of materials used as well)
• Furniture, home furnishings or building materials (e.g. furniture, curtains, DIY building materials) • Computers (e.g. laptop, tablet computer) • Home electronics or electrical (e.g. TV, stereo, washing machine, lawnmower)) • Car, van, motorbike or bicycle • Holiday (e.g. package holiday, flight – when purchased as a single product of £100 or more)
Respondents were initially asked about their decision styles in relation to their choice of supplier (what would you do if you were making this decision), and were then asked to describe their activities in relation to the most recent relevant purchase they had made over the past two years.
5.1 How consumers choose suppliers (Decision Styles) The MaxDiff analytical method was also used to investigate decision styles in relation to choosing a supplier for a major purchase (£100 or more). The same list of decision styles, apply as for services and more details on this method can be found in the appendices.
Looking first at the combination of responses across all markets, the most likely decision style was choosing a supplier I have used before, and this was top by some distance, followed by choosing the supplier with the best customer service support (Chart 12). The maximiser decision style was only ranked third with a score of 12.4 for choosing a major purchase provider, whereas it was ranked second (with a score of 14.0) in relation of choice of service supplier (see Chart 12). The difference in rank ordering between major purchases and regulated services illustrates the importance of prior experience and supplier trust when consumers are choosing suppliers of major purchases.
There was some variation by market. Among those answering about people doing work at their home (for example tradesmen), the most likely decision styles were based on choosing a supplier they have used before or one recommended by a trusted source. This emphasises the importance of first hand or recommended experience as choice drivers in this particular market. On the other hand, consumers in this market were less likely to go through all suppliers comparing them carefully and choosing the first one they find that meets their requirements (see section 12.8.1 for full breakdown)

Consumer Empowerment survey report 15
Chart 12 How consumers choose suppliers - Top 5 Decision Styles– major purchases
Looking at the maximiser decision style by market (Chart 13), when choosing a supplier for a major purchase, maximising was most likely in the choice of supplier of computers, and least likely - in choice of tradesmen (people doing work at your home). The latter finding may be because respondents were much more likely to choose tradesmen based on who they had used before and recommendations from friends and family. There was less of a spread of maximising behaviours between categories of major purchases compared with service suppliers: choice of service supplier showed much greater differentiation in maximising behaviour.

Consumer Empowerment survey report 16
Chart 13 Maximising decision style by service supplier
The least likely decision styles for making major purchases included shortcuts such as choosing the first supplier that appeals, or choosing recognised suppliers that had not been used before (Chart 14). This reflects patterns in relation to choice of service supplier, though choosing a recognised supplier (even if not used before) was marginally more likely for major purchases (score of 6.1) than for services (score 5.0).
There were only a few differences in results across individual markets. Choosing a supplier that a friend or family uses was more likely among customers looking for a tradesman to work at their home, whilst those in the market for a holiday tended to indicate decision styles based on price more commonly than in other major purchase markets. A full breakdown is show in the appendix (12.8.1)

Consumer Empowerment survey report 17
Chart 14 How consumers choose suppliers – Bottom 5 Decision Styles – major purchases
5.2 Customer journey – major purchase
Respondents were also asked about their past shopping behaviour in relation to a supplier of a major purchase (in the last two years, and to a value of at least £100). The shopping behaviours explored include the number of suppliers considered, information sources used, reasons for supplier choice, and the extent of negotiation.
Most consumers looked at more than one supplier before making their choice: 40% considered two or three suppliers, and 32% considered four or more suppliers. Those purchasing home furnishings/ DIY products or computers tended to consider more alternative suppliers than those answering about other categories (full breakdown can be found in the appendix - 12.8.2).
All those who had made a major purchase were asked about the sources of information they had used to help them decide which supplier to use (Chart 15). The pattern was somewhat different to that found for regulated services, in that shop visits were a much more important information source for major purchases; 33% had visited the shop where the product had been bought from, and 17% had visited other shops. However, online sources were again important, notably supplier or manufacturer websites, although mentions of price comparison websites were notably lower in relation to major product purchases (16%) compared with regulated services (35%).
Looking at differences within markets, shop visits were particularly important for purchases of home furnishings/DIY and home electronics/electricals; price comparison websites for holidays and computers; and direct contact for commissioning tradespeople to do work in the home. Those answering in respect of a holiday or a computer purchase were more likely than the average to mention that they had visited the website of the supplier they went with, as well as other supplier websites. The full breakdown can be found in the appendix.

Consumer Empowerment survey report 18
Chart 15 Sources of information/advice used to find out about suppliers – major purchase
The survey investigated whether respondents had negotiated what was included in the price of their major purchase. Two fifths (40%) had tried to negotiate, and the great majority of these customers (34% of the total sample) had done so successfully (Chart 16). Negotiation was much more prevalent in the purchase of a motor vehicle or bicycle: almost two thirds (64%) said they had successfully negotiated a better deal when making such a purchase. The other market characterised by more successful negotiation was commissioning tradespeople for work in the home (46%). Those answering in respect of a holiday were more likely than others to think it was not possible to negotiate a better price or features in this particular market (25% v 15% on average). The full breakdown by major purchase can be found in the appendix (12.8.4).
Chart 16 Whether negotiated on price or what was included in the price – major purchase
All
(4204) %
Successfully negotiated price/deal 34 Negotiated but was unsuccessful 6 Did not negotiate 43 Not applicable – not possible to negotiate 15 Base: All who have made a purchase worth £100 or over in the last 2 years; figures may not add up 100% as ‘don’t know’ responses have been excluded

Consumer Empowerment survey report 19
5.3 Views on outcome – major purchase Respondents were asked about the perceived benefits of shopping around, by asking how much they agreed or disagreed that they got (or could get) a better price or better customer service by shopping around. Four in ten agreed3 that shopping around improves the price paid by the consumer; and the rest slightly agreeing, ambivalent or disagreeing. A similar split was evident with regards to better customer service, with a third (34%) agreeing that they got/could have got a better quality of service by shopping around.
This pattern was evident across all markets, although those answering in respect of home electronics or electrical items were more likely to feel there were monetary benefits to be gained from shopping around, while those who answered about people doing work in their home were less likely to feel this. The full breakdown by major purchase can be found in the appendix (12.8.5).
Chart 17 Views on outcome - major purchase
When asked whether they would use the same supplier if making the decision again, the majority agreed that they would (61%), and only 9% disagreed that they would make the same decision. Results were reasonably consistent across markets, although those answering in respect of commissioning tradespeople for work in the home were more likely than the average to agree that they would choose the same supplier again (71%).
Respondents were asked about the amount of information they felt they had available to make their purchase decision. The great majority (80%) thought they had about the right amount of information, with around one in eight saying they felt they had either too little or too much information were about equal (Chart 18). This pattern was reasonably consistent across markets (full breakdown in the appendix 12.8.6.
Respondents were also asked about the amount of time they had spent making the decision, and three in four (78%) said they had spent about the right amount of time, though more felt they had spent too much time (13%) than not spent enough time (8%). Again results were consistent across markets.
3 This is defined as those who said ‘strongly agree’ and ‘agree’ – this definition applies to the rest of this section

Consumer Empowerment survey report 20
Chart 18 Views on amount of information available and time spent on major purchase
All (4204)
% Views on amount of information when making purchase: …wish I had more (scored 7-5) 8 …about the right amount (4) 80 …feel I had too much information (scored 1-3) 11 Views on amount of time spent making decision when making purchase
…wish I had spent more time making my decision (scored 7-5) 8 … about the right amount (4) 78 … spent too much time making my decision (scored 1-3) 13 Base: All who have made a purchase worth £100+ in the last 2 years; figures may not add up 100% as ‘don’t know’ responses have been excluded

Consumer Empowerment survey report 21
6 Segmentation overview
The segmentation solution selected comprised five segments which are approximately equally sized (Chart 19). The smallest segment is the Consciously Unengaged who comprise 15% of adults, while the largest segment is the Traditional Value-seekers who comprise 24% of adults.
Chart 19 Overview of segment solutions
The five segments show varying levels of engagement with markets and shopping around.
The Constrained Strugglers and Consciously Unengaged are both fairly unengaged with the process, but for different reasons. For the Constrained Strugglers their lack of engagement is related to scarcity issues (e.g. lack of confidence, financial constraints). The Consciously Unengaged are less likely to have such scarcity issues, and instead their lack of engagement appears to be because of a lack of interest.
Neither scarcity nor lack of interest are constraints for the Worried Indecisives: this segment attempts to engage with markets to find the best deals, they are characterised by concerns about decision making and lack of confidence.
The Traditional Value-seekers and Leading Edgers are the two segments which are most engaged with markets, but they tend to do so in different ways and have different levels of motivation. Traditional Value-seekers are motivated by finding the best deals, whereas Leading Edgers are the most likely to be motivated by being the first to try new products.
Each of the segments is described in detail in the sections that follow.
Consumer Empowerment survey report 22
7 Constrained Strugglers
The Constrained Strugglers make up 17% of the UK adult population.
What are we like?
We tend to have lower qualifications than others, belong to the DE social grades and we are more likely than other segments to be job seeking and living in social rented housing. We find it hard to keep up with our bills and credit commitments and are on lower incomes: we’re feeling the pinch.
Really, we don’t feel very confident or in control of our lives in general: we’re not particularly proactive in dealing with problems or issues and we don’t tend to follow through on decisions when we do make them. Talking of decisions, we find it really hard to make even simple decisions about what we buy or use or anything else. We don’t feel that confident in our own ability to find the best products and services to meet our needs, or find the best deal, or even to understand terms and conditions attached to buying goods or services.
Maybe because of this, and even though money is tight, we don’t like shopping around for the best deal. When we do make a decision, we’re not particularly brand loyal: either we go for the first thing we find that is good enough, or we go for the cheapest option that we can find. That said, advertising and introductory offers or deals can interest us.
So we really don’t like to shop around or actively seek out the best deals. This may be because we feel that we just can’t make things happen – so we wouldn’t get a better price or deal if we had shopped around more. What is the point? In our eyes all suppliers are the same and it is just too much hassle for us to find a new one.
Below we describe the Constrained Strugglers segment in detail: this includes a description of their attitudinal characteristics, demographic profile, decision styles, and description of their recent customer journeys in relation to the choice of a service provider in a regulated market, and in choosing a supplier for a major purchase.
The attitudinal characteristics described below were the only inputs to the segmentation: their demographic profiles, decision styles and customer journeys are shown to illustrate how this segment looks and behaves, but these did not drive the segmentation.
7.1 Constrained Strugglers: Attitudinal characteristics
The attitudinal characteristics of the Constrained Strugglers segment are described in this section. These cover four dimensions, including dimensions related specifically to shopping and decision making.
Personal Traits
The Constrained Strugglers have low levels of self-efficacy. They are much less likely than other segments to agree4 that they feel free to express their ideas and opinions (26% v 76% on average); that as soon as they see a problem or challenge they start looking for possible solutions (21% v 71% on average); or that they are able to follow through with things once they have made up their mind to do something (16% v 74% on average).
4 This is defined as those who said ‘strongly agree’ and ‘agree’ – this definition applies to the rest of this section

Consumer Empowerment survey report 23
This segment is also an extremely risk-averse group, being the least likely of all segments to agree that you need to take risks to lead a full life (only 19% agree v 47% on average).
This segment reports low levels of short termism (21% agreed that they focus on the here and now rather than worry about the future v 41% on average), and they do not consider themselves to be time poor, just a minority agree that there is not enough time to do all the things they would like to do (22% v 57% on average).
So, overall this is segment that is lacking in self-confidence and self-esteem, and this influences much of their decision-making behaviour and shopping style.
Shopping Styles
It is clear that the personal characteristics of low levels of self-confidence and efficacy among consumers in this segment is impacting their approach to knowledge-sharing and trust. Generally this segment is the least likely to agree that they communicate with other consumers about their purchases and shopping activity (19% agree they communicate v 43% on average); and they do not trust the advice of experts (only 16% agree they trust experts v 36% on average).
Perhaps linked to financial constraints, the Constrained Strugglers are not particularly brand loyal: they are the second least likely segment (after Leading Edgers) to agree that they would rather stick with a product they are familiar with than try something new (22% agree v 44% on average). However, this segment does not particularly seek out new products (on the average for all segments).
Decision-making
This segment’s general lack of confidence and low self-efficacy, and therefore lack of engagement, is also reflected in their approach to decision-making in general.
They tend not to search extensively for products/services. For example they are much less likely to agree that they usually continue to search for an item until it reaches their expectations (19% agree v 55% on average), or that they do not mind spending several hours looking for a major purchase (24% agree v 56% on average). Further, despite their financial constraints, this segment is also the least likely to agree that they always try to find the best deal before purchasing it (only 23% agree v 62% on average).
The constraints they face also impact on their perceived decision difficulty: they are the second most likely segment (after Worried Indecisives) to agree that they ‘have a hard time making even simple decisions’ (17% agree v 12% on average), though they are not as worried about making wrong decisions (21% said they were worried v 29% on average).
Confidence and negotiation
The Constrained Strugglers are the lowest-scoring by far on all of the consumer-related confidence measures. For example, they are far less likely to say they are confident in their own ability to negotiate the best deal (14% agree v 36% on average), or that they will understand the terms and conditions attached to a product or service (15% agree v 39% on average); and they are the least confident in making complaints about products or services they have purchased (22% v 57% on average).
However, they are only slightly less likely than the average to agree that they avoid negotiation (though Worried Indecisives score very high on these measures) or will give up if a negotiation is not going their way. This suggests that they are not avoiding negotiation completely, though later results indicate that their attempts at negotiation are less likely than other segments’ to be successful.
So this group is showing many of the characteristics that are typically associated with ‘vulnerable consumers’ and ‘scarcity’.

Consumer Empowerment survey report 24
7.2 Constrained Strugglers: Demographic profile Chart 20 shows the demographic profile of the Constrained Strugglers and the average of all segments.
Chart 20 Constrained Strugglers: Demographic profile
Whilst the gender balance was in line with average, the Constrained Strugglers tended to be slightly younger than average with an average age of 45 (v 47 average). They were also much more likely to be Social Grades C2DE (69% v 50% on average). Reflecting their younger profile and typically lower social grade status, this segment was the most likely of all the segments to be renting their property, and the most likely to be not in work. The Constrained Strugglers also contained the highest proportion of ethnic minorities of all segments (22% said they were from non-white ethnic groups (v 10% on average). This segment was also the most likely of all segments to say they had difficulties speaking English (6% v 2% on average) and reading English (6% v 2% on average).
The Constrained Strugglers gave responses which indicated that financial constraints may be a barrier to engagement for them: they were the least likely of any of the segments to be keeping up with their bills and credit card commitments (42% v 61% on average) and they were more likely than the average to be in receipt of means tested benefits (32% v 25% on average). This segment was also the most likely to say that they would have difficulties paying an unexpected bill, and 15% said they would be unable to pay at all (v 11% on average) and least likely to have a significant financial buffer (56% did not have savings equivalent to 3 months’ income v 44% on average) (see section 12.6.2 for a full breakdown of demographic and vulnerability indicators).
Weight of internet usage amongst the Constrained Strugglers was amongst the lowest of all segments (along with the Consciously Unengaged). This is a reflection of the lower social grade of many in this segment.

Consumer Empowerment survey report 25
7.3 Choice of service provider 7.3.1 Constrained Strugglers: Decision styles - services
In order to find out how people choose a new supplier of services in regulated markets (for example electricity, broadband or car insurance supplier) the survey data was analysed using a technique called MaxDiff. The analysis established a ranking of ‘decision styles’ from most likely to least likely - the higher the score allocated to a decision style, the more likely that decision style amongst the segment. While each respondent was asked questions in relation to just one of the six service markets, based on which was appropriate to them, this section details responses based on all markets combined.
Chart 21 shows the decision styles for the Constrained Strugglers and compares them to the average across all segments. The decision styles indicated by the Constrained Strugglers are reasonably consistent with the average, although they tend to be slightly less engaged in the shopping process generally reflecting the personal and circumstantial constraints they find themselves within.
The Constrained Strugglers were less likely than other segments to be classified as maximisers, that is to say they were less likely than other segments to indicate a decision style where they go through all suppliers comparing them carefully: this was consistent with their earlier answers which indicated that they were less likely than other segments to agree that they continue to search for items until they meet their expectations or they find the best deal
Instead, the Constrained Strugglers were the most likely of all segments to say that they would choose ‘the first one’ – either the first supplier they find that meets their requirements, or the first supplier they find that appeals to them. As noted before, this is not necessarily a reflection of time constraints, as they are no more likely than others to say they are time poor, but instead may be a reflection of other constraints such as self-efficacy. This lack of self-efficacy and low levels of engagement with markets may explain why they were no more likely than other segments to say they choose the cheapest supplier (in spite of their financial constraints).
Chart 21 Constrained Strugglers: Decision style - services
Consumer Empowerment survey report 26
7.3.2 Constrained Strugglers: Customer journey - services The survey also measured past shopping behaviour in relation to the choice of a service supplier for which the respondent had responsibility. The tendency for Constrained Strugglers not to shop around for the best deal or use the internet when shopping around is consistent with their lower levels of internet access, their attitudes and stated decision styles. The rest of this section provides more detailed comparisons between the Constrained Strugglers and the average in terms of shopping behaviours in the service markets included in the questionnaire.
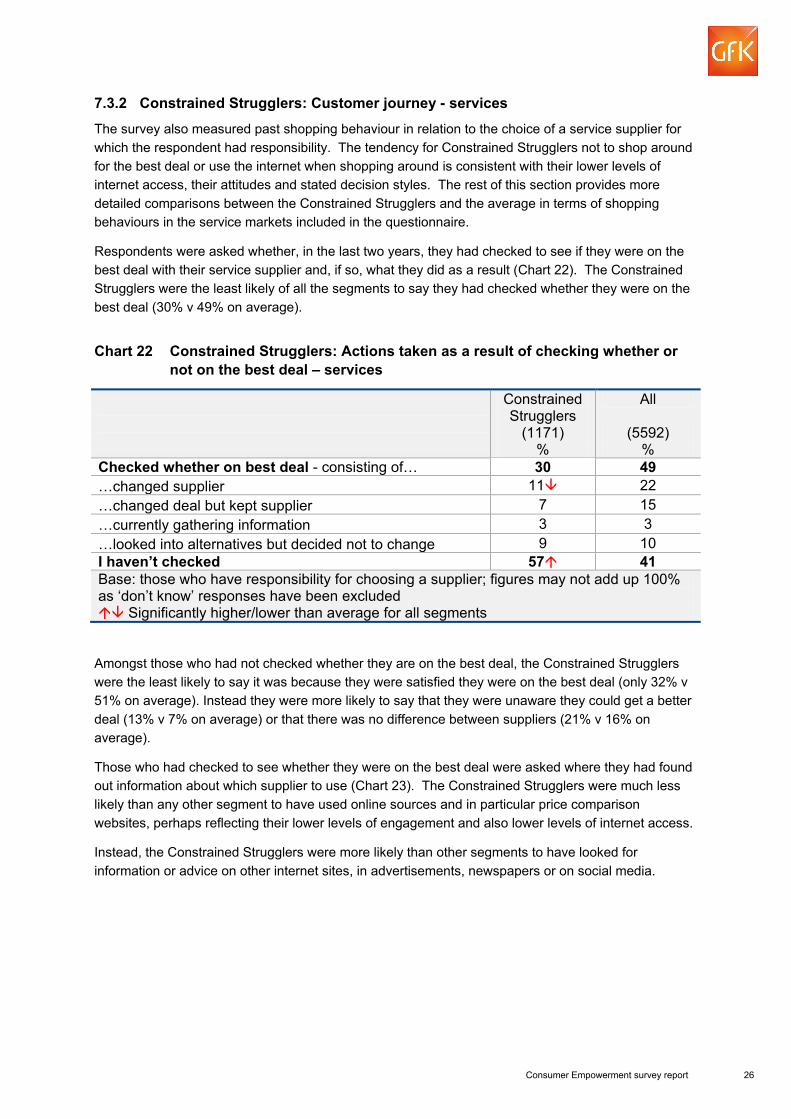
Respondents were asked whether, in the last two years, they had checked to see if they were on the best deal with their service supplier and, if so, what they did as a result (Chart 22). The Constrained Strugglers were the least likely of all the segments to say they had checked whether they were on the best deal (30% v 49% on average).
Chart 22 Constrained Strugglers: Actions taken as a result of checking whether or
not on the best deal – services
Constrained Strugglers
All
(1171) %
(5592) %
Checked whether on best deal - consisting of… 30 49 …changed supplier 11 22 …changed deal but kept supplier 7 15 …currently gathering information 3 3 …looked into alternatives but decided not to change 9 10 I haven’t checked 57 41 Base: those who have responsibility for choosing a supplier; figures may not add up 100% as ‘don’t know’ responses have been excluded Significantly higher/lower than average for all segments
Amongst those who had not checked whether they are on the best deal, the Constrained Strugglers were the least likely to say it was because they were satisfied they were on the best deal (only 32% v 51% on average). Instead they were more likely to say that they were unaware they could get a better deal (13% v 7% on average) or that there was no difference between suppliers (21% v 16% on average).
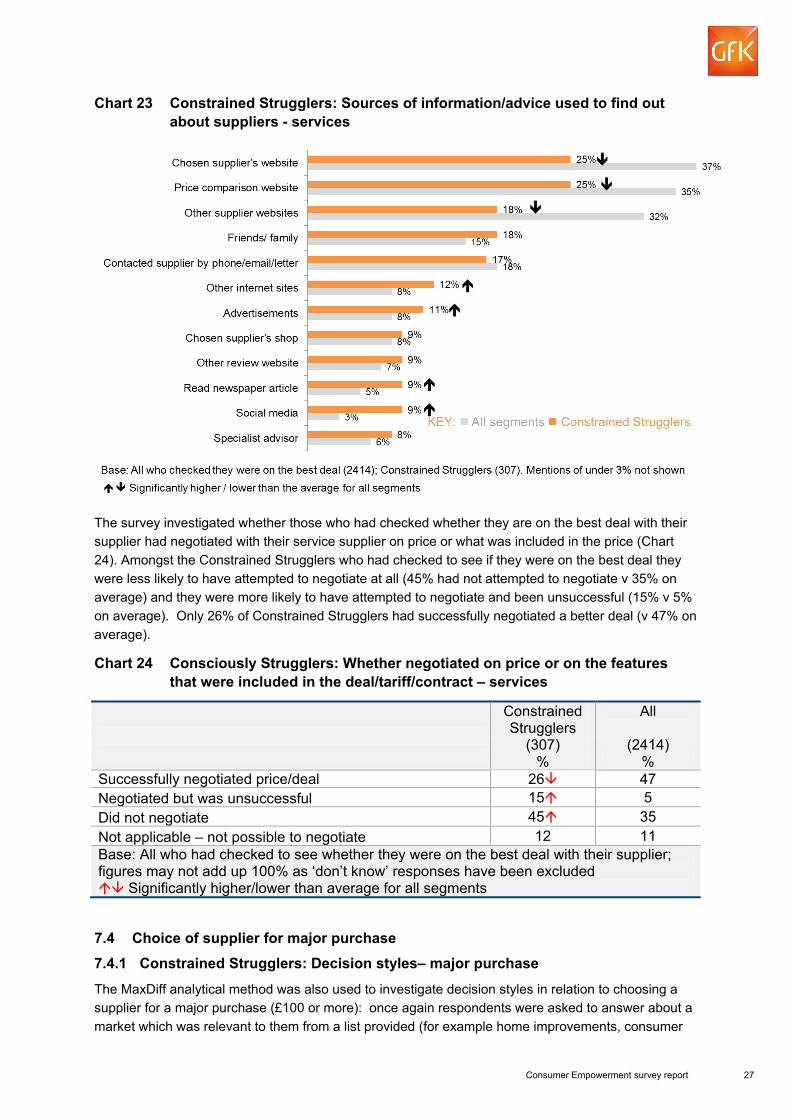
Those who had checked to see whether they were on the best deal were asked where they had found out information about which supplier to use (Chart 23). The Constrained Strugglers were much less likely than any other segment to have used online sources and in particular price comparison websites, perhaps reflecting their lower levels of engagement and also lower levels of internet access.
Instead, the Constrained Strugglers were more likely than other segments to have looked for information or advice on other internet sites, in advertisements, newspapers or on social media.
Consumer Empowerment survey report 27
Chart 23 Constrained Strugglers: Sources of information/advice used to find out about suppliers - services
The survey investigated whether those who had checked whether they are on the best deal with their supplier had negotiated with their service supplier on price or what was included in the price (Chart 24). Amongst the Constrained Strugglers who had checked to see if they were on the best deal they were less likely to have attempted to negotiate at all (45% had not attempted to negotiate v 35% on average) and they were more likely to have attempted to negotiate and been unsuccessful (15% v 5% on average). Only 26% of Constrained Strugglers had successfully negotiated a better deal (v 47% on average).
Chart 24 Consciously Strugglers: Whether negotiated on price or on the features that were included in the deal/tariff/contract – services
Constrained Strugglers
All
(307) %
(2414) %
Successfully negotiated price/deal 26 47 Negotiated but was unsuccessful 15 5 Did not negotiate 45 35 Not applicable – not possible to negotiate 12 11 Base: All who had checked to see whether they were on the best deal with their supplier; figures may not add up 100% as ‘don’t know’ responses have been excluded Significantly higher/lower than average for all segments
7.4 Choice of supplier for major purchase 7.4.1 Constrained Strugglers: Decision styles– major purchase
The MaxDiff analytical method was also used to investigate decision styles in relation to choosing a supplier for a major purchase (£100 or more): once again respondents were asked to answer about a market which was relevant to them from a list provided (for example home improvements, consumer

Consumer Empowerment survey report 28
electrics, holiday). Chart 25 shows the likelihood scores for the Constrained Strugglers and compares then against the average of all segments. As seen when considering choice of a service supplier, the Constrained Strugglers were more likely say they would to choose the first provider they came across that met their requirements or appealed to them (although not necessarily one they had used before).
This tendency to choose the first supplier again may reflect the relative scarcity of resource among, and the vulnerability of, this segment.
Chart 25 Constrained Strugglers: Decision style – major purchases
7.4.2 Constrained Strugglers: Customer journey – major purchase
Respondents were also asked about their past shopping behaviour in relation to a supplier of a major purchase (in the last two years, and to a value of at least £100). The shopping behaviours measured include the number of suppliers considered, information sources used, reasons for supplier choice, and the extent of negotiation.
Reflecting their constraints and lack of engagement with markets, the Constrained Strugglers tended to consider fewer suppliers than average: 31% considered just one supplier (v 27% on average), and only 19% considered four or more suppliers (v 32% on average).
Those who had made a major purchase were asked about the sources of information they had used to help them decide which supplier to use (Chart 26). The responses were similar to those related to choice of service supplier, with the Constrained Strugglers less likely than average to use online information sources, particularly the website of the supplier they bought from (27% v 44% on average).

Consumer Empowerment survey report 29
Chart 26 Constrained Strugglers: Sources of information/advice used to find out about suppliers – major purchase
The Constrained Strugglers were the least likely of the segments to have successfully negotiated a better price for this major purchase (24% v 34% on average) (Chart 27). In part this may be linked to their reluctance to negotiate at all on price, in part a lack of success when trying, perhaps due to a lack of confidence when using negotiating skills.
Chart 27 Constrained Strugglers: Whether negotiated on price or what was included in the price – major purchase
Constrained Strugglers
All
(622) %
(4204) %
Successfully negotiated price/deal 24 34 Negotiated but was unsuccessful 14 6 Did not negotiate 48 43 Not applicable – not possible to negotiate 11 15 Base: All who have made a purchase worth £100 or over in the last 2 years; figures may not add up 100% as ‘don’t know’ responses have been excluded Significantly higher/lower than average for all segments
7.5 Constrained Strugglers: Views on outcome – major purchase
The Constrained Strugglers did not feel that shopping around would have led to better outcomes for them. They were the least likely of any segment to think they could have got a lower price by shopping around (17% agreed, v 40% on average), and the least likely to think agree they could have got a better customer service by shopping around (16% agreed, v 34% on average) (Chart 28).
However, even though they do not think that shopping around would have improved the outcome, the Constrained Strugglers were the segment least likely to say they would choose the same supplier if

Consumer Empowerment survey report 30
making the decision again (31% agree v 61% on average). This underlines the vulnerability of this segment, and their lack of confidence in their ability to make the right decisions.
Chart 28 Constrained Strugglers: Agreement with statements about their major
purchase
Only two in three Constrained Strugglers felt they had the right amount of information to make their decision (much less than the 80% on average), but as many of this segment felt they had too much information as felt they had too little. This indicates that it is the quality rather than quantity of information that is key to this segment (Chart 29).
Chart 29 Constrained Strugglers: Views on amount of information available and time spent on major purchase
Constrained Strugglers
All
(622) %
(4204) %
Views on amount of information when making purchase: …wish I had more (scored 7-5) 15 8 …about the right amount (4) 66 80 …feel I had too much information (scored 1-3) 17 11 Views on amount of time spent making decision when making purchase:
…wish I had spent more time making my decision (scored 7-5) 12 8 … about the right amount (4) 64 78 … spent too much time making my decision (scored 1-3) 22 13 Base: All who have made a purchase worth £100+ in the last 2 years; figures may not add up 100% as ‘don’t know’ responses have been excluded Significantly higher/lower than average for all segments

Consumer Empowerment survey report 31
8 Consciously Unengaged
The Consciously Unengaged make up 15% of the UK adult population.
What are we like?
We’re a bit older than average (and more likely to be retired) and we’re getting on fine financially.
We don’t have any interest in shopping, or shopping around at all! It’s not because of any particular issue, like a lack of confidence, a worry about doing the wrong thing, or financial concerns: the simple thing is that we don’t want to spend the time doing it. We don’t like to shop around or race to be the first person with the next new thing. We also don’t tend to check whether we are on the best deals: really we’re happy to stick with our current supplier even if we’re not on the best deal and we feel that we are getting good enough value for our money from the purchases we do make.
We don’t use the internet as much as other people, for shopping around or for anything else. When we do shop around, we prefer to visit a shop and we tend to only get quotes from one or two places before we take the plunge.
We’re happy with what we’re currently doing – we don’t think that shopping around more will bring us lower prices or better service – if we were buying again tomorrow we’d do the same thing.
Below we describe the Consciously Unengaged segment in detail: this includes a description of their attitudinal characteristics, demographic profile, decision styles, and description of their recent customer journeys in relation to the choice of a service provider in a regulated market, and in choosing a supplier for a major purchase.
The attitudinal characteristics described in section 8.1 were the only inputs to the segmentation: their demographic profiles, decision styles and customer journeys are shown to illustrate how this segment looks and behaves, but these did not drive the segmentation.
8.1 Consciously Unengaged: Attitudinal characteristics
The attitudinal characteristics of the Consciously Unengaged segment are summarised in this section.
Personal Traits
The Consciously Unengaged showed a confidence and freedom to find solutions to challenges they may face: 87% agreed5 that they feel free to express their ideas and opinions (v 76% on average and just 26% among Constrained Strugglers), and 76 % of the Consciously Unengaged agreed that as soon as they see a problem or challenge they start looking for possible solutions (v 71% on average).
This segment was the most likely, along with Traditional Value-seekers, to have a shorter term perspective, with a higher proportion agreeing that they generally focus on the here and now rather than worry about the future (52% v. 41% on average and 50% amongst Traditional Value-seekers). This shorter term perspective may be related to the fact that both of these segments are older than the other segments and the older age groups were more likely to say they focused on the here and now.
5 This is defined as those who said ‘strongly agree’ and ‘agree’ – this definition applies to the rest of this section

Consumer Empowerment survey report 32
Shopping Styles
The views expressed by the Consciously Unengaged underlined their lack of engagement with ‘shopping around’: they did not spend a lot of time making major purchase decisions. Just 10% agreed that when shopping for a major purchase they don’t mind spending several hours looking for it, the lowest figure of any segment and far below the average (56%).
Perhaps related to this, the Consciously Unengaged tended to stick with brands that they currently know, and were not early adopters of new products or brands: only 5% said they were usually among the first to try a new product when it appears on the market (v 13% on average), and 64% said they would stick with a product that they currently buy than try something that they are not sure of (v 44% on average).
Decision-making
The Consciously Unengaged’s lack of engagement with the shopping process does not appear to be because of concerns around decision-making. Just 5% agreed that they usually have a hard time making simple decisions (v 12% on average), and they were also the segment least likely to agree that they are usually worried about making a wrong decision (18% v 29% on average).
Confidence and Negotiation
This segment expressed around average attitudes to negotiation: 17% agreed that they would do almost anything to avoid negotiation (v 18% on average) and 16% agreed that they would give in if a negotiation is not going their way (v 19% on average).
Further, their levels of confidence were also similar to average. For example, 41% said they felt confident that they would understand the terms and conditions attached to products or services (v 39% on average), and 36% felt confident that consumer law would protect them (v 32% on average).
8.2 Consciously Unengaged: Demographic profile Chart 30 shows the demographic profile of the Consciously Unengaged and the average of all segments.
Whilst the gender balance was in line with average, the Consciously Unengaged were notably older than average, with a mean age of 52 (v 47 on average). Reflecting their older profile this segment were the most likely of all the segments to be retired (34% v 23% on average) or in receipt of a state pension (29% v 19% on average).
Financial constraints did not appear to be a barrier to engagement for this segment: the Consciously Unengaged (66%) were the most likely to say they are keeping up with bills and credit commitments, along with Traditional Value-seekers (69%) and Leading Edgers (67%) who were the most ‘engaged’ segment. This compares with 61% on average. The Consciously Unengaged were amongst the least likely to give answers which suggested they were financially vulnerable, or had difficulties which might prevent them from engaging in markets (e.g. difficulties speaking/reading English, difficulties working out numbers) (see section 12.6.2). However, linked to their older age profile, the Consciously Unengaged were the most likely group to report a long term limiting illness (19% v 16% on average).
Weight of internet usage amongst the Consciously Unengaged was amongst the lowest of all segments (along with the Constrained Strugglers): 33% of the Consciously Unengaged said they use the internet more than 10 hours per week (v 40% on average and 34% amongst the Constrained Strugglers). This lower internet use is likely is related to age in that this group were more likely to contain older members who are less likely to use the internet.

Consumer Empowerment survey report 33
Chart 30 Consciously Unengaged: Demographic profile
8.3 Choice of service provider 8.3.1 Consciously Unengaged: Decision styles - services
In order to find out how, ultimately, people choose a new supplier of services in regulated markets (for example electricity, broadband or car insurance supplier) the survey data was analysed using a technique called MaxDiff. This analysis established a ranking of ‘decision styles’ from most likely to least likely -the higher the score allocated to a decision style, the more likely that decision style amongst the segment. While each respondent was asked questions in relation to just one of the six service markets, based on which was appropriate to them, this section details responses based on all markets combined.
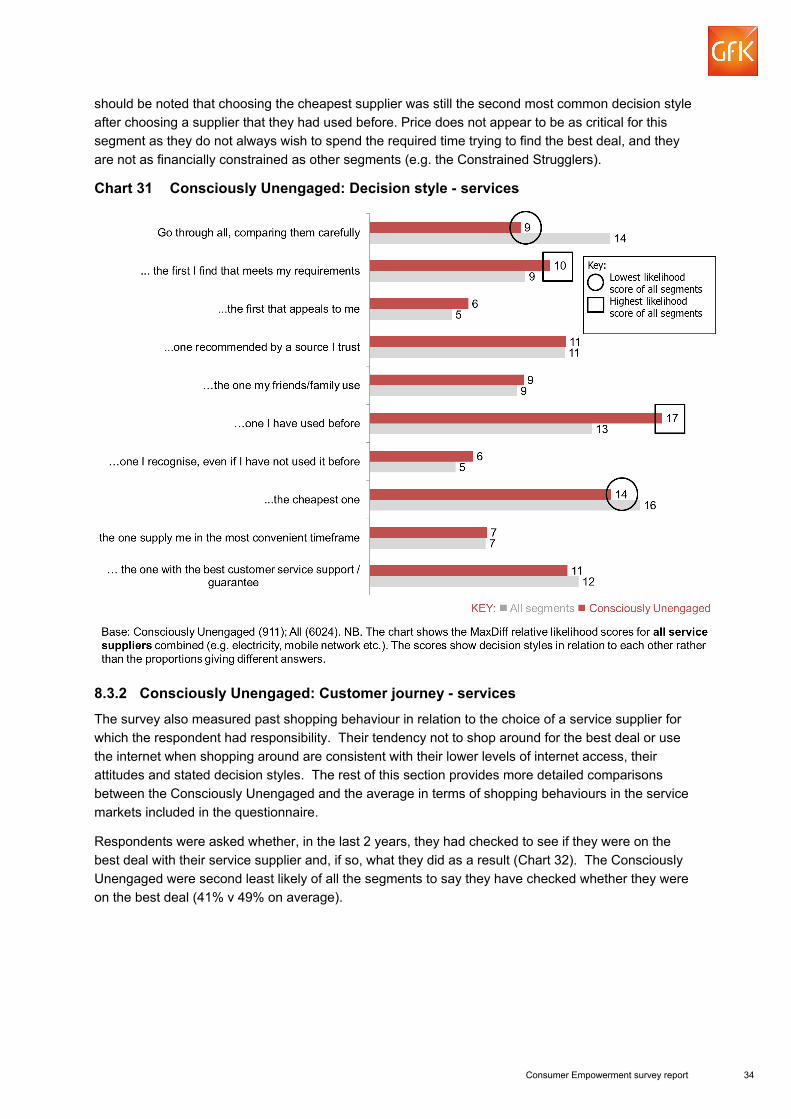
Chart 31 shows the decision styles, for the Consciously Unengaged and compares them to average across all segments. The decision styles indicated by the Consciously Unengaged are consistent with their attitudes, and reflect their lower levels of engagement with the shopping process in general.
The Consciously Unengaged were much less likely than other segments to be classified as maximisers, that is to say they were less likely than other segments to indicate a decision style where they go through all suppliers comparing them carefully. Instead, they were the most likely of all segments to say that they would choose the same supplier they had used before. This may reflect their wish not to spend too much time engaging in shopping activity, and may be linked to their stated confidence in their shopping decisions.
Further, and again reflecting their desire not to spend time on shopping decisions, the Consciously Unengaged were more likely than other segments to say that they choose ‘the first one’ – either the first one they find that meets their requirements, or the first supplier they find that appeals to them. Their scores were similar to the Constrained Strugglers on these dimensions.
Their decision styles indicated that the segment was less likely than average to make a choice of service supplier based on price alone, i.e. being the cheapest that meets their requirement, though it
Consumer Empowerment survey report 34
should be noted that choosing the cheapest supplier was still the second most common decision style after choosing a supplier that they had used before. Price does not appear to be as critical for this segment as they do not always wish to spend the required time trying to find the best deal, and they are not as financially constrained as other segments (e.g. the Constrained Strugglers).
Chart 31 Consciously Unengaged: Decision style - services
8.3.2 Consciously Unengaged: Customer journey - services
The survey also measured past shopping behaviour in relation to the choice of a service supplier for which the respondent had responsibility. Their tendency not to shop around for the best deal or use the internet when shopping around are consistent with their lower levels of internet access, their attitudes and stated decision styles. The rest of this section provides more detailed comparisons between the Consciously Unengaged and the average in terms of shopping behaviours in the service markets included in the questionnaire.
Respondents were asked whether, in the last 2 years, they had checked to see if they were on the best deal with their service supplier and, if so, what they did as a result (Chart 32). The Consciously Unengaged were second least likely of all the segments to say they have checked whether they were on the best deal (41% v 49% on average).

Consumer Empowerment survey report 35
Chart 32 Consciously Unengaged: Actions taken as a result of checking whether or not on the best deal in the last 2 years – services
Consciously Unengaged
All
(862) %
(5592) %
Checked whether on best deal - consisting of… 41 49 …changed supplier 20 22 …changed deal but kept supplier 12 15 …currently gathering information 2 3 …looked into alternatives but decided not to change 7 10 I haven’t checked 50 41 Base: those who have responsibility for choosing a supplier; figures may not add up 100% as ‘don’t know’ responses have been excluded Significantly higher/lower than average for all segments
Amongst those who had not checked whether they are on the best deal, the Consciously Unengaged were more likely to say it’s because they are satisfied with their current supplier than the other unengaged segment (56%, compared with 34% of Constrained Strugglers). They also were more likely to feel that switching takes too long (9% of those who had not checked, compared with 6%). They were also most likely to prefer to stick with their supplier they know even if it means they are not on the best deal (52%, compared with 42% on average).
Those who had checked to see whether they were on the best deal were asked where they had found out information about which supplier to use (Chart 33). The Consciously Unengaged (along with the Constrained Strugglers) were much less likely than other segments and the average of all segments to have used online sources and in particular price comparison websites reflecting their unwillingness to engage with the market and their lower levels of internet access.
Chart 33 Consciously Unengaged: Sources of information/advice used to find out about suppliers - services
The survey investigated whether those who had checked whether they are on the best deal with their supplier had negotiated with their service supplier on price or what was included in the price (Chart

Consumer Empowerment survey report 36
34). Amongst the Consciously Unengaged who had checked to see if they were on the best deal, 40% had not attempted to negotiate at all, higher than the average of all other segments (35%).
Chart 34 Consciously Unengaged: Whether negotiated on price or on the features that were included in the deal/tariff/contract – services
Consciously Unengaged
All
(318) %
(2414) %
Successfully negotiated price/deal 43 47 Negotiated but was unsuccessful 6 5 Did not negotiate 40 35 Not applicable – not possible to negotiate 8 11 Base: All who had checked to see whether they were on the best deal with their supplier; figures may not add up 100% as ‘don’t know’ responses have been excluded Significantly higher/lower than average for all segments
8.4 Choice of supplier for major purchase 8.4.1 Consciously Unengaged: Decision styles– major purchase
The MaxDiff analytical method was also used to investigate decision styles in relation to choosing a supplier for a major purchase (£100 or more): once again respondents were asked to answer about a market which was relevant to them from a list provided (for example home improvements, consumer electrics, holiday). Chart 35 shows the likelihood scores for the Consciously Unengaged and compares then against the average of all segments. Responses are consistent with those given by the segment in relation to the selection of a service supplier, with the Consciously Unengaged the least likely segment to compare all suppliers, and the most likely to choose a supplier they had used before.
Once again, there was a tendency for the Consciously Unengaged to choose the first supplier that that meets their requirements or appeals to them, (although the Constrained Strugglers segment scored even higher for choosing the first that appeals to them).
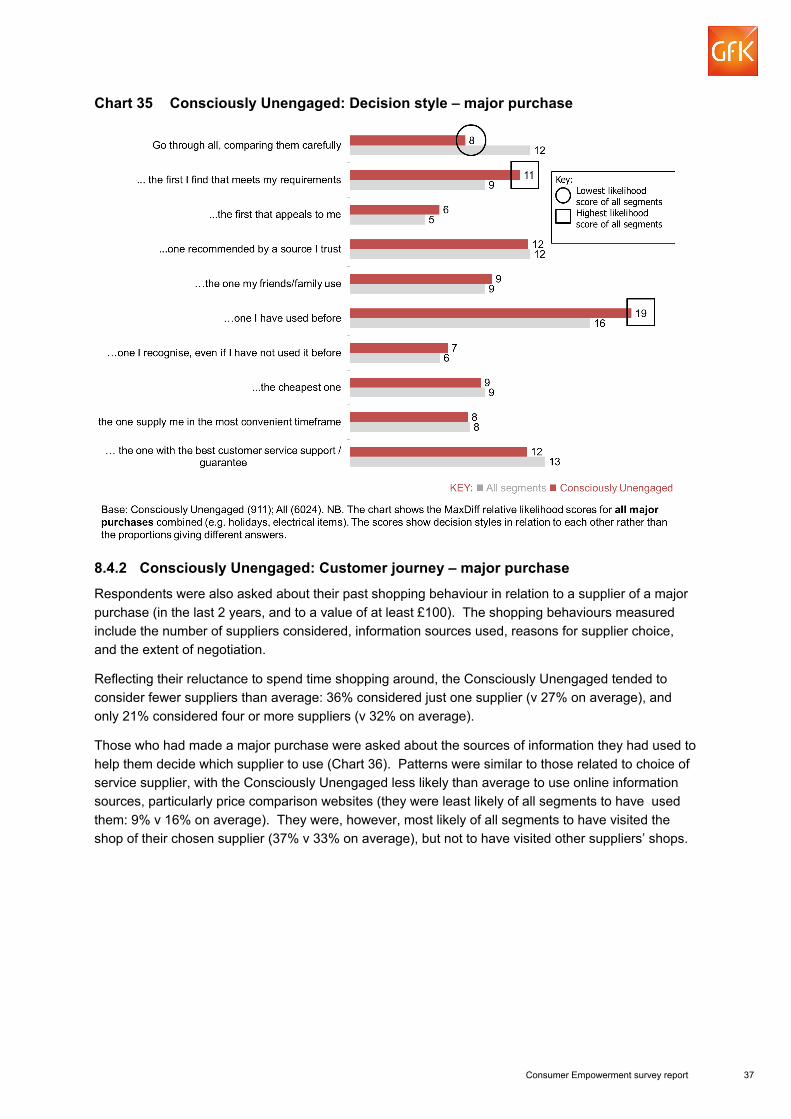
Consumer Empowerment survey report 37
Chart 35 Consciously Unengaged: Decision style – major purchase
8.4.2 Consciously Unengaged: Customer journey – major purchase Respondents were also asked about their past shopping behaviour in relation to a supplier of a major purchase (in the last 2 years, and to a value of at least £100). The shopping behaviours measured include the number of suppliers considered, information sources used, reasons for supplier choice, and the extent of negotiation.
Reflecting their reluctance to spend time shopping around, the Consciously Unengaged tended to consider fewer suppliers than average: 36% considered just one supplier (v 27% on average), and only 21% considered four or more suppliers (v 32% on average).
Those who had made a major purchase were asked about the sources of information they had used to help them decide which supplier to use (Chart 36). Patterns were similar to those related to choice of service supplier, with the Consciously Unengaged less likely than average to use online information sources, particularly price comparison websites (they were least likely of all segments to have used them: 9% v 16% on average). They were, however, most likely of all segments to have visited the shop of their chosen supplier (37% v 33% on average), but not to have visited other suppliers’ shops.

Consumer Empowerment survey report 38
Chart 36 Consciously Unengaged: Sources of information/advice used to find out about suppliers – major purchase
The Consciously Unengaged were the least likely (along with the Constrained Strugglers and Worried Indecisives) of the segments to say they negotiated on price for this major purchase (49% v 43% on average) (Chart 37). This may be because they tend to be unwilling to spend time shopping rather than confidence in their ability to negotiate or barriers related to the negotiation process, as their views on the subject were similar to average.
Chart 37 Consciously Unengaged: Whether negotiated on price or what was included in the price – major purchase
Consciously Unengaged
All
(671) %
(4204) %
Successfully negotiated price/deal 29 34 Negotiated but was unsuccessful 4 6 Did not negotiate 49 43 Not applicable – not possible to negotiate 16 15 Base: All who had made a purchase worth £100 or over in the last 2 years; figures may not add up 100% as ‘don’t know’ responses have been excluded Significantly higher/lower than average for all segments
8.4.3 Consciously Unengaged: Views on outcome – major purchase Responses given by the Consciously Unengaged indicated that they do not feel that shopping around would have led to better outcomes for them. They were less likely than average to think they could have got a lower price by shopping around (31% agreed, v 40% on average), and less likely to think agree they could have got a better customer service by shopping around (24% agreed, v 34% on average) (Chart 38).

Consumer Empowerment survey report 39
Perhaps linked to this, and consistent with their stated decision styles, the Consciously Unengaged were the most likely (along with Traditional Value-seekers) to agree that that if they were making the decision again that they would use the same provider (67% v 61% on average).
Chart 38 Consciously Unengaged: Agreement with statements - major purchase
Further, the Consciously Unengaged were amongst the most likely, along with the Traditional Value-seekers, to feel had the right amount of information prior to making their purchase, and that they had spent the right amount of time making their decision (Chart 39).
Chart 39 Consciously Unengaged: Views on amount of information available and time spent making decision - major purchase
Consciously Unengaged
All
(671) %
(4204) %
Views on amount of information when making purchase: …wish I had more (scored 7-5) 6 8 …about the right amount (4) 85 80 …feel I had too much information (scored 1-3) 8 11 Views on amount of time spent making decision when making purchase
…wish I had spent more time making my decision (scored 7-5) 8 8 …about the right amount (4) 81 78 …spent too much time making my decision (scored 1-3) 10 10 Base: All who have made a purchase worth £100+ in the last 2 years; figures may not add up 100% as ‘don’t know’ responses have been excluded Significantly higher/lower than average for all segments

Consumer Empowerment survey report 40
9 Worried Indecisives
The Worried Indecisives make up 22% of the UK adult population.
What are we like?
We tend to be female and are a bit younger, but other than that we are pretty similar to the average profile.
We like to spend time shopping around for the best deal, and we really like getting advice from other people to help us do this – from friends/family as well as the experts. But we find it hard to decide what to do with this information as we really do worry about making the right decision! This is probably the reason we don’t end up changing our service supplier as often as some do.
We are not sure if we are getting the best value when we do purchase things - we don’t like to negotiate to get a better deal, and don’t feel that confident having a go. Perhaps because of that, we don’t tend to even try. We also don’t feel that confident understanding terms and conditions or making complaints if things do go wrong.
So we do enjoy shopping around, put in the time to do it, and understand the benefits. However, we just worry about making any decisions!
Below we describe the Worried Indecisives segment in detail: this includes a description of their attitudinal characteristics, demographic profile, decision styles, and description of their recent customer journeys in relation to the choice of a service provider, and in choosing a supplier for a major purchase.
9.1 Worried Indecisives: Attitudinal characteristics
The attitudinal characteristics of the Worried Indecisives segment are summarised in this section.
Personal Traits
Worried Indecisives have around average levels of self-efficacy - most agree6 that they feel free to express their ideas and opinions (83% v 76% on average); that as soon as they see a problem or challenge they start looking for possible solutions (81% v 71% on average); and that they are able to follow through with things once they have made up their mind to do something (83% v 74% on average).
However, in comparison with other segments, Worried Indecisives consider themselves very time poor: 73% think there is not enough time to do all the things they would like to do, by some distance the highest proportion of any segment (v 57% on average).
They are also slightly more likely to agree (56% v 47% on average) that you have to take risks to lead a full life, similar in this respect to the Consciously Unengaged and Leading Edgers.
Shopping styles and decision making
Despite this slightly more risk-taking attitude Worried Indecisives tend to be very cautious in many aspects of their shopping styles. They are by far the group most likely to agree that they trust the
6 This is defined as those who said ‘strongly agree’ and ‘agree’ – this definition applies to the rest of this section

Consumer Empowerment survey report 41
experts and the advice they provide (52% agree v 36% on average). Perhaps most strikingly, they report considerable difficulties in making decisions, being the segment most likely to agree that they put off making a decision until a deadline (44% v 26% on average), that they have a hard time making even simple decisions (24% v 12% on average) and that they worry about making a wrong decision (49% v 29% on average).
They are also more likely than average to spend a lot of time shopping around. Worried Indecisives are more likely than average to agree that they take the time to consider all alternatives before making a decision (72% v 59% on average), and that they continue to search for an item until it reaches their expectations (70% v 55% on average). In this sense they are maximisers, in that they are well aware that markets are complex and that there is a great deal of choice and information out there, and they want to take advantage of this choice and do not wish to miss anything. However, this is likely to be undermined to some extent by their perceived decision difficulty.
Confidence and negotiation
Worried Indecisives are by far the segment most likely to avoid negotiations and, when they do give it a go, they are the most likely to give up easily. Nearly half (47%) agreed that they will do almost anything to avoid a negotiation (v 18% on average); and over half (53%) that they will give in if a negotiation is not going their way (v 19% on average). This lack of confidence in negotiating is reflected in their lack of confidence in other aspects of their consumer experience. Only the Constrained Strugglers reported lower levels of confidence that that they will understand the terms and conditions attached to a purchase (36% Worried Indecisives were confident v 15% Constrained Strugglers and 39% on average), or confidence in making a complaint about a product or service that they have purchased (47% Worried Indecisives v 22% Constrained Strugglers and 57% on average).
9.2 Worried Indecisives: Demographic profile
Chart 40 shows the demographic profile of the Worried Indecisives and the average of all segments.
Chart 40 Worried Indecisives: Demographic profile
Worried Indecisives are more likely than the average to be female (57%) and tend to be younger (mean age of 44, v 47 average). Otherwise the demographic profile of this segment is reasonably

Consumer Empowerment survey report 42
close to the average, although they are slightly more likely to be in part-time work, and to be in receipt of some kind of state benefit. Their weight of internet usage is similar to the average.
Some of the answers the Worried Indecisives gave indicated that finances were tight for them: they were the second most likely (after the Constrained Strugglers) to say that they would not be able to pay a £300 unexpected bill (13% v 11% on average), and also the second most likely to say that they do not have savings equivalent to 3 months’ income (49% v 44% on average). Further, they were the second most likely (again after the Constrained Strugglers) to say they are paying for their electricity bills by non-standard methods such as pre-payment (23% v 20% on average). They were also the second most likely to say that they were from a non-white ethnic group (12% v 10% on average), and the second most likely to report difficulties with speaking or reading English or working out numbers (see section 12.6.2).
9.3 Choice of service provider 9.3.1 Worried Indecisives: Decision styles - services In order to find out how, ultimately, people choose a new supplier of services in regulated markets (for example electricity, broadband or car insurance supplier) the survey data was analysed using a technique called MaxDiff. This analysis established a ranking of ‘decision styles’ from most likely to least likely - the higher the score allocated to a decision style, the more likely that decision style amongst the segment. While each respondent was asked questions in relation to just one of the six service markets, based on which was appropriate to them, this section details responses based on all markets combined.
Chart 41 shows the decision styles for the Worried Indecisives and compares them to the average across all segments. In general their decision styles were very similar to the average, though they were the least likely (along with Traditional Value-seekers) to say they were likely to choose the first supplier they find that meets their requirements: reflecting their higher engagement in markets.
Given that they were the most likely segment to agree that they trust the experts and the advice they give, it is unsurprising that this segment scores particularly high on choosing a supplier recommended by a source they trust.

Consumer Empowerment survey report 43
Chart 41 Worried Indecisives: Decision style – services
9.3.2 Worried Indecisives: Customer journey - services The survey also measured past shopping behaviour in relation to the choice of a service supplier for which the respondent had responsibility. As with their decision style, Worried Indecisives did not have many defining characteristics in terms of their behaviour in the regulated service markets.
Respondents were asked whether, in the last two years, they had checked to see if they were on the best deal with their service supplier and, if so, what they did as a result (Chart 42). The Worried Indecisives were close to the average (behind the Traditional Value-seekers and Leading Edgers) in terms of checking whether they were on the best deal (47% v 49% on average) and having switched to get a better deal (21% v 22% on average).

Consumer Empowerment survey report 44
Chart 42 Worried Indecisives: Actions taken as a result of checking whether or not on the best deal – services
Worried Indecisives
All
(1234) %
(5592) %
Checked whether on best deal consisting of… 47 49 …changed supplier 21 22 …changed deal but kept supplier 13 15 …currently gathering information 2 3 …looked into alternatives but decided not to change 10 10 I haven’t checked 42 41 Base: those who have responsibility for choosing a supplier; figures may not add up 100% as ‘don’t know’ responses have been excluded Significantly higher/lower than average for all segments
However, of all the segments they were the most likely to say that they had checked because they believed they could get a better deal, reflecting their belief that there are better deals out there in the market.
Amongst those who had not checked whether they are on the best deal, the Worried Indecisives tended to articulate the same reasons as others for not checking, their most common mention being that they were satisfied they were on the best deal (51% v 50% on average).
Those who had checked to see whether they were on the best deal were asked where they had found out information about which supplier to use (Chart 43). Worried Indecisives tended to look for information in more places than the unengaged segments (Constrained Strugglers and Consciously Unengaged) but fewer than the engaged groups (Traditional Value-seekers and Leading Edgers). In particular, they were less likely than the Leading Edgers to look at price comparison websites, perhaps reflecting their lower levels of internet usage.
They were also the least likely of all segments to say that they had contacted suppliers directly, which may be linked to their lack of confidence in negotiating with suppliers.

Consumer Empowerment survey report 45
Chart 43 Worried Indecisives: Sources of information/advice used to find out about suppliers - services
The survey investigated whether those who had checked whether they are on the best deal with their supplier had negotiated with their service supplier on price or what was included in the price (Chart 44). The Worried Indecisives (who had checked to see if they were on the best deal) were the second least likely segment to have attempted to negotiate their deal (42% v 47% on average), consistent with their more negative attitude towards negotiation in general. Only the Constrained Strugglers were less likely to have done so (30%).
Chart 44 Worried Indecisives: Whether negotiated on price or on the features that were included in the deal/tariff/contract – services
Worried Indecisives
All
(486) %
(2414) %
Successfully negotiated price/deal 42 47 Negotiated but was unsuccessful 3 5 Did not negotiate 41 35 Not applicable – not possible to negotiate 11 11 Base: All who had checked to see whether they were on the best deal with their supplier; figures may not add up 100% as ‘don’t know’ responses have been excluded Significantly higher/lower than average for all segments 9.4 Choice of supplier for major purchase 9.4.1 Worried Indecisives: Decision styles– major purchase
The MaxDiff analytical method was also used to investigate decision styles in relation to choosing a supplier for a major purchase (£100 or more): once again respondents were asked to answer about a market which was relevant to them from a list provided (for example home improvements, consumer electrics, holiday). Chart 45shows the likelihood scores for the Worried Indecisives, and as with services their decision style is very close to the average of all segments.

Consumer Empowerment survey report 46
Chart 45 Worried Indecisives: Decision style – major purchase
9.4.2 Worried Indecisives: Customer journey – major purchase
Respondents were also asked about their past shopping behaviour in relation to a supplier of a major purchase (in the last two years, and to a value of at least £100). The shopping behaviours measured include the number of suppliers considered, information sources used, reasons for supplier choice, and the extent of negotiation.
The Worried Indecisives tended to shop around slightly more than average (74% had considered at least two suppliers v 72% on average), but not as much as Traditional Value-seekers and Leading Edgers.
Those who had made a major purchase were asked about the sources of information they had used to help them decide which supplier to use (Chart 46). Worried Indecisives were the most likely to say they sought advice from friends or family (25% v 21% on average), emphasising the importance to them of having reassurance from others that they had made the right decision.

Consumer Empowerment survey report 47
Chart 46 Worried Indecisives: Sources of information/advice used to find out about suppliers – major purchase
Reflecting their lower levels of confidence negotiating, and their preference to avoid negotiation, it is unsurprising that the Worried Indecisives were less likely than average to say that they attempted to negotiate on price or what was included in the price: 48% did not try to negotiate v 43% on average (Chart 47).
Chart 47 Worried Indecisives: Whether negotiated on price or what was included in
the price – major purchase
Worried Indecisives
All
(882) %
(4204) %
Successfully negotiated price/deal 31 34 Negotiated but was unsuccessful 4 6 Did not negotiate 48 43 Not applicable – not possible to negotiate 15 15 Base: All who had made a purchase worth £100 or over in the last 2 years; figures may not add up 100% as ‘don’t know’ responses have been excluded Significantly higher/lower than average for all segments
9.4.3 Worried Indecisives: Views on outcome – major purchase
Worried Indecisives’ attitudes towards the benefits of shopping around were similar to average: two fifths (42%) agreed that they got/could have got a lower price by shopping around, and 37% agreed they got/could have got a better quality of service by shopping around (more likely than the average score of 34%). They were also equally likely as average to say they would use the same supplier if they were making the decision again (63% agreed v 61% on average) (Chart 48).

Consumer Empowerment survey report 48
Chart 48 Worried Indecisives: Agreement with statements about their major purchase
Unlike Constrained Strugglers, the large majority (80%) of Worried Indecisives tended to feel they had the right amount of information to make their decision. It therefore appears that their issue was therefore related not to the amount of information available to them, but their ability to make a decision using this information (Chart 49).
Chart 49 Worried Indecisives: Views on amount of information available and time spent on major purchase
Worried Indecisives
All
(882) %
(4204) %
Views on amount of information when making purchase: …wish I had more (scored 7-5) 7 8 …about the right amount (4) 80 80 …feel I had too much information (scored 1-3) 11 11 Views on amount of time spent making decision when making purchase
… wish I had spent more time making my decision (scored 7-5) 9 8 … about the right amount (4) 76 78 … spent too much time making my decision (scored 1-3) 13 13 Base: All who have made a purchase worth £100+ in the last 2 years; figures may not add up 100% as ‘don’t know’ responses have been excluded Significantly higher/lower than average for all segments
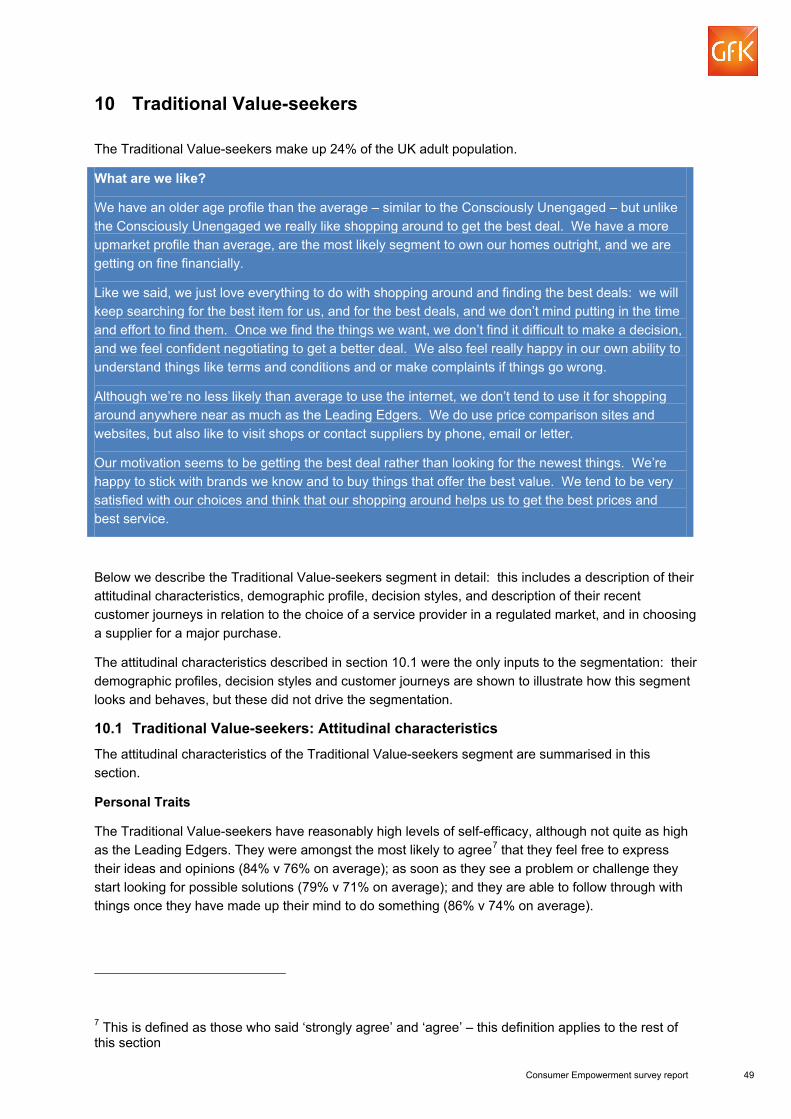
Consumer Empowerment survey report 49
10 Traditional Value-seekers
The Traditional Value-seekers make up 24% of the UK adult population.
What are we like?
We have an older age profile than the average – similar to the Consciously Unengaged – but unlike the Consciously Unengaged we really like shopping around to get the best deal. We have a more upmarket profile than average, are the most likely segment to own our homes outright, and we are getting on fine financially.
Like we said, we just love everything to do with shopping around and finding the best deals: we will keep searching for the best item for us, and for the best deals, and we don’t mind putting in the time and effort to find them. Once we find the things we want, we don’t find it difficult to make a decision, and we feel confident negotiating to get a better deal. We also feel really happy in our own ability to understand things like terms and conditions and or make complaints if things go wrong.
Although we’re no less likely than average to use the internet, we don’t tend to use it for shopping around anywhere near as much as the Leading Edgers. We do use price comparison sites and websites, but also like to visit shops or contact suppliers by phone, email or letter.
Our motivation seems to be getting the best deal rather than looking for the newest things. We’re happy to stick with brands we know and to buy things that offer the best value. We tend to be very satisfied with our choices and think that our shopping around helps us to get the best prices and best service.
Below we describe the Traditional Value-seekers segment in detail: this includes a description of their attitudinal characteristics, demographic profile, decision styles, and description of their recent customer journeys in relation to the choice of a service provider in a regulated market, and in choosing a supplier for a major purchase.
The attitudinal characteristics described in section 10.1 were the only inputs to the segmentation: their demographic profiles, decision styles and customer journeys are shown to illustrate how this segment looks and behaves, but these did not drive the segmentation.
10.1 Traditional Value-seekers: Attitudinal characteristics The attitudinal characteristics of the Traditional Value-seekers segment are summarised in this section.
Personal Traits
The Traditional Value-seekers have reasonably high levels of self-efficacy, although not quite as high as the Leading Edgers. They were amongst the most likely to agree7 that they feel free to express their ideas and opinions (84% v 76% on average); as soon as they see a problem or challenge they start looking for possible solutions (79% v 71% on average); and they are able to follow through with things once they have made up their mind to do something (86% v 74% on average).
7 This is defined as those who said ‘strongly agree’ and ‘agree’ – this definition applies to the rest of this section

Consumer Empowerment survey report 50
They were slightly less risk averse than other segments (except Constrained Strugglers who are much less risk averse), with 45% agreeing that you need to take risks to lead a full life (v 47% on average). However, they have a reasonably ‘short-termism’ perspective, with 50% of the Traditional Value-seekers agreeing that they tend to focus on the here and now rather than worry about the future (v 41% on average).
They are slightly below average in terms of time poverty, with 63% of Traditional Value-seekers agreeing that there is not enough time to do all the things they would like to do (v 57% on average).
Overall this is segment that is reasonably established with their self-confidence, and with a positive outlook that shapes much of their decision-making behaviour and shopping style.
Shopping Styles
The self-confidence of this segment is manifested in a well-established shopping style. Traditional Value-seekers tend to buy the same brands that they have done over time, and are not early adopters of new products or services: 66% agree that they would rather stick with a product they currently buy than try something they are not sure of, the highest proportion of any segment (v 44% on average). In contrast just 7% agree that they are usually among the first to try a new product when it appears on the market, the lowest proportion (with the Consciously Unengaged), and compared with 13% on average.
Their self-esteem is also illustrated by the relatively high levels of communication they have with other consumers, either as someone who is often asked about their opinion (37% agreed that they were often asked v 31% on average) or posting online or chatting with others about the products or services they have bought (50% agreed they did this v 43% on average). However, they are not as likely as the Traditional Value-seekers to agree that they do this.
Decision-making
Traditional Value-seekers are greatly motivated by the enjoyment of shopping around for the best deal. They were the most likely of any segment to agree that they usually continue to search for an item until it reaches their expectation (76% v 55% on average); that they do not mind spending several hours looking for a major purchase (79% v 56% on average); and that when they see something that they want they always try to find the best deal before purchasing it (84% v 62% on average).
These therefore are active shoppers who like to do their research before making a purchase. Whilst they do not feel that they have a hard time making simple decisions, they do sometimes worry about making the wrong decision (29% agreed that this was the case, the second highest of any segment after the Worried Indecisives): this may be because they are strongly motivated to find the best value deal and may be concerned that they could have found a better deal elsewhere.
Confidence and negotiation
The Traditional Value-seekers segment scores highly on all of the consumer-related confidence measures. They are the most confident of any segment in their ability to negotiate the best deal (52% confident v 36% on average), and equally confident with the Leading Edgers that they will understand the terms and conditions attached to a product or service (49% v 39% on average).
So Traditional Value-seekers are highly engaged and confident consumers, who enjoy shopping around and are prepared to spend the time to find the best value. This willingness to invest the time, and to negotiate for the best deal clearly differentiates the segment from the Consciously Unengaged.
10.2 Traditional Value-seekers: Demographic profile
Chart 50 shows the demographic profile of the Traditional Value-seekers and the average of all segments.

Consumer Empowerment survey report 51
Chart 50 Traditional Value-seekers: Demographic profile
Whilst the gender profile of the Traditional Value-seekers is in line with average, this segment tends to be older with a mean age of 50 (v 47 on average) and 42% aged 55+ (v 35% on average). They were also more likely to be from the C1 Social Grade (31% v 27% on average). A higher proportion of this segment own their house outright (34% v 29% on average – in part reflecting their higher average age profile). The relative financial security of this segment is also illustrated by the fact that a higher proportion of this segment said they were keeping up with their bills and credit commitments (69% v 61% on average), and a slightly lower proportion were in receipt of means tested benefits (21% v 25% on average) despite their older average age profile. They also score low on all other financial vulnerability indicators (see section 12.6.2).
The weight of internet usage amongst the Traditional Value-seekers was similar to the average, which may be linked to their older age profile. In addition, and again linked to their older age profile, this segment was amongst the most likely to report a long-term limiting illness (18% v 16% on average).
10.3 Choice of service provider 10.3.1 Traditional Value-seekers: Decision styles - services
In order to find out how people choose a new supplier of services in regulated markets (for example electricity, broadband or car insurance supplier) the survey data was analysed using a technique called MaxDiff. This analysis established a ranking of ‘decision styles’ from most likely to least likely - the higher the score allocated to a decision style, the more likely that decision style amongst the segment. While each respondent was asked questions in relation to just one of the six service markets, based on which was appropriate to them, this section details responses based on all markets combined.
Chart 51 shows the decision styles for the Traditional Value-seekers and compares them to average across all segments. Consistent with their attitudes, Traditional Value-seekers were more likely than most other segments to be classified as maximisers, that is to say they were more likely to indicate a decision style where they go through all suppliers comparing them carefully. Only the Leading Edgers were more likely to say this. On the other hand, and not unexpectedly given their interest in shopping generally and their risk aversion, they were the least likely segment to choose the first service supplier that appeals, or the one they recognise even if it is not a supplier they had used before.

Consumer Empowerment survey report 52
Chart 51 Traditional Value-seekers: Decision style – services
10.3.2 Traditional Value-seekers: Customer journey - services The survey also measured past shopping behaviour in relation to the choice of a service supplier for which the respondent had responsibility. The tendency for Traditional Value-seekers to shop around for the best deal but not to use the internet when shopping around is consistent with their lower levels of internet access, their attitudes and stated decision styles. The rest of this section provides more detailed comparisons between the Traditional Value-seekers and the average in terms of shopping behaviours in the service markets included in the questionnaire.
Respondents were asked whether, in the last two years, they had checked to see if they were on the best deal with their service supplier and, if so, what they did as a result (Chart 52). The Traditional Value-seekers were the second most likely segment (after the Leading Edgers) to say they had checked whether they were on the best deal (57% v 49% on average) and that they had switched to get a better deal (25% v 22% on average).

Consumer Empowerment survey report 53
Chart 52 Traditional Value-seekers: Actions taken as a result of checking whether or not on the best deal – services
Traditional
Value- Seekers
All
(1286) %
(5592) %
Checked whether on best deal consisting of… 57 49 …changed supplier 25 22 …changed deal but kept supplier 17 15 …currently gathering information 3 3 …looked into alternatives but decided not to change 11 10 I haven’t checked 36 41 Base: those who have responsibility for choosing a supplier; figures may not add up 100% as ‘don’t know’ responses have been excluded Significantly higher/lower than average for all segments
Amongst those who had not checked whether they are on the best deal, the Traditional Value-seekers were the most likely to say that this was because they were satisfied they were on the best deal (59% v 51% on average). This may reflect their confidence that through the appropriate research they may already have the best deal.
Those who had checked to see whether they were on the best deal were asked where they had found out information about which supplier to use (Chart 53). There were no particularly prevalent information sources, though the Traditional Value-seekers were more likely than other segments to have contacted suppliers by phone/email/letter and somewhat less likely to have used online sources than the Leading Edgers.
Chart 53 Traditional Value-seekers: Sources of information/advice used to find out
about suppliers – services
The survey investigated whether those who had checked whether they are on the best deal with their supplier had negotiated with their service supplier on price or what was included in the price (Chart 54). The Traditional Value-seekers (who had checked to see if they were on the best deal) were the

Consumer Empowerment survey report 54
segment most likely to have successfully negotiated a better deal (55% v 47% on average), reflecting their preference to seek out the best value.
Chart 54 Traditional Value-seekers: Whether negotiated on price or on the features that were included in the deal/tariff/contract – services
Traditional
Value-seekers
All
(688) %
(2414) %
Successfully negotiated price/deal 55 47 Negotiated but was unsuccessful 4 5 Did not negotiate 27 35 Not applicable – not possible to negotiate 12 11 Base: All who had checked to see whether they were on the best deal with their supplier; figures may not add up 100% as ‘don’t know’ responses have been excluded Significantly higher/lower than average for all segments 10.4 Choice of supplier for major purchase 10.4.1 Traditional Value-seekers: Decision styles– major purchase
The MaxDiff analytical method was also used to investigate decision styles in relation to choosing a supplier for a major purchase (£100 or more): once again respondents were asked to answer about a market which was relevant to them from a list provided (for example home improvements, consumer electrics, holiday). Chart 55 shows the likelihood scores for the Traditional Value-seekers and compares them against the average of all segments. The results are similar to those seen in relation to choice of a regulated service supplier. Again, it can be seen that Traditional Value-seekers were more likely to go through all suppliers comparing them carefully before making a choice (maximisers), though they were not the most likely segment to do so (the Leading Edgers were more likely).

Consumer Empowerment survey report 55
Chart 55 Traditional Value-seekers: Decision style – major purchase
10.4.2 Traditional Value-seekers: Customer journey – major purchase Respondents were also asked about their past shopping behaviour in relation to the choice of supplier for a major purchase (in the last two years, and to a value of at least £100). The shopping behaviours measured include the number of suppliers considered, information sources used, reasons for supplier choice, and the extent of negotiation.
Consistent with their attitudes towards shopping around, Traditional Value-seekers tended to shop around more than others, being the second most likely segment (after the Leading Edgers) to consider four or more suppliers (36% v 32% on average).
Those who had made a major purchase were asked about the sources of information they had used to help them decide which supplier to use (Chart 56). The responses were similar to those related to choice of service supplier, and the key point of difference compared with the Leading Edgers was again that the Traditional Value-seekers were less likely to use online information sources.

Consumer Empowerment survey report 56
Chart 56 Traditional Value-seekers: Sources of information/advice used to find out about suppliers – major purchase
The Traditional Value-seekers were the second most likely of the segments (after the Leading Edgers) to have successfully negotiated a better price for this major purchase (39% v 34% on average) (Chart 57). This again reflects their willingness to use confidence in negotiation to find the best value deal.
Chart 57 Traditional Value-seekers: Whether negotiated on price or what was
included in the price – major purchase
Traditional Value-seekers
All
(1122) %
(4204) %
Successfully negotiated price/deal 39 34 Negotiated but was unsuccessful 4 6 Did not negotiate 40 43 Not applicable – not possible to negotiate 16 15 Base: : All who have made a purchase worth £100 or over in the last 2 years; figures may not add up 100% as ‘don’t know’ responses have been excluded Significantly higher/lower than average for all segments
10.4.3 Traditional Value-seekers: Views on outcome – major purchase
Overall, Traditional Value-seekers feel that shopping around leads to positive outcomes. They were the most likely segment to agree that they got/ could have got a lower price by shopping around (47%), and the second most likely (the Leading Edgers) to agree that they got/could have got better service by shopping around (38%).
As they tended to shop around multiple suppliers and to negotiate a deal, it is unsurprising to note that they were the most likely segment (with the Consciously Unengaged) to agree that they would use the same supplier if they were making the decision again (67% agree). However, while the Consciously

Consumer Empowerment survey report 57
Unengaged may have indicated that they would make the same decision because of inertia and a lack of willingness to engage in the market, the Traditional Value-seekers responses may be because they are satisfied that they have made the right decision.
Chart 58 Traditional Value-seekers: Agreement with statements about their major purchase
The vast majority of Traditional Value-seekers felt they had the right amount of information to make their decision (83%, similar to all other segments apart from Constrained Strugglers), and they had shopped around about the right amount (81%, again similar to other segments apart from Constrained Strugglers).
Chart 59 Traditional Value-seekers: Views on amount of information available and time spent on major purchase
Traditional Value-
seekers
All
(1122) %
(4204) %
Views on amount of information when making purchase: …wish I had more (scored 7-5) 6 8 …about the right amount (4) 83 80 …feel I had too much information (scored 1-3) 10 11 Views on amount of time spent making decision when making purchase
…wish I had spent more time making my decision (scored 7-5) 6 8 … about the right amount (4) 81 78 … spent too much time making my decision (scored 1-3) 11 13 Base: All who have made a purchase worth £100+ in the last 2 years; figures may not add up 100% as ‘don’t know’ responses have been excluded Significantly higher/lower than average for all segments

Consumer Empowerment survey report 58
11 Leading Edgers
The Leading Edgers make up 21% of the UK adult population.
What are we like?
We are well educated, upmarket and are getting on fine financially. Of all the segments, we use the internet the most – in general and also for shopping around.
We really like seeking out the newest products: of all the segments we’re the most likely to be the first to try out new things when they hit the market, and we’re happy taking the odd risk here and there on them. We look around online a lot to find good deals, but also to look for information about products and services, and to share our views too.
While the Traditional Value-seekers tend to shop around a lot to get the best value deals, we shop around a lot to find new things. We’re quite price sensitive when choosing suppliers for services like energy or insurance, but nowhere near as price sensitive when buying products like electronics or holidays. And we’re not particularly brand loyal: we’re happy to switch to try new things.
When choosing where to buy products or services, we look around for lots of information from lots of suppliers (but especially online) before making decisions. Online reviews and good customer service are important, but it’s also important to buy from the people we think are the market experts. We’re happy negotiating: we do it quite a lot and tend to be pretty successful.
While we’re happy with the deals we get, we wouldn’t necessarily make the same decision again: why should we when there’s always something new to buy?
Below we describe the Leading Edgers segment in detail: this includes a description of their attitudinal characteristics, demographic profile, decision styles, and description of their recent customer journeys in relation to the choice of a service provider in a regulated market, and in choosing a supplier for a major purchase.
The attitudinal characteristics described in section 11.1 were the only inputs to the segmentation: their demographic profiles, decision styles and customer journeys are shown to illustrate how this segment looks and behaves, but these did not drive the segmentation.
11.1 Leading Edgers: Attitudinal characteristics
The attitudinal characteristics of the Leading Edgers segment are summarised in this section.
Personal Traits
Leading Edgers are very confident, with the highest levels of self-efficacy on all measures. They are the segment most likely to agree8 that they feel free to express their ideas and opinions (88% v 76% on average); that they start looking for possible solutions once they see a problem or challenge (86% v 71% on average); and they are able to follow through with things once they have made up their mind to do something (87% v 74% on average).
The Leading Edgers also like to plan for the future with just 30% saying they focus on the here and now rather than worry about the future (v 41% on average). However, they are characterised by a risk-
8 This is defined as those who said ‘strongly agree’ and ‘agree’ – this definition applies to the rest of this section

Consumer Empowerment survey report 59
seeking attitude, and are the segment amongst the most likely to agree that they need to take risks to lead a full life (55% v 47% on average), and this risk seeking attitude may be borne out in their shopping styles and habits.
Shopping Styles
This high level of self-efficacy and confidence enables this segment to enjoy trying new things, and makes them natural opinion leaders. Leading Edgers are early adopters, and enjoy communicating with others about their purchases. A fifth (22%) agree that they are usually among the first to try a new product when it appears on the market, by some distance the highest proportion of any segment (v 13% on average); and the majority say they often communicate about the products and services they have bought (53% v 43% on average). This segment is also the most likely to agree that others ask their opinions about what they should buy or use (40% v 31% on average).
Decision-making
The Leading Edgers also enjoy shopping around: although not quite to the same extent as Traditional Value-seekers.
The Leading Edgers are more likely than average to agree that they always try to find the best deal before purchasing (78% v 62% on average), and they do not like making decisions before they know all their options (51% v 46% on average). However, this does not appear to negatively impact on their decisiveness as just 23% of Leading Edgers agree that they are usually worried about making a wrong decision (v 29% on average).
Leading Edgers are also less likely than the Traditional Value-seekers to indicate that they are willing to spend time shopping around, although they still sit significantly above average on all related measures:
• 67% of Leading Edgers agree that they usually continue to search for an item until it reaches their expectation (v 55% on average)
• 70% don’t mind spending several hours looking for a major purchase (v 56% on average) • 70% agree they take the time to consider all alternatives before making a decision (v 59% on
average)
Confidence and negotiation
Leading Edgers believe in their own judgement and therefore do not rely on the opinion of experts. They are the second least likely segment (after Constrained Strugglers) to agree that they tend to trust experts and accept the advice they are given (26% agree v 36% on average). It may be that the Leading Edgers and Constrained Strugglers are less likely to trust experts for different reasons: for the Constrained Strugglers this may be a further constraint which leads to a lack of engagement with markets and decision difficulty, whereas for the Leading Edgers this may be because they have already put the time into the research themselves.
The Leading Edgers also have high levels of confidence in their own negotiation skills and score highly on all other measures related to consumer confidence. They are the most confident (along with Traditional Value-seekers) in their ability to negotiate the best deal (50% confident v 36% on average), and that they will understand the terms and conditions attached to a product or service (50% v 39% on average).
So Leading Edgers are, all things considered, one of the most empowered of all the segments (along with Traditional Value-seekers) in terms of their consumer behaviour and personal attributes. However, it is their willingness to try new things and lead the opinion of others that most differentiates this segment from the Traditional Value-seekers.

Consumer Empowerment survey report 60
11.2 Leading Edgers: Demographic profile Chart 60shows the demographic profile of the Leading Edgers and the average of all segments.
Chart 60 Leading Edgers: Demographic profile
Whilst their gender and age balance was reasonably in line with average, Leading Edgers tended to be of higher social grade than the average: 34% were from the AB social grades, compared with 22% on average. This upmarket profile was also reflected in the higher incidence of Leading Edgers in work, educated to a degree or higher level, and living in a house with a mortgage (with fewer in social rented accommodation). Leading Edgers also reported fewer financial constraints than the average: they were less likely to be in receipt of means tested benefits, and more likely to be keeping up with their bills and credit commitments without difficulty. They were also the segment most likely to say that they could pay a £300 unexpected bill from savings (63% v 53% on average) and that they have savings equivalent to 3 months’ income (45% v 38% on average) (see section 12.6.2).
A key distinguishing feature of this segment is the heavy weight of internet usage; the majority (52%) used the internet for over ten hours a week, the highest proportion of any segment.
11.3 Choice of service provider 11.3.1 Leading Edgers: Decision styles - services
In order to find out how people choose a new supplier of services in regulated markets (for example electricity, broadband or car insurance supplier) the survey data was analysed using a technique called MaxDiff. This analysis established a ranking of ‘decision styles’ from most likely to least likely - the higher the score allocated to a decision style, the more likely that decision style amongst the segment. While each respondent was asked questions in relation to just one of the six service markets, based on which was appropriate to them, this section details responses based on all markets combined.
Chart 61 shows the decision styles for the Leading Edgers and compares them to average across all segments. Their decision style confirms a strong tendency towards maximising: Leading Edgers are the segment most likely to go through all providers, comparing them carefully. They are less likely to use most fast and frugal approaches to shopping, and are the least likely choose the supplier their

Consumer Empowerment survey report 61
friends/family uses, or the one they have used before. For services, the Leading Edgers were also the segment most likely to say that they choose the cheapest supplier.
Chart 61 Leading Edgers: Decision style – services
11.3.2 Leading Edgers: Customer journey - services
The survey also measured past shopping behaviour in relation to the choice of a service supplier for which the respondent had responsibility. The tendency for Leading Edgers to shop around for the best deal and/or use the internet when shopping around is consistent with their higher levels of internet access, their attitudes and stated decision styles (maximising and seeking out the cheapest deal). The rest of this section provides more detailed comparisons between the Leading Edgers and the average in terms of shopping behaviours in the service markets included in the questionnaire.
Respondents were asked whether, in the last two years, they had checked to see if they were on the best deal with their service supplier and, if so, what they did as a result (Chart 62). Reflecting their maximising shopping style, Leading Edgers were the segment most likely to say they had checked whether they were on the best deal (63% v 49% on average). Not only had they checked, the Leading Edgers were also the most likely to have switched supplier (28% v 22% on average) or have changed tariff with their supplier (20% v 15% on average).

Consumer Empowerment survey report 62
Chart 62 Leading Edgers: Actions taken as a result of checking whether or not on the best deal – services
Leading Edgers
All
(1039) %
(5592) %
Checked whether on best deal consisting of… 63 49 …changed supplier 28 22 …changed deal but kept supplier 20 15 …currently gathering information 3 3 …looked into alternatives but decided not to change 11 10 I haven’t checked 29 41 Base: those who have responsibility for choosing a supplier; figures may not add up 100% as ‘don’t know’ responses have been excluded Significantly higher/lower than average for all segments
Amongst those who had not checked whether they are on the best deal, the Leading Edgers were likely to say it was because they were satisfied they were on the best deal (56% v 51% on average).
Those who had checked to see whether they were on the best deal were asked where they had found out information about which supplier to use. Leading Edgers were particularly likely to have searched online sources, reflecting their heavy use of the internet compared with other segments. They were the most likely to have used price comparison websites (41% v 35% on average), their chosen supplier’s website (44% v 37% on average) and other supplier websites (39% v 32% on average).
Chart 63 Leading Edgers: Sources of information/advice used to find out about suppliers – services
The survey investigated whether those who had checked whether they are on the best deal with their supplier had negotiated with their service supplier on price or what was included in the price (Chart 64). The Leading Edgers (who had checked to see if they were on the best deal) were the segment

Consumer Empowerment survey report 63
second most likely (after Traditional Value-seekers) to have successfully negotiated a better deal (50% v 47% on average).
Chart 64 Leading Edgers: Whether negotiated on price or on the features that were included in the deal/tariff/contract – services
Leading Edgers
All
(615) %
(2414) %
Successfully negotiated price/deal 50 47 Negotiated but was unsuccessful 5 5 Did not negotiate 32 35 Not applicable – not possible to negotiate 11 11 Base: All who had checked to see whether they were on the best deal with their supplier; figures may not add up 100% as ‘don’t know’ responses have been excluded Significantly higher/lower than average for all segments 11.4 Choice of supplier for major purchase 11.4.1 Leading Edgers: Decision styles– major purchase
The MaxDiff analytical method was also used to investigate decision styles in relation to choosing a supplier for a major purchase (£100 or more): once again respondents were asked to answer about a market which was relevant to them from a list provided (for example home improvements, consumer electrics, holiday). Chart 65shows the likelihood scores for the Leading Edgers and compares then against the average of all segments. The results are similar to those seen in relation to choice of a regulated service supplier, with Leading Edgers the most likely of all segments to go through all suppliers comparing them carefully before making a choice (maximisers); and the least likely to use friends or family as a shortcut to decision-making, or just to pick the first supplier they liked or recognised.
While the Leading Edgers were also the segment most likely to choose their service supplier based on who is the cheapest, this was not the case for the choice of a supplier for major purchases. This may reflect the fact that this segment is the most likely to want to be the first to have the newest things: perhaps they are saving money purchasing services to enable them to find the best major purchases for them.

Consumer Empowerment survey report 64
Chart 65 Leading Edgers: Decision style – major purchase
11.4.2 Leading Edgers: Customer journey – major purchase Respondents were also asked about their past shopping behaviour in relation to a supplier of a major purchase (in the last two years, and to a value of at least £100). The shopping behaviours measured include the number of suppliers considered, information sources used, reasons for supplier choice, and the extent of negotiation.
Leading Edgers tended to consider more suppliers than others, even more so than Traditional Value-seekers: 42% of Leading Edgers had considered four or more suppliers (v 32% on average). The greater use of the internet as an information source, as described below, may have helped them to shop around more.
Those who had made a major purchase were asked about the sources of information they had used to help them decide which supplier to use (Chart 66). Leading Edgers were much more likely than other segments to use the internet, including the websites of the supplier they used, the websites of other potential suppliers, manufacturer and price comparison websites. They were also more likely to have used review websites: perhaps linked to their interest in sharing opinions.

Consumer Empowerment survey report 65
Chart 66 Leading Edgers: Sources of information/advice used to find out about suppliers – major purchase
The Leading Edgers were the segment most likely to have successfully negotiated a better price for this major purchase (41% v 34% on average) (Chart 67). Their extensive research and high levels of self-efficacy and confidence may have helped them in their negotiations.
Chart 67 Leading Edgers: Whether negotiated on price or what was included in the price – major purchase
Leading Edgers
All
(907) %
(4204) %
Successfully negotiated price/deal 41 34 Negotiated but was unsuccessful 5 6 Did not negotiate 38 43 Not applicable – not possible to negotiate 15 15 Base: All who have made a purchase worth £100 or over in the last 2 years; figures may not add up 100% as ‘don’t know’ responses have been excluded Significantly higher/lower than average for all segments
11.4.3 Leading Edgers: Views on outcome – major purchase Leading Edgers were generally satisfied with the outcomes of their purchases but knowledgeable enough about how markets work to realise that despite their extensive shopping around, there is always the potential to get a better deal.
Along with Traditional Value-seekers they were the segment most likely to agree that they got/could get a lower price by shopping around (47% agree), and they were the most likely to say they got/could get a better service by shopping around (40% agree).
This understanding of the power of the market meant that they did not always think they would use the same supplier if making the same decision again. They were the second least likely segment to agree
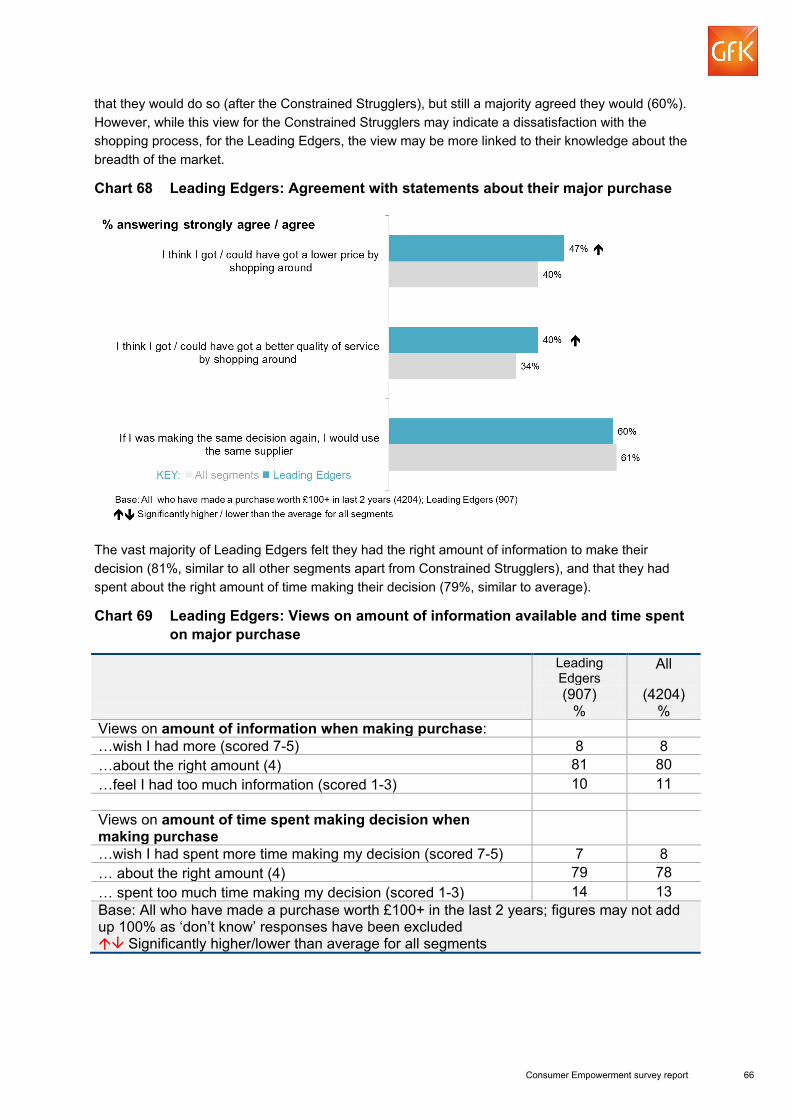
Consumer Empowerment survey report 66
that they would do so (after the Constrained Strugglers), but still a majority agreed they would (60%). However, while this view for the Constrained Strugglers may indicate a dissatisfaction with the shopping process, for the Leading Edgers, the view may be more linked to their knowledge about the breadth of the market.
Chart 68 Leading Edgers: Agreement with statements about their major purchase
The vast majority of Leading Edgers felt they had the right amount of information to make their decision (81%, similar to all other segments apart from Constrained Strugglers), and that they had spent about the right amount of time making their decision (79%, similar to average).
Chart 69 Leading Edgers: Views on amount of information available and time spent on major purchase
Leading Edgers
All
(907) %
(4204) %
Views on amount of information when making purchase: …wish I had more (scored 7-5) 8 8 …about the right amount (4) 81 80 …feel I had too much information (scored 1-3) 10 11 Views on amount of time spent making decision when making purchase
…wish I had spent more time making my decision (scored 7-5) 7 8 … about the right amount (4) 79 78 … spent too much time making my decision (scored 1-3) 14 13 Base: All who have made a purchase worth £100+ in the last 2 years; figures may not add up 100% as ‘don’t know’ responses have been excluded Significantly higher/lower than average for all segments

Consumer Empowerment survey report 67
12 Appendix
12.1 Programme design 12.2 Development stage (knowledge review and stakeholder workshop) Even before the design stage, it was acknowledged that there was a wealth of existing information about consumer engagement and behaviours and attitudes relating to purchasing or changing suppliers for goods/services. It was therefore key to ensure that this was taken into account to inform the research and questionnaire design, and focus hypothesis-led reporting.
An initial inception meeting between GfK NOP, partners, and BIS project managers was held to agree the format and timings for a learning phase, and to start gathering materials for a Knowledge Review. From this a list of topics to cover was agreed, and the scope of materials to review; including information already known and additional relevant material (not limited to published books or papers) provided through formal and informal contacts.
The output from the Knowledge Review fed into the next stage: an Immersion Workshop, which was developed in consultation with BIS, and included external stakeholders from various government and regulatory bodies. This discussed the facts, views and recommendations related to the consumer empowerment theme, identified some possible question sets on the relevant survey topics and an initial questionnaire framework, and sought input into the topics of most interest for a segmentation survey of consumer engagement.
12.3 Questionnaire Based on the outcomes from the workshop, GfK NOP developed and agreed a questionnaire draft, which was discussed and agreed with BIS and circulated to the stakeholder group for comment.
The questionnaire was tested via a two-stage dynamic pilot, which involved elements of cognitive interviewing. Six field interviewers each spent two days interviewing, and some of these were accompanied by members of the GfK NOP executive team and BIS team members. Outcomes from the first day were reviewed and changes were discussed and agreed. The second day’s piloting was used to test the changes made to the questionnaire and to gain a more accurate estimate of the interview length.
Following the pilot, discussions were held between BIS and GfK NOP to resolve the remaining issues that had emerged, and a few final refinements were made to the questionnaire to produce the version for use in main fieldwork.
The final questionnaire comprised four sections:
• All respondents were asked about their general attitudes and motivations, how they make decisions, the things they do when they go shopping, and their comfort in consumer-related issues such as negotiation and consumer protection

Consumer Empowerment survey report 68
• Thereafter, respondents were asked about their decision styles and customer journey about one service supplier. They were asked about one category of service supplier only (full list shown in Chart 70) which was selected at random from a list of categories for which they had responsibility, or joint responsibility, for choosing in their household
• Similar questions about decision styles and customer journey were also included in relation to the selection of supplier for a recent major purchase (full list shown in Chart 70). Again the category was selected at random but it had to be about a purchase they had made of at least £250 in the past two years (or at least £100 if they had not made a purchase of £250 or more)
• The final section collected general profile and demographic information to help analyse responses
The structure is summarised in Chart 70.
Chart 70 Questionnaire structure
The final interview length was 28 minutes on average.
12.4 Survey method
The survey was amongst UK adults aged 16+ and was conducted on GfK NOP’s Random Location Omnibus survey. A total of 6024 interviews was conducted between 23rd October 2014 and 8th January 2015, with the sample selected using random location sampling methods. Interviews were conducted face to face in respondents’ homes using Computer Assisted Personal Interviewing (CAPI), which means that the interviewers carried a laptop which controlled the questionnaire – the order the questions were presented in and the routing, based on previous answers.
Random location sampling is a hybrid between the simple quota sample and random probability sampling. Samples were selected using a two-stage process:
• GfK NOP selected a nationally representative sample of Census Standard Output Areas or equivalents (the primary sampling units), following stratification by country within the UK, region within England, local authority and IMD score. Sampling points were then selected with probability proportional to the size of the
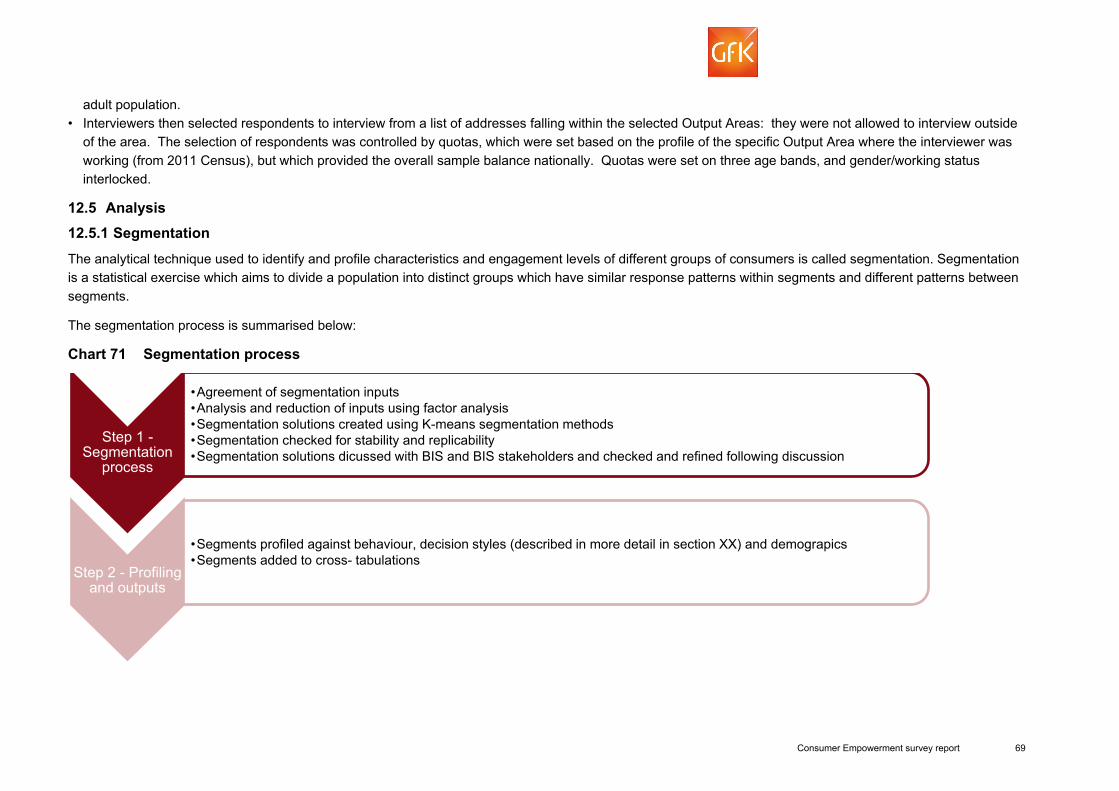
Consumer Empowerment survey report 69
adult population. • Interviewers then selected respondents to interview from a list of addresses falling within the selected Output Areas: they were not allowed to interview outside
of the area. The selection of respondents was controlled by quotas, which were set based on the profile of the specific Output Area where the interviewer was working (from 2011 Census), but which provided the overall sample balance nationally. Quotas were set on three age bands, and gender/working status interlocked.
12.5 Analysis 12.5.1 Segmentation
The analytical technique used to identify and profile characteristics and engagement levels of different groups of consumers is called segmentation. Segmentation is a statistical exercise which aims to divide a population into distinct groups which have similar response patterns within segments and different patterns between segments.
The segmentation process is summarised below:
Chart 71 Segmentation process
Step 1 - Segmentation
process
•Agreement of segmentation inputs •Analysis and reduction of inputs using factor analysis •Segmentation solutions created using K-means segmentation methods •Segmentation checked for stability and replicability •Segmentation solutions dicussed with BIS and BIS stakeholders and checked and refined following discussion
Step 2 - Profiling and outputs
•Segments profiled against behaviour, decision styles (described in more detail in section XX) and demograpics •Segments added to cross- tabulations

Consumer Empowerment survey report 70
At the questionnaire design stage, a number of questions were identified which had the potential to produce a meaningful segmentation to answer the key objectives. These were discussed and agreed with the team at BIS, and the list of segmentation inputs was refined and expanded following initial analysis of the survey data and iterative runs of the segmentation. The final list of segmentation inputs is appended (see section 12.6.1).
Segmentation inputs were refined using techniques called factor analysis before being entered into the segmentation programme. A number of segmentation solutions were derived using K-means methods, which attempt to minimise the differences within each of the segments and maximise the differences between them. Solutions were profiled and discussed with BIS before deciding on the preferred solution.
12.5.2 Identifying how consumers choose providers – MaxDiff Statistical Approach
One of the key challenges of the survey was to find how, ultimately, people choose a new supplier. In the past, when measured using traditional rating scales, there has been a tendency for people to perceive themselves as rational consumers who assess all the options available to them. In order to lessen this risk, a trade-off statistical approach called “MaxDiff” 9 was used for this survey as this has been shown to lead to greater discrimination between items.
Rather than directly asking respondents for a likelihood rating for each item (e.g. likelihood rating, likelihood ranking, or some kind of likelihood points allocation), the MaxDiff technique uses an indirect approach by asking respondents to trade-off items against one another and forcing a preference.
During the interview respondents were shown a screen that displayed 5 out of the 12 decision styles shown in 0.The list of decision styles included were informed by previous developmental research conducted by GfK NOP, which was itself derived from the literature10.
Respondents were asked to imagine they were choosing a new supplier within a given category and were asked to select, from the 5 items shown on screen, which was the one they were most likely to do, and the one they were least likely to do. They then repeated this task 6 times with different combinations of decision styles shown each time.
9 Full name: Maximum Difference Scaling 10 For example Gerd Gigerenzer’s book, ‘Risk Savvy: How To Make Good Decisions’, Allen Lane (17 April 2014), and http://www.ncbi.nlm.nih.gov/pubmed/17531348
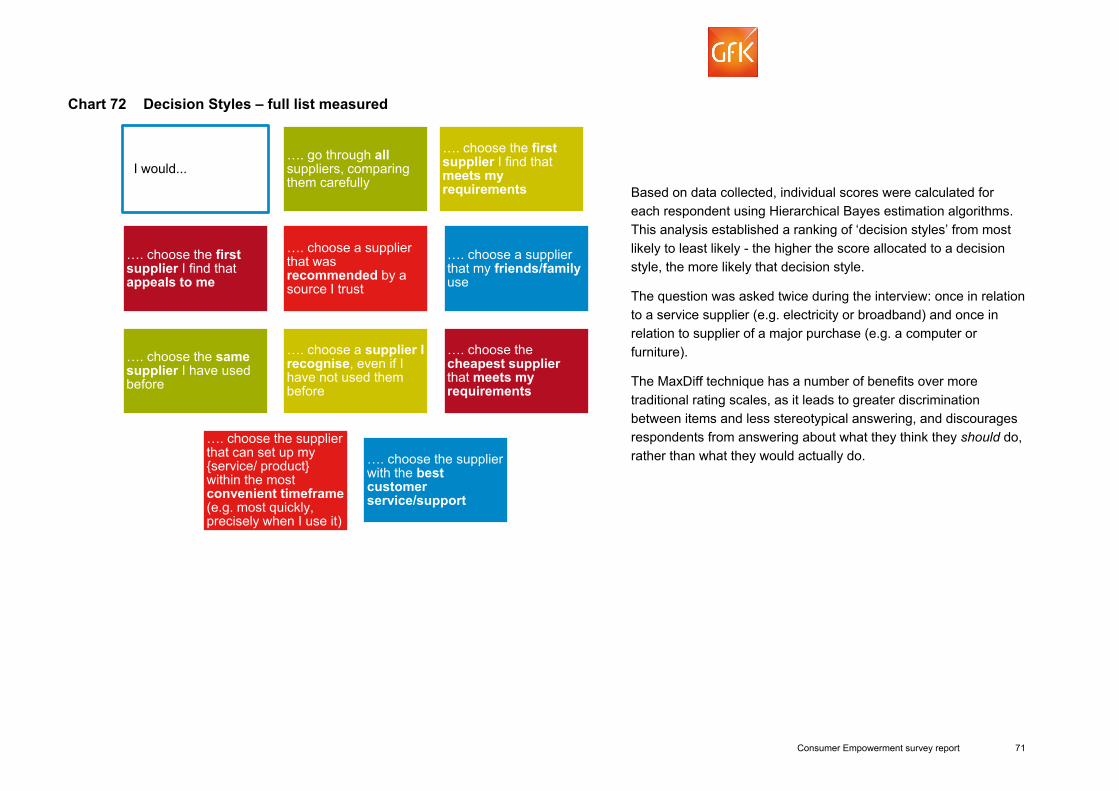
Consumer Empowerment survey report 71
Chart 72 Decision Styles – full list measured
Based on data collected, individual scores were calculated for each respondent using Hierarchical Bayes estimation algorithms. This analysis established a ranking of ‘decision styles’ from most likely to least likely - the higher the score allocated to a decision style, the more likely that decision style.
The question was asked twice during the interview: once in relation to a service supplier (e.g. electricity or broadband) and once in relation to supplier of a major purchase (e.g. a computer or furniture).
The MaxDiff technique has a number of benefits over more traditional rating scales, as it leads to greater discrimination between items and less stereotypical answering, and discourages respondents from answering about what they think they should do, rather than what they would actually do.
I would... …. go through all suppliers, comparing them carefully
…. choose the first supplier I find that meets my requirements
…. choose the first supplier I find that appeals to me
…. choose a supplier that was recommended by a source I trust
…. choose a supplier that my friends/family use
…. choose the same supplier I have used before
…. choose a supplier I recognise, even if I have not used them before
…. choose the cheapest supplier that meets my requirements
…. choose the supplier that can set up my {service/ product} within the most convenient timeframe (e.g. most quickly, precisely when I use it)
…. choose the supplier with the best customer service/support

Consumer Empowerment survey report 72
12.6 Results by segment The tables which follow show responses for key questions broken down by segment to enable comparison of responses across segments
12.6.1 Variables that were used to create segmentation % Strongly agree/agree All Constrained
Strugglers Consciously Unengaged
Worried Indecisives
Traditional Value-seekers
Leading Edgers
(6024) %
(1318) %
(911) %
(1346) %
(1376) %
(1073) %
I generally feel free to express my ideas and opinions 76 26 87 83 84 88
I believe you need to take risks to live a full life 47 19 55 56 45 55
I generally focus on the here and now rather than worrying about the future
41 21 52 48 50 30
There is not enough time to do all the things I would like to do
57 22 55 73 63 62
As soon as I see a problem or challenge, I start looking for possible solutions
71 21 76 81 79 86
I am able to follow through with things once I’ve made up my mind to something
74 16 84 83 86 87
I am uncomfortable making decisions before I know all of my options
46 19 33 59 54 51
I usually try to find a couple of good options and then choose between them
64 21 51 77 78 78
I can’t possibly know everything before making a decision
60 21 71 69 58 75
I usually have a hard time making even simple decisions
12 17 5 24 7 6

Consumer Empowerment survey report 73
% Strongly agree/agree All Constrained Strugglers
Consciously Unengaged
Worried Indecisives
Traditional Value-seekers
Leading Edgers
(6024) %
(1318) %
(911) %
(1346) %
(1376) %
(1073) %
I am usually worried about making a wrong decision
29 21 18 49 29 23
I usually put off making a difficult decision until a deadline
26 22 25 44 20 18
I usually continue to search for an item until it reaches my expectations
55 19 22 70 76 67
When shopping for a major purchase, I don’t mind spending several hours looking for it
56 24 10 70 79 70
I take the time to consider all alternatives before making a decision
59 20 34 72 79 70
When I see something that I want, I always try to find the best deal before purchasing it
62 23 33 72 84 78
I would rather stick with a product that I currently buy than try something I’m not sure of
44 22 64 62 66 1
I am usually among the first to try a new product when it appears on the market
13 13 5 16 7 22
People often ask my opinions about what they should buy or use
31 17 23 34 37 40

Consumer Empowerment survey report 74
% Strongly agree/agree All Constrained Strugglers
Consciously Unengaged
Worried Indecisives
Traditional Value-seekers
Leading Edgers
(6024) %
(1318) %
(911) %
(1346) %
(1376) %
(1073) %
I often communicate to others about the products and services I have bought e.g. posting online or chatting with a friend
43 19 31 50 50 53
When buying goods or services, I tend to trust the experts and accept the advice they give
36 16 43 52 38 26
I’ll do almost anything to avoid a negotiation
18 13 17 47 5 6
I will give in if a negotiation is not going my way
19 10 16 53 2 10
Base: all % Confident that… (Top 2 box)
All Constrained Strugglers
Consciously Unengaged
Worried Indecisives
Traditional Value-seekers
Leading Edgers
(6024) %
(1318) %
(911) %
(1346) %
(1376) %
(1073) %
… you will be able to negotiate the best deal 36 14 33 23 52 50
… consumer law will protect you 32 15 36 32 36 38 … you will understand the terms and conditions attached to that product or service
39 15 41 36 49 50
… you are able to find the best products and services to meet your needs
52 19 55 46 65 67
Making a complaint about a product or service you have purchased
57 22 63 47 71 74
Base: all

Consumer Empowerment survey report 75
12.6.2 Demographics and vulnerability indicators Selected demographic variables not included in the individual segment dashboards which are potential indicators of vulnerability are shown below.
All Constrained Strugglers
Consciously Unengaged
Worried Indecisives
Traditional Value-seekers
Leading Edgers
(6024) %
(1318) %
(911) %
(1346) %
(1376) %
(1073) %
% reporting a limiting long term illness11 16 18 19 13 18 13
% with caring responsibilities (who look after, or give unpaid help or support to others because of ill health or disability or problems related to old age)
14 11 14 14 15 16
Ethnicity White 89 78 93 87 93 92 Non white 10 22 7 12 7 7
% who have difficulty in their daily life
Any of these 4 11 4 6 3 3 Speaking English 2 6 1 2 1 1 Reading English 2 6 2 2 1 1 Working out numbers 2 3 1 3 2 1 None of these 95 89 96 94 96 96 DK/prefer not to say 1 * * * 1 1
% pay for electricity bills by non-standard methods12 (linked to vulnerability)
20 31 19 23 16 15
11 This is defined as a long standing illness, disability or infirmity that limits your normal day to day activities

Consumer Empowerment survey report 76
All Constrained Strugglers
Consciously Unengaged
Worried Indecisives
Traditional Value-seekers
Leading Edgers
% who do NOT have savings equivalent to 3 months’ income
44 56 40 49 38 37
% who would be able to pay £300 unexpected bill…
Would have savings to cover 53 35 58 46 60 63 Would have to think about how would pay 24 36 20 26 22 20
Would not be able to pay at all 11 15 11 13 8 7
Don’t know/prefer not to say 12 13 11 15 10 10 Base: all
12 This includes those who paid for their electricity or gas or both via any of the following methods: pre-payment (keycard or token) meter, frequent cash payment method (more frequent than monthly), fuel direct/direct from benefits)

Consumer Empowerment survey report 77
12.7 Results by market – service suppliers 12.7.1 Decision making styles
This table follows show decision style scores across all segments combined, broken down by the market about which the respondent was asked to answer. Please note that the table shows decision scores relative to each other, rather than proportions of respondents giving individual answers. Because these are propensity scores rather than proportions, significance testing on differences is not possible.
Service supplier
Decision score All Electricity Internet Mobile phone
network Paid for TV Car insurance Bank account
(6024) (1053) (1103) (1041) (821) (994) (1012)
…. go through all suppliers, comparing them carefully 14.0 12.8 15.0 13.2 14.9 16.0 11.9
…. choose the first supplier I find that meets my requirements 9.0 9.3 8.5 9.3 8.8 9.0 9.2
…. choose the first supplier I find that appeals to me 4.8 5.0 4.4 4.8 4.7 4.5 5.2
…. choose a supplier that was recommended by a source I trust 11.3 10.7 12.2 10.9 11.5 10.1 12.4
…. choose a supplier that my friends/family use 8.6 8.2 8.8 9.1 8.8 6.3 10.2 …. choose the same supplier I have used
before 12.9 13.4 11.7 13.7 12.2 11.7 14.6
…. choose a supplier I recognise, even if I have not used them before 5.0 5.3 4.7 4.9 5.1 4.5 5.5
…. choose the cheapest supplier that meets my requirements 15.7 16.9 15.3 16.2 14.1 19.8 11.3
…. choose the supplier that can set up my {service/ product} within the most convenient timeframe (e.g. most quickly, precisely when I use it)
6.8 6.5 7.1 6.2 7.5 6.4 7.0
…. choose the supplier with the best customer service/support 12.1 11.9 12.4 11.7 12.4 11.7 12.7
Base: All those who answered the MaxDiff question

Consumer Empowerment survey report 78
12.7.2 Decision making styles – Maximising scores broken down by market and demographics The table below shows the decision scores for maximising (going through all suppliers, comparing them carefully), broken down by demographics within market. The table shows decision scores relative to each other, rather than proportions of respondents giving individual answers, and because these are propensity scores rather than proportions, significance testing of differences is not possible.
Service supplier Decision score All Electricity Internet Mobile phone
network Paid for TV Car insurance Bank account
(6024) (994) (1026) (961) (754) (925) (932) Age
16-34 14.7 15.4 15.2 13.8 14.2 18.0 12.6 35-54 15.7 15.4 16.0 14.4 16.9 18.1 12.6 55+ 11.8 9.8 13.7 10.8 13.2 13.1 10.7
Gender Male 14.5 13.1 15.6 13.4 15.7 16.4 11.8 Female 13.5 12.5 14.5 13.1 14.1 15.5 11.9
Social grade AB 15.7 14.5 14.5 15.7 17.9 17.2 13.5 C1 14.9 13.9 16.9 13.9 15.0 15.9 13.3 C2 14.1 14.2 14.7 13.6 14.8 15.7 11.2 DE 11.7 10.7 13.6 10.4 12.3 14.8 9.8
Tenure Owned outright 13.0 10.7 15.0 12.1 14.3 13.7 12.1 Mortgage 16.5 18.2 15.8 16.6 17.0 18.8 12.9 Rented privately 14.0 14.1 14.2 12.4 15.2 17.7 12.1 Rented from LA/HA 12.4 10.7 15.1 11.5 12.7 15.3 10.2
Weight of internet use 0-10 hours per week 12.2 11.1 13.0 11.7 12.4 14.4 10.9 11+ hours per week 16.6 17.2 17.2 15.0 18.4 18.4 13.6
Base: All those who answered the MaxDiff question

Consumer Empowerment survey report 79
12.7.3 Reasons why not checked to see whether on best deal
All who did not check to see whether they were on the best deal
with their supplier
Electricity Internet Mobile phone network
Paid for TV
Car insurance
Bank account
(2544) %
(533) %
(418) %
(431) %
(344) %
(256) %
(562) %
Already satisfied with supplier 51 45 42 49 52 63 58
Satisfied with the product 30 25 26 29 29 33 37 Satisfied with the customer services 21 17 14 16 22 27 30 Satisfied with the cost 11 10 11 13 14 18 4
Takes too much time/ hassle/complex to switch 19 20 19 21 20 18 16 Takes too long to research 6 9 5 6 9 7 5 Takes too long to go through the process of switching 6 6 6 7 5 4 7 Too much hassle to research new deals 6 9 7 6 5 7 5 Too much hassle to go through the process of switching 6 6 8 5 6 5 6
Makes no difference 16 19 17 16 13 9 19 No difference in the deals offered 6 6 6 5 4 2 10 No difference in price 7 10 7 6 4 4 8 No difference in customer service provided 5 4 7 5 4 4 7
Other reasons Prefer to stick with what you know – even if not best deal 42 39 38 37 47 40 50 You are not guaranteed a better discount 16 17 15 16 15 18 16 Do not trust other suppliers / catch with the a new deal 12 16 13 10 11 8 10

Consumer Empowerment survey report 80
All who did not check to see whether they were on the best deal
with their supplier
Electricity Internet Mobile phone network
Paid for TV
Car insurance
Bank account
So many choices - hard to know where to start 12 15 13 14 11 12 9 Worried that will make wrong choice if change 8 10 8 8 8 6 9 Not aware you could get a new/better deal 7 9 7 5 7 5 8 Base: All who did not check to see whether they were on the best deal with their supplier; responses under 5% not shown Significantly higher/lower than average
12.7.4 Sources of information/advice used to find out about suppliers
All who checked they were on the
best deal Electricity Internet
Mobile phone
network Paid for
TV Car
insurance Bank
account
(2414) %
(364) %
(504) %
(418) %
(310) %
(600) %
(218) %
The website of your current supplier 37 29 40 47 39 32 25 Price comparison websites (e.g. USwitch, Go compare) 35 36 26 24 24 60 23
The websites of other suppliers 32 21 34 38 35 34 25 Contacted a supplier myself by phone/email/letter 18 20 21 12 24 18 7 Talked with / sought advice from friends / family / colleagues 15 11 21 19 19 10 13
Visited the shop / stall / broker you bought it from 8 2 3 23 5 3 21 Advertisements (online, print, TV, radio) 8 6 11 6 14 5 6 Other internet sites 8 7 9 7 10 6 9 Other review/advice sites 7 4 12 8 6 5 8

Consumer Empowerment survey report 81
All who checked they were on the
best deal Electricity Internet
Mobile phone
network Paid for
TV Car
insurance Bank
account Discussed with a specialist advisor 6 7 5 5 8 4 8 Read newspaper/magazine articles 5 6 4 3 4 3 11 Social media sites (e.g. Facebook, twitter) 3 3 3 5 3 2 3 Base: All who checked they were on the best deal ; responses under 5% not shown Significantly higher/lower than average
12.7.5 Whether negotiated on price or on the features that were included in the deal/tariff/contract
All who checked
they were on the best
deal Electricity Internet
Mobile phone
network Paid for
TV Car
insurance Bank
account
(2414) %
(364) %
(504) %
(418) %
(310) %
(600) %
(218) %
Successfully negotiated price/deal 47 33 53 46 56 53 22 Negotiated but was unsuccessful 5 5 4 8 5 5 7 Did not negotiate 35 45 32 34 28 31 48 Not applicable – not possible to negotiate 11 14 8 10 8 10 20 Base: All who had checked to see whether they were on the best deal with their supplier; figures may not add up 100% as ‘don’t know’ responses have been excluded Significantly higher/lower than average

Consumer Empowerment survey report 82
12.8 Results by market – major purchase The tables which follow show decision style scores across all segments combined, broken down by the market about which the respondent was asked to answer. Please note that the table shows decision scores relative to each other, rather than proportions of respondents giving individual answers. Because these are propensity scores rather than proportions, significance testing on differences is not possible.
12.8.1 Decision making styles Major purchase supplier
All
People doing work at your
home
Furniture, home
furnishings or building
materials Computers
Home electronics or
electrical
Car, van, motorbike or
bicycle Holiday (6024) (846) (1079) (987) (1203) (894) (1015)
…. go through all suppliers, comparing them carefully 12.4 8.9 13.0 13.9 12.9 12.4 12.8
…. choose the first supplier I find that meets my requirements 9.4 7.7 10.2 9.7 9.3 10.1 9.3
…. choose the first supplier I find that appeals to me 5.1 4.1 5.6 5.1 5.0 5.9 5.0
…. choose a supplier that was recommended by a source I trust 12.0 15.6 11.1 12.4 11.5 12.0 10.0
…. choose a supplier that my friends/family use 9.3 12.7 8.3 9.1 8.4 9.4 8.3 …. choose the same supplier I have used
before 16.2 19.5 15.8 15.2 15.9 15.3 16.0
…. choose a supplier I recognise, even if I have not used them before 6.1 5.9 6.4 6.2 6.0 6.4 5.8
…. choose the supplier with the cheapest products/offering 9.2 5.5 8.3 8.1 10.2 8.6 13.5
…. choose the supplier that can set up my {service/ product} within the most convenient timeframe (e.g. most quickly, precisely when I use it)
7.7 7.5 8.4 6.9 8.0 6.6 8.7
…. choose the supplier with the best customer service/support 12.6 12.5 12.9 13.4 12.9 13.3 10.7
Base: All those who answered the MaxDiff question

Consumer Empowerment survey report 83
12.8.2 Number of major purchase supplier considered Major purchase supplier
All who have made a
purchase worth £100 or over in the last 2 years
People doing work at your
home
Furniture, home furnishings or
building materials Computers
Home electronics or
electrical
Car, van, motorbike or
bicycle Holiday
(4204) %
(657) %
(728) %
(657) %
(880) %
(586) %
(696) %
1 27 30 20 25 29 30 26 2 – 3 40 51 41 37 37 32 42 4+ 32 18 38 36 34 37 28 Base: all who have made a purchase worth £100 or over in the last 2 years; figures may not add up 100% as ‘don’t know’ responses have been excluded Significantly higher/lower than average

Consumer Empowerment survey report 84
12.8.3 Sources of information/advice used to find out about suppliers
All who have
made a purchase worth £100 or
over in the last 2 years
People doing work at your
home
Furniture, home
furnishings or building materials Computers
Home electronics
or electrical
Car, van, motorbike or bicycle Holiday
(4204) %
(657) %
(728) %
(657) %
(880) %
(586) %
(696) %
The website of the supplier you went with 44 22 48 55 44 41 56 The websites of other suppliers 36 20 36 44 39 34 41 Visited the shop /store / agency you bought it from 33 12 46 36 47 35 20 Talked with / sought advice from friends / family / colleagues 21 41 13 24 15 21 13
Visited other shops / stores / agencies 17 6 29 18 24 16 8 Price comparison websites 16 9 14 21 16 13 23 Contacted a supplier myself by phone/email/letter 12 28 9 8 6 14 11 Other review sites 10 8 10 14 10 8 10 Advertisements (online, print, TV, radio) 8 7 11 8 9 9 5 Manufacturer websites 8 5 9 13 8 8 2 Read newspaper/magazine articles 6 7 5 6 7 8 5 Social media sites (e.g. Facebook, twitter) 5 5 5 7 3 5 3 Base: All who checked they were on the best deal ; responses under 5% not shown Significantly higher/lower than average

Consumer Empowerment survey report 85
12.8.4 Whether negotiated on price or what was included in the price
All who have made a
purchase worth £100
or over in the last 2 years
People doing work at your
home
Furniture, home
furnishings or building materials Computers
Home electronics or
electrical
Car, van, motorbike or
bicycle Holiday
(4204) %
(657) %
(728) %
(657) %
(880) %
(586) %
(696) %
Successfully negotiated price/deal 34 46 33 24 23 64 23 Negotiated but was unsuccessful 6 8 6 6 5 5 3 Did not negotiate 43 38 46 51 52 23 45 Not applicable – not possible to negotiate 15 7 14 16 18 7 25 Base: All who had checked to see whether they were on the best deal with their supplier; figures may not add up 100% as ‘don’t know’ responses have been excluded Significantly higher/lower than average
12.8.5 Views on outcome
All who have made a
purchase worth £100
or over in the last 2 years
People doing work at your
home
Furniture, home
furnishings or building materials Computers
Home electronics or
electrical
Car, van, motorbike or
bicycle Holiday
% Strongly agree or agree… (4204) %
(657) %
(728) %
(657) %
(880) %
(586) %
(696) %
If I was making the decision again, I would use the same supplier 61 71 56 56 62 58 59
I think I got/could have gotten a lower price by shopping around 40 31 42 42 45 39 41
I think I got/could have gotten a better quality of service by shopping around 34 33 37 35 34 32 32
Base: All who had checked to see whether they were on the best deal with their supplier; figures may not add up 100% as ‘don’t know’ responses have been excluded Significantly higher/lower than average

Consumer Empowerment survey report 86
12.8.6 Views on amount of information available and time spent shopping
All who have made a
purchase worth £100 or over in the last
2 years
People doing work at your
home
Furniture, home
furnishings or building
materials Computers
Home electronics or
electrical
Car, van, motorbike or
bicycle Holiday (4204)
% (657)
% (728)
% (657)
% (880)
% (586)
% (696)
% Views on amount of information when making purchase: …wish I had more (scored 7-5) 8 9 7 7 8 10 6 …about the right amount (4) 80 82 79 76 80 79 84 …feel I had too much information (scored 1-3)
11 8 14 15 12 10 7
Views on amount of time spent making decision when making purchase: …wish I had spent more time making my decision (scored 7-5) 8 8 7 8 8 9 7
… About the right amount (4) 78 78 79 75 78 81 76 … spent too much time making my decision (scored 1-3)
13 12 14 16 14 10 14
Base: All who have made a purchase worth £100+ in the last 2 years; figures may not add up 100% as ‘don’t know’ responses have been excluded Significantly higher/lower than average

Consumer Empowerment survey report 87
12.9 Potential biases Many of the results in this report are based on questions which were asked in relation to a range of suppliers (of services or of major purchases). For ease of analysis, clarity and to enable us to look at responses by segment and within demographic group, when describing segments we have combined the markets. For example, the survey included a question about whether the respondent had checked to see whether they were on the best deal in the last two years in relation to a specific service market (Electricity, Internet, Mobile phone network, Paid for TV, Car insurance, current account) - and responses from all markets have been combined to create an overall proportion of adults (or within each segment/demographic group) who have checked.
In order to ensure that respondents were answering questions about a market that was relevant to them, they were allocated a market about which to answer based on their experience and decision making responsibility. If they were eligible to answer about more than one market, there were allocated to one relevant market at random.
We know that responses to questions about decision styles and customer journey varied from market to market. However, the fact that some segments or demographic groups were more likely than others to answer about specific markets might introduce bias which should be borne in mind in interpreting results. For example, respondents were much more likely to say they have checked whether they were on the best deal in the past 2 years when answering about car insurance suppliers compared with electricity suppliers (70% v 42%). The task, therefore, is to understand whether any trends in response by segment are because of differences in the markets segments are answering about, as opposed to being specifically about characteristics of the segment itself.
There was some variation by segment with regards to market about which questions were asked to answer questions. All segments were represented in each category. While there was variation by segment, in general the proportions tended to be within two or three percentage points of the average, with the following notable exceptions (also shown in bold in the table). In relation to suppliers of services:
• Constrained Strugglers were more likely than other segments to be asked about suppliers of electricity and mobile phones, and less likely to be asked about car insurance
• Consciously Unengaged were more likely to be asked about current accounts • Leading Edgers were more likely to be asked about car insurance and less likely to be asked about electricity suppliers There were fewer differences when looking at which segment was asked about which market for major purchases, with the following exceptions: • Constrained Strugglers were less likely than other segments to have been asked about holidays • The Consciously Unengaged were more likely than other segments to have been asked about home electronics or electrical

Consumer Empowerment survey report 88
All Constrained Strugglers
Consciously Unengaged
Worried Indecisives
Traditional Value-seekers
Leading Edgers
(6024) %
(1318) %
(911) %
(1346) %
(1376) %
(1073) %
Service supplier Electricity 15 19 18 16 14 11 Internet/broadband 19 20 16 19 19 20 Mobile phone network 18 21 16 17 16 19 Paid for TV 14 12 13 16 14 15 Car insurance 18 13 17 18 19 21 Current account 16 15 21 15 17 14
Major purchase People doing work at your home 15 14 13 14 16 17 Furniture, home furnishings, building materials
17 19 17 18 16 16
Computers 16 18 15 16 16 16 Home electronics/electrical 19 19 22 19 18 18 Car, van, motorbike, bicycle 15 17 16 14 15 15 Holiday 18 13 17 20 19 18
Base: all
While biases were few, we looked to see whether these impacted on the behaviours reported by each segment. Below we tabulate the proportions asked about each market who said:
• They had checked whether they were on the best deal (for service suppliers) • They had looked at 4 or more suppliers (for major purchases)
In general, patterns of response reflected our understanding of the each segment’s attitudes and confidence and we do not feel that any differences between markets investigated have unduly biased our understanding of the segments. For most markets, the Leading Edgers were the most likely to have taken action (e.g. checked they were on the best deal), followed by the Traditional Value-seekers and Worried Indecisives, and with the Consciously Unengaged and Constrained Strugglers least likely.
The differentials between segments did vary slightly from market to market, but the ranking was generally the same, for example:

Consumer Empowerment survey report 89
• The proportion of Traditional Value-seekers who had checked whether they were on the best deal was very similar to the Leading Edgers in the internet/broadband, paid for TV, car insurance and current account markets, but they were more similar to the Worried Indecisives when answering about electricity and mobile phone network providers.
• The Worried Indecisives tended to sit at around the average for all markets with the exception of current account, for which they were the lowest • The proportion of the Consciously Unengaged who had checked whether they were on the best deal were similar to the Constrained Strugglers for the
electricity, paid for TV, mobile phone network and current account markets, but they were closer to the Worried Indecisives when answering about internet/broadband and car insurance
When answering about major purchases, patterns were again consistent with the segment profiles, but the following were noted: • The proportions of Leading Edgers looking at 4+ suppliers was the highest of all segments for all markets, and in particular for computers and home
electronics/electrical • Traditional Value-seekers’ responses were similar to those from Leading Edgers for all markets except computers and home electronics/electrical – but this was
because the proportions of Leading Edgers were particularly high, rather than the Traditional Value-seekers being particularly low • The Worried Indecisives tended to sit at around the average level • The proportions of the Consciously Unengaged who had looked at 4+ suppliers tended to be similar to the Constrained Strugglers and lower than other
segments with the exceptions of: • People doing work at your home and home electronics/electrical– where the Constrained Strugglers were particularly low • Car, van, motorbike or bicycle – where the Constrained Strugglers were particularly high • Holiday – where the Consciously Unengaged were the lowest of all segments by far
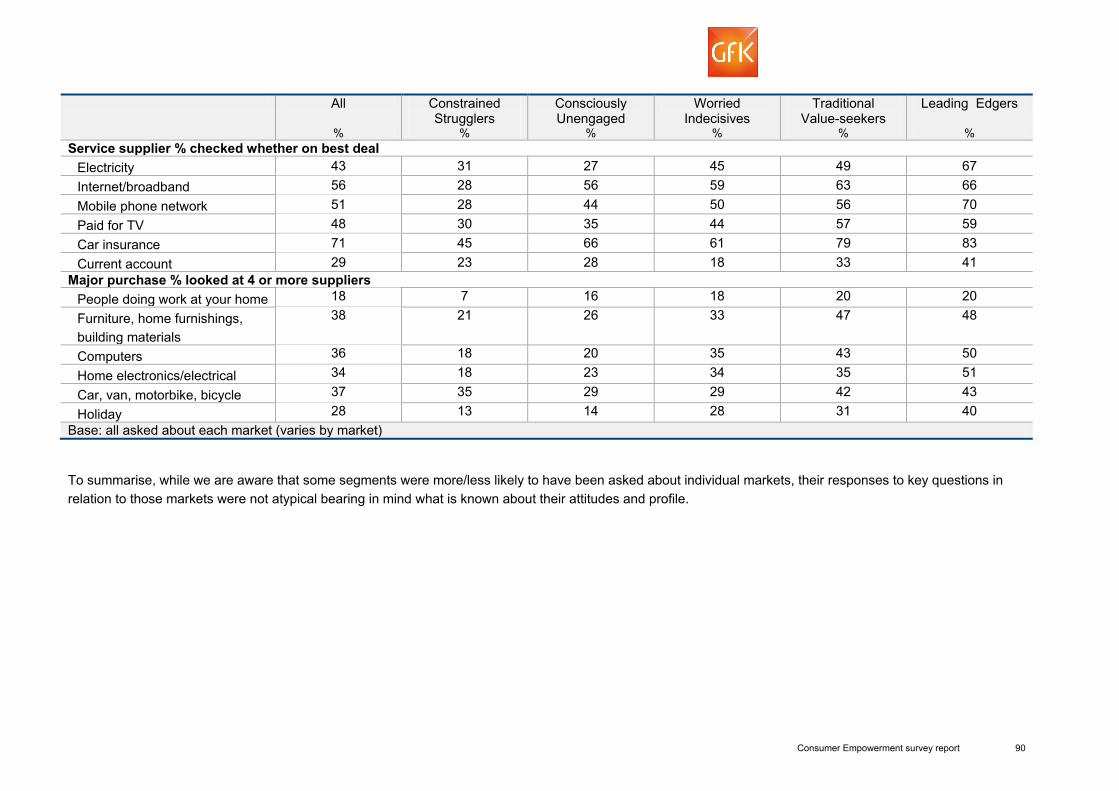
Consumer Empowerment survey report 90
All Constrained Strugglers
Consciously Unengaged
Worried Indecisives
Traditional Value-seekers
Leading Edgers
% % % % % % Service supplier % checked whether on best deal
Electricity 43 31 27 45 49 67 Internet/broadband 56 28 56 59 63 66 Mobile phone network 51 28 44 50 56 70 Paid for TV 48 30 35 44 57 59 Car insurance 71 45 66 61 79 83 Current account 29 23 28 18 33 41
Major purchase % looked at 4 or more suppliers People doing work at your home 18 7 16 18 20 20
Furniture, home furnishings, building materials
38 21 26 33 47 48
Computers 36 18 20 35 43 50
Home electronics/electrical 34 18 23 34 35 51
Car, van, motorbike, bicycle 37 35 29 29 42 43
Holiday 28 13 14 28 31 40 Base: all asked about each market (varies by market)
To summarise, while we are aware that some segments were more/less likely to have been asked about individual markets, their responses to key questions in relation to those markets were not atypical bearing in mind what is known about their attitudes and profile.

Consumer Empowerment survey report 91
© Crown copyright 2015
This publication is licensed under the terms of the Open Government Licence v3.0 except where otherwise stated. To view this licence, visit nationalarchives.gov.uk/doc/open-government-licence/version/3 or write to the Information Policy Team, The National Archives, Kew, London TW9 4DU, or email: [email protected].
Where we have identified any third party copyright information you will need to obtain permission from the copyright holders concerned.
This publication available from www.gov.uk/bis
Contacts us if you have any enquiries about this publication, including requests for alternative formats, at: Department for Business, Innovation and Skills 1 Victoria Street London SW1H 0ET Tel: 020 7215 5000 Email: [email protected] BIS/15/208