Consumer preference and perceptions of wine can vary on many factors including varietal, sweetness, and place of origin. Extrinsic cues are elements of quality associated with a product that are external to the product itself such as store image and country-of-origin (Bruwer & Buller, 2003)
Consumers and Wine• France
Presenter
Presentation Notes
For wine production, research has showed that France has the strongest country-of-origin extrinsic cues of quality. With such strong association between country-of-origin and quality, consumers in new wine markets like Asia tend to prefer wine from established originations like France and Italy, even over others who may produce a comparable quality wine (Bruwer & Buller, 2003). This is due to the long history and production consistency of wines produced in these regions.
Texas Wine• Currently, according to the latest statistic, Texas is ranked 5th highest
in number of wineries and in wine production (winesandvines.com).
Presenter
Presentation Notes
In large part, Texas growing success is due to the geography and climate of the land. The soil of Texas tends to be minerally rich, especially against certain geographical terrains like rivers and streams which provided an early natural base for Spanish missionaries in wine production during the 17th century (Long, Ting, & Mathe-Soulek, in press). After a few wineries survived through prohibition (Long et al., in press), today, the Texas wine industry is expanding and contributed nearly $2 billion to the Texas economy through means of employment, tourism and taxes paid (Texas Wine and Grape Growers Association, 2016).
Texas Wine
5%
Texas Wine• Texas wine producers rely heavily on the local market for purchase of wine.
• In large part this is due to consumer ethnocentrism and identification (Johnston, 2016).
• Local identity
Presenter
Presentation Notes
A global identity is a feeling of belonging and collectiveness with others worldwide whereas a local identity is one in which an individual immerses in a local communities customs, norms and other elements unique to a community (Johnston, 2016).
Texas Wine
Presenter
Presentation Notes
. Under the GO TEXAN marketing campaign, Texas wine producers can use consumers’ ethnocentrism to sell products instead of selling the perceived quality of the wine, which is not a typical external cue associated with Texas wine.
Texas wine
Ethnocentrism
Presenter
Presentation Notes
Ethnocentrism is the practice of comparison of others to one’s own culture; such that one believes his or her culture is superior to others (Heydari, Teymoori, Haghish & Mohamadi, 2014; Johnson 2016). For Texas and its residents, the level of ethnocentrism is higher than most, and outsiders view Texans as having large egos and an old west way of life (Schneider, 2007). Johnston, Phelan & Velikova (2015) concur with this notion suggesting that Texans show strong state pride, admiration for living in the state, and preference for state produced products.
Texas Wine
Presenter
Presentation Notes
. Under the GO TEXAN marketing campaign, Texas wine producers can use consumers’ ethnocentrism to sell products instead of selling the perceived quality of the wine, which is not a typical external cue associated with Texas wine.
Texans’ preference for wine 2006
27.10%
48.20%
15.50%
3.20%6.00%
Wine origin preference
Other California Texas France Italy
Presenter
Presentation Notes
. Under the GO TEXAN marketing campaign, Texas wine producers can use consumers’ ethnocentrism to sell products instead of selling the perceived quality of the wine, which is not a typical external cue associated with Texas wine. However, despite the overall preference for New World, and more specifically American produced wine, Texans rated the quality of Californian, French, Italian and Australian wine over their own locally produced wine (Barber et al., 2007).
Purpose of the Study• Examine how consumers have evolved since 2006• Examine how consumer perceptions of Texas wine has evolved since
2006• Examine preferences and other wine trends since 2006
Methodology• The survey instrument in 2016 was based on the prior data collection
in 2006 (see Barber et al., 2007).
• Each of the data collections had 31 common questions that were administered in each time period. The questions were divided into sections including:
• consumer consumption, • knowledge, • preferences for Texas wine, • and demographics.
Presenter
Presentation Notes
The first section of the survey asked questions about frequency of consumption, preference for type of wine (red, blush/rose, or white), style of wine (sweet or dry), willingness to pay, and where consumers purchase wine. The second section of the survey focused specifically on Texas wine and consumers were asked questions about awareness, value, quality, price, supply, expectation, and image. Additionally, future purchase intent and likelihood to recommend were measured to assess potential future purchase implications. All perception and future based questions were measured on a 5-point scale with 1=strongly disagree, 5=strongly agree, or 1= very unlikely, 5= very likely, depending on the nature of the question. The first section of the survey asked questions about frequency of consumption, preference for type of wine (red, blush/rose, or white), style of wine (sweet or dry), willingness to pay, and where consumers purchase wine. The second section of the survey focused specifically on Texas wine and consumers were asked questions about awareness, value, quality, price, supply, expectation, and image. Additionally, future purchase intent and likelihood to recommend were measured to assess potential future purchase implications. All perception and future based questions were measured on a 5-point scale with 1=strongly disagree, 5=strongly agree, or 1= very unlikely, 5= very likely, depending on the nature of the question.
Methodology• 2006
• Participants for the survey were recruited and contacted by a third party contractor. The survey was conducted over the phone with an interviewer reading the questions and recording the answers.
• 502 responses from Texans
• 2016• Survey was conducted via online recruitment and survey format. The change
in sampling method was needed as today, few households are available by telephone (Christian, Keeter, Purcell, & Smith, 2010).
• 1263 responses from Texans
Presenter
Presentation Notes
. Exclusion criteria included not being 21 years of age, and not having consumed wine in the past 12 months.
Demographics
2006 2016 Gender Male 33.7% 37.6% Female 66.3% 62.4% Education Some high school or less 2.2% .8%
High school graduate 10.8% 7.3% Vocational/technical 2.6% 3.2% Some college 22.8% 26.8% Undergraduate degree 34.5% 32.0%
Graduate or professional degree 27.1% 29.8% Income Under $20,000 4.4% 5.0%
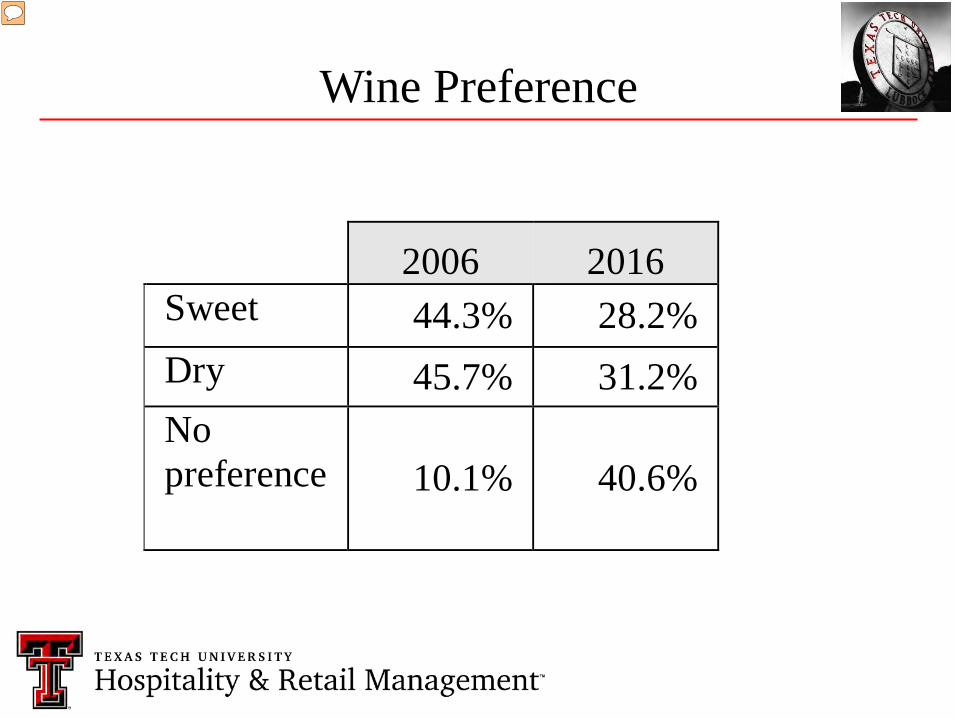
The trend in preference for sweet or dry wine from 2006-2016 shows that consumers now are more open to both sweet or dry wines, and have significantly less preference towards one or the other than in 2006 (Table 2).
Wine Preference
2006 2016 Red 51.5% 55.2% White 30.6% 30.1% Blush 17.8% 14.8%
Presenter
Presentation Notes
The overall preference for red, white and blush shows a relatively steady preference towards white, red, and blush from 2006-2016 (Table 3).
Wine Preference
2006 2016 Sweet Red 37.9% 74.2%
White 32.0% 22.2% Blush 30.1% 3.7%
Dry Red 65.0% 57.9% White 29.6% 29.2% Blush 5.4% 12.9%
No preference
Red 53.2% 39.9% White 27.7% 36.3% Blush 19.1% 23.8%
Presenter
Presentation Notes
Through a cross tabulation (Table 4) of the two prior questions, those who prefer sweet wine, have shown a strong increase (+36.3%) in preference towards sweet reds, where those who prefer dry wine have seen a 7.5% increase towards blush/rose, with a decrease in dry reds. For those who had no preference for sweet or dry wines, overall have seen an considerable increase in preference in white wine (+8.6%), a decreased preference in red wines (-13.3%) and a mild increase in blush wines (+4.7%)
Wine Consumption/Preference-Texas
67%
48%
28%
0%
10%
20%
30%
40%
50%
60%
70%
80%
Red White Blush/Rose
Which types of Texas wine have you consumed in the past 12 months?
Wine Region Preference
2006 2016 France 3.5% 6.7% Italy 6.5% 11.2% California 52.4% 40.8% Australia 8.9% 3.6% Texas 16.9% 24.2% Other 11.9% 5.6%
Presenter
Presentation Notes
The preference for wine region of origination continues to most favor California, but saw a nearly 12% decline in overall preference for the region from the prior data collection (Table 6). Both France and Italy have saw large increases in preference from 2006 to 2016, while Australian wine declined in preference. Approximately one-quarter of Texans prefer Texas wine in 2016, a 7.3% increase from the prior collection.
Willingness to Pay
Presenter
Presentation Notes
Consumers average price paid at home for a bottle of wine was assessed using an open-ended format where consumers could state the exact amount they typically spend. The average of these results by year showed that there was a significant increase to $20 a bottle from the $14-$15 range in 2006 (Figure 1).
Table 8 shows the evaluations of Texas wine consumers, and Texas wine perceptions from 2006-2016. The Texas wine consumer appears to find wine more important and significant part of their lives. Moreover, the Texas wine consumers’ subjective knowledge has significantly increased over the two time periods. The subjective measures of knowledge were measured on a (1=very little knowledge, to 5=very much knowledge).
Consumer attitude and beliefs(general)
Questions intended to determine respondents knowledge
Percentage of Correct Answers
(2006)
Percentage of Correct Answers
(2012)
Difference between 2016 and
2006
Which wine should be served at room temperature?
77.5% 70.9% -6.6%
Chardonnay is what type of wine?
73.7% 72.1% -1.6%
Port is usually served with what type of food?
48.2% 55.3% 7.1%
Table wines have an alcohol content of?
42.6% 50.2% 7.6%
Presenter
Presentation Notes
While the subjective measures of wine increased in each of the categories, the objective measures of knowledge (Table 9), did not. Four questions were used to assess the consumers’ basic knowledge of wine. Two of the questions saw a decrease in percentage that answered correctly, and two questions saw an increase of questions answered correctly from 2006 to 2016.
Consumers were asked a series of questions about their opinion of Texas wine. In each category there were statistically significant increases in these perceptions. Of particular note is the increase in recognition of Texas wine which increased on average of .84 (on a 5 point scale) from 2006 to 2016. Also, the likelihood to recommend Texas wine increased nearly a full point, suggesting that Texans are likely to recommend Texas wine to others. The perceptions of the availability of Texas wine only slightly increased (+.16).
Texas Wine Advertising
Presenter
Presentation Notes
Proportional percentage of people who had or had not seen wine advertising
Texas Wine Advertising
Presenter
Presentation Notes
Proportional percentage of people who had or had not seen wine advertising
Summary / Conclusion• Evolutionary and dynamic• Most consumers started to drink wine several times a week,
compared to once a week in 2006. • Consumers began to place a greater value in terms of importance
and significance of wine in their lives• Subjective knowledge increased with 2016 having a greater tendency
for consumers to know “much” about wine whereas in 2006 consumers were more prone to know “a little” about wine.
Summary / Conclusion• Results also showed that overtime consumers showed less
preference towards one wine specifically, and are more open to both sweet and dry wine.
• Overall, from 2006 to 2016 the preference for white, red and blush remained relatively stable. When considering the preferences for sweet vs. dry wine (or those with no preference) those who preferred sweet wine, have drastically increased in their preference for sweet red wine, whereas a dramatic drop in the preference for sweet blush wine was apparent.
Presenter
Presentation Notes
For those who had no preference for either sweet or dry wine, in 2016 a relatively equal number of consumers preferred white wine or red wine, which was a drastic difference than 2006 where red wine was the preference.
Summary / Conclusion• The strongest region preference remains with California
• Largest increase was that nearly ¼ of consumers now prefer the Texas wine region, compared to approximately 17% in 2006.
• Likelihood to recommend has doubled• 40% of consumers suggested they would either likely or highly likely
recommend Texas wine to others and 50% were likely or very likely to purchase Texas wine over the next year. In 2016 almost 85% are likely or very likely to purchase Texas wine within the next year and almost 80% are likely to recommend Texas wine.