consumer and market insights: prepared meals … 2 2 this report brings together multiple data...
TRANSCRIPT

1111
Consumer and Market Insights: Prepared Meals Market in Norway
CS1999MFMay 2015

22215/05/2015 25/15/2015 25/15/2015 25/15/2015 2
This report brings together multiple data sources to provide a comprehensive overview of the Prepared Meals sector
in Norway as part of our global coverage of the sector. This report draws on market data, analyzing value and
volume data and category and channel distribution breakdown, also highlighting which categories are witnessing the
biggest growth. Brand and Private Label analysis is also provided. It contains top line foodservice transaction figures
highlighting where the most opportunistic channels are for industry players in the country. Detailed packaging
analysis is also provided, analyzing category trends and also packaging material and type.
Market data coverage: The overall market value and volume data included in the report is for the period 2014-
2019.
Category coverage: This report provides information on three categories including Meal Kits, Pizza and Ready
Meals.
More extensive brand coverage: The report provides more extensive brand share coverage. Brand share data is
also validated by inputs from industry experts.
Distribution channel: The Distribution data included in the report covers 11 distribution channels including Cash &
Carries & Warehouse Clubs, “Dollar Stores”, Variety Stores & General Merchandise Retailers, Hypermarkets &
Supermarkets, Convenience Stores
Time period: The report provides overall market value and volume data, including category level data for the period
2009-2019. Distribution channel and brand share data is included for the year 2014.
Report scope

333
Table of Contents
• Country Context
• Market Overview
• Retail Landscape and Key Distribution Channels
• Packaging
• Brand and Private Label Share
• Appendix

444
Economic recovery and low inflation rate are likely to drive consumer spending in Norway
The GDP per capita growth rate though declined during
2011-2013, recorded a growth of 2.7% during 2013-
2014 and totaled NOK612,814.6 in 2014.
Pre-Mid-Lifers and Mid Lifers constitute 40.0% of the
population in Norway.
Consumer prices rose by 9.0% between 2009-2014 to
reach 109.0 basis points in 2014.
The population growth in Norway declined marginally by
0.2% in 2014 and stood at 5.1 million.
Norway is one of the fastest growing economies in Europe. Its large working population with higher disposable
income is driving demand for premium products in the consumer retail goods sector.
GDP Per Capita Population
Consumer Price Index Age Profile
-10%
-8%
-6%
-4%
-2%
0%
2%
4%
6%
8%
0
100,000
200,000
300,000
400,000
500,000
600,000
700,000
2009 2010 2011 2012 2013 2014
GD
P P
er
Cap
ita (
NO
K)
Annual g
row
th (
%)
100
104
108
112
2009 2010 2011 2012 2013 2014
Co
nsu
me
r P
rice
Ind
ex
0 - 9
10 - 19
20 - 29
30 - 39
40 - 49
50 - 59
60 - 69
70 - 79
80+
1.0%
1.2%
1.4%
0
1
2
3
4
5
6
2009 2010 2011 2012 2013 2014
Ann
ual G
row
th (
%)
Po
pul
atio
n (M
illio
n)

555
The retail and foodservice markets in Norway: an overview
Foodservice
This slide provides an overview of the retail and foodservice markets in Norway, in which industry players
in the Prepared Meals sector operate:
Profit Sector
Total number of transactions in the profit
sector, 2014: 253.8 million
Largest channel in the profit sector and
transactions, 2014: Restaurants, 144.1
million
Cost Sector
Total number of transactions in the cost
sector, 2014: 185.6 million
Largest channel in the cost sector and
transactions, 2014: Education, 79.9
million
Retail
Country indicator Units Value
Total value of Food market,
2014
US$
millions 17,677.5
Total volume of Food
market, 2014
Millions of
Kg 1,640.6
Total Food volume growth
2009-2014CAGR 1.2%
Proportion of Prepared
Meals as part of overall food
volume, 2014
% 2.0%
Biggest category within the
Prepared Meals market as
part of overall volume, 2014
%
Ready
Meals ,
39.7%
Private label penetration in
Prepared Meals market,
2014
% 5.2%
Figures for overall food 2014 are forecasts.

666
Table of Contents
• Country Context
• Market Overview
• Retail Landscape and Key Distribution Channels
• Packaging
• Brand and Private Label Share
• Appendix

777
Norway’s Prepared Meals market is forecast to register slow growth in value terms during 2014-2019
Market value of Norway’s Prepared Meals
market, 2009-2019
Market volume of Norway’s Prepared Meals
market, (Millions of Kg), 2009-2019
CAGR 2009-2014 1.4%
CAGR 2014-2019 1.6%
•The Prepared Meals market in Norway registered high growth in value terms during 2009-2014. It grew at a
CAGR of 2.0% in local currency terms during 2009-2014 and is forecast to grow at a slightly higher CAGR of
2.4% during 2014-2019.
•The volume consumption of Prepared Meals grew at a high CAGR of 1.4% during 2009-2014 and is forecast to
register growth at a CAGR of 1.6% during 2014-2019.
NOK million US$ million
2009 3,410.1 542.3
2014 3,757.6 597.8
2019 4,234.8 598.0
CAGR 2009-
20142.0% 2.0%
CAGR 2014-
20192.4% 0.0%
31.3
33.5
36.3
2009 2014 2019

888
The Norwegian Prepared Meals market will witness sluggish growth
Norway has a significant population above 40 years of age, which constitutes busy consumers and people with hectic
schedules. This set of population is expected to keep the momentum in the Prepared Meals market. The Norwegian
Prepared Meals market is forecast to grow at a CAGR of 2.4% from NOK3,757.6 million (US$597.8 million) in 2014
to NOK4,234.8 million (US$598.0 million) in 2019. The growth rate in US$ terms is forecast to decline during 2014-
2019 due to fluctuating exchange rates. The volume consumption is forecast to increase at a CAGR of 1.6% during
2014-2019 from 33.5 Kg million in 2014 to 36.3 Kg million in 2019.
Market value (NOK million and US$ million) and volume growth of Prepared Meals market, 2009-2019
-10%
-5%
0%
5%
10%
15%
2009 2010 2011 2012 2013 2014 2015 2016 2017 2018 2019
Gro
wth
Rate
(%
)
Value (NOK m)
Value (US$ m)
Volume (Kg m)

999
Rising food inflation will strengthen demand for value for money Prepared Meals products
Extent to which consumers are trading up or down in Norway’s Prepared Meals market
Norway’s Prepared Meals market grew by 2.2% in value terms and 1.5% in volume terms, during 2013-2014. The
average prices of Prepared Meals Foods increased by 0.7% while food price inflation stood at 2.4%. This resulted in
consumers trading down by 1.7% as they seek out value for money products in the Prepared Meals market.
2.2%1.5%
0.7%
2.4%-1.7%
0%
2%
4%
6%
Value Change Volume Change Average price Change
Food Price Inflation Trading up or down
2014 A
nnual C
hange %

101010
13.3
10.8
9.4Ready Meals
Pizza
Meal Kits
Ready Meals is the most consumed Prepared Meals category in Norway
Market volume of Norway’s Prepared Meals
market, (Millions of Kg), 2014, by category
The Ready Meals category accounted for 39.7% of
Norway’s Prepared Meals market volume followed by
Pizza with a 32.3% share in 2014.
Ready Meals is forecast to be the fastest growing
category in with a CAGR of 1.8% during 2014-2019
followed by both Pizza and Meal Kits, growing at a
CAGR of 1.5% each.
Market Volume, forecasted Compound Annual
Growth Rate , 2014-2019
Market
Volume
(Kg m) 2014
CAGR
2014-2019
Ready Meals 13.3 1.8%
Pizza 10.8 1.5%
Meal Kits 9.4 1.5%

111111
The Ready Meals category is forecast to register fastest growth in value terms during 2014-2019
Market value of categories in Norway’s Prepared Meals market
The Ready Meals category valued at NOK2,064.1 million (US$328.4 million) accounted for 54.9% of the Prepared
Meals market in 2014. It will also register the fastest CAGR of 2.5% in local currency terms, during 2014-2019 and
will be followed by the Pizza category, which marginally scores over the Meal Kits category, with a CAGR of 2.3%.
0%
1%
2%
3%
0% 1% 2% 3%
2009–2014 Category Value in NOK CAGR (%)
Ready Meals
Pizza
Meal Kits
2014-2
019 C
ate
gory
Valu
e in N
OK
CA
GR
(%
)

12121215/05/2015 125/15/2015 125/15/2015 125/15/2015 12
Frozen Ready Meals is the largest segment in the Ready Meals category
The Ready Meals category is forecast to grow at a CAGR of 2.3% during 2009-2019 from NOK1,866.9 million (US$296.9 million) in
2009 to NOK2,340.4 million (US$330.5 million) in 2019. Frozen Ready Meals with a 58.0% share was the largest segment in the
Ready Meals category in 2014.
Ready Meals – US$ Ready Meals – NOK
Market value of categories in the Prepared Meals market
Pizza – US$ Pizza – NOK
The Pizza category is forecast to grow at a CAGR of 2.1% during 2009-2019 from NOK1,036.6 million (US$164.8 million) in 2009 to
NOK1,278.6 million (US$180.6 million) in 2019. Frozen Pizza with a 63.5% share was the largest segment in the Pizza category in
2014.
0%
2%
4%
0
200
400
600
800
1,000
1,200
1,400
2009 2010 2011 2012 2013 2014 2015 2016 2017 2018 2019
An
nu
al G
row
th (
%)
Va
lue
(N
OK
Mill
ion
)
Value(NOK) Annual Growth (%)
0%
2%
4%
0
500
1,000
1,500
2,000
2,500
2009 2010 2011 2012 2013 2014 2015 2016 2017 2018 2019
An
nu
al G
row
th (
%)
Va
lue
(N
OK
Mill
ion
)
Value(NOK) Annual Growth (%)
-10%
-5%
0%
5%
10%
15%
0
100
200
300
400
2009 2010 2011 2012 2013 2014 2015 2016 2017 2018 2019
An
nu
al G
row
th (
%)
Va
lue
(U
S$ M
illio
n)
Value (US$) Annual Growth (%)
-10%
-5%
0%
5%
10%
15%
0
50
100
150
200
250
2009 2010 2011 2012 2013 2014 2015 2016 2017 2018 2019
An
nu
al G
row
th (
%)
Va
lue
(U
S$ M
illio
n)
Value (US$) Annual Growth (%)

13131315/05/2015 135/15/2015 135/15/2015 135/15/2015 13
Meal Kits is the smallest category in value terms in the Norwegian Prepared Meals market
The Meal Kits category is forecast to grow at a CAGR of 2.0% during 2009-2019 from NOK506.6 million (US$80.6 million) in 2009 to
NOK615.8 million (US$87.0 million) in 2019. Chilled Meal Kits with a 36.5% share was the largest segment in the Meal Kits category in
2014.
Meal Kits – US$ Meal Kits – NOK
Market value of categories in the Prepared Meals market
0%
2%
4%
0
100
200
300
400
500
600
700
2009 2010 2011 2012 2013 2014 2015 2016 2017 2018 2019
An
nu
al G
row
th (
%)
Va
lue
(N
OK
Mill
ion
)
Value(NOK) Annual Growth (%)
-10%
-5%
0%
5%
10%
15%
0
20
40
60
80
100
2009 2010 2011 2012 2013 2014 2015 2016 2017 2018 2019
An
nu
al G
row
th (
%)
Va
lue
(U
S$ M
illio
n)
Value (US$) Annual Growth (%)

141414
The Ready Meals category will gain maximum market share in value terms during 2014-2019
Winners Losers
Ready Meals
The Ready Meals category is forecast to gain market
share, growing from 54.9% in 2014 to 55.3% in 2019.
1
Meal Kits
The Meal Kits category is forecast to lose market
share, declining from 14.7% in 2014 to 14.5% in 2019.
1
Change in market
share, 2014–2019Category
Change in market
share, 2014–2019Category
Pizza
The Pizza category is forecast to lose market
share, declining from 30.4% in 2014 to 30.2% in 2019.
2
0.4% -0.2%
-0.2%
Change in market share (in value terms) in the Prepared Meals market

15151515/05/2015 155/15/2015 155/15/2015 155/15/2015 15
Category level pricing
Average category level prices (NOK) in Norway’s Prepared Meals market, 2014
Category Average Price/ Kg (NOK)
2014
Average Price/Kg (USD)
2014
Ready Meals 155.3 24.7
Pizza 105.4 16.8
Meal Kits 58.9 9.4

16161615/05/2015 165/15/2015 165/15/2015 165/15/2015 16
Chilled Meal Kits is the fastest growing segment in the Prepared Meals market
Category Segment Segment’s Share, 2014 Change 2014/2019
Ready Meals
Frozen Ready Meals 58.0% 0.9%
Chilled Ready Meals 18.5% -1.5%
Dried Ready Meals 13.7% -0.2%
Ambient Ready Meals 9.8% 0.8%
Pizza
Frozen Pizza 63.5% 0.4%
Chilled Pizza 36.5% -0.4%
Meal Kits
Chilled Meal Kits 36.5% 1.2%
Frozen Meal Kits 34.1% -1.3%
Ambient Meal Kits 29.4% 0.0%
Segment’s share of the overall category by value and change in market share in Norway’s Prepared Meals
market, 2014

171717
Table of Contents
• Country Context
• Market Overview
• Retail Landscape and Key Distribution Channels
• Packaging
• Brand and Private Label Share
• Appendix

181818
Profiles of Selected Grocery Retailers
Leading retailers in the Norwegian Food market, 2014
Leading retailers, Norway
Company Name Overview
Coop Marked Coop Marked is a chain of Convenience Stores, managed by Coop Norge
in Norway. It has 384 stores across the country.
ICA GroupICA group operates with ICA Supermarked and Rimi discount stores in
Norway with 75 and 310 stores respectively.
NarvesenNarvesen is the largest convenience stores chain in Norway, with over
370 stores across the country.
SparSpar is a multinational retail chain. It was founded in Netherlands and
has 276 stores in Norway.
7-Eleven 7-Eleven, under parent company Seven & I Holdings Co., has a major
presence in the Norwegian convenience store market with 162 stores.

191919
Leading distribution channels–Overall Food
Prepared Meals as a percentage of overall Food:
Prepared Meals accounted for 3.9% of food retail sales
in Norway in 2013.
Hypermarkets & Supermarkets, the leading distribution
channel in Norway’s food market accounted for 56.8%
of food retail sales in 2013 and was followed by
Convenience Stores with a 19.5% share. Convenience
Stores also registered the fastest growth at a CAGR of
3.3% in local currency terms, during 2010-2013 followed
by Hypermarkets & Supermarkets with a CAGR of
3.1%.
Hypermarkets & Supermarkets is the leading distribution channel in Norway’s Food market
Leading distribution channels in Norway’s Prepared Meals market, 2014
Leading distribution channels – Prepared Meals
The Norwegian Prepared Meals market follows a
similar trend in Distribution sales as that of the overall
Food market. Hypermarkets & Supermarkets, the
leading distribution channel in Norway’s Prepared
Meals market accounted for 67.4% of Prepared Meals
distribution in 2014 and was followed by Convenience
Stores with a 23.2% share. Food & Drinks Specialists
registered the fastest growth at a CAGR of 6.9% in
local currency terms during 2011-2014.
67%23%
7%3%
Hypermarkets & Supermarkets
Convenience Stores
Food & Drinks Specialists
Others
0
2
4
6
8
10
Hypermarkets & Supermarkets
Convenience Stores
Food & Drinks Specialists
Others
Valu
e (
US
$ b
illio
n) 2010
2013

202020
Hypermarkets & Supermarkets, followed by Convenience Stores is the leading distribution channel for Prepared Meals market
Key distribution channels – Ready Meals
Key distribution channels – Meal Kits
Key distribution channels – Pizza
Leading distribution channels by category in the Prepared Meals market, 2014
66%
23%
8% 3%
Hypermarkets & Supermarkets
Convenience Stores
Food & Drinks Specialists
Others
67%
23%
8% 2%
Hypermarkets & Supermarkets
Convenience Stores
Food & Drinks Specialists
Others
68%
24%
6% 2%
Hypermarkets & Supermarkets
Convenience Stores
Food & Drinks Specialists
Others

212121
Table of Contents
• Country Context
• Market Overview
• Retail Landscape and Key Distribution Channels
• Packaging
• Brand and Private Label Share
• Appendix

222222
Rigid Plastics is the most used packaging material in the Prepared Meals market
Tray was the most commonly used container type
accounting for 31.9% of the market share in 2014. It
was followed by Tub with a 31.4% packaging share.
Flexible Packaging was preferred as packaging material
for Meal Kits and Pizza categories, while Rigid Plastics
was mostly used for Ready Meals in 2014.
Tray was preferred for the packaging of Ready Meals in
2014.
Key Packaging Materials Key Packaging Materials by category
Key Container Types Key Container Types by category
Rigid Plastics was the most used packaging material in
Norway’s Prepared Meals market followed by Flexible
Packaging with a 33.7% share in 2014.
Overview of Norway’s Prepared Meals market by type of packaging in 2014
61.3%
33.7%
5.1%
Rigid Plastics
Flexible Packaging
Rigid Metal5%
5%
87%95%95%
5%7%
Meal Kits Pizza Ready Meals
Rigid Plastics Flexible Packaging Others
5% 5%
44%
46%95%
95%
10%
Meal Kits Pizza Ready Meals
Tray Tub Others
32%
31%
19%
14%3%
Tray
Tub
Film
Bag/Sachet
Others

232323
Foil is the preferred closure type in Norway’s Prepared Meals market
Box outer was used for packaging of 34.6% of Prepared
Meals products in 2014.
Foil closure was used for the packaging of Ready
Meals, while Film was used for the packaging in the
Pizza category.
Box was preferred as packaging outer for Meal Kits and
Pizza categories in 2014.
Key Packaging Closures Key Packaging Closures by category
Key Packaging Outers Key Packaging Outers by category
Overview of Norway’s Prepared Meals market by packaging closures/outers used in 2014
Foil closure was used for packaging of 31.4% of
Prepared Meals products in 2014.
31.4%1 Foil
29.1%2 Film
34.6%1 Box
* Data for Prepared Meals using Closures.
* Data for Prepared Meals using outers.
44%
5%
42%
3%
5%
Ready Meals Pizza Meal Kits
Film Foil Others
100% 97%
5%16%
Meal Kits Pizza Ready Meals
Box Sleeve Others
11.1%2 Sleeve
2.8%3 Prize Off

242424
Film closures will remain the most preferred closure type during 2014-2019
Film Closures will register the fastest growth at a CAGR
of 1.8% during 2014-2019 to reach 87.4 million units in
2019.
The use of Tray containers will grow at a CAGR of 1.7%
during 2014-2019 to reach 88.4 million units in 2019.
Key Packaging Materials Key Container Types
Key Packaging Closures Key Packaging Outers
Rigid Plastics will register growth at a CAGR of 1.5%
during 2014-2019 to reach 168.0 million units in 2019.
Overview of Prepared Meals market by type of packaging in 2019
The use of Box outer will grow at a CAGR of 1.4%
during 2014-2019 to reach 94.4 million units in 2019.
0
50
100
150
200
Rigid Plastics Flexible Packaging Rigid Metal
Mill
ion
U
nits
2014 2019
0
20
40
60
80
100
Tray Tub Film
Mill
ion U
nits
2014 2019
65
70
75
80
85
90
Film Foil
Mill
ion
U
nits
2014 2019
0
20
40
60
80
100
Box Sleeve
Mill
ion U
nits
2014 2019

252525
Table of Contents
• Country Context
• Market Overview
• Retail Landscape and Key Distribution Channels
• Packaging
• Brand and Private Label Share
• Appendix

262626
The Ready Meals category had the highest private label penetration in the Prepared Meals market
The overall penetration of private label products in the Norwegian Prepared Meals market stood at 5.2% in 2014.
The Ready Meals category had the highest penetration of private label products in the market with a 6.5% share.
This was followed by the Pizza category with a private label penetration of 5.4%.
Penetration of private label, by categories, in the Prepared Meals market, 2014
0%
20%
40%
60%
80%
100%
Ready Meals Pizza Overall
Private Label Brand

272727
0%
1%
2%
3%
4%
5%
0% 1% 2% 3% 4% 5%
2011-2
014 P
rivate
la
bel valu
e in N
OK
CA
GR
(%
)
2011-2014 Brand value in NOK CAGR (%)
Ready Meals
Pizza
Bubble size = 2014 Private Label value
Demand for private label is growing at a faster pace than branded products in the Prepared Meals market
Private label products registered growth at a CAGR of 3.1% during 2011-2014, where as branded products
registered a growth rate of 2.0% during the same period. The Ready Meals category registered the highest growth
of private label products at a CAGR of 3.2% during 2011-2014, which was followed by the Pizza category with a
CAGR of 2.8% during the same period.
Private label value performance compared to brand value performance, by categories, in Norway’s
Prepared Meals market, 2011-2014
Private Labels are taking market share from Brands
Brands are taking market share from Private labels

282828
Ready Meals – Brand share
Leading brands - market share
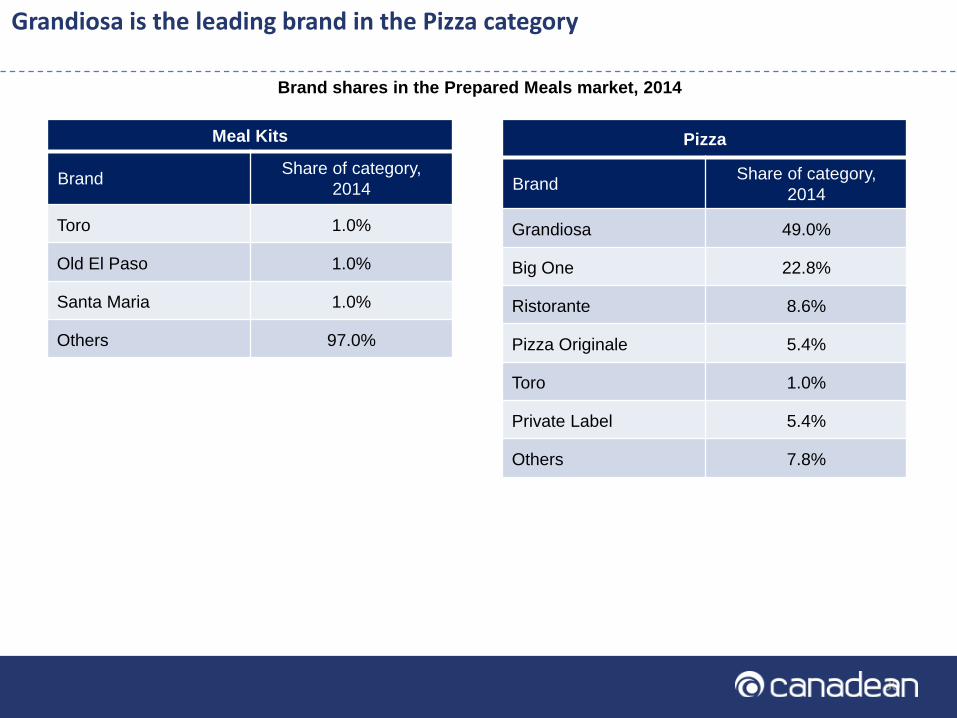
Grandiosa is the leading brand in the Pizza category
Meal Kits – Brand share
Leading brands - market share
Pizza – Brand share
Leading brands - market share
1.0% 1.0% 1.0%
97.0%
Toro
Old El Paso
Santa Maria
Others
49.0%22.8%
8.6%
5.4%
5.4%Grandiosa
Big One
Ristorante
Pizza Originale
Toro
Private Label
Others
19.5%
18.0%
6.8%6.1%
6.5%
Stabburet
Fjordland
Toro
Findus
Private Label
Others

292929
Stabburet and Fjordland are the leading brands in the Ready Meals category
Brand shares in the Prepared Meals market, 2014
Ready Meals
BrandShare of category,
2014
Stabburet 19.5%
Fjordland 18.0%
Toro 6.8%
Findus 6.1%
Maggi 6.1%
Trondhjem 5.2%
Frionor 3.7%
Joika 1.0%
Knorr 1.0%
Middagspai Kokkeklar 1.0%
SaritaS 1.0%
Ready Meals (contd.)
BrandShare of category,
2014
Glide 1.0%
Barilla 1.0%
Santa Maria 1.0%
Spaghetti A LA Capri 1.0%
Terina 1.0%
Blue Dragon 0.9%
Daggens Middag 0.9%
Private Label 6.5%
Others 17.6%
303030
Grandiosa is the leading brand in the Pizza category
Brand shares in the Prepared Meals market, 2014
Meal Kits
BrandShare of category,
2014
Toro 1.0%
Old El Paso 1.0%
Santa Maria 1.0%
Others 97.0%
Pizza
BrandShare of category,
2014
Grandiosa 49.0%
Big One 22.8%
Ristorante 8.6%
Pizza Originale 5.4%
Toro 1.0%
Private Label 5.4%
Others 7.8%

313131
Table of Contents
• Country Context
• Market Overview
• Retail Landscape and Key Distribution Channels
• Packaging
• Brand and Private Label Share
• Appendix

323232
Appendix - Country Context
Year 2009 2010 2011 2012 2013 2014
Total (Millions) 4.8 4.9 4.9 5.0 5.1 5.1
Annual Growth (%) 1.3% 1.2% 1.3% 1.3% 1.3% 1.1%
Year 2009 2010 2011 2012 2013 2014
GDP Per Capita (NOK) 496,396.1 523,705.6 559,067.0 583,433.6 596,168.3 612,814.6
Year 2009 2010 2011 2012 2013 2014
Index 100.0 102.4 103.7 104.5 106.7 109.0
Age Group 0 to 9 10 to 19 20 to 29 30 to 39 40 to 49 50 to 59 60 to 69 70 to 79 80+
Total (Millions) 0.6 0.7 0.7 0.6 0.7 0.7 0.6 0.3 0.2
GDP Per Capita (NOK)
Population
Consumer Price Index
Age Profile (Millions of Persons)
Year 2009 2010 2011 2012 2013 2014 2015 2016 2017 2018 2019
US$-NOK Exchange
Rate (Annual Average)0.159 0.165 0.178 0.172 0.170 0.159 0.147 0.144 0.143 0.142 0.141
Exchange Rates: US$-NOK , 2009–2019

333333
2010 2013
Hypermarkets & Supermarkets 8.1 9.1
Convenience Stores 2.8 3.1
Food & Drinks Specialists 2.8 3.1
Others 0.9 0.7
Norway’s Food sales Distribution (US$ Billion)
Appendix – Sector Overview
Category2014 Value
(US$ Million)
2009–2014
CAGR (%)
2014–2019
CAGR (%)
2014 Value
(NOK Million)2009–2014
CAGR (%)
2014–2019
CAGR (%)
Ready Meals 328.4 2.0% 0.1% 2,064.1 2.0% 2.5%
Meal Kits 87.9 1.8% -0.2% 1,140.8 1.9% 2.3%
Pizza 181.5 1.9% -0.1% 552.6 1.8% 2.2%
Norway’s Prepared Meals Market Value by Category (US$ Million and NOK Million)

343434
Appendix – Sector Overview
2013-2014 Annual (%)
Food Price Inflation 2.4%
Change in Sales Value 2.2%
Change in Sales Volume 1.5%
Change in Average Price Paid 0.7%
Trading Down -1.7%
Components Of Change

353535
2009 2010 2011 2012 2013 2014 2015 2016 2017 2018 2019
Value (US$ Million) 296.9 314.5 345.7 339.8 343.7 328.4 310.8 312.2 317.8 323.9 330.5
Growth (%) -8.7% 5.9% 9.9% -1.7% 1.1% -4.4% -5.4% 0.4% 1.8% 1.9% 2.0%
Value (NOK Million) 1,866.9 1,901.0 1,937.6 1,976.9 2,019.0 2,064.1 2,112.3 2,163.8 2,218.8 2,277.6 2,340.4
Growth (%) 1.8% 1.8% 1.9% 2.0% 2.1% 2.2% 2.3% 2.4% 2.5% 2.6% 2.8%
Ready Meals Market Value
Meal Kits Market Value
2009 2010 2011 2012 2013 2014 2015 2016 2017 2018 2019
Value (US$ Million) 80.6 85.1 93.4 91.5 92.3 87.9 82.9 83.0 84.3 85.6 87.0
Growth (%) -8.9% 5.7% 9.6% -2.0% 0.8% -4.7% -5.7% 0.1% 1.5% 1.5% 1.6%
Value (NOK Million) 506.6 514.6 523.2 532.4 542.2 552.6 563.8 575.6 588.2 601.6 615.8
Growth (%) 1.5% 1.6% 1.7% 1.8% 1.8% 1.9% 2.0% 2.1% 2.2% 2.3% 2.4%
Appendix – Category Data
2009 2010 2011 2012 2013 2014 2015 2016 2017 2018 2019
Value (US$ Million) 164.8 174.4 191.5 188.1 190.1 181.5 171.5 172.0 174.7 177.6 180.6
Growth (%) -8.8% 5.8% 9.8% -1.8% 1.1% -4.5% -5.5% 0.3% 1.6% 1.6% 1.7%
Value (NOK Million) 1,036.6 1,054.2 1,073.1 1,094.2 1,117.0 1,140.8 1,165.8 1,192.1 1,219.6 1,248.4 1,278.6
Growth (%) 1.6% 1.7% 1.8% 2.0% 2.1% 2.1% 2.2% 2.2% 2.3% 2.4% 2.4%
Pizza Market Value

36363615/05/2015 365/15/2015 365/15/2015 365/15/2015 36
Appendix – Segment data
Category Segment Segment’s Share, 2014 Segment’s Share, 2019
Ready Meals
Frozen Ready Meals 58.0% 58.9%
Chilled Ready Meals 18.5% 17.0%
Dried Ready Meals 13.7% 13.6%
Ambient Ready Meals 9.8% 10.6%
Pizza
Frozen Pizza 63.5% 63.9%
Chilled Pizza 36.5% 36.1%
Meal Kits
Chilled Meal Kits 36.5% 38%
Frozen Meal Kits 34.1% 33%
Ambient Meal Kits 29.4% 29%
Market Share by Segment by Value

373737
Packaging Material 2014 2019
Rigid Plastics 155.8 168.0
Flexible Packaging 85.6 91.6
Rigid Metal 12.9 14.0
Packaging Materials in 2014 Vs. 2019 (Millions of Packs)
Appendix – Packaging Data
Container Types 2014 2019
Tray 81.1 88.4
Tub 79.9 84.8
Film 49.1 52.9
Bag/Sachet 36.5 38.7
Can - Food 7.7 8.9
Container Types in 2014 Vs. 2019 (Millions of Packs)

383838
Appendix – Packaging Data
Closure Types 2014 2019
Film 79.9 87.4
Foil 73.9 78.4
Closure Types in 2014 Vs. 2019 (Millions of Packs)
Outer Types 2014 2019
Box 88.0 94.4
Sleeve 28.3 30.1
Outer Types in 2014 Vs. 2019 (Millions of Packs)

393939
Category definitions
Category Definition
Pizza Pizza - Includes all chilled and frozen pizzas.
Ready Meals
Ready Meals - all types of complete meals which only require heating before being served, regardless of
whether they are frozen, chilled, "shelf-stable (i.e. in cans or shelf-stable packs) or are dried. Includes noodle-
based, rice-based and pasta-based dishes as well meat-based, vegetable-based or meat-substitute based
dishes. Further, this includes main meat, fish and vegetable meal centers which require minimal
accompaniments - e.g. tinned chilli con carne, cassoulet in jars etc. Includes "Pot Noodle" type products.
Meal Kits
Meal kits are products which provide prepared ingredients which are then combined to an individual's
preference when being cooked. Includes all shelf-stable, dried, chilled and frozen meal kits. E.g. Wan Chai
Ferry Xiang Gu Meal Kit , and Old El Paso Fajita Dinner Kits.

404040
Category Definition
Pizza
Chilled Pizza
Pizzas that require to be stored in cold temperature for preserving but are not frozen. Usually
stored at below 8°C. Examples include Digiorno Pizza Rising Crust Supreme (USA) and
Pizza Express Margherita Pizza (UK).
Frozen Pizza
Pizzas that are to be frozen always and are to be stored at temperatures below -15°C.
Examples include Red Baron Frozen Pizza Pepperoni and Freschetta Frozen Pizza
Pepperoni.
Ready Meals
Ambient Ready Meals
Meal that is pre packed and does not require any special storage conditions. Can be stored
at room temperature. Ambient ready meals include thermostabilised, aseptic fill, shelf stable
natural form of foods. Examples include Hormel Chili Con Carne With Beans (USA).
Dried Ready Meals
Any meal that can be stored at room temperature without the need for special storage
conditions. Includes meat, fish, pasta and vegetable based meals e.g. Kraft Macaroni and
Cheese.
Chilled Ready Meals
Any meal that is stored at temperature below 8°C and just needs to be heated and eaten. It is
prepacked and is usually in individual containers or packages. It is also called as chilled
dinner, chilled meal, microwave meal, ready to eat/serve or ready meal. Includes Pasta,
Noodles, Spaghettis, Pilaf, Rice and other meat base items. Examples include Kraft Deluxe
Pasta and Sauce and Princes Chicken In White Sauce.
Frozen Ready Meals
Any meal that needs to be freezed at all times (stored at temperatures below -15°C) and
needs to be defrosted and heated to be eaten. Frozen fully prepared meals purchased in a
store to be eaten elsewhere. They aren't the same as take-away and fast food, and they
aren't canned food. It is also called as frozen dinner, frozen meal, microwave meal, ready to
eat/serve or ready meal. Includes Pasta, Noodles, Spaghettis, Pilaf, Rice and other meat
base items. Examples include Organic Vegetarian frozen Lasagna.
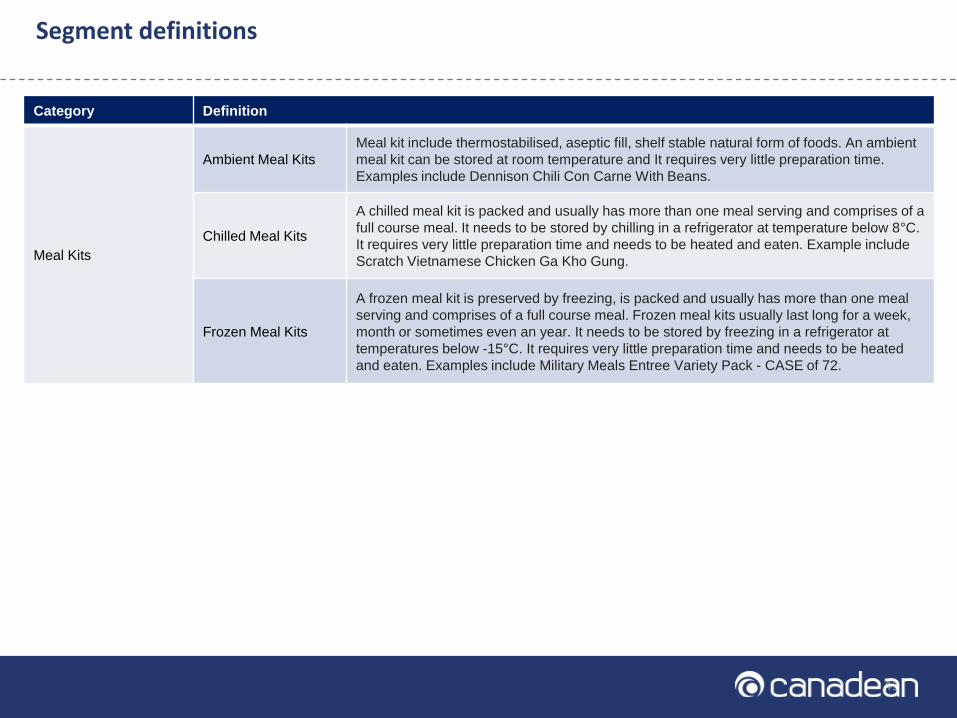
Segment definitions
414141
Category Definition
Meal Kits
Ambient Meal Kits
Meal kit include thermostabilised, aseptic fill, shelf stable natural form of foods. An ambient
meal kit can be stored at room temperature and It requires very little preparation time.
Examples include Dennison Chili Con Carne With Beans.
Chilled Meal Kits
A chilled meal kit is packed and usually has more than one meal serving and comprises of a
full course meal. It needs to be stored by chilling in a refrigerator at temperature below 8°C.
It requires very little preparation time and needs to be heated and eaten. Example include
Scratch Vietnamese Chicken Ga Kho Gung.
Frozen Meal Kits
A frozen meal kit is preserved by freezing, is packed and usually has more than one meal
serving and comprises of a full course meal. Frozen meal kits usually last long for a week,
month or sometimes even an year. It needs to be stored by freezing in a refrigerator at
temperatures below -15°C. It requires very little preparation time and needs to be heated
and eaten. Examples include Military Meals Entree Variety Pack - CASE of 72.
Segment definitions

424242
Channel Definition
Hypermarkets &
Supermarkets
Hypermarkets/mass merchandisers include all sales through retailers with floor area over 2,500 sq m that carry full
lines of both grocery and general merchandise (e.g. Wal-Mart). Supermarkets include all sales through retailers with
a floor area of 300 sq. m. -2,500 sq. m. that offer a wide, departmentalized range of groceries, and may carry some
general merchandise lines (e.g. Sainsbury's, Kroger). It also includes hard grocery discounters such as Wal-Mart.
Convenience Stores
Includes all sales through stores of an area generally less than 300 sq m, that specialize in a limited range of food &
grocery products designed primarily for consumers with top-up shopping needs. Also includes sales in retail outlets
attached to gas stations, where fuel is the main revenue driver, kiosks, and newsstands. This also includes small
independent retailers, particularly those present in countries such as China and India.
Food & Drinks
Specialists
Includes bakers, butchers, delicatessens, drinks specialists, fishmongers, greengrocers, Food & drinks only stores,
and single category stores (e.g. stores selling only cheese, or only olives, or only honey, or only Confectionery
products) Example: Amul Prepared Meals shops In India.
Other Retailers
Includes “Dollar Stores”, Variety Stores & General Merchandise Retailers, Cash & Carries & Warehouse Clubs,
Department Stores, Drug stores & Pharmacies, eRetailers, Vending Machines and other generalist retail channels
not included in the categories above (e.g. market traders, charity stores, student union stores, direct sales, and Duty
Free shops).
Channel definitions

434343
This report features data derived from market data.
Market Data
In order to create the data for all reports in this series and ensure their robustness, a comprehensive and empirically robust research
methodology has been adopted. This combines both a large-scale program of industry research with the results of extensive primary
industry interviewing and calling. Furthermore, all definitions are standardized across products and countries to ensure comparability.
The two main research methods, secondary research and primary research (the program of interviewing industry contacts), are brought
together and because both sets of research processes have been designed in conjunction with each other they can be combined and
consolidated into the final, integrated data sets.
The secondary research process involves covering publicly available sources, trade associations, specialist databases, company annual
reports, and industry publications. Primary research involves a major program of interviewing leading industry executives for each category
covered in each country – all with local country experts; typically brand, product and marketing managers for major brands within each
country. These processes help analysts in capturing both qualitative and quantitative information about the market.
The final stage of the process is the triangulation of inputs obtained from all the research methods with the analyst’s own understanding of
the market in order to finalize the data. Once the data is finalized, it goes through various top level quality checks prior to publishing.
Methodology

444444
About Canadean
Canadean is a full-service business information provider with in-house market research capabilities. We specialize in analysis across the
Consumer Markets Value Chain, covering suppliers, producers, distribution and consumers.
Canadean’s dedicated research and analysis teams consist of experienced professionals with an industry background in
marketing, market research, consulting and advanced statistical expertise. We offer value-added market research, insight and strategic
analysis and our products help companies to make better, more informed, strategic and tactical sales and marketing decisions.
Canadean’s areas of expertise include online research, qualitative and quantitative research, industry analysis, custom approaches, and
actionable insights. In addition Canadean has built a network of consultants and specialist researchers across more than 60
countries, each with in-depth industry experience and expertise enabling us to conduct unique and insightful research via our trusted
business communities.
Disclaimer
All Rights Reserved.
No part of this publication may be reproduced, stored in a retrieval system or transmitted in any form by any
means, electronic, mechanical, photocopying, recording or otherwise, without the prior permission of the publisher, Canadean.
The facts of this report are believed to be correct at the time of publication but cannot be guaranteed. Please note that the
findings, conclusions and recommendations that Canadean delivers will be based on information gathered in good faith from both
primary and secondary sources, whose accuracy we are not always in a position to guarantee. As such, Canadean can accept no liability
whatsoever for actions taken based on any information that may subsequently prove to be incorrect.
About Canadean