construction industry instituteconstruction …
TRANSCRIPT

CONSTRUCTION INDUSTRY INSTITUTECONSTRUCTION INDUSTRY INSTITUTECONSTRUCTION INDUSTRY INSTITUTECONSTRUCTION INDUSTRY INSTITUTECONSTRUCTION INDUSTRY INSTITUTE
Research Summary 143-1
DETERMINANTS OF
CRAFT LABOR PRODUCTIVITY

Construction Industry Institute
ABB Lummus GlobalBaker Concrete ConstructionBE&KBechtel GroupBlack & VeatchBMW ConstructorsBurns and Roe EnterprisesButler Manufacturing CompanyCDI Engineering GroupCherne Contracting CorporationChicago Bridge & Iron CompanyCianbro CorporationDay & Zimmermann InternationalDick CorporationDillingham Construction HoldingsEichleay HoldingsFisher Controls InternationalFluor DanielFoster Wheeler USA CorporationGraycorHilti CorporationHoneywell InternationalIntegrated Electrical ServicesInternational Technology CorporationJacobs Engineering GroupJohnson ControlsKellogg Brown & RootKiewit Construction GroupKværnerLurgi PSIM. A. Mortenson CompanyMurphy CompanyParsons Energy & Chemicals GroupPetrofac LLCPrimavera SystemsPSEG Energy TechnologiesRust ConstructorsS&B Engineers and Constructors Ltd.SAP AmericaSMS DemagVA TECHWalbridge Aldinger CompanyWashington Group InternationalH. B. Zachry Company
3MAbbott LaboratoriesAir Products and ChemicalsAluminum Company of AmericaAnheuser-Busch CompaniesAramco Services CompanyBayer CorporationThe Boeing CompanyBP Amoco CorporationCargillCelaneseChampion International CorporationChevron CorporationCITGO Petroleum CorporationConocoDofascoThe Dow Chemical CompanyDuPontEastman Chemical CompanyExxonMobil CorporationFPL EnergyGeneral Motors CorporationGeneral Services AdministrationGlaxoSmithKlineHuntsman Corp.Intel CorporationEli Lilly and CompanyNASANaval Facilities Engineering CommandOntario Power GenerationPhillips Petroleum CompanyPraxairThe Procter & Gamble CompanyReliant EnergyRohm and Haas CompanyShell Oil CompanySolutiaTennessee Valley AuthorityTexacoU.S. Air Force Research LaboratoryU.S. Army Corps of EngineersU.S. Department of Commerce/NISTU.S. Department of StateU.S. SteelUnion Carbide CorporationThe University of Texas System

Craft Labor Productivity
Prepared byThe Construction Industry Institute
Craft Productivity Improvement Research Team
Research Summary 143-1March 2001

© 2001 Construction Industry Institute™.
The University of Texas at Austin.
CII members may reproduce and distribute this work internally in any medium atno cost to internal recipients. CII members are permitted to revise and adapt thiswork for the internal use provided an informational copy is furnished to CII.
Available to non-members by purchase; however, no copies may be made ordistributed and no modifications made without prior written permission from CII.Contact CII at http://construction-institute.org/catalog.htm to purchase copies.Volume discounts may be available.
All CII members, current students, and faculty at a college or university are eligibleto purchase CII products at member prices. Faculty and students at a college oruniversity may reproduce and distribute this work without modification foreducational use.
Printed in the United States of America.

Contents
Chapter Page
Executive Summary v
1. Introduction 1
2. Findings 10
3. Conclusions 21
References 25


v
Executive Summary
Construction craft productivity improvement can be achieved in
multitude ways. Which are best? Construction Industry Institute (CII)
Research Team 143 searched for a solution to this complex subject.
This research summary describes a study by CII that compares
two strategies for improving construction labor productivity. One
strategy, the buffer strategy, stresses the importance of providing
large stockpiles (buffers) of design, material, and construction
equipment to craft workers. Large buffers provide flexibility to a
production system by allowing worker to shift from one task to
another when material shortages, design defects, or other
impediments are encountered. The second strategy, the production
planning strategy, provides effective craft production by ensuring
that all necessary productive resources are available for craft
workers. The production planning strategy encompasses all jobsite
activities that directly support craft labor. Production planning is the
domain of project material expeditors, field planners, and field
engineers who ensure that craft workers have the materials and
information needed for production activities. Production planning is
the bridge between project planning and actual construction work.
Most construction firms use both strategies on their jobsites.
However, increased use of buffers (e.g., larger stockpiles of
materials, design and equipment) reduces the need to plan
production in detail by introducing flexibility into the production
system. Conversely, precise production planning reduces the need
for large buffers by ensuring that the correct materials, designs, and
equipment are available for craft workers.
This publication offers readers a chance to compare these two
strategies for productivity improvement. Both techniques have
advantages and disadvantages. The ultimate goal is to choose the
strategy that improves craft productivity and leads to successful
project planning, execution, and start-up.


1
1
Introduction
Field labor continues to be one of the largest costs and most
significant variables in a construction project. CII Research Team
143, Craft Productivity Improvement, was initially chartered to
“identify craft productivity improvement methods and to reliably
and authoritatively evaluate the impact of these ideas on actual job
site productivity.” RT 143 investigated the effectiveness of using
earlier acquisition of project resources and increased production
planning as a way to improve jobsite productivity. In particular, the
effect of actions — providing design information and construction
materials earlier in the construction process and providing more
construction equipment and non-manual worker support to the
work crews — was studied.
Productivity History
There is widespread agreement on the need to improve
productivity as cited in the original Construction Industry Cost
Effectiveness (CICE) reports by The Business Roundtable. Much has
been accomplished since then through implementation of CII’s
“Best Practices,” which clearly have reduced project costs. Has
actual labor productivity in terms of output per work-hour changed?
Construction industry labor productivity changes in the last 20–
30 years remain controversial and subject to strongly held opinions.
Little absolute data are available due to the uniqueness and
proprietary nature of each project. The Center for Construction
Industry Studies Report No. 7, U.S. Construction Labor ProductivityTrends 1970-1998, shows an increase in productivity, measured as
output/dollar, due primarily to depressed real wages, but also to
technological advances in its sampling of six representative tasks.

2
The Bureau of Labor Statistics maintains productivity indices for
all significant sectors of the economy except for the construction
sector due to lack of suitable data. Other government data show
greater than 50 percent productivity increases for U.S. manufacturing
and mining industries in terms of worker output. A 16 percent
decline, however, is seen in construction industry worker
productivity.
Research Basis
Construction labor productivity is not increasing at a rate
commensurate with increases in the rest of the economy. What can
be done to improve field labor productivity? A conventional
approach to improve productivity is to provide large stockpiles of
engineering design, materials, and construction equipment. This
strategy improves labor productivity by providing multiple
alternative work tasks and assignments. If one work task is
unavailable due to material shortages, changes or other impacts,
other work assignments can be made. In this research, an approach
that relies on large stockpiles of production resources is referred to
as the “buffer strategy.”
Another means to improve labor productivity is to invest more
heavily in persons who support the production workers. Field
expeditors, field engineers, and field planners can ensure that all
necessary productive resources are purchased and available for the
craft workers. This is called the “production planning strategy.”
Production planning encompasses all jobsite activities that directly
support craft labor. Production planning is not pre-project planning
nor is it project scheduling. Production planning is the domain of
non-manual field staff who ensure that craft workers have the
materials and information needed for production activities.
This research compared the effectiveness of these two
strategies. The strategies are complementary: increased use of
buffers (e.g., larger stockpiles of materials, design and equipment)
3
reduces the need for detailed production planning by introducing
flexibility to the production system. On the other hand, precise
production planning reduces the need for large buffers by ensuring
that the correct materials, designs, and equipment are available for
the craft worker. So the question is, “Should one pay for increased
buffers or should one pay for increased production planning?”
To answer this question, the research team focused on piping
and electrical crafts for industrial construction projects. In industrial
construction projects, piping and electrical crafts usually consume
the most field labor hours and are on the schedule critical path. RT
143 measured the effect on worker productivity for these two crafts
as a function of four factors:
1. Relative availability of engineering design (design
buffer)
2. Relative availability of the right materials to be installed
(material buffer)
3. Amount of construction equipment to support that
craft/crew’s work (equipment buffer)
4. Relative availability of non-supervisory construction
support personnel including field engineers, planners,
and expeditors (production planning buffer)
These four elements are important in providing craft workers
with the resources necessary for efficient production. Many factors
affect jobsite labor productivity, however. A comprehensive list of
factors that affect labor productivity is shown in Table 1 (next page).
As one might expect, jobsite labor productivity varies greatly
depending upon such elements as design quality, worker skill, and
project location. To the extent possible, these were controlled in the
research.

4
Table 1. Factors That Could Affect Craft Worker Productivity
ENGINEERING/DESIGN
Design/drawing availability
Design quality — errors &omissions
Changes
PROJECT/SITE CONDITIONS
Weather
Proximity to operating areaSite rules (safety requirements,
no smoking)
Unique owner requirements
Plant construction permits
Local codes and governmentinspections
Size of projectProject execution strategy
Project complexity
Worker density
New process technology
Proximity of laydown area
Existing obstructionsUnknown underground
conditions
Confined space entry
Scaffolding
QA/QC requirements
MATERIALS
Engineered equipmentavailability
Timing for bulk materials
Material control of items on site
Quality of materials
CONSTRUCTIONMANAGEMENT
Constructability reviews
Construction techniquesContractor staff organization
Production support resources
Owner organization
Contracting strategy
Craft coordination (workflow)Subcontractor coordination
Adherence to execution plan
Supervision skills
Construction equipment &tools (availability & quality)
Manning levels
LABOR
Labor market
Skill levels
Craft flexibility
Learning curvesOverall work force culture
Worker motivation
Worker compensation andincentives
Work schedule (4-10’s, 5-8’s,etc.)
Overtime (scheduled andunscheduled)
Shift work
Rework

5
Data Collection
Data were collected from 26 industrial projects (see Figure 1) in
the United States, totaling 1307 crew days of work for both piping
and electrical crafts. To the extent practical, data were collected
from each project at three stages of completion, 25, 50, and 75
percent complete, avoiding the beginning and end of the work,
when productivity usually is lower. Projects ranged in size from
$830,000 to $244,000,000 and included grass roots and retrofit
installations. Eighty percent of the projects were executed at open
shop sites and 20 percent at union sites.
Figure 1. Geographic Distribution of Projects in the Study
13 31
1
4 2
11

6
Adjustment of Measured Productivity Index
Evaluation of the effects of design, material, equipment and
production planning on craft labor productivity required
development of a productivity measurement standard. Since the
surveys gathered data across multiple jobsites, a Standard
Productivity Index (PI) was calculated as follows:
The PI compares the actual time required by each work crew to
a standard amount of time, required by a typical work crew, to
complete the same amount of work. Worker Hours Reported were
determined from the hours recorded on the survey forms for each
crew. Standard Worker Hours were estimated using historical data
from the industry. Standard Worker Hours for piping work came
from the MCA Manual (MCA 1998) and for electrical work; they
came from the NECA Manual of Labor Units (NECA 1997). Before
computing the PI, Worker Hours Reported and Standard Worker
Hours were summed for an entire week for each crew, at each
jobsite, for each reporting period. The summarized weekly values
were used to compute weekly PIs for each crew at each jobsite. The
daily crew data were summarized by the week to avoid the large
variations typically seen in daily productivity values.
The following definitions were used to indicate craft
productivity performance:
< 1.0 ≈ better than expected productivity
1.0 ≈ expected productivity
> 1.0 ≈ worse than expected productivity
PI =
Worker Hours Reported
Standard Worker HoursStandard Productivity Index (PI) =
Computed as shown above, the PI values reflect the effects of
both project-specific and management-controlled productivity

7
factors. For example, jobsites in the U.S. Gulf Coast and the
Northeast U.S. need to be distinguished from one another due to
their inherently different labor climates. Likewise green-field
projects need to be distinguished from retrofit projects. To control
for these and other project-specific productivity effects, the PI was
adjusted using regression techniques. From the regression analysis,
five factors were determined to be significant and were
subsequently adjusted for in the study. The five factors were:
• project location
• project type (grass roots or retrofit)
• project delivery system (EPC, EPCM, SeparateDesign, and Constructor)
• labor source (union or non-union)
• total craft work-hours.
After appropriate adjustments, the PI became the Adjusted
Productivity Index (API) that was used in all subsequent analyses.
Measurement of Jobsite Buffers
Design buffers are a function of both time and quantity of work
complete. As more design is completed before construction
commences, the design buffer becomes larger. In traditional
thinking, large design buffers improve productivity by allowing
earlier fabrication or delivery of material. Also, relatively early
design provides the opportunity to discover errors in design
documents. The calculation used for the design buffer is shown
below:Percentage of Design Completed
Percentage of Craft Work CompletedDesign Buffer =
Various measures for both design complete and craft work
complete were evaluated. For piping work, it was determined that
comparing Isometric Design Complete vs. Spools Installed would
8
As with the design buffers, various measures for both materials
received and craft work complete were evaluated. The analysis
determined that the ratio of Spools Received to Spools Installed was
the most effective way to calculate the material buffer for piping,
and the ratio of Cable Received to Cable Installed was most
effective for electrical work.
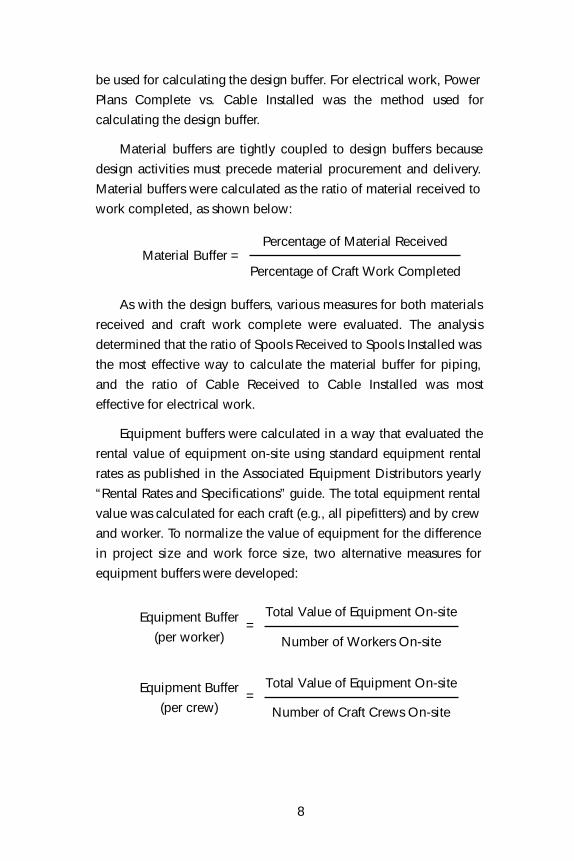
Equipment buffers were calculated in a way that evaluated the
rental value of equipment on-site using standard equipment rental
rates as published in the Associated Equipment Distributors yearly
“Rental Rates and Specifications” guide. The total equipment rental
value was calculated for each craft (e.g., all pipefitters) and by crew
and worker. To normalize the value of equipment for the difference
in project size and work force size, two alternative measures for
equipment buffers were developed:
be used for calculating the design buffer. For electrical work, Power
Plans Complete vs. Cable Installed was the method used for
calculating the design buffer.
Material buffers are tightly coupled to design buffers because
design activities must precede material procurement and delivery.
Material buffers were calculated as the ratio of material received to
work completed, as shown below:
Percentage of Material Received
Percentage of Craft Work CompletedMaterial Buffer =
Equipment Buffer
(per worker)
Total Value of Equipment On-site
Number of Workers On-site=
Equipment Buffer
(per crew)
Total Value of Equipment On-site
Number of Craft Crews On-site=

9
Ultimately, the value of equipment on site per worker was the
most effective measure for both piping and electrical work.
Production planning support levels are similar to equipment
buffers in that there is no standard method to calculate them.
Multiple potential measures for planning levels were evaluated by
developing ratios of the number of persons assigned to directly
support the work of the field crews. By our definition, field
engineers, expeditors and field planners were all judged to be “field
support.” Alternatively, safety personnel, QA/QC and office staffs
were not included in the measure of field support. Superintendents
and foremen, at all levels, were classified as “field supervision” and
were not included in this measure. The amount of planning support
was calculated as the ratio of non-craft field support workers to the
number of craft workers or the number of crews, as shown below:
Number of Field Support Persons On-site
Number of Craft Crews or Workers On-sitePlanning Support =
Ultimately, it was determined that the ratio of field, non-craft
support personnel per worker was the most effective measure of
planning support in both the piping and electrical crafts. This
measure does not consider the efficiency or methods of field
support personnel, only their overall numbers per worker or craft.
Using standard statistical techniques, the research team
evaluated how differences in design, materials and construction
equipment buffers affected API, i.e., the buffer strategy. RT 143 also
evaluated how relatively more production planning resources
affected API, i.e., the production planning strategy. Finally, the team
evaluated (in order of magnitude terms) the relative cost
effectiveness of the buffer strategy and the production planning
strategy.

10
2
Findings
Planning Resources Really Pay Off
This research focused on the field planning functions that
include such activities as communication between site management
and crafts, look-ahead planning, material/equipment coordination
on site, and other related activities. Planning resources appear to
pay off by allowing piping and electrical work crews to have the
proper amounts of materials, equipment, design, and work
sequencing plans that are essential for the crafts to perform their
work efficiently. Over the course of the research project, team
members interviewed craft supervision including foremen and
requested their input on the factors they felt positively improved
craft productivity. Comments consistently related to planning:
“Work the plan,” “Understand the plan,” and “Communicate the
plan” were typical. The numerical results clearly indicate the value
of production planning in improving labor productivity. The work
force also believes planning has positive results based on personal
experiences in the industry.
Piping Craft
The use of increased planning support in the piping craft was
effective in improving piping productivity, as shown in Figure 2.
Productivity improved significantly as the number of field
support personnel per worker was increased. Average contractor in
this study employed one support worker for every 30 craft workers
and achieved an API of about 1.05. Contractor API ranged from 1.1
to an absolute low of 0.7, when the numbers of field support
personnel increased from no planning support personnel to a high
of one support person for every five craft workers. Compared to the
typical contractor, the improvement in piping productivity was
significant as the number of planning support personnel increased.

11
Contractors that employed one planning support person for every
10 craft workers showed an average productivity improvement of
20 percent.
Electrical Craft
The use of increased planning support showed good
performance in improving electrical labor productivity as well. The
typical contractor in this study used one planner for every 45
electricians and achieved an API of 1.05. In instances where there
were no field support personnel on-site, the adjusted productivity
value was 1.09. As the amount of field support personnel increased
towards one field support personnel per 10 workers, the new
adjusted productivity value was 0.95. These results indicate the
significant effect that production support staff has on labor
productivity.
These findings provide strong support for special emphasis to be
placed on production planning when owners and contractors are
preparing to execute a project. However, the research found many
project executives believe large buffers of materials and equipment
Figure 2. The Best Sites Had One Support Personfor 10 or Fewer Craft Workers
Best
1:40 1:20 1:10
1.1
1.0
0.9
Pipi
ng A
PI
Ratio of Support Personnel to Craft Workers

12
are essential to provide flexibility and continuity during
construction. For this reason, the team also evaluated the effect of
buffers on labor productivity.
Buffers (Stockpiles) Improve Piping Productivity
Piping Design Buffers
Increases in piping design availability were effective in
improving productivity. The fundamental measure of piping design
buffers was the ratio of isometric drawings received (expressed as
percent of the total number of piping isometric drawings) to piping
installed (percent of the total number of spools). The average
contractor in this study employed a design buffer in the range of 1
to about 1.5 (average ≈1.2) and achieved an API of 1.05. Comparing
projects where the design buffer was approximately 1 to projects
where the buffer approached 3, productivity increased about 15
percent as illustrated in Figure 3. These results, which are referred
Low
er is
goo
d
Pipi
ng A
PI
0.50.60.70.80.9
11.11.21.31.41.5
0.8 1.3 1.8 2.3 2.8
Isometric Design to Spools Installed Buffer
to as the “buffer strategy,” are significant since piping is often the
critical path of chemical process industry projects and it is not easy
to complete piping design early in the project life. An equally
significant finding is that those jobsites that maintained a large
piping design buffer experienced much more predictable crew
Figure 3. Piping Design Buffer — Productivity Improvement

13
Low
er is
goo
d
Pipi
ng A
PI
0.50.60.70.80.9
11.11.21.31.41.5
0 500 1000 1500 2000
Equipment Rental Cost per Worker ($)
The average contractor maintained a pipe spool material buffer
of about 1.25 and achieved an API of ≈1.05. Again, when a project
material buffer approaches 1.0, spools received equal spools
erected, and the project is working in a just-in-time delivery mode.
As this ratio increases to 3.0 the API shows a 12 percent
improvement in productivity. These findings are consistent with
CII’s earlier research, “Managing Uncertainty in the Piping
Function.” There, high performance resulted when at least 60
percent of the pipe had been received when 20 percent had been
installed. Large piping stockpiles provide alternative work activities
if a crew’s planned work is delayed for any reason. As with design
buffers, the variation in API values decreases significantly with
increasing buffer size. This is more evidence of the stability
produced by materials buffers in jobsite production systems.
Figure 4. Piping Material Buffer — Productivity Improvement
performance. That is, the API values were much more stable on
projects with large design buffers, indicating that design buffers
enable better and more consistent crew production.
Piping Material Buffers
The ratio of pipe spools received to pipe spools installed is the
piping material buffer. Increased material buffers also improved
piping productivity as shown in Figure 4.

14
Piping Construction Equipment Buffer
The construction equipment buffer was measured as equivalent
rental value of construction equipment per craft worker. Field input
apportioned shared equipment among different crafts and several
crews in the same craft. For example, project cranes may be shared
among several crafts. All piping crews may share trucks, personnel
lifts, and similar equipment, whereas welding machines may be
assigned to a single crew. Increased availability of construction
equipment for piping activities results in improved productivity as
shown in Figure 5. Productivity gradually improved as the amount
Low
er is
goo
d
Pipi
ng A
PI
0.50.60.70.80.9
11.11.21.31.41.5
0.8 1.3 1.8 2.3 2.8
Spools Received to Spools Installed Buffer
Figure 5. Piping Equipment Buffer — Productivity Improvement
of rental equipment per worker increased from $200 of rental
equipment per worker (API = 1.0) to $1,800 of rental equipment per
worker (API = 0.85). This was an average 15 percent difference in
productivity between the least well-equipped projects and the best-
equipped projects. However, these results were not as uniform as
the results for design and material buffers. Increases in piping
construction equipment buffers also did not lead to the same degree
of stability in API.
At any given buffer size, RT 143 observed a wide variation in
jobsite API. No doubt, these variations are due to unadjusted jobsite
differences in design quality, constructability, and worker skill.

15
However, for any given buffer level, there was an unassailable trend
toward improved crew performance with increasing buffer size. It is
also worthwhile to reiterate that in the cases of design, material and
(less definitively for) planning as the buffer size increased, the API
values varied much less from jobsite to jobsite, indicating less
volatility in productivity performance. Thus, not only did labor
productivity improve with increased resource availability, but the
ability to predict productivity levels improved as well. Reduced
labor performance volatility is an unexpected benefit to large
design, material, and equipment buffers.
Different Results for Electrical Productivity
The research data indicate that the “buffer strategy” does not
support improvements in electrical craft productivity. For practical
purposes, the buffers have no discernable impact on electrical labor
productivity. Productivity appeared to be unaffected by increasing
electrical design buffers. The difference in productivity values
between a buffer ratio of 1.00 and 5.00 was essentially zero. To a
large extent electrical work bypasses the shop detail and fabrication
phase. Electricians can begin their installations immediately on
issuance of released for construction drawings. Therefore, they do
not need large “stockpiles” of design as a precursor to fabrication to
be highly productive. Electricians also have much more flexibility
in arranging conduit and sometimes tray, and typically route their
cable conductors after the process piping has been installed.
The use of increased material buffers in the electrical craft
likewise showed no influence in improving labor productivity. The
difference in productivity values between a buffer ratio of 1.0 and
3.0 was only 0.40 percent. The team hypothesizes this is because
electrical work uses a significantly higher percentage of readily
available bulk materials than does piping erection. These materials
do not require prefabrication, but normally are stock materials “off
the shelf.”

16
Likewise, the use of increased equipment buffers in the
electrical craft showed no results in improving productivity. Similar
to the electrical design and material buffers, the construction
equipment buffer did not prove to be a powerful predictor of
productivity performance.
The Economics of a Project Buffer Strategy
The research was extended to consider the economic
ramifications of the buffer strategy. Specifically, the team attempted
to answer the question “Should a project invest in increased
buffers?” This analysis was limited to the piping craft only because
results for electrical buffers produced minimal productivity
improvements.
A “buffered” project incurs added costs associated with holding
and managing increased jobsite inventories. There are also costs
associated with furnishing design at an earlier point in the project.
Offsetting these increased costs on a buffered project are the labor
cost savings attributed to improved productivity caused by the
larger design and material buffers. On the other hand, a non-
buffered project has lower inventory and handling costs but it does
not obtain the benefits of improved labor productivity.
In the (order-of-magnitude) analysis for a $25,000,000 project,
these net cost differences for a non-buffered project were quite
small (see Table 2). That is, the savings in inventory costs were
cancelled by the unrealized labor productivity savings. On the
other hand, a highly buffered project incurred extra inventory and
design costs (≈$120,000) that were not wholly offset by improved
labor productivity.

17
In other words, RT 143 draws the following conclusions
regarding the economic effects of large buffers:
1. Large design and material buffers result in labor savings
as productivity improves.
2. Large material buffers have hidden costs due to
warehousing, security, extra material handling costs, and
possibly interest expense.
3. The costs of the buffers outweigh the benefits of labor
savings (although these differences are relatively small
compared to a $25MM project).
Table 2. Additional Research Finding: Design and Material StockpileCosts Outweigh Comparative Labor Savings
Cost Element Non-Buffered Stockpiled orProject Buffered Project
Carrying Cost $5,000 $44,000
Warehouse Staffing 7,000 0
Design Inefficiencies $0 15,000
Extra Handling of Materials (12,000) 0
Laydown Area, Warehousing (11,000) 18,000& Security
Changes/Refabrication/Field Errors (20,000) 40,000
Material Waste (11,000) 30,000
Total Costs or (Savings) ($42,000) $147,000
Labor Costs or (Savings) $30,000 ($26,000)
Cost Differential for $25MM Project ($12,000) $121.000

18
However, it is important to remember that large buffers also
serve to stabilize labor productivity performance. In this light, a
relatively small investment in project buffers ($120,000 in this case)
serves as labor productivity insurance by making crew performance
more predicable.
Schedule Ramifications of a Buffer Strategy
There are important schedule implications of the buffer strategy.
Consider Figure 6, an S-curve diagram that illustrates the
relationship between the design schedule, the material delivery
schedule, and the construction schedule for a highly-buffered
project.
Figure 6. Buffered Project S-Curves
Duration Percent Complete
Com
plet
ion
Perc
enta
ge
0
10
20
30
40
50
60
70
80
90
100
0 5 10 15 20 25 30 35 40 45 50 55 60 65 70 75 80 85 90 95 100
D M C
DesignBuffer
MaterialBuffer
Engineering CompleteMaterials ReceivedConstruction Complete
The large distance between the design and materials delivery
curve represents a large design buffers. Likewise, the large distance
between the materials delivery curve and the construction curve
represents a large material buffer. Compare the buffer size implied
by Figure 6 to those implied on the non-buffered project shown in
Figure 7.
This non-buffered projects must depend on increased planning
to prioritize design and material delivery to support field erection

19
schedules. Notice that the overall rates at which design, material
procurement and construction are accomplished are much lower
than in a buffered project with a comparable schedule.
What would happen if a project team could reduce project
buffers and still maintain the production rates for design,
procurement and construction of a buffered project? Such a project
is depicted in Figure 8 that we call an expedited project.
Figure 8. Non-Buffered Expedited Project S-Curves
D M C
0 5 10 15 20 25 30 35 40 45 50 55 60 65 70 75 80 85 90 95 100
Duration Percent Complete
Com
plet
ion
Perc
enta
ge
0
10
20
30
40
50
60
70
80
90
100
10% ScheduleReduction
Engineering CompleteMaterials ReceivedConstruction Complete
Figure 7. Non-Buffered Project S-Curves
Duration Percent Complete
D M C
Com
plet
ion
Perc
enta
ge
0
10
20
30
40
50
60
70
80
90
100
0 5 10 15 20 25 30 35 40 45 50 55 60 65 70 75 80 85 90 95 100
Engineering CompleteMaterials ReceivedConstruction Complete

20
This scenario uses the accelerated design and material delivery
rates of the buffered project, while maintaining the short lead times
of the non-buffered project by heavily relying on production
planning to provide field coordination. The result is an approximate
10 percent reduction in project schedule. While the team did not
develop this project format in detail, it finds these results intriguing
in this era of ever-shortening schedules.

21
3
Conclusions
Comparison of Buffer and Production Planning Strategies
This research reveals distinct differences between the piping
and electrical crafts, in terms of efficacy of buffers to improve craft
productivity. These findings result from the many differences
between these two trades. The piping craft is typically a critical path
item and material deliveries are very sensitive to design schedules
and shop prefabrication. On the other hand, electrical work is
typically not a critical path item until late in the project, many
electrical materials do not require prefabrication, and many of its
bulk material items are available with short lead-times.
Consequently, piping work productivity showed an increased
sensitivity to variability in the level of production resources when
compared to electrical work productivity. Shielding production for
piping crafts is important, since late piping material delivery (or late
design that results in late material delivery) causes inefficiency,
crew dislocation, and work-around procedures. On the other hand,
increased expediting can often diminish the effect of late material
delivery for the electrical crafts. In fact, many of the projects in this
study established innovative relationships with electrical suppliers
that located electrical material warehouses on the project work site.
Both electrical and piping work productivity was extremely
sensitive to changes in the degree of planning and production
support available for the work crews. The implication is that
shielding production through planning efforts improved the flow of
work by either avoiding late or missing resources or providing
increased expediting and logistic support to overcome late or
missing resources.

22
In summary, for piping activities the conventional wisdom that
large buffers are useful improve productivity proved true. Relatively
larger stockpiles of design, piping materials, or construction
equipment all resulted in higher crew productivity for piping. Larger
buffers also improved the stability of crew performance. However,
the buffer strategy for electrical work did not appear to affect
productivity. The production planning strategy proved more
effective than buffers at improving crew productivity. In addition, it
was effective for both piping and electrical trades. For many years
the leaders in the construction industry have been touting the
benefits of project front-end planning. This study shows the benefits
of production planning in improving construction site productivity.
Commercial Building and Infrastructure Ramifications
Although this research was based upon industrial construction,
its findings can be transferred to other construction markets by
identifying project similarities. Piping work is less critical in typical
commercial building or infrastructure projects compared to process
construction. However, most construction projects have several
examples of materials that are also highly dependent on unique
design and prefabrication. For instance, structural steel, engineered
building skin, and pre-cast concrete elements are all examples of
design-dependent, long lead-time items.
On the other hand, numerous materials are similar to the
electrical bulk materials examined in this study. Plumbing, rebar,
and sheetmetal materials are similar to the electrical activities on an
industrial project because they all follow a structure’s erection and
do not regularly require prefabricated materials. In concept, these
findings should be applicable to building construction and
infrastructure projects. Although the sizes of buffers and planning
levels may differ from an industrial project, the underlying notions
remain the same.

23
Innovations
The following are innovations noted during the research that
may be applied to the construction process.
• Supply System Innovations — Several organizations(including CII’s Process Industry Practices) are investigatingbenefits of producing unique projects from standardcomponents. Modular designs and design where suppliershave increasing responsibility for design and componentintegration are becoming more commonplace. Designcollaboration between the engineer, supplier andconstructor are becoming feasible. For example, anelectrical supplier established, at their cost, a warehouse onthe project site and guaranteed one-day delivery of standardelectrical components. This is clearly a move to just-in-timematerial availability. On-site construction equipment rentalsuppliers offer guaranteed one day delivery and favorablerental terms in exchange for long term business.
• Core Production System Innovations — Some companiesare increasing worker involvement and providing training todevelop multi skilled personnel. Requirements for anexperienced, involved work force is at odds with the currentconstruction work force demographics. There appear to beopportunities to improve quality management. Theconstruction industry norm is to discover and correctmistakes rather than to avoid mistakes in the first place.While levels of constructability and project productionplanning are normal today, there continues to be little inputfrom construction workers. There appears to be increasingawareness of material management issues, but applicationof JIT and pull methods has not extended beyond delivery ofsimple materials. Minimal attention seems to be given toflow issues or concerns over process cycle time.
• Customer Relations Innovations — Several projects werebeing executed with alliance contracts established throughlong-term relationships between the owner and contractor.

24
This type of contracting arrangement provides fruitfulterritory for implementation of labor productivity enhancingmethods because both parties directly share in the gain.Also, the project environment should be more stable andpredictable where improvement efforts can be effectivelycontrolled and measured.

25
References
Diekmann, J. E. and Heinz, J., “Determinants of Jobsite
Productivity,” A Report to the Construction Industry Institute,
The University of Texas at Austin, Research Report 143-11,
January 2001.

Craft Productivity Improvement Research Team
* Calvin L. Barbaree, Celanese
Robert W. Bennett, M.W. Kellogg
* M. Douglas Braden, BE&K Engineering
Stephen D. Chanak, U.S. Steel
* David Clements, BMW Constructors
* James E. Diekmann, University of Colorado at Boulder
Jason J. Heinz, University of Colorado at Boulder
* John H. W. Haig, Black and Veatch Pritchard
* Richard P. Helper, Kværner Songer
* Michael J. Kiley, PSEG Energy Technologies
Christopher D. Lux, Commonwealth Edison
* Guido Persiani, Bayer, Chair
Michael W. Zeller, Eli Lilly
* Principal Authors
Editor: Rusty Haggard

Not printed with state funds
The Construction Industry Institute
The University of Texas at Austin
3208 Red River, Suite 300
Austin, Texas 78705-2650
(512) 471-4319
FAX (512) 499-8101

Bureau of Engineering Research
The University of Texas at Austin