consolidated financial results for the fiscal year …...forecast for the fiscal year ending march...
TRANSCRIPT
Note; This document is in English translation of “Kessan Tanshin” for the final Quarter of the Fiscal Year Ended March 31, 2020 and is provided solely for reference purposes. In the event of any inconsistency between the Japanese version and any English translation of it, the Japanese version will govern.
Consolidated Financial Results
for the Fiscal Year Ended March 31, 2020 May 14, 2020
Company name : NTT DATA CORPORATION (“NTTDATA”) Stock exchange on which the Company’s shares are listed : Tokyo Stock Exchange 1st Section Code number : 9613 URL : https://www.nttdata.com/global/en/ Representative : Yo Honma, President and Chief Executive Officer Contact : Hiroshi Setoguchi, Senior Executive Manager,
Investor Relations Office Tel.:+81-3-5546-8119
Scheduled date of the ordinary general meeting of shareholders : June 17, 2020 Scheduled date of dividend payment : June 18, 2020 Scheduled date of filing securities report : June 18, 2020 Supplemental material on annual results : Yes Presentation on annual results : Yes (for institutional investors and financial analysts)
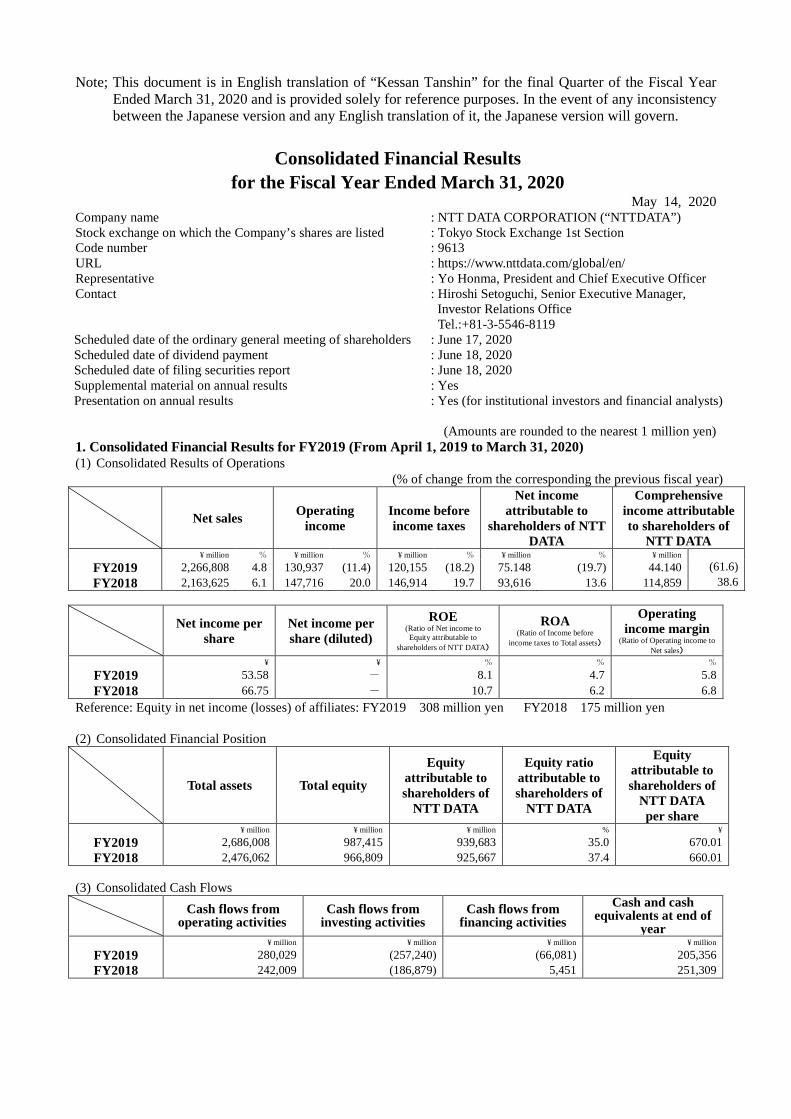
(Amounts are rounded to the nearest 1 million yen) 1. Consolidated Financial Results for FY2019 (From April 1, 2019 to March 31, 2020) (1) Consolidated Results of Operations
(% of change from the corresponding the previous fiscal year)
Net sales Operating income
Income before income taxes
Net income attributable to
shareholders of NTT DATA
Comprehensive income attributable to shareholders of
NTT DATA ¥ million % ¥ million % ¥ million % ¥ million % ¥ million
FY2019 2,266,808 4.8 130,937 (11.4) 120,155 (18.2) 75.148 (19.7) 44.140 (61.6) FY2018 2,163,625 6.1 147,716 20.0 146,914 19.7 93,616 13.6 114,859 38.6
Net income per share
Net income per share (diluted)
ROE (Ratio of Net income to Equity attributable to
shareholders of NTT DATA)
ROA (Ratio of Income before
income taxes to Total assets)
Operating income margin
(Ratio of Operating income to Net sales)
¥ ¥ % % %
FY2019 53.58 - 8.1 4.7 5.8 FY2018 66.75 - 10.7 6.2 6.8
Reference: Equity in net income (losses) of affiliates: FY2019 308 million yen FY2018 175 million yen (2) Consolidated Financial Position
Total assets Total equity
Equity attributable to shareholders of
NTT DATA
Equity ratio attributable to shareholders of
NTT DATA
Equity attributable to shareholders of
NTT DATA per share
¥ million ¥ million ¥ million % ¥
FY2019 2,686,008 987,415 939,683 35.0 670.01 FY2018 2,476,062 966,809 925,667 37.4 660.01
(3) Consolidated Cash Flows
Cash flows from operating activities
Cash flows from investing activities
Cash flows from financing activities
Cash and cash equivalents at end of
year ¥ million ¥ million ¥ million ¥ million
FY2019 280,029 (257,240) (66,081) 205,356 FY2018 242,009 (186,879) 5,451 251,309
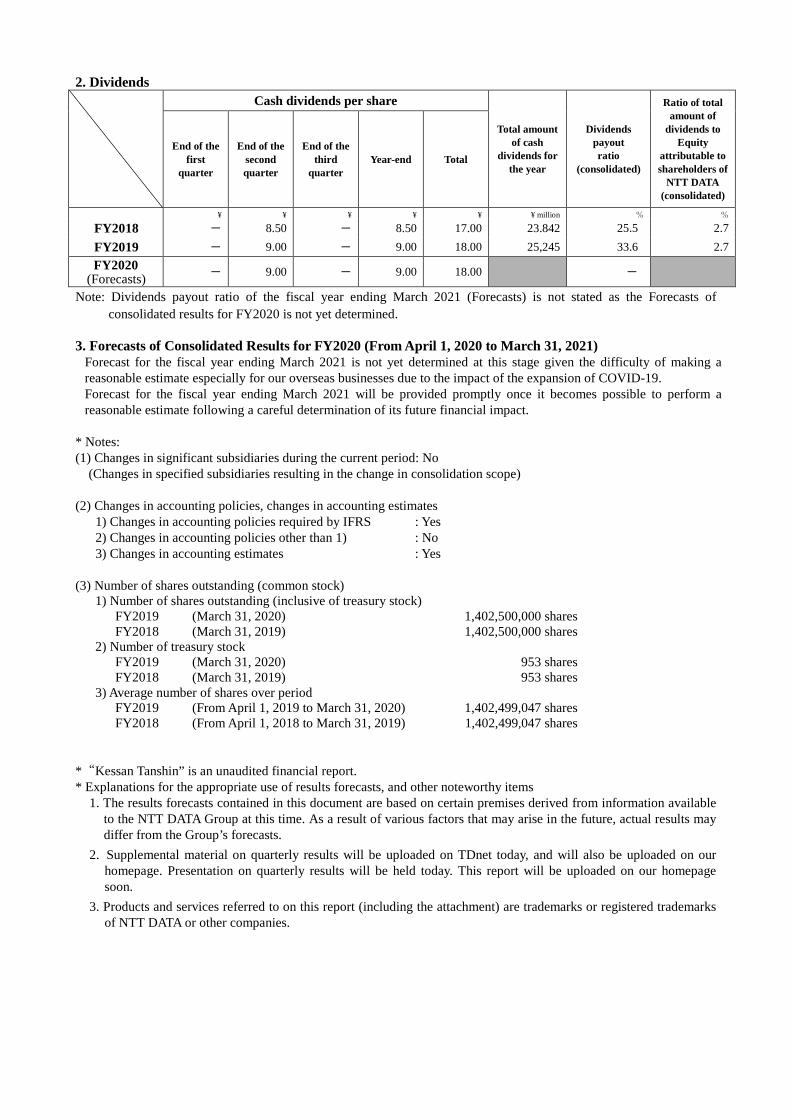
2. Dividends
Cash dividends per share
Total amount of cash
dividends for the year
Dividends payout ratio
(consolidated)
Ratio of total amount of
dividends to Equity
attributable to shareholders of
NTT DATA (consolidated)
End of the first
quarter
End of the second quarter
End of the third
quarter Year-end Total
¥ ¥ ¥ ¥ ¥ ¥ million % % FY2018 - 8.50 - 8.50 17.00 23.842 25.5 2.7 FY2019 - 9.00 - 9.00 18.00 25,245 33.6 2.7 FY2020
(Forecasts) - 9.00 - 9.00 18.00 -
Note: Dividends payout ratio of the fiscal year ending March 2021 (Forecasts) is not stated as the Forecasts of consolidated results for FY2020 is not yet determined.
3. Forecasts of Consolidated Results for FY2020 (From April 1, 2020 to March 31, 2021)
Forecast for the fiscal year ending March 2021 is not yet determined at this stage given the difficulty of making a reasonable estimate especially for our overseas businesses due to the impact of the expansion of COVID-19. Forecast for the fiscal year ending March 2021 will be provided promptly once it becomes possible to perform a reasonable estimate following a careful determination of its future financial impact.
* Notes: (1) Changes in significant subsidiaries during the current period: No
(Changes in specified subsidiaries resulting in the change in consolidation scope) (2) Changes in accounting policies, changes in accounting estimates 1) Changes in accounting policies required by IFRS : Yes 2) Changes in accounting policies other than 1) : No 3) Changes in accounting estimates : Yes (3) Number of shares outstanding (common stock)
1) Number of shares outstanding (inclusive of treasury stock) FY2019 (March 31, 2020) 1,402,500,000 shares FY2018 (March 31, 2019) 1,402,500,000 shares
2) Number of treasury stock FY2019 (March 31, 2020) 953 shares FY2018 (March 31, 2019) 953 shares
3) Average number of shares over period FY2019 (From April 1, 2019 to March 31, 2020) 1,402,499,047 shares FY2018 (From April 1, 2018 to March 31, 2019) 1,402,499,047 shares
* “Kessan Tanshin” is an unaudited financial report. * Explanations for the appropriate use of results forecasts, and other noteworthy items
1. The results forecasts contained in this document are based on certain premises derived from information available to the NTT DATA Group at this time. As a result of various factors that may arise in the future, actual results may differ from the Group’s forecasts.
2. Supplemental material on quarterly results will be uploaded on TDnet today, and will also be uploaded on our homepage. Presentation on quarterly results will be held today. This report will be uploaded on our homepage soon.
3. Products and services referred to on this report (including the attachment) are trademarks or registered trademarks of NTT DATA or other companies.
1
Contents of Attachment 1.Overview of Business Results ···························································································· 2
(1) Analysis on Business Results of the Current Fiscal Year ························································ 2 (2) Analysis on Financial Conditions of the Current Fiscal Year………………………………………………13 (3) Analysis on Cash Flow of the Current Fiscal Year…………………………………………………………13 (4) Forecast for the Next Term ···························································································· 14
2.The Basic Stance Concerning The Selection of Accounting Standards ············································ 14 3.Matters on Summary Information (Notes) ············································································· 15
(1) Changes in accounting policies ····················································································· 15 (2) Changes in accounting estimates ····················································································· 15
4.Consolidated Financial Statements and major notes ··································································· 17 (1) Consolidated Statement of Financial Position ······································································ 17 (2) Consolidated Statements of Income and Comprehensive Income ··············································· 19 (3) Consolidated Statement of Changes in Equity ······································································ 21 (4) Consolidated Statement of Cash Flows ·············································································· 22 (5) Notes to Consolidated Financial Statements ······································································· 23
(Notes to Going Concern Assumptions) ········································································· 23 (Segment information) ······························································································ 23 (Business combination) ····························································································· 25 (Per share information) ····························································································· 28
2
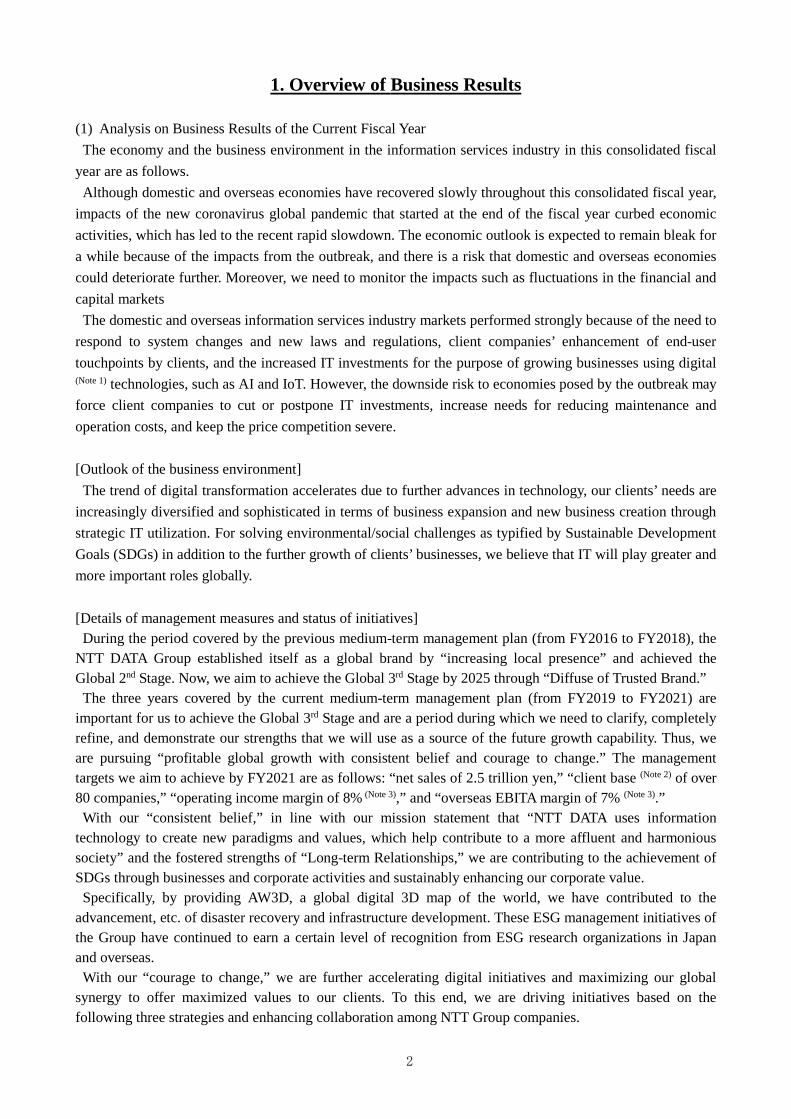
1. Overview of Business Results (1) Analysis on Business Results of the Current Fiscal Year The economy and the business environment in the information services industry in this consolidated fiscal
year are as follows. Although domestic and overseas economies have recovered slowly throughout this consolidated fiscal year,
impacts of the new coronavirus global pandemic that started at the end of the fiscal year curbed economic activities, which has led to the recent rapid slowdown. The economic outlook is expected to remain bleak for a while because of the impacts from the outbreak, and there is a risk that domestic and overseas economies could deteriorate further. Moreover, we need to monitor the impacts such as fluctuations in the financial and capital markets
The domestic and overseas information services industry markets performed strongly because of the need to respond to system changes and new laws and regulations, client companies’ enhancement of end-user touchpoints by clients, and the increased IT investments for the purpose of growing businesses using digital (Note 1) technologies, such as AI and IoT. However, the downside risk to economies posed by the outbreak may force client companies to cut or postpone IT investments, increase needs for reducing maintenance and operation costs, and keep the price competition severe.
[Outlook of the business environment]
The trend of digital transformation accelerates due to further advances in technology, our clients’ needs are increasingly diversified and sophisticated in terms of business expansion and new business creation through strategic IT utilization. For solving environmental/social challenges as typified by Sustainable Development Goals (SDGs) in addition to the further growth of clients’ businesses, we believe that IT will play greater and more important roles globally. [Details of management measures and status of initiatives] During the period covered by the previous medium-term management plan (from FY2016 to FY2018), the
NTT DATA Group established itself as a global brand by “increasing local presence” and achieved the Global 2nd Stage. Now, we aim to achieve the Global 3rd Stage by 2025 through “Diffuse of Trusted Brand.” The three years covered by the current medium-term management plan (from FY2019 to FY2021) are
important for us to achieve the Global 3rd Stage and are a period during which we need to clarify, completely refine, and demonstrate our strengths that we will use as a source of the future growth capability. Thus, we are pursuing “profitable global growth with consistent belief and courage to change.” The management targets we aim to achieve by FY2021 are as follows: “net sales of 2.5 trillion yen,” “client base (Note 2) of over 80 companies,” “operating income margin of 8% (Note 3),” and “overseas EBITA margin of 7% (Note 3).”
With our “consistent belief,” in line with our mission statement that “NTT DATA uses information technology to create new paradigms and values, which help contribute to a more affluent and harmonious society” and the fostered strengths of “Long-term Relationships,” we are contributing to the achievement of SDGs through businesses and corporate activities and sustainably enhancing our corporate value. Specifically, by providing AW3D, a global digital 3D map of the world, we have contributed to the
advancement, etc. of disaster recovery and infrastructure development. These ESG management initiatives of the Group have continued to earn a certain level of recognition from ESG research organizations in Japan and overseas.
With our “courage to change,” we are further accelerating digital initiatives and maximizing our global synergy to offer maximized values to our clients. To this end, we are driving initiatives based on the following three strategies and enhancing collaboration among NTT Group companies.
3
With “Strategy 1: Expand global digital offerings (Note 4),” we maximize our global synergy in the digital
field, create tools we need to compete, and sophisticate our method of competing. Specifically, we are committed to the acceleration of global marketing, development of digital offerings through proactive investments, and expansion of our Center of Excellence (CoE (Note 5)).
As part of our efforts to accelerate global marketing, we formed the Global One Team to establish strategies across the globe, make proposals and provide support to clients doing business on a global basis (global accounts) more promptly, promote sharing and making use of digital success stories, and enhance global marketing. In FY2019, as a result of these activities, we successfully won multiple contracts with clients doing business globally.
As part of our efforts to create offerings through proactive investments, we established the Digital Strategy Office (DSO), an organization to accelerate the entire company’s digital businesses, and have promoted the creation of offerings in the global focus areas. In FY2019, we announced “Catch&Go,” a digital store without a cash register developed through DSO's efforts, and have received a tremendous number of inquiries from clients in distribution and retail businesses, including major convenience stores.
For the expansion of our CoE, we have globally promoted sharing and rollout of digital technologies such as Blockchain, Digital Design, DevOps (Note 6), and AI and expertise in them. In FY2019, the efforts greatly contributed to the order receipt and the development of services utilizing Blockchain, Digital Design, and DevOps. The AI CoE, which was established in FY2019, has also produced results such as Proof of Concepts with clients.
With “Strategy 2: Deliver greater value to clients based on regional needs,” we continue to provide attractive values to clients based on regional needs.
In Japan, the NTT DATA Group's strength is in the existing system domain based on Long-Term Relationships with clients, and in North America and Europe, it is in the ITO and other outsourcing businesses. By combining these strengths with digital technologies, we are creating new values. These efforts have led to orders for multiple large-scale projects, including those for core systems of government agencies, financial institutions, and corporate clients in Japan and to an increase in orders for large projects from new clients, as well as to more sophisticated and efficient services for existing clients in North America and Europe.
With “Strategy 3: Unleash our employees’ potential that maximizes organizational strength,” we enable each employee to achieve self-actualization and enhance organizational capabilities to implement Strategies 1 and 2. The NTT DATA Group aims for all employees to develop the ability to utilize digital technologies. In FY2019, we developed a training program to cultivate human resources that utilized digital technologies and changed several human resources systems; for example, by certifying the first ADP (Note 7) employee, introducing the TG system (Note 8), and so forth. Furthermore, we have focused on the work-style reform through digital technology utilization and introduced a mechanism of digital knowledge sharing to have contents and know-how shared internally.
To drive NTT Group Collaboration, we aim to generate One NTT Synergies, such as technology utilization and cross-selling. The NTT DATA Group continues to engage in the penetration and rollout of “WinActor” (Note 9), an RPA solution developed by NTT Laboratories, in a cross-sectional manner, and the number of clients who introduced the solution exceeded 2,800 in FY2019.
We will accelerate these efforts to achieve our management goals for FY2021, which is the last fiscal year under the current medium-term management plan, and the Global 3rd Stage by 2025.
4
[Status of business activities and results] We strove to expand businesses in the global market to respond to the acceleration of digital transformation initiatives on a global basis and meet diversified and sophisticated needs. We also made efforts to expand diverse IT services including digital offering and system integration in response to market changes and to stably provide such services. For the current fiscal year, the expansion of robust domestic and overseas businesses contributed to a record high new orders received and net sales growth for 31 consecutive years. Operating income decreased due to re-evaluation of overseas businesses with low profitability, etc. in addition to structural transformation and growth investments, which had already been scheduled at the beginning of the fiscal year. ・New Orders Received 2,275.2 billion yen (up 9.6% year-on-year) ・Net Sales 2,266.8 billion yen (up 4.8% year-on-year) ・Operating Income 130.9 billion yen (down 11.4% year-on-year) ・Income before income taxes 120.2 billion yen (down 18.2% year-on-year) ・Net income attributable to shareholders of
NTT DATA 75.1 billion yen (down 19.7% year-on-year)
The following are summaries of initiatives by segment. [Public & Social Infrastructure Segment] We aimed for receiving system renewal orders for core businesses from governments and infrastructure
companies, and made efforts to grow our business through the following methods: creating new businesses by utilizing the results and know-how that our group has cultivated and realizing a new public-private social system in accordance with Growth Strategy based on Society 5.0 and the Digital Government Action Plan. < Launching the core system services for the Japan Patent Office > In January 2020, we launched services for the function that assigns patent classifications on the publication of unexamined patent applications and others, which is one of the most important systems related to examination of patents and others, with the goal of “optimizing operations and systems of the Japan Patent Office” in accordance with the Ministry of Economy, Trade and Industry’s mid-and long-term plans for the digital government. < Promoting digital business using sophisticated map information > We promoted businesses to use sophisticated map information for diversified purposes. ・In July 2019, we began providing a 3D map covering all global land spaces with 2.5 m resolution, as part of the service for the world's most precise 3D map using satellite images, AW3D Full Global 3D Map, with Remote Sensing Technology Center of Japan. This service enables more accurate simulations and analysis for worldwide urban designing, prediction of damages caused by natural disaster, and so on. ・The Cabinet Office appreciated our high technological capabilities and knowledge related to the system for creating and updating highly precise 3D maps and processing of vehicle probe data (Note 10) that self-driving cars collect while moving. As a result, we were allowed to participate in the Cross-ministerial Strategic Innovation Promotion Program led by the Office.
5
< Promoting digital business in the healthcare field > To help medical institutions conduct operations more quickly and efficiently, we promoted the development of a medical information platform using cutting-edge IT technologies. ・In April 2019, we began providing MD-TraC, an IoT platform for medical materials, which collectively manages logistics and usage information of medical materials with an RFID tag (Note 11) stuck on each material to record ID for individual identification. This service helps manufacturing and sales companies cut inventory and reduce disposal loss and supports sales agencies in increasing operational efficiency of placing and receiving orders. ・In June 2019, we provided CHUGAI PHARMACEUTICAL CO., LTD., with L-AXeS, a shared service that enables secure online test requests and result reports between medical institutions and clinical laboratory companies. Moreover, in January 2020, we started providing a service connecting L-AXeS with major electronic health record services so that medical institutions can exchange test data with clinical laboratory companies via a secure network without having to install new lines and equipment. The results of the Public and Social Infrastructure Segment for this fiscal year are as follows ・The net sales was 500.2 billion yen (4.2% increase compared to the previous fiscal year) due mainly to the expansion in the scale of services for the central government and related agencies and telecom and utility industries. ・The operating income was 52.8 billion yen (20.4% increase compared to the previous fiscal year) due mainly to sales growth and a decrease in the amount of loss from unprofitable projects. [Financial Segment] Deregulations and technological innovations are bringing a great change to the business environment of financial institutions. Financial services taking advantage of digital technologies are emerging, with diversified players joining the financial business. Under such circumstance, we continued to offer highly reliable and high-quality services to our clients. We also sought to expand our business as a trusted financial IT platformer in the digital age, anticipating changes of the times. < Promoting efforts for upgrading a shared system > ・In May 2019, we reached an agreement with five banks; The Bank of Yokohama, Ltd., THE HOKURIKU BANK, LTD., The Hokkaido Bank, Ltd., The 77 Bank, Ltd., and HIGASHI-NIPPON BANK, Ltd., to consider the use of a highly flexible open platform as the number one option to deliver the new service more quickly for the next generation of the shared system, MEJAR, for which NTT DATA provides services. <Promoting a wide range of efforts using cutting-edge technologies to provide financial services in the digital era > To create new financial businesses by accumulating and leveraging information using digital technologies, we promoted a wide range of digital businesses. ・In June 2019, we began providing Customer Engagement Hub, an integrated contact channel solution, for call center operations at THE YAMAGUCHI BANK, Ltd. This solution helps the bank enhance productivity
6
and raise the level of customer satisfaction by providing AI support for operators and integrating and analyzing data collected from various inquiry channels, including call centers and websites. ・In January 2020, NTT DATA signed a Memorandum of Intent encouraging the realization of trade digitalisation at a forum that was held during the World Economic Forum (2020 Davos Conference). As trade-related companies face a problem in securing mutual connectivity between trade platforms, we will participate in discussions and contribute to the international standardization of the mutual connectivity. ・In February 2020, as a regional revitalization project, we launched a Proof of Concept (“PoC”) on sharing economy with The Bank of Yokohama, Ltd. The PoC focused on “skill sharing,” where individuals’ skills, experiences, knowledge, and others are exchanged, and verified its effect with the participation of the bank and NTT DATA The results of the Financial Segment for this fiscal year are as follows ・The net sales was 580.4 billion yen (3.8% increase compared to the previous fiscal year) due mainly to the
expansion in the scale of services for financial institutions. ・The operating income was 50.4 billion yen (4.8% decrease compared to the previous fiscal year) due
mainly to the occurrence of unprofitable projects, despite an increase due to sales growth. [Enterprise & Solutions Segment] The further acceleration of trends in digital usage and the rise in demand for enhanced global competitiveness have greatly changed the business environments of manufacturers, distributors, and service providers. While responding to these changes, we continued to provide highly added values that bring business and advanced professional technology together and support growth in our clients’ businesses, so that we can further expand our business. < Promoting payment-related business and designing new customer experience > In areas related to cashless payment, we provided new services that are more convenient for consumers. ・In September 2019, we began providing “Catch&Go,” a service to help businesses open a digital store where consumers can pick up items they want from the store without the need to pay at a cashier. Furthermore, in January 2020, we added to this service a function that allows consumers to enter the stores by face recognition and a dynamic pricing function that enables changing prices on the basis of information on its inventory. With the realization of a digital store without a cashier, consumers can enjoy convenient and beneficial shopping experience, and stores and store management companies can increase operational efficiency, maximize purchase opportunities, and use information for marketing. ・In February 2020, we began providing full support for the introduction of cashless payment service by JAPAN POST Co., Ltd., with Sumitomo Mitsui Card Company, Limited, and Panasonic System Solutions Japan Co., Ltd. We will install 14,000 payment terminals at the counters of about 8,500 post offices and help JAPAN POST Co., Ltd., promote its transition to cashless transactions. As the payment infrastructure, “CAFIS Arch” (Note 12), a cloud-based comprehensive payment platform provided by NTT DATA, was adopted.
7
< Installing filtration planning system using digital technologies at Kirin Brewery’s factories > NTT DATA and Kirin Brewery Company, Limited jointly developed a system that creates the most suitable beer filtration plan by using digital technologies. In April 2019, the system started full operation at Kirin Brewery’s Fukuoka Factory. Then, the companies standardized the system and started trial operation at factories in Yokohama and Shiga in January 2020. Filtration planning at a brewery often depends on the expertise of skilled workers who consider various conditions. To develop this system, we interviewed the skilled workers to identify a variety of constraints and used the constraint programming technology (Note 13) to standardize their expertise. We expect that this system will reduce the working time by a maximum of about 2,500 hours per year for the three factories in Fukuoka, Yokohama, and Shiga in total. The results of the Enterprise & Solutions Segment for this fiscal year are as follows ・The net sales was 588.6 billion yen (11.1% increase compared to the previous fiscal year) due mainly to the expansion in the scale of services for manufacturing industry and payment business including M&A. ・Operating income was 53.5 billion yen (10.3% increase compared to the previous fiscal year) due mainly to sales growth. [North America Segment] Towards sustainable growth in North America that is the world’s largest IT services market, we accelerated advanced-technology-enabled innovations and enhanced offerings in the digital domain. These helped us to improve our capacity to respond to our clients’ needs. We also promoted M&A to expand our business, increase our presence, and improve profitability. < Won multiple contracts supporting Digital Transformation for a large U.S. bank and a large U.S.-based health plan through the enhancement of Digital Offerings > NTT DATA Services, a subsidiary of NTT DATA Corporation, won multiple deals supporting Digital Transformation as a result of initiatives to strengthen digital offerings through investments in innovation. ・For the deal with the large U.S. bank, NTT DATA Services has a long relationship with the client and successfully differentiated our digital services and track record to support the client’s digital transformation through a migration to cloud, microservices architecture (Note 14) for banking products (payment, online banking, etc) and UX design (Note 15). ・For the deal with the large U.S.-based health plan, NTT DATA Services demonstrated our deep knowledge of the health care payer domain. NTT DATA Services contributes to the client through the test automation for Synthetic Data and Performance Testing in the development and deployment process at a faster pace. < New solutions to help tackle Novel Coronavirus (COVID-19) > NTT DATA Services, a subsidiary of NTT DATA Corporation, continues delivering insights and new solutions for healthcare institutions and governments though COVID-19 is overburdening our healthcare system. ・NTT DATA Services and Enli, a population health management software company, are working together to
8
deliver a patient management program. This program allows clinical users to assess symptomatic individuals. In addition, it facilitates periodic care coordination check-in to detect worsening symptoms, as well as making decisions on when to discharge individuals from isolation. NTT DATA Services serves as a systems integrator, providing technical, staff augmentation and consulting services. ・Sharecare, the digital health company, announced the launch of an interactive COVID-19 screener, developed in partnership with IPsoft and NTT DATA Services. It is an interactive conversational solution powered by IPsoft’s cognitive AI, “Amelia” (Note 16). It allows people to get answers quickly and anonymously without having to wait, helping them understand the severity of their risks. It contributes to reducing the spread of COVID-19 while easing the strain on healthcare providers. ・The City of Austin announced a new digital tool that allows citizens to electronically schedule COVID-19 tests, created in partnership with NTT DATA. It is hosted on a secured platform and enable the city to securely trace anonymized positive results to assess testing demand and identify high-risk areas. In addition, the anonymized data will be compiled into an “heat map,” which will indicate areas having a greater need of health resources and proactively allocate resources to necessary areas. The results of the North America Segment for this fiscal year are as follows ・The net sales was 426.0 billion yen (1.0% increase compared to the previous fiscal year) due mainly to the expansion of scale from M&A, despite the negative impact from yen appreciation in foreign exchange. ・The operating income was 3.2 billion yen (7.1% decrease compared to the previous fiscal year) due mainly to a decrease of PMI cost and the expansion of scale from M&A, despite an increase of costs for business expansion and amortization of PPA. [EMEA & LATAM Segment] While gathering the strengths of the group companies, we optimized resources to further promote integrated business management and develop synergistic effects. To enhance our capacity to provide more services in the digital field, we focused on investments in M&A and new solutions development. < Large-scale SAP service agreement with Deutsche Bahn AG > In February 2020, NTT DATA EMEA Ltd., a subsidiary of NTT DATA Corporation, signed a SAP service agreement with Deutsche Bahn AG (German Railway) in collaboration with itelligence AG, another subsidiary of NTT DATA Corporation. The agreement is of large-scale, which will last for three years. The future target architecture at DB in the SAP environment will be aligned with the core processes of vehicle and infrastructure maintenance that are to be harmonized. The large number of current SAP applications will be greatly reduced and the processes in these areas will be aligned with the SAP standard as far as possible. The companies will be providing consulting, application development, and other services for implementing SAP S/4HANA (Note 17) and will be supporting the client’s digital strategy in the SAP environment. The client chose NTT DATA because of its high recognition of NTT DATA Group’s strengths such as its track record and reliability that comes from providing SAP related services over a long period of time. Furthermore, NTT
9
DATA convinced with its rich talent pool of experts with advanced knowledge and its flexible attitude toward various requests from clients. < Moving forward as a partner for digitalization of clients’ businesses > NTT DATA was highly recognized for its Long-Term Relationship with its clients, its rich experiences in the digital transformation of their businesses and its positive attitude toward the use of advanced technologies, and was selected as a strategic partner in multiple projects. ・In March 2020, everis Group, a subsidiary of NTT DATA Corporation, signed service agreements with Naturgy Energy Group, SA, which provides gas and electricity mainly in Europe and Latin America, after it was selected as a strategic partner for its digital transformation. The Group will be providing services using cutting-edge technologies for maintenance, operation, and so forth of systems related to gas and electricity distribution. The total net sales in the next 10 years is expected to amount to about 500 million euros. ・In November 2019, NTT DATA UK Limited, a subsidiary of NTT DATA Corporation, has signed a new partner agreement for digital transformation, which will last for five years with a total value of approximately 50 million pounds, with The Association of Chartered Certified Accountants (“ACCA”), the global body for professional accountants. The Company plans to streamline operations such as global accountancy certification for ACCA which is aiming to transform into a digitally-enabled, global organization, and will be providing support for its members’ career development at the same time. The results of the EMEA & LATAM Segment for this fiscal year are as follows ・The net sales was 455.4 billion yen (3.5% increase compared to the previous fiscal year) due mainly to the expansion of scale mainly in businesses in Spain and Italy, despite a decrease due to the negative impact from yen appreciation in foreign exchange. ・The operating income was -14.4 billion yen ( - % compared to the previous fiscal year) due mainly to an increase of costs for structural transformation, including the re-evaluation of businesses with low profitability, and partial re-evaluation of business in Brazil, despite an increase due to sales growth
The status of major overseas offices at the end of this fiscal year is as follows Approx.94,300 employees deployed in 225 cities in 53 countries and regions outside of Japan. (Approx.133,000 employees include Japan) (AS of March 31, 2020)
10
Progress of technical development We work on the “promotion of cutting-edge technologies and innovations,” in which we actively
incorporate new technological trends in business to survive in the fierce global competition. We also conduct R&D related to “production technology innovations,” in which we accelerate and enhance the quality of system developments, build cloud platforms for cloud computing and digitalization, and so forth. In our medium-term management plan, we will build a foundation on which we will globally consolidate and utilize expertise and know-how on state-of-the-art technologies to promote innovations and refine production technologies of the next generation. Through collaborative R&D with NIPPON TELEGRAPH AND TELEPHONE CORPORATION (NTT),
we utilize the results for fundamental R&D themes to focus our resources on applied R&D themes. The R&D costs for the consolidated fiscal year under review were 21,793 million yen. The results of the
R&Ds, which are commonly applicable to the Public & Social Infrastructure, the Financial, the Enterprise & Solutions, the North America and the EMEA & LATAM segments, are not separately recorded by each segment. < Setting up a global center of AI technologies and establishing AI Guidelines > In accordance with the strategy, “Expand global digital offerings,” under the Medium-term Management Plan, NTT DATA has been committing to the expansion of Center of Excellence (“CoE”) (Note 5) across the world and, in May 2019, set up AI CoE as part of the effort. AI CoE is a base to globally provide support for the expansion of digital business using functions to globally accumulate knowledge, train employees, offer technological support, and provide assets (intellectual property) related to AI. With the establishment of the AI CoE, we now have CoEs in four areas: Blockchain, Digital Design, DevOps, and AI. Additionally, NTT DATA established NTT DATA Group’s AI Guidelines that embody our approach to contribute to the realization of “a more affluent and harmonious society” where human beings and AI coexist (“AI society”). In accordance with the guidelines, to realize the AI society where all concerned parties including clients can enjoy the benefit of AI instead of merely using AI as a tool to secure efficiency, we will promote AI research, development, operation, utilization, and so on. < Promoting AI-based image diagnosis solution in the medical field through collaboration between industry and academia > We developed an AI-based image diagnostic support solution that assists physicians’ diagnosis by analyzing medical images of patients with AI technologies and showing where diseases may be located.
・In August 2019, NTT DATA and the University of Miyazaki conducted a PoC to detect any abnormality in the kidney with the AI-based image diagnostic support solution. Consequently, it was confirmed that this solution could be applied to patients of different races having different lifestyles from several countries and detect diseases, especially cancer, with a high degree of precision.
・In November 2019, NTT DATA and MED SUPPORT SYSTEMS CO., LTD, launched a PoC to make the AI-based image diagnostic support solution commercially viable in the field of MRI brain-image diagnosis. In this PoC, we developed an AI-based diagnostic support engine and a viewer to verify the effectiveness of the AI-based diagnostic support for MRI brain-images using MED SUPPORT SYSTEMS CO., LTD’s know-how on image diagnosis information systems and NTT DATA’s AI technologies, and assessed their usability.
11
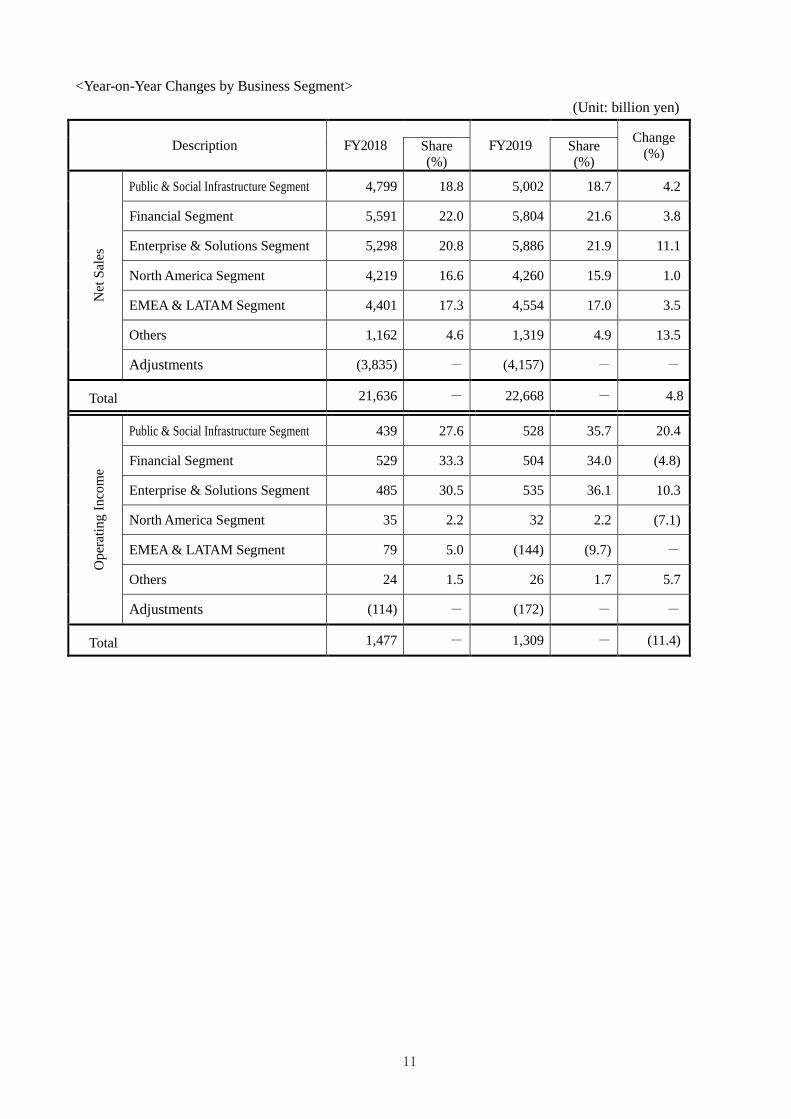
<Year-on-Year Changes by Business Segment> (Unit: billion yen)
Description FY2018
FY2019 Change
(%) Share (%)
Share (%)
Net
Sal
es
Public & Social Infrastructure Segment 4,799 18.8 5,002 18.7 4.2
Financial Segment 5,591 22.0 5,804 21.6 3.8
Enterprise & Solutions Segment 5,298 20.8 5,886 21.9 11.1
North America Segment 4,219 16.6 4,260 15.9 1.0
EMEA & LATAM Segment 4,401 17.3 4,554 17.0 3.5
Others 1,162 4.6 1,319 4.9 13.5
Adjustments (3,835) - (4,157) - -
Total 21,636 - 22,668 - 4.8
Ope
ratin
g In
com
e
Public & Social Infrastructure Segment 439 27.6 528 35.7 20.4
Financial Segment 529 33.3 504 34.0 (4.8)
Enterprise & Solutions Segment 485 30.5 535 36.1 10.3
North America Segment 35 2.2 32 2.2 (7.1)
EMEA & LATAM Segment 79 5.0 (144) (9.7) -
Others 24 1.5 26 1.7 5.7
Adjustments (114) - (172) - -
Total 1,477 - 1,309 - (11.4)
12
(Note 1) Digital (Digital transformation) A concept used to express the way of thinking that IT penetration will change all aspects of people’s lives in a positive way. It aims to realize a society where social systems are redeveloped and become simpler by using cloud, mobility, and social technologies, and the explosive increase in data volume with IoT turns into intelligence that helps people live their lives through AI utilization. (Note 2) Included are the clients from whom we earn annual net sales of 5 billion yen or more (Japan) or 50 million U.S. dollars or more (outside of Japan). (Note 3) Excluding temporary costs such as M&A, structural transformation and so on. (Note 4) Digital offerings Products or services we provide to our clients by utilizing leading-edge technologies. (Note 5) CoE (Center of Excellence) A base that conducts advanced R&D activities and plays a central role in creating and developing human resources and businesses. (Note 6) DevOps A system that consists of tools and development methods that allow the development and operation teams to work together to meet clients’ requirements for systems with high quality, flexibility, and in a short period of time. (Note 7) ADP (Advanced Professional) A system under which the Company recruits outstanding human resources from outside with excellent expertise in AI, IoT, cloud, and other advanced technology fields and the consulting field and compensates them according to market value. (Note 8) TG (Technical Grade) system A system under which the Company makes the best use of and evaluate the potential abilities of human resources with specialized skills. (Note 9) WinActor Winactor is an RPA solution developed by NTT Advanced Technology Corporation based on the technology of NTT Access Service Systems Laboratories, and provided by NTT DATA as a distributor. (Note 10) Vehicle probe data Location and traffic information that vehicles collect using their sensors while moving. (Note 11) RFID tag A tag that transmits data such as IDs via short-range wireless communication. (Note 12) “CAFIS Arch” A cloud-based cashless payment platform that has the largest number of users in Japan and can deal with all types of payment, including credit card payment, payment made by inbound tourists, and QR code payment. (Note 13) Constraint Programming Technology It is a technology that uses computers to efficiently find answers to problems related to schedule of production planning and delivery that satisfy constraints, and the technology is defined as AI.. (Note 14) Microservices architecture A method of designing a highly flexible system that can easily adapt to changes by combining small services divided into each function. (Note 15) UX design An approach for designing functions, specifications, interfaces, and others in order to enhance the experience of a user of a service, etc. (Note 16) “Amelia” Amelia is an industry-leading cognitive AI developed by IPsoft. (Note 17) “SAP S/4HANA” A corporate digital solution equipped with flexibility and scalability for rich features and customization, which enables quick retrieval of latest information via integrated database.
13
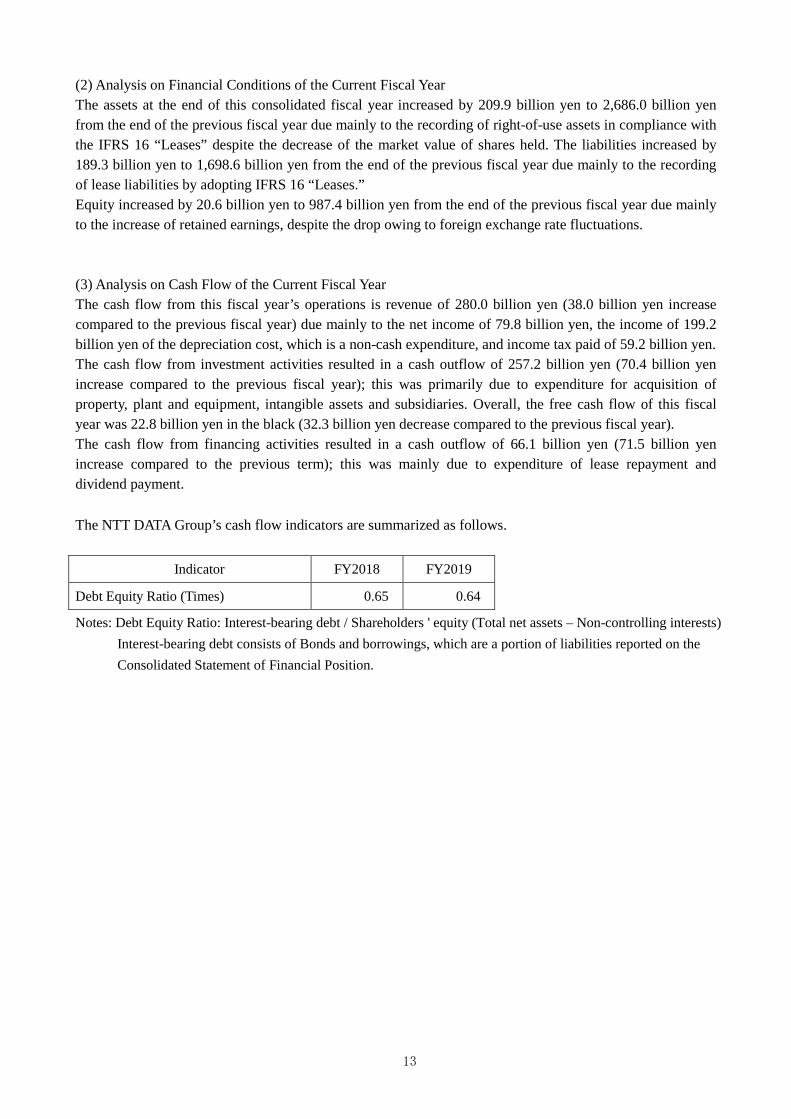
(2) Analysis on Financial Conditions of the Current Fiscal Year The assets at the end of this consolidated fiscal year increased by 209.9 billion yen to 2,686.0 billion yen from the end of the previous fiscal year due mainly to the recording of right-of-use assets in compliance with the IFRS 16 “Leases” despite the decrease of the market value of shares held. The liabilities increased by 189.3 billion yen to 1,698.6 billion yen from the end of the previous fiscal year due mainly to the recording of lease liabilities by adopting IFRS 16 “Leases.” Equity increased by 20.6 billion yen to 987.4 billion yen from the end of the previous fiscal year due mainly to the increase of retained earnings, despite the drop owing to foreign exchange rate fluctuations. (3) Analysis on Cash Flow of the Current Fiscal Year The cash flow from this fiscal year’s operations is revenue of 280.0 billion yen (38.0 billion yen increase compared to the previous fiscal year) due mainly to the net income of 79.8 billion yen, the income of 199.2 billion yen of the depreciation cost, which is a non-cash expenditure, and income tax paid of 59.2 billion yen. The cash flow from investment activities resulted in a cash outflow of 257.2 billion yen (70.4 billion yen increase compared to the previous fiscal year); this was primarily due to expenditure for acquisition of property, plant and equipment, intangible assets and subsidiaries. Overall, the free cash flow of this fiscal year was 22.8 billion yen in the black (32.3 billion yen decrease compared to the previous fiscal year). The cash flow from financing activities resulted in a cash outflow of 66.1 billion yen (71.5 billion yen increase compared to the previous term); this was mainly due to expenditure of lease repayment and dividend payment. The NTT DATA Group’s cash flow indicators are summarized as follows.
Indicator FY2018 FY2019
Debt Equity Ratio (Times) 0.65 0.64
Notes: Debt Equity Ratio: Interest-bearing debt / Shareholders ' equity (Total net assets – Non-controlling interests) Interest-bearing debt consists of Bonds and borrowings, which are a portion of liabilities reported on the Consolidated Statement of Financial Position.
14
(4) Forecast for the Next Term [Forecast for Fiscal Year Ending March 31, 2021] FY2020 is the second year of the Medium-Term Management Plan, which will end in FY2021. To achieve the “Global 3rd Stage,” under the key principle of “Pursuing profitable global growth with consistent belief and courage to change”, we will aim to secure orders from Japanese and overseas clients without fail by meeting their IT investment needs, restrain unprofitable projects and reduce the Group’s overall costs, and continue investments that will contribute to sustainable growth such as investments in new fields for the shift to the digital society. Some business activities have been sluggish owing to the COVID-19 outbreak. However, our key businesses, large-scale systems and software development in Japan, integrated IT solutions and maintenance support services both in Japan and overseas countries, have been less affected, and we are steadily working on projects for which we have already won contracts. For the business forecast for the fiscal year ending March 31, 2021, as there are many uncertainties brought about by the outbreak, we will carefully assess the impacts on our business performance in the future and publish an updated forecast as soon as a reasonable estimate becomes possible. Notes: This material contains descriptions of future plans and strategies and of forecasts and projections
relating to business performance. These descriptions reflect certain assumptions derived from judgments based on information currently available to the NTT DATA Group. The material also incorporates an unquantifiable degree of risk and uncertainty relating to factors such as economic trends, the fierce competition within the information service industry, market demand, and the tax and other systems. In view of this, excessive reliance should not be placed on these results or forecasts, and it should be noted that actual results may differ from the NTT DATA Group's forecasts.
2. The Basic Stance Concerning the Selection of Accounting Standards NTT DATA has adopted International Financial Reporting Standards (IFRS) since the 1st quarter of the fiscal year ended March 31, 2019. In order to prepare appropriate consolidated financial statements in accordance with IFRS, we have prepared group accounting policies and other information in accordance with IFRS, and have adopted accounting procedures based on these policies.
15
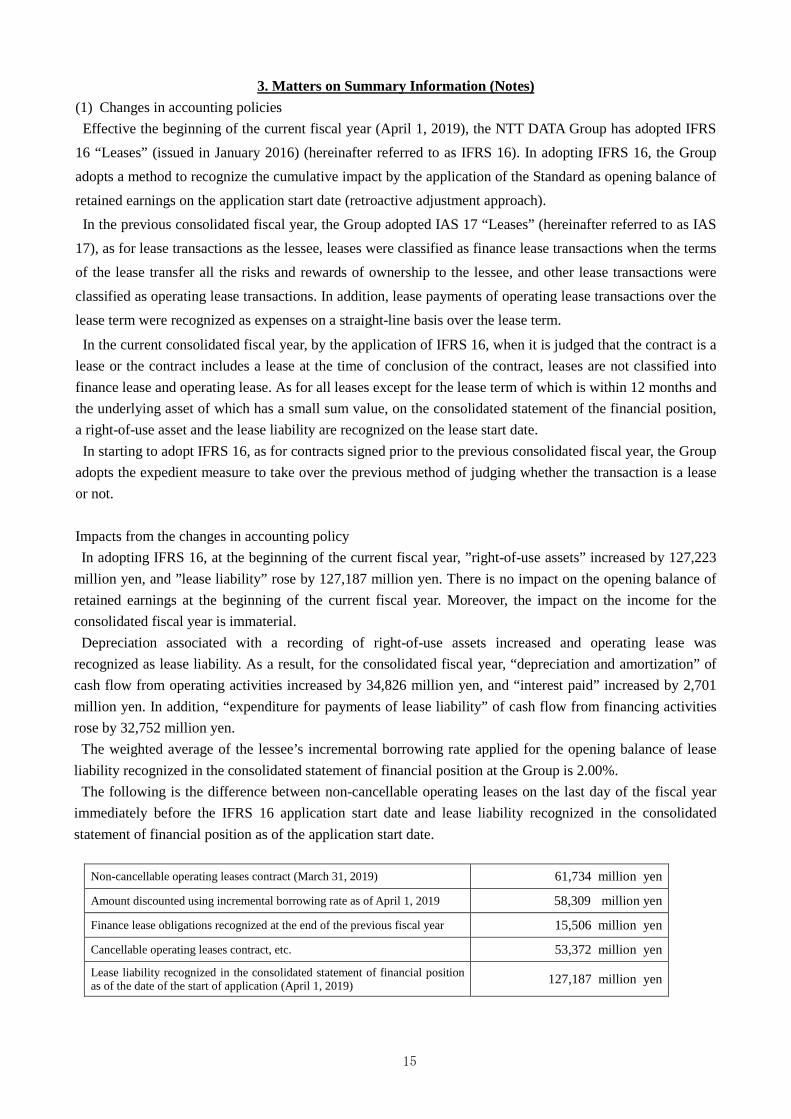
3. Matters on Summary Information (Notes) (1) Changes in accounting policies
Effective the beginning of the current fiscal year (April 1, 2019), the NTT DATA Group has adopted IFRS 16 “Leases” (issued in January 2016) (hereinafter referred to as IFRS 16). In adopting IFRS 16, the Group adopts a method to recognize the cumulative impact by the application of the Standard as opening balance of retained earnings on the application start date (retroactive adjustment approach).
In the previous consolidated fiscal year, the Group adopted IAS 17 “Leases” (hereinafter referred to as IAS 17), as for lease transactions as the lessee, leases were classified as finance lease transactions when the terms of the lease transfer all the risks and rewards of ownership to the lessee, and other lease transactions were classified as operating lease transactions. In addition, lease payments of operating lease transactions over the lease term were recognized as expenses on a straight-line basis over the lease term.
In the current consolidated fiscal year, by the application of IFRS 16, when it is judged that the contract is a lease or the contract includes a lease at the time of conclusion of the contract, leases are not classified into finance lease and operating lease. As for all leases except for the lease term of which is within 12 months and the underlying asset of which has a small sum value, on the consolidated statement of the financial position, a right-of-use asset and the lease liability are recognized on the lease start date. In starting to adopt IFRS 16, as for contracts signed prior to the previous consolidated fiscal year, the Group
adopts the expedient measure to take over the previous method of judging whether the transaction is a lease or not.
Impacts from the changes in accounting policy In adopting IFRS 16, at the beginning of the current fiscal year, ”right-of-use assets” increased by 127,223
million yen, and ”lease liability” rose by 127,187 million yen. There is no impact on the opening balance of retained earnings at the beginning of the current fiscal year. Moreover, the impact on the income for the consolidated fiscal year is immaterial.
Depreciation associated with a recording of right-of-use assets increased and operating lease was recognized as lease liability. As a result, for the consolidated fiscal year, “depreciation and amortization” of cash flow from operating activities increased by 34,826 million yen, and “interest paid” increased by 2,701 million yen. In addition, “expenditure for payments of lease liability” of cash flow from financing activities rose by 32,752 million yen.
The weighted average of the lessee’s incremental borrowing rate applied for the opening balance of lease liability recognized in the consolidated statement of financial position at the Group is 2.00%.
The following is the difference between non-cancellable operating leases on the last day of the fiscal year immediately before the IFRS 16 application start date and lease liability recognized in the consolidated statement of financial position as of the application start date.
Non-cancellable operating leases contract (March 31, 2019) 61,734 million yen
Amount discounted using incremental borrowing rate as of April 1, 2019 58,309 million yen
Finance lease obligations recognized at the end of the previous fiscal year 15,506 million yen
Cancellable operating leases contract, etc. 53,372 million yen
Lease liability recognized in the consolidated statement of financial position as of the date of the start of application (April 1, 2019) 127,187 million yen

16
(2) Changes in accounting estimates In the consolidated cumulative third quarter of the current fiscal year, a defect was found that could not have been anticipated at the time of the previous review of total costs. As a result, the possibility of outflow of economic benefits has increased, and we have changed the estimated costs. Accordingly, the additional provision for loss on order received which is within the “cost of sales” increased by 3,951 million yen in the Public & Social Infrastructure Segment and by 5,336 million yen in the Financial Segment.
17
4. Consolidated Financial Statements and major notes
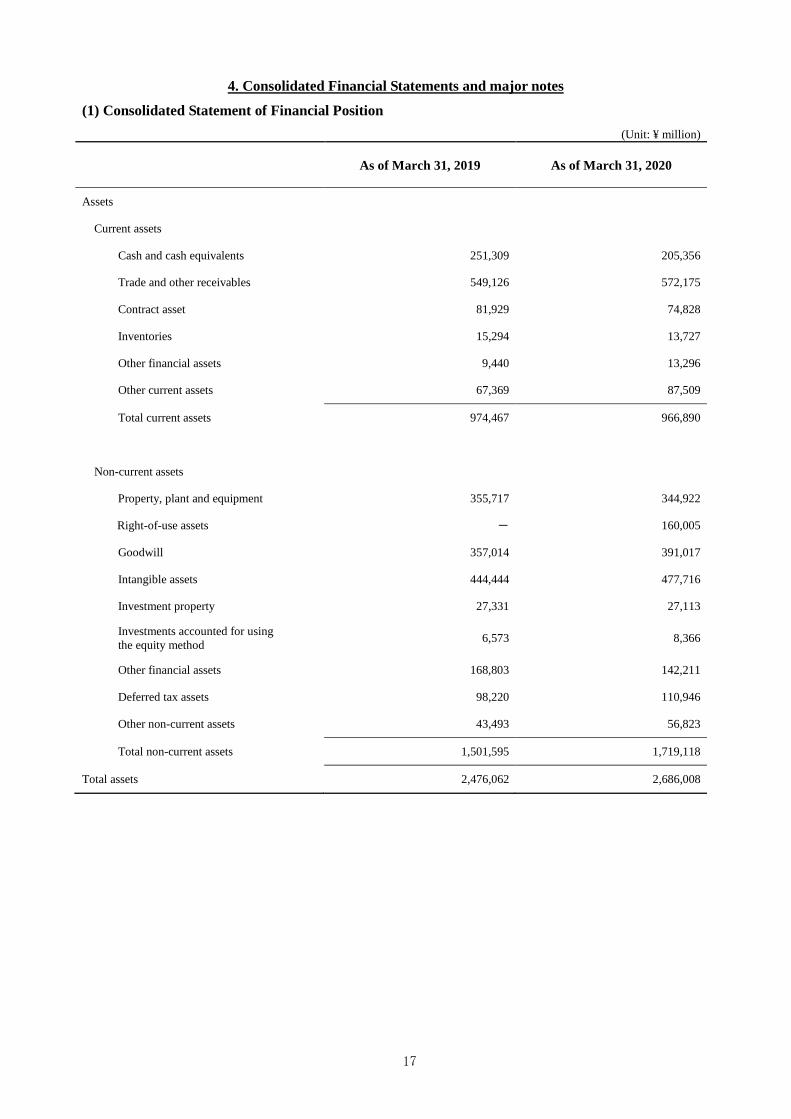
(1) Consolidated Statement of Financial Position
(Unit: ¥ million)
As of March 31, 2019 As of March 31, 2020
Assets Current assets Cash and cash equivalents 251,309 205,356
Trade and other receivables 549,126 572,175
Contract asset 81,929 74,828
Inventories 15,294 13,727
Other financial assets 9,440 13,296
Other current assets 67,369 87,509
Total current assets 974,467 966,890
Non-current assets
Property, plant and equipment 355,717 344,922
Right-of-use assets - 160,005
Goodwill 357,014 391,017
Intangible assets 444,444 477,716
Investment property 27,331 27,113
Investments accounted for using the equity method 6,573 8,366
Other financial assets 168,803 142,211
Deferred tax assets 98,220 110,946
Other non-current assets 43,493 56,823
Total non-current assets 1,501,595 1,719,118
Total assets 2,476,062 2,686,008
18
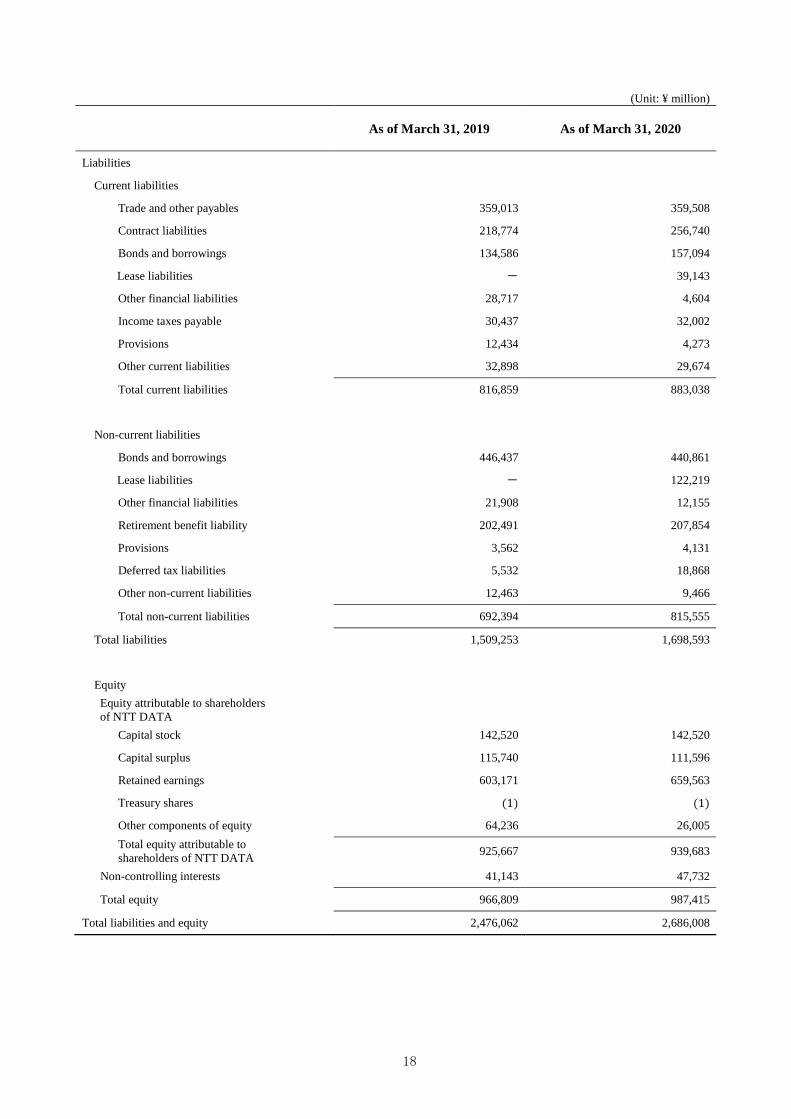
(Unit: ¥ million)
As of March 31, 2019 As of March 31, 2020
Liabilities Current liabilities Trade and other payables 359,013 359,508
Contract liabilities 218,774 256,740
Bonds and borrowings 134,586 157,094
Lease liabilities - 39,143
Other financial liabilities 28,717 4,604
Income taxes payable 30,437 32,002
Provisions 12,434 4,273
Other current liabilities 32,898 29,674
Total current liabilities 816,859 883,038
Non-current liabilities Bonds and borrowings 446,437 440,861
Lease liabilities - 122,219
Other financial liabilities 21,908 12,155
Retirement benefit liability 202,491 207,854
Provisions 3,562 4,131
Deferred tax liabilities 5,532 18,868
Other non-current liabilities 12,463 9,466
Total non-current liabilities 692,394 815,555
Total liabilities 1,509,253 1,698,593
Equity Equity attributable to shareholders of NTT DATA
Capital stock 142,520 142,520
Capital surplus 115,740 111,596
Retained earnings 603,171 659,563
Treasury shares (1) (1)
Other components of equity 64,236 26,005 Total equity attributable to shareholders of NTT DATA 925,667 939,683
Non-controlling interests 41,143 47,732
Total equity 966,809 987,415
Total liabilities and equity 2,476,062 2,686,008
19
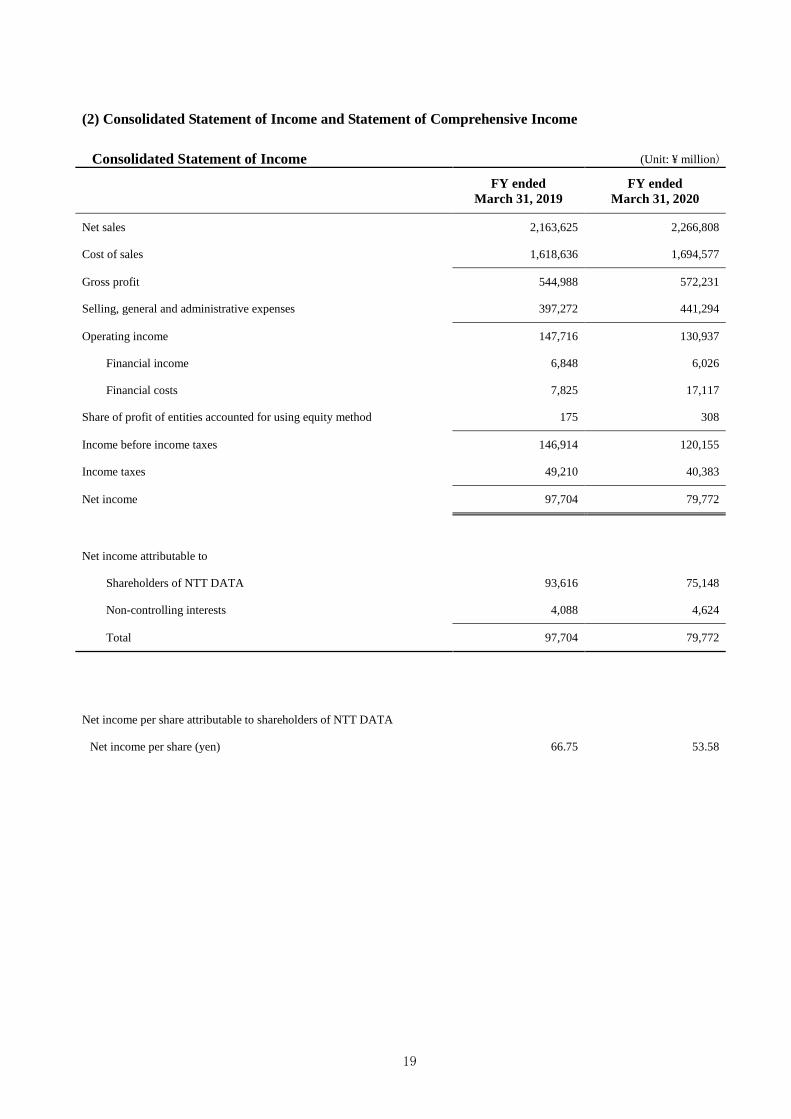
(2) Consolidated Statement of Income and Statement of Comprehensive Income
Consolidated Statement of Income
(Unit: ¥ million)
FY ended March 31, 2019
FY ended March 31, 2020
Net sales 2,163,625 2,266,808
Cost of sales 1,618,636 1,694,577
Gross profit 544,988 572,231
Selling, general and administrative expenses 397,272 441,294
Operating income 147,716 130,937
Financial income 6,848 6,026
Financial costs 7,825 17,117
Share of profit of entities accounted for using equity method 175 308
Income before income taxes 146,914 120,155
Income taxes 49,210 40,383
Net income 97,704 79,772
Net income attributable to
Shareholders of NTT DATA 93,616 75,148
Non-controlling interests 4,088 4,624
Total 97,704 79,772
Net income per share attributable to shareholders of NTT DATA
Net income per share (yen) 66.75 53.58
20
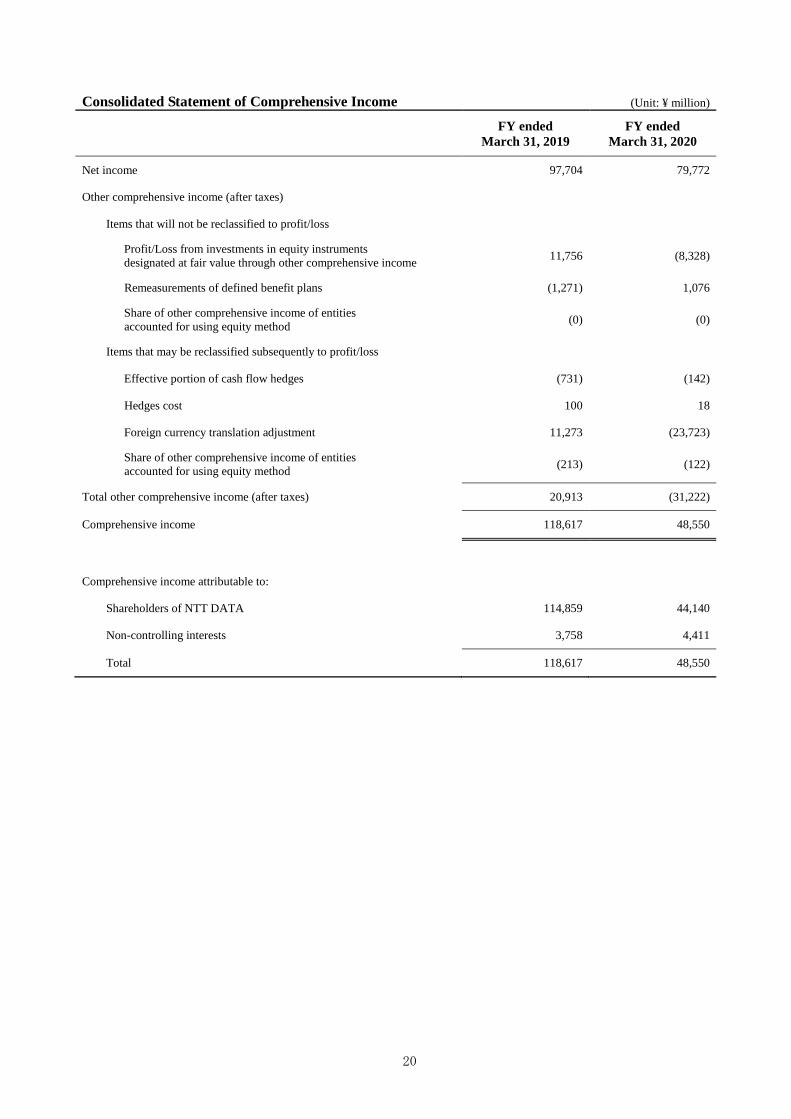
Consolidated Statement of Comprehensive Income
(Unit: ¥ million)
FY ended March 31, 2019
FY ended March 31, 2020
Net income 97,704 79,772
Other comprehensive income (after taxes)
Items that will not be reclassified to profit/loss
Profit/Loss from investments in equity instruments designated at fair value through other comprehensive income 11,756 (8,328)
Remeasurements of defined benefit plans (1,271) 1,076
Share of other comprehensive income of entities accounted for using equity method (0) (0)
Items that may be reclassified subsequently to profit/loss
Effective portion of cash flow hedges (731) (142)
Hedges cost 100 18
Foreign currency translation adjustment 11,273 (23,723)
Share of other comprehensive income of entities accounted for using equity method (213) (122)
Total other comprehensive income (after taxes) 20,913 (31,222)
Comprehensive income 118,617 48,550
Comprehensive income attributable to:
Shareholders of NTT DATA 114,859 44,140
Non-controlling interests 3,758 4,411
Total 118,617 48,550
21
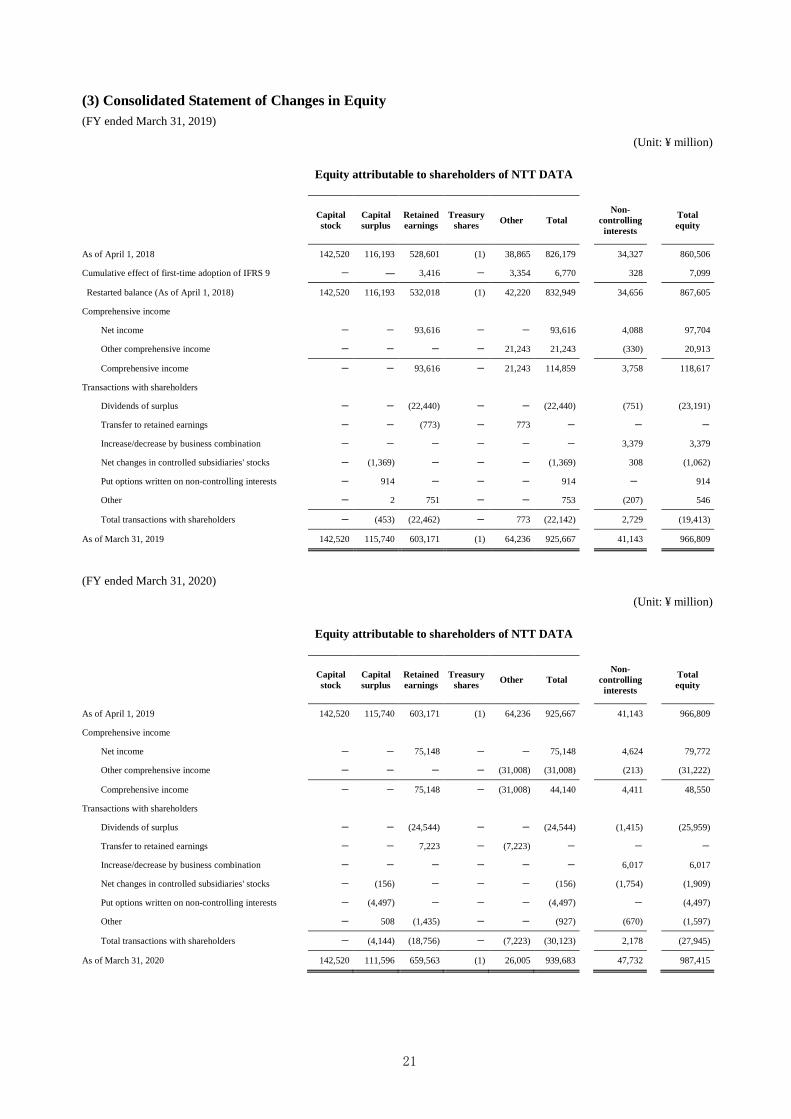
(3) Consolidated Statement of Changes in Equity (FY ended March 31, 2019)
(Unit: ¥ million)
Equity attributable to shareholders of NTT DATA
Capital stock
Capital surplus
Retained earnings
Treasury shares Other Total
Non- controlling
interests Total equity
As of April 1, 2018 142,520 116,193 528,601 (1) 38,865 826,179 34,327 860,506
Cumulative effect of first-time adoption of IFRS 9 - ― 3,416 - 3,354 6,770 328 7,099
Restarted balance (As of April 1, 2018) 142,520 116,193 532,018 (1) 42,220 832,949 34,656 867,605
Comprehensive income
Net income - - 93,616 - - 93,616 4,088 97,704
Other comprehensive income - - - - 21,243 21,243 (330) 20,913
Comprehensive income - - 93,616 - 21,243 114,859 3,758 118,617
Transactions with shareholders
Dividends of surplus - - (22,440) - - (22,440) (751) (23,191)
Transfer to retained earnings - - (773) - 773 - - -
Increase/decrease by business combination - - - - - - 3,379 3,379
Net changes in controlled subsidiaries' stocks - (1,369) - - - (1,369) 308 (1,062)
Put options written on non-controlling interests - 914 - - - 914 - 914
Other - 2 751 - - 753 (207) 546
Total transactions with shareholders - (453) (22,462) - 773 (22,142) 2,729 (19,413)
As of March 31, 2019 142,520 115,740 603,171 (1) 64,236 925,667 41,143 966,809
(FY ended March 31, 2020)
(Unit: ¥ million)
Equity attributable to shareholders of NTT DATA
Capital stock
Capital surplus
Retained earnings
Treasury shares Other Total
Non- controlling
interests Total equity
As of April 1, 2019 142,520 115,740 603,171 (1) 64,236 925,667 41,143 966,809
Comprehensive income
Net income - - 75,148 - - 75,148 4,624 79,772
Other comprehensive income - - - - (31,008) (31,008) (213) (31,222)
Comprehensive income - - 75,148 - (31,008) 44,140 4,411 48,550
Transactions with shareholders
Dividends of surplus - - (24,544) - - (24,544) (1,415) (25,959)
Transfer to retained earnings - - 7,223 - (7,223) - - -
Increase/decrease by business combination - - - - - - 6,017 6,017
Net changes in controlled subsidiaries' stocks - (156) - - - (156) (1,754) (1,909)
Put options written on non-controlling interests - (4,497) - - - (4,497) - (4,497)
Other - 508 (1,435) - - (927) (670) (1,597)
Total transactions with shareholders - (4,144) (18,756) - (7,223) (30,123) 2,178 (27,945)
As of March 31, 2020 142,520 111,596 659,563 (1) 26,005 939,683 47,732 987,415
22
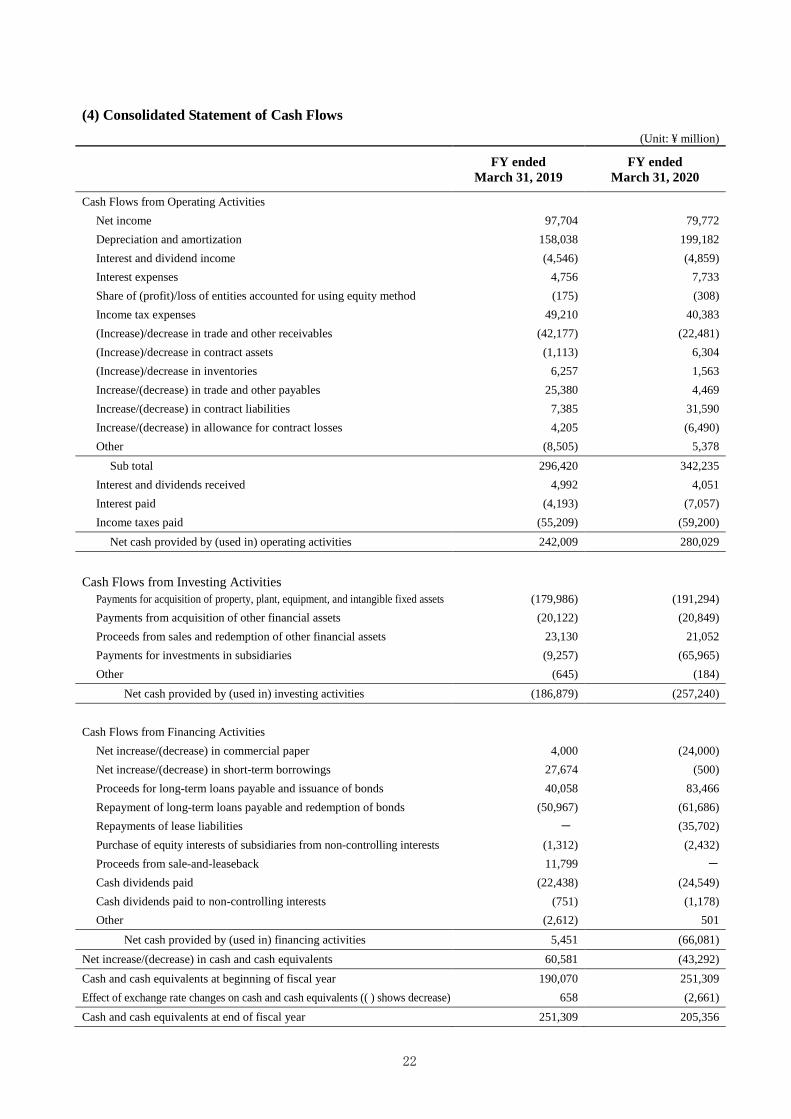
(4) Consolidated Statement of Cash Flows
(Unit: ¥ million)
FY ended March 31, 2019
FY ended March 31, 2020
Cash Flows from Operating Activities Net income 97,704 79,772 Depreciation and amortization 158,038 199,182 Interest and dividend income (4,546) (4,859) Interest expenses 4,756 7,733 Share of (profit)/loss of entities accounted for using equity method (175) (308) Income tax expenses 49,210 40,383 (Increase)/decrease in trade and other receivables (42,177) (22,481) (Increase)/decrease in contract assets (1,113) 6,304 (Increase)/decrease in inventories 6,257 1,563 Increase/(decrease) in trade and other payables 25,380 4,469 Increase/(decrease) in contract liabilities 7,385 31,590 Increase/(decrease) in allowance for contract losses 4,205 (6,490) Other (8,505) 5,378
Sub total 296,420 342,235 Interest and dividends received 4,992 4,051 Interest paid (4,193) (7,057) Income taxes paid (55,209) (59,200)
Net cash provided by (used in) operating activities 242,009 280,029
Cash Flows from Investing Activities
Payments for acquisition of property, plant, equipment, and intangible fixed assets (179,986) (191,294) Payments from acquisition of other financial assets (20,122) (20,849) Proceeds from sales and redemption of other financial assets 23,130 21,052 Payments for investments in subsidiaries (9,257) (65,965) Other (645) (184)
Net cash provided by (used in) investing activities (186,879) (257,240) Cash Flows from Financing Activities
Net increase/(decrease) in commercial paper 4,000 (24,000) Net increase/(decrease) in short-term borrowings 27,674 (500) Proceeds for long-term loans payable and issuance of bonds 40,058 83,466 Repayment of long-term loans payable and redemption of bonds (50,967) (61,686) Repayments of lease liabilities - (35,702) Purchase of equity interests of subsidiaries from non-controlling interests (1,312) (2,432) Proceeds from sale-and-leaseback 11,799 - Cash dividends paid (22,438) (24,549) Cash dividends paid to non-controlling interests (751) (1,178) Other (2,612) 501
Net cash provided by (used in) financing activities 5,451 (66,081) Net increase/(decrease) in cash and cash equivalents 60,581 (43,292) Cash and cash equivalents at beginning of fiscal year 190,070 251,309 Effect of exchange rate changes on cash and cash equivalents (( ) shows decrease) 658 (2,661) Cash and cash equivalents at end of fiscal year 251,309 205,356
23
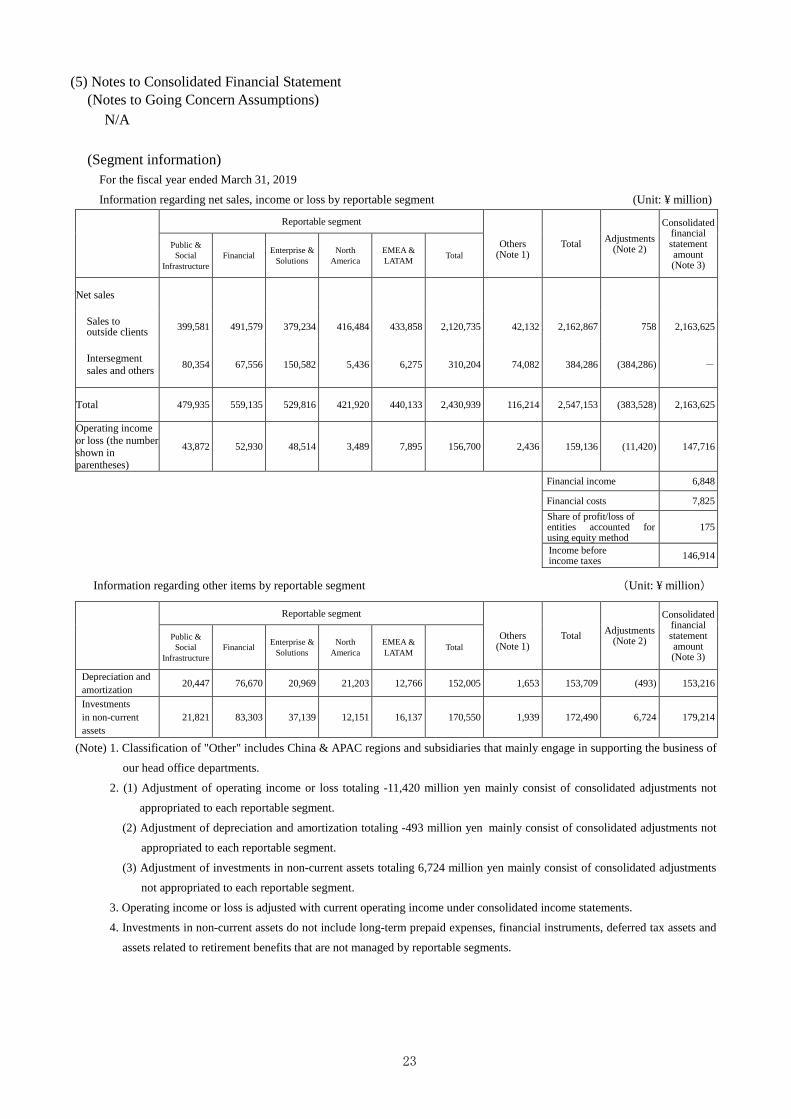
(5) Notes to Consolidated Financial Statement (Notes to Going Concern Assumptions)
N/A
(Segment information) For the fiscal year ended March 31, 2019
Information regarding net sales, income or loss by reportable segment (Unit: ¥ million)
Reportable segment
Others (Note 1)
Total Adjustments (Note 2)
Consolidated financial statement amount (Note 3)
Public & Social
Infrastructure Financial Enterprise &
Solutions North
America EMEA & LATAM Total
Net sales
Sales to outside clients 399,581 491,579 379,234 416,484 433,858 2,120,735 42,132 2,162,867 758 2,163,625
Intersegment sales and others
80,354 67,556 150,582 5,436 6,275 310,204 74,082 384,286 (384,286) -
Total
479,935 559,135 529,816 421,920 440,133 2,430,939 116,214 2,547,153 (383,528) 2,163,625
Operating income or loss (the number shown in parentheses)
43,872 52,930 48,514 3,489 7,895 156,700 2,436 159,136 (11,420) 147,716
Financial income 6,848
Financial costs 7,825
Share of profit/loss of entities accounted for using equity method
175
Income before income taxes 146,914
Information regarding other items by reportable segment
(Unit: ¥ million)
Reportable segment
Others (Note 1)
Total Adjustments (Note 2)
Consolidated financial statement amount (Note 3)
Public & Social
Infrastructure Financial Enterprise &
Solutions North
America EMEA & LATAM Total
Depreciation and amortization 20,447 76,670 20,969 21,203 12,766 152,005 1,653 153,709 (493) 153,216
Investments in non-current assets
21,821 83,303 37,139 12,151 16,137 170,550 1,939 172,490 6,724 179,214
(Note) 1. Classification of "Other" includes China & APAC regions and subsidiaries that mainly engage in supporting the business of
our head office departments.
2. (1) Adjustment of operating income or loss totaling -11,420 million yen mainly consist of consolidated adjustments not
appropriated to each reportable segment.
(2) Adjustment of depreciation and amortization totaling -493 million yen mainly consist of consolidated adjustments not
appropriated to each reportable segment.
(3) Adjustment of investments in non-current assets totaling 6,724 million yen mainly consist of consolidated adjustments
not appropriated to each reportable segment.
3. Operating income or loss is adjusted with current operating income under consolidated income statements.
4. Investments in non-current assets do not include long-term prepaid expenses, financial instruments, deferred tax assets and
assets related to retirement benefits that are not managed by reportable segments.
24
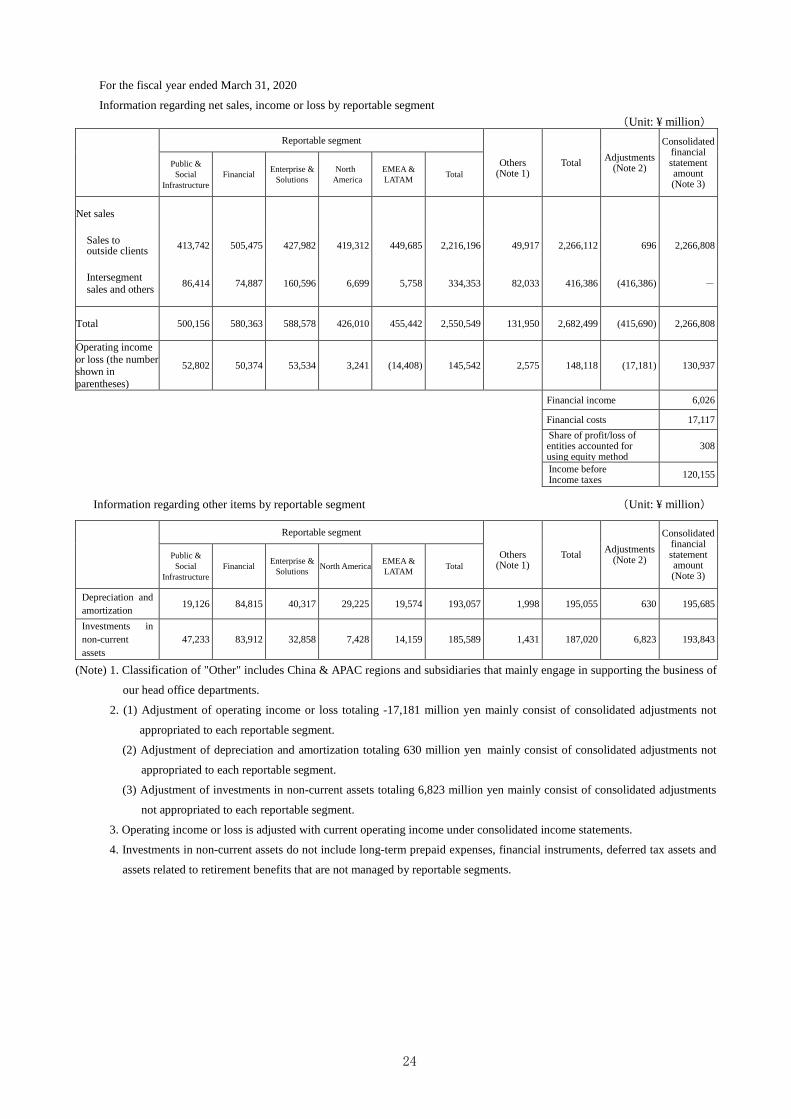
For the fiscal year ended March 31, 2020
Information regarding net sales, income or loss by reportable segment (Unit: ¥ million)
Reportable segment
Others (Note 1)
Total Adjustments (Note 2)
Consolidated financial statement amount (Note 3)
Public & Social
Infrastructure Financial Enterprise &
Solutions North
America EMEA & LATAM
Total
Net sales
Sales to outside clients 413,742 505,475 427,982 419,312 449,685 2,216,196 49,917 2,266,112 696 2,266,808
Intersegment sales and others
86,414 74,887 160,596 6,699 5,758 334,353 82,033 416,386 (416,386) -
Total
500,156 580,363 588,578 426,010 455,442 2,550,549 131,950 2,682,499 (415,690) 2,266,808
Operating income or loss (the number shown in parentheses)
52,802 50,374 53,534 3,241 (14,408) 145,542 2,575 148,118 (17,181) 130,937
Financial income 6,026
Financial costs 17,117
Share of profit/loss of entities accounted for using equity method
308
Income before Income taxes 120,155
Information regarding other items by reportable segment
(Unit: ¥ million)
Reportable segment
Others (Note 1)
Total Adjustments (Note 2)
Consolidated financial statement amount (Note 3)
Public & Social
Infrastructure Financial Enterprise &
Solutions North America EMEA & LATAM
Total
Depreciation and amortization
19,126 84,815 40,317 29,225 19,574 193,057 1,998 195,055 630 195,685
Investments in non-current assets
47,233 83,912 32,858 7,428 14,159 185,589 1,431 187,020 6,823 193,843
(Note) 1. Classification of "Other" includes China & APAC regions and subsidiaries that mainly engage in supporting the business of
our head office departments.
2. (1) Adjustment of operating income or loss totaling -17,181 million yen mainly consist of consolidated adjustments not
appropriated to each reportable segment.
(2) Adjustment of depreciation and amortization totaling 630 million yen mainly consist of consolidated adjustments not
appropriated to each reportable segment.
(3) Adjustment of investments in non-current assets totaling 6,823 million yen mainly consist of consolidated adjustments
not appropriated to each reportable segment.
3. Operating income or loss is adjusted with current operating income under consolidated income statements.
4. Investments in non-current assets do not include long-term prepaid expenses, financial instruments, deferred tax assets and
assets related to retirement benefits that are not managed by reportable segments.
25
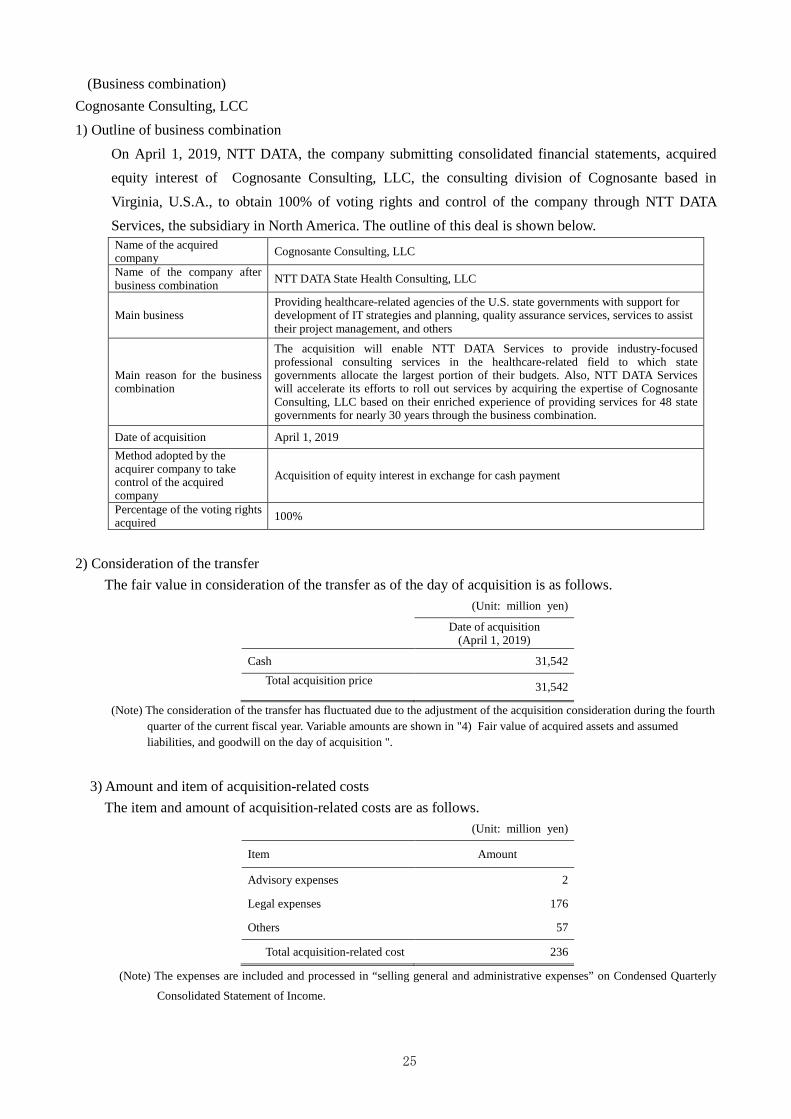
(Business combination) Cognosante Consulting, LCC 1) Outline of business combination
On April 1, 2019, NTT DATA, the company submitting consolidated financial statements, acquired equity interest of Cognosante Consulting, LLC, the consulting division of Cognosante based in Virginia, U.S.A., to obtain 100% of voting rights and control of the company through NTT DATA Services, the subsidiary in North America. The outline of this deal is shown below. Name of the acquired company Cognosante Consulting, LLC
Name of the company after business combination NTT DATA State Health Consulting, LLC
Main business Providing healthcare-related agencies of the U.S. state governments with support for development of IT strategies and planning, quality assurance services, services to assist their project management, and others
Main reason for the business combination
The acquisition will enable NTT DATA Services to provide industry-focused professional consulting services in the healthcare-related field to which state governments allocate the largest portion of their budgets. Also, NTT DATA Services will accelerate its efforts to roll out services by acquiring the expertise of Cognosante Consulting, LLC based on their enriched experience of providing services for 48 state governments for nearly 30 years through the business combination.
Date of acquisition April 1, 2019 Method adopted by the acquirer company to take control of the acquired company
Acquisition of equity interest in exchange for cash payment
Percentage of the voting rights acquired 100%
2) Consideration of the transfer The fair value in consideration of the transfer as of the day of acquisition is as follows.
(Unit: million yen)
Date of acquisition (April 1, 2019)
Cash 31,542 Total acquisition price
31,542
(Note) The consideration of the transfer has fluctuated due to the adjustment of the acquisition consideration during the fourth quarter of the current fiscal year. Variable amounts are shown in "4) Fair value of acquired assets and assumed liabilities, and goodwill on the day of acquisition ".
3) Amount and item of acquisition-related costs The item and amount of acquisition-related costs are as follows.
(Unit: million yen)
Item Amount
Advisory expenses 2
Legal expenses 176
Others 57
Total acquisition-related cost 236
(Note) The expenses are included and processed in “selling general and administrative expenses” on Condensed Quarterly
Consolidated Statement of Income.
26
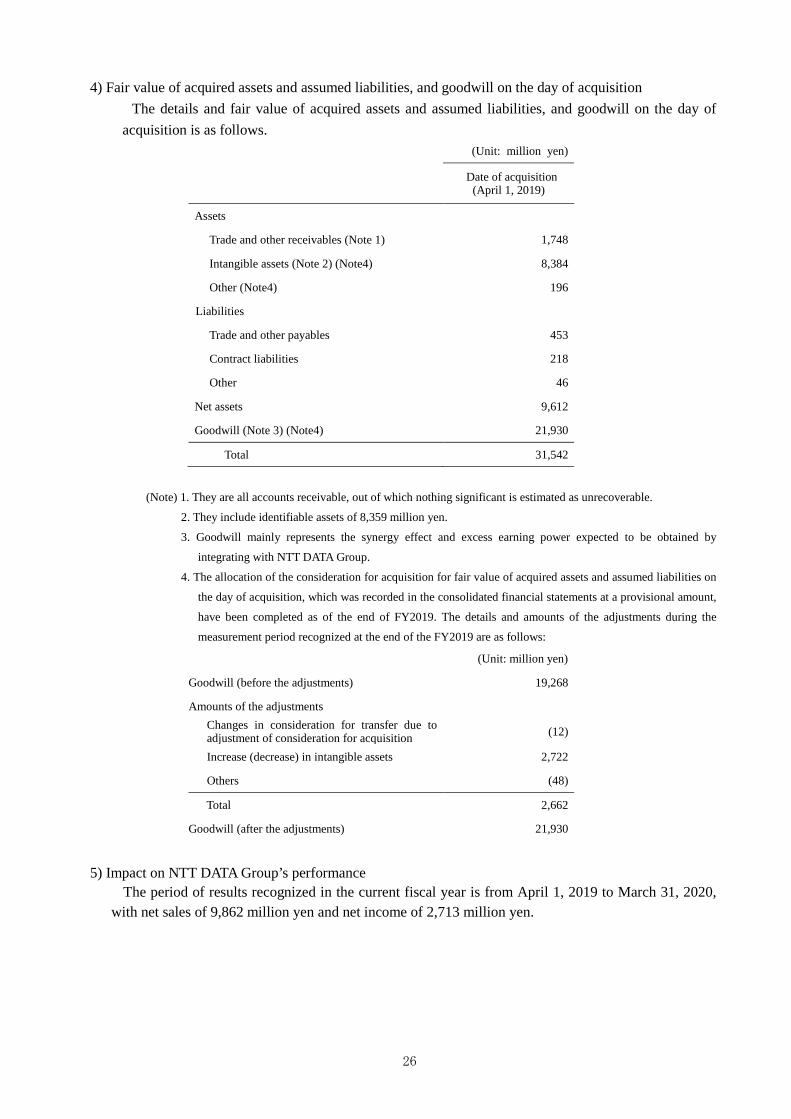
4) Fair value of acquired assets and assumed liabilities, and goodwill on the day of acquisition
The details and fair value of acquired assets and assumed liabilities, and goodwill on the day of acquisition is as follows.
(Unit: million yen)
Date of acquisition (April 1, 2019)
Assets
Trade and other receivables (Note 1) 1,748
Intangible assets (Note 2) (Note4) 8,384
Other (Note4) 196
Liabilities
Trade and other payables 453
Contract liabilities 218
Other 46
Net assets 9,612
Goodwill (Note 3) (Note4) 21,930
Total 31,542
(Note) 1. They are all accounts receivable, out of which nothing significant is estimated as unrecoverable.
2. They include identifiable assets of 8,359 million yen.
3. Goodwill mainly represents the synergy effect and excess earning power expected to be obtained by
integrating with NTT DATA Group.
4. The allocation of the consideration for acquisition for fair value of acquired assets and assumed liabilities on
the day of acquisition, which was recorded in the consolidated financial statements at a provisional amount,
have been completed as of the end of FY2019. The details and amounts of the adjustments during the
measurement period recognized at the end of the FY2019 are as follows:
(Unit: million yen)
Goodwill (before the adjustments) 19,268
Amounts of the adjustments Changes in consideration for transfer due to adjustment of consideration for acquisition (12)
Increase (decrease) in intangible assets 2,722
Others (48)
Total 2,662
Goodwill (after the adjustments) 21,930
5) Impact on NTT DATA Group’s performance The period of results recognized in the current fiscal year is from April 1, 2019 to March 31, 2020,
with net sales of 9,862 million yen and net income of 2,713 million yen.
27
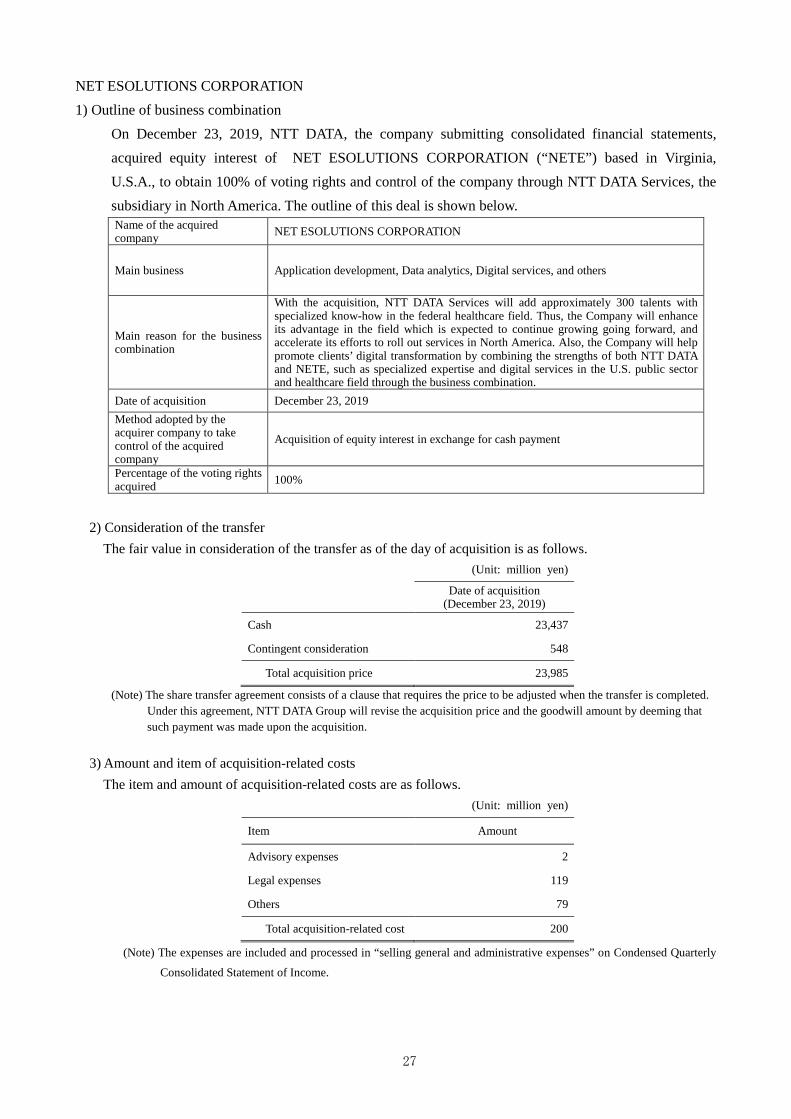
NET ESOLUTIONS CORPORATION 1) Outline of business combination
On December 23, 2019, NTT DATA, the company submitting consolidated financial statements, acquired equity interest of NET ESOLUTIONS CORPORATION (“NETE”) based in Virginia, U.S.A., to obtain 100% of voting rights and control of the company through NTT DATA Services, the subsidiary in North America. The outline of this deal is shown below. Name of the acquired company NET ESOLUTIONS CORPORATION
Main business Application development, Data analytics, Digital services, and others
Main reason for the business combination
With the acquisition, NTT DATA Services will add approximately 300 talents with specialized know-how in the federal healthcare field. Thus, the Company will enhance its advantage in the field which is expected to continue growing going forward, and accelerate its efforts to roll out services in North America. Also, the Company will help promote clients’ digital transformation by combining the strengths of both NTT DATA and NETE, such as specialized expertise and digital services in the U.S. public sector and healthcare field through the business combination.
Date of acquisition December 23, 2019 Method adopted by the acquirer company to take control of the acquired company
Acquisition of equity interest in exchange for cash payment
Percentage of the voting rights acquired 100%
2) Consideration of the transfer The fair value in consideration of the transfer as of the day of acquisition is as follows.
(Unit: million yen)
Date of acquisition (December 23, 2019)
Cash 23,437
Contingent consideration 548
Total acquisition price 23,985
(Note) The share transfer agreement consists of a clause that requires the price to be adjusted when the transfer is completed. Under this agreement, NTT DATA Group will revise the acquisition price and the goodwill amount by deeming that such payment was made upon the acquisition.
3) Amount and item of acquisition-related costs The item and amount of acquisition-related costs are as follows.
(Unit: million yen)
Item Amount
Advisory expenses 2
Legal expenses 119
Others 79
Total acquisition-related cost 200
(Note) The expenses are included and processed in “selling general and administrative expenses” on Condensed Quarterly
Consolidated Statement of Income.
28
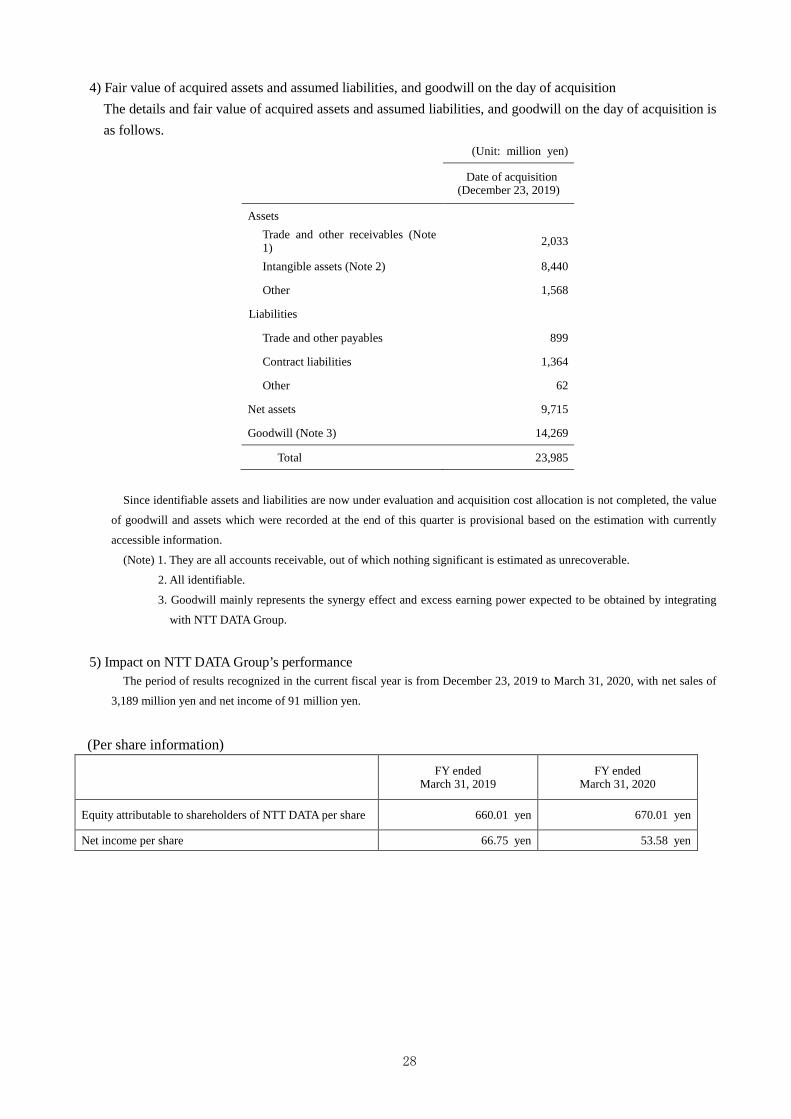
4) Fair value of acquired assets and assumed liabilities, and goodwill on the day of acquisition
The details and fair value of acquired assets and assumed liabilities, and goodwill on the day of acquisition is as follows.
(Unit: million yen)
Date of acquisition (December 23, 2019)
Assets Trade and other receivables (Note 1) 2,033
Intangible assets (Note 2) 8,440
Other 1,568
Liabilities
Trade and other payables 899
Contract liabilities 1,364
Other 62
Net assets 9,715
Goodwill (Note 3) 14,269
Total 23,985
Since identifiable assets and liabilities are now under evaluation and acquisition cost allocation is not completed, the value
of goodwill and assets which were recorded at the end of this quarter is provisional based on the estimation with currently
accessible information.
(Note) 1. They are all accounts receivable, out of which nothing significant is estimated as unrecoverable.
2. All identifiable.
3. Goodwill mainly represents the synergy effect and excess earning power expected to be obtained by integrating
with NTT DATA Group.
5) Impact on NTT DATA Group’s performance The period of results recognized in the current fiscal year is from December 23, 2019 to March 31, 2020, with net sales of
3,189 million yen and net income of 91 million yen.
(Per share information)
FY ended
March 31, 2019 FY ended
March 31, 2020
Equity attributable to shareholders of NTT DATA per share 660.01 yen 670.01 yen
Net income per share 66.75 yen 53.58 yen