connecting with clients white paper final
TRANSCRIPT

Connecting with ClientsSolving the communication matrix for financial advice practices
Powered by
AFA White Paper October 2013
Sponsored by

Table of Contents
About the Authors 1
Executive Summary 2
Method 9
Detailed Findings 11
One‑to‑One Personal Communication Preferences 11
One‑to‑Many Communication Preferences 15
Impact of the Number of Communication Channels on Satisfaction 19
How do Leading Practices Communicate with their clients? 21
Current vs. Preferred Communication Methods 26
The Benefits of Getting the Communication Mix Right 30
Conclusion 33

1CONNECTING WITH CLIENTS | © BEDDOES INSTITUTE 2013
About the Authors
Dr Rebecca SheilsRebecca is a psychologist with over 15 years’ research and evidence‑based consulting experience across a range of industries, most recently in financial services and the professions. Throughout her career she has specialised in customer loyalty research and consulting in the services sector. Rebecca is on the judging panel for the
AFA Adviser of the Year Award and is a Director at The Beddoes Institute.
For enquiries contact The Beddoes Institute on (03) 8862 4762 or visit www.beddoesinstitute.com.au.
Dr Adam TuckerAs Director of the Beddoes Institute, Adam works with a highly energetic and innovative team undertaking market research design, data analysis, strategy design and tactical implementation. He is highly sought after for market research, regulatory work, communication strategy, and BDM training. Underpinning The Institute’s success is a proprietary
web‑based management system which converts market research data into actionable practice change programs using mobile technology. Adam is increasingly applying the lessons he learnt in the Pharmaceutical Industry to other sectors including finance and insurance. For the last 2 years Adam has been working on programs that implement corporate strategy to practitioners and consumers through mobile and social platforms.
Brad FoxBrad commenced as the CEO of the Association of Financial Advisers (AFA) in January 2013 after 5 years as an AFA Board Member including 2 years as the AFA President. Prior to his appointment as the CEO, Brad was a practice owner and adviser. He has demonstrated his leadership skills consistently since
winning the AFA Rising Star Award in 2008 and brings both passion and foresight to the advice landscape. Brad attended the Stanford Graduate School of Business Executive Education Strategic Leadership Program in 2012, holds the Adv. DFS(FP), FChFP and a B.Bus (Econ & Fin).
Richard DunkerleyAs Head of Marketing for Zurich Life and Investments, Richard and his team drive the marketing communications activities of the business, across brand, PR and campaign based initiatives. Richard has been a driving force behind Zurich’s adoption of new media and technology, and is a regular speaker and
presenter in this area. Richard has more than 20 years experience in financial services, and has held a variety of senior roles spanning marketing, communication and product management with organisations including CommInsure, IAG, Westpac, and BUPA. For the last 2 years Richard has been a member of the Adviser of the Year Judging Panel.

2 CONNECTING WITH CLIENTS | © BEDDOES INSTITUTE 2013
Executive Summary
Introduction“Connecting with Clients – Solving the communication matrix for financial advisers” is the flagship white paper of the 2013 AFA National conference. This is the third in a series of white papers that use an evidence‑based approach to quantify the DNA of leading financial advice practices.
The ‘Leading Practices’ white paper series began with “Pathways to Excellence” which was released in October 2012. That paper provided a clear pathway to becoming a leading advice practice by pinpointing the two areas that matter most to clients; 1) adviser qualities and 2) the practice service proposition.
As an extension of the ‘Pathways to Excellence’ research, ‘The Trusted Adviser’ white paper released in April 2013 took a deep dive into the qualities of advisers that engender trust and build strong and enduring client relationships, namely strong interpersonal skills and high levels of emotional intelligence.
‘Connecting with Clients’ now provides financial advisers with evidence‑based guidelines for optimising their client service proposition by describing the communication needs of clients across different generations. This research shows how leading practices address the communication needs of their clients and quantifies the benefits of getting the communication mix right.
Generational profiling of communication preferences was undertaken to understand the unique and specific needs of different generations. This approach has been widely used in marketing to create a clear picture of the typical characteristics of an individual within a particular generation for the purposes of tailoring offerings and messages. Data was segmented into the following age cohorts of clients for generational profiling purposes:
Generation Y ‑ defined as clients aged under 35 years;
Generation X ‑ defined as clients aged between 35 and 54 years; and
Baby Boomers ‑ defined as clients aged between 55 and 74 years.
An additional cohort of clients known as the Silent Generation (aged 75+ years) was also identified and their communication preferences analysed. Given the broad similarities between the Silent Generation and Baby Boomers, these two generational profiles have been merged for the purpose of this white paper and are collectively referred to as Baby Boomers.
Three key messages have emerged from this white paper:
1. First and foremost, financial advisers need to think about their communication mix in terms of one‑to‑one and one‑to‑many communication as each requires different methods of delivery;
2. Secondly, they must tailor their communication strategy to suit the needs of the generation/s they are working with as each generation has unique and different preferences; and
3. Finally, they need to consider how many channels of communication they are using and how often they are connecting with their clients given the ‘more is more’ effect that has been identified in this white paper.
The benefits of delivering in these three areas are clear: advisers who communicate using their clients’ favoured channels achieve higher client satisfaction, have stronger client relationships and have clients that are more likely to recommend their practice.
Pathways to
ExcellenceInsights from leading advisory practices
Consumer’s demands are changing and mapping their needs at each step of the
journey they share with advisers is now a key approach taken by successful practices
Powered by
Sponsored by
AFA White Paper
October 2012
The Trusted AdviserHonouring the client at every turn
Powered by
Sponsored by
AFA White Paper May 2013

3CONNECTING WITH CLIENTS | © BEDDOES INSTITUTE 2013
Executive Summary
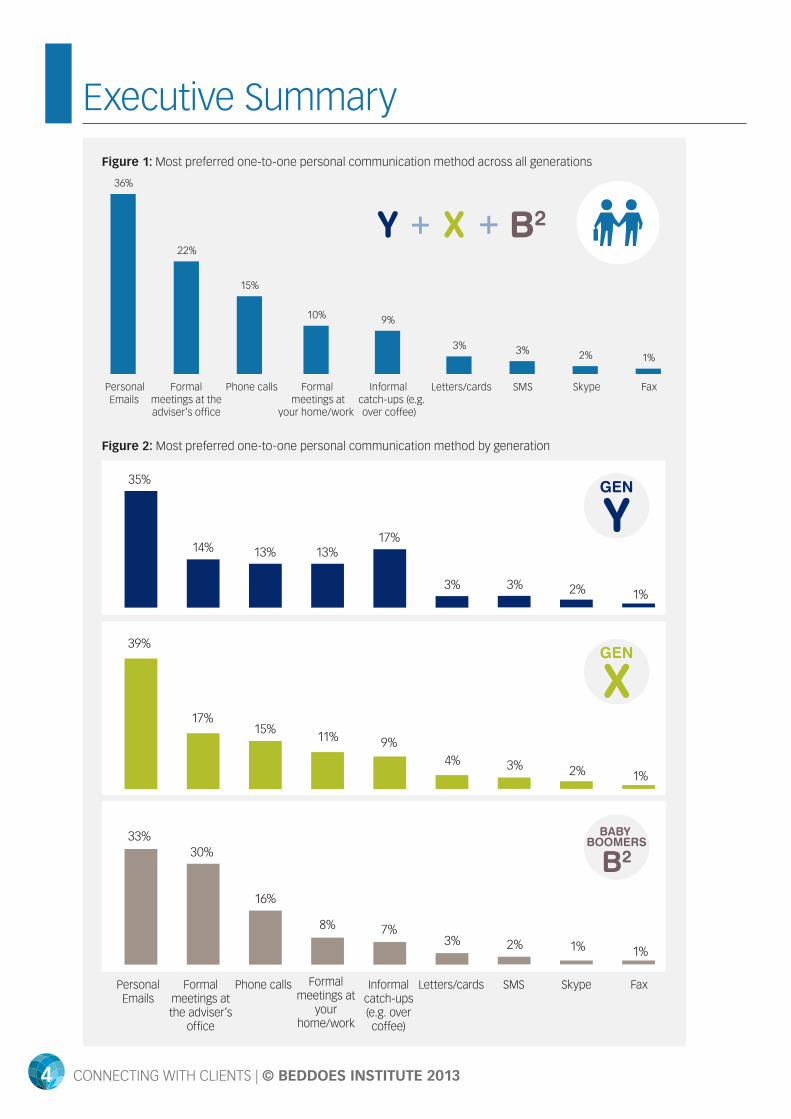
One‑to‑One Personal CommunicationPersonal emails, formal meetings and phone calls are the primary communication channels desired by clients (refer to Figure 1 and Figure 2). While formal meetings are core to delivering advice, emails and telephone calls also facilitate this process. Importantly, preferences for personal emails are even higher than for formal meetings across all generations but especially among Gen X clients who are typically time poor. This indicates that personal emails play an even bigger role in the advice process and in the ongoing engagement of clients than other methods of personal communication, especially compared to phone calls.
The biggest generational differences exist in the area of face‑to‑face communication. Specifically, Baby Boomers want formal meetings more than other generations and they typically want them to be held in the adviser’s office. This is also Gen X’s preference (although to a lesser extent), while Gen Y are split in their preferences to meet at their adviser’s office vs. at their home/work. Importantly, Gen Y clients want to catch‑up informally with their adviser more so than meeting formally in an office environment and much more so than their older counterparts. While formal meetings are most appropriate for older generations, this finding suggests that advisers need to re‑think how and where they do business with Gen Y clients.
Other forms of One‑to‑one communication such as letters/cards, SMS, Skype and fax are very much secondary forms of personal communication but still have a place building client relationships when used to supplement traditional communication channels.
One‑to‑Many CommunicationElectronic newsletters are currently clients’ most preferred method of one‑to‑many communication (refer to Figure 3 and Figure 4), quite possibly as a result of familiarity given that electronic newsletters are a key communication channel used by many leading financial advice practices. The exception to this is Gen Y clients who prefer to interact via other digital/social media channels much more than receiving electronic newsletters. In particular, Gen Y clients want the point of communication between them and their adviser to be via mobile technologies, particularly apps (refer to Figure 5).
Apps (short for ‘applications’) are software applications designed to run on mobile devices such as smartphones and tablets. Apps have a different role to mobile optimised websites which need the internet to be used. Apps work when the mobile device does not have access to the internet so that their libraries of content, calculators, toolkits and games are available anywhere, anytime. Australians are among the highest users of apps in the world1 and this trend underlies clients’ preference for these channels of digital communication. Apps provide advisers with an open and ongoing channel of communication to clients via their mobile devices and can be used to provide information such as toolkits, resources, educational materials and breaking news.
After apps, all other channels of digital/social media communication are on a par.
Communication PreferencesA comprehensive list of 20 different communication methods based on those currently employed by leading financial advisers was used to measure the communication preferences of 530 clients from a cross‑section of leading financial advice practices. These communication methods were grouped into two categories:
1. Personal one‑to‑one communication if it was mainly used to communicate personal information to a client; or
2. One‑to‑many communication if it was mainly used to communicate information on general issues to a group of clients (e.g. market updates, legislative changes, trends etc.).
1 According to Nielsen, Feb 2013: 59% of Australians used their smartphones for apps at least once a month, more than UK and European countries such as Italy and also India, comparable to the US (62%) but behind China (71%).
Portio (March 2013) shows that 30% of all apps are sold in the AsiaPac region.
Again from Nielsen (Feb 2013), at least once a month 94% of Australians SMSed, 60% surfed the web, 59% used apps, 58% used social networking, 55% email. It shows the pecking order.
4 CONNECTING WITH CLIENTS | © BEDDOES INSTITUTE 2013
Executive Summary
Figure 1: Most preferred one‑to‑one personal communication method across all generations
36%
22%
15%
10% 9%
3% 3% 2% 1%
PersonalEmails
Formalmeetings at theadviser's office
Phone calls Formalmeetings at
your home/work
Informalcatch-ups (e.g.over coffee)
Letters/cards SMS Skype Fax
Y X B2+ +
Figure 2: Most preferred one‑to‑one personal communication method by generation
35%
14%
3%
13%
3% 2% 1%
13%17%
39%
17%15%
4%
11%
3% 2% 1%
9%
33%30%
16%
3%8%
2% 1% 1%
7%
YGEN
XGEN
B2
BABY BOOMERS
PersonalEmails
Informalcatch-ups(e.g. overcoffee)
Formalmeetings atthe adviser’s
office
Phone calls SMSFormalmeetings at
yourhome/work
Letters/cards Skype Fax

5CONNECTING WITH CLIENTS | © BEDDOES INSTITUTE 2013
Executive Summary
Figure 3: Most preferred one‑to‑many communication method across all generations
34%
24%
18% 17%
7%
Electronicnewsletters
Totaldigital/social
media
Printednewsletters
Printedinformation packs
Webinars
Y X B2+ +
Figure 4: Most preferred one‑to‑many communication method by generation
44%
26%
12%10% 8%
34%
25%18% 16%
7%
Totaldigital/social
media
Electronicnewsletters
Printedinformation
packs
Printednewsletters
Webinars
35%
21% 19% 18%
7%
YGEN
XGEN
B2
BABY BOOMERS

6 CONNECTING WITH CLIENTS | © BEDDOES INSTITUTE 2013
Executive Summary
Figure 5: A breakdown of digital/social media communication method preferences
24%
7% 4% 4% 3% 3% 2% 1%
44%
16%
4% 6% 4% 5% 5% 3%
25%
7%4% 4% 3% 3% 3% 1%
21%
5% 5% 3% 3% 3% 2% 1%
Totaldigital/social
media
Apps Podcasts (audio) LinkedIn Videos(YouTube)
Blogs FaceBook Twitter
Total Gen Y Gen X Baby Boomers
More Communication Leads to Higher SatisfactionThere is a strong relationship between client satisfaction with their adviser and number of channels a practice uses to communicate with its clients – a ‘more is more’ effect is consistently seen across all generations.
Figure 6: Client satisfaction with adviser by number of communication channels used
6.9
7.9 8.5
8.9 9.1 9.3 9.4 9.5
1 2 3 4 5 6 7 8+
Number of communication channels

7CONNECTING WITH CLIENTS | © BEDDOES INSTITUTE 2013
Executive Summary
How do Leading Practices Perform on Meeting the Communication Needs of Clients?
One‑to‑One Personal CommunicationLeading practices do well in terms of meeting their clients’ communication preferences overall (refer to Figure 7). This is especially true given that decisions regarding communication strategy have, until now, had to be made using a ‘best guess’ approach due to the absence of communication preferences data across generations.
Personal emails are clients’ most preferred type of personal communication and leading practices are responding to this need. Despite this, email as a channel of personal communication is potentially being under‑utilised relative to the preferences of Gen X (refer to Figure 41).
In contrast, phone calls appear to be over‑utilised relative to client preferences for all generations but especially for Gen Y clients. This also appears to be true for formal meetings at the adviser’s office among Gen Y and Gen X clients while informal catch‑ups (e.g. over coffee) and meetings at home/work have a place for Gen Y clients and are currently being under‑utilised with this generation.
Figure 7: Current vs. preferred communication methods for personal one‑to‑one communication across all generations
0%
20%
40%
0%
50%
100%
PersonalEmails
Formalmeetings at theadviser's office
Phone calls Formalmeetings athome/work
Informalcatch-ups (e.g.over coffee)
Letters/cards SMS Skype Fax
Pref
erre
d C
han
nel
Cur
ren
t C
han
nel
s
Current Preferred
One‑to‑Many CommunicationIn terms of one‑to‑many communication, it appears that digital/social media is being under‑utilised relative to client preferences across all generations (refer to Figure 8).
While the same is also true for printed information packs and webinars, this is less significant as preferences for these methods of communication are much lower.
Finally, there is good alignment between the use of electronic newsletters and printed newsletters and client preferences at the overall level; however, printed newsletters appear to be under‑utilised relative to client preferences among Gen X and Gen Y.
Figure 8: Current vs. preferred communication methods for one‑to‑many communication across all generations
0%
10%
20%
30%
0%
50%
Electronic Newsletters Digital/Social media Printed newsletters Printed information packs Webinars
Pref
erre
d C
han
nel
Cur
ren
t C
han
nel
s
Current Preferred

8 CONNECTING WITH CLIENTS | © BEDDOES INSTITUTE 2013
Executive Summary
The Benefits of Getting the Communication Mix RightThe benefits of delivering to client expectations are clear: advisers who communicate using their clients’ favoured channels achieve higher client satisfaction (refer to Figure 9), have stronger client relationships and have clients that are more likely to recommend their practice.
Figure 9: Adviser satisfaction among clients whose communication needs are met vs. not met
Emails
Formal meetings atthe adviser’s office
Phone calls
Formal meetings atyour home/work
ElectronicNewsletters
8.8
8.9
8.9
8.9
9.0
8.1
8.4
8.0
8.7
8.7
Clients withneeds met
Clients withoutneeds met
Implications and Next StepsFirst and foremost, financial advisers should ensure that the communication channels they use are aligned with the type of information being communicated and the preferences of their client mix. The core business of a financial adviser is to deliver tailored wealth and/or insurance solutions to clients. A personal one‑to‑one communication solution is most appropriate for this given the ‘individualised’ nature of providing these advice solutions however tailoring to client demographics can increase client satisfaction.
The research has also shown that client’s communication needs now include forms of one‑to‑many communication that are most effectively and efficiently delivered to groups of clients simultaneously e.g. newsletters, presentations, and social media. It is in this area that there is an unmet demand among clients. Financial advice practices should now focus their efforts on addressing the unmet needs of their clients by refining their communication strategies going forward based on the findings in this paper and the characteristics of their particular clientele.
The next step for financial advisers is to use this white paper to:
• Critically evaluate the effectiveness of their practice’s current communication methods using available tools;
• Consider the need to adopt different communication methods based on the results;
• Objectively identify the ‘optimal’ combination of communication methods that will suit the generational profile of their clients; and
• Upskill and equip the practice with the means to implement any changes.
First and foremost, financial advisers should ensure that the communication channels they use are aligned with the type of information being communicated and the preferences of their client mix. The core business of a financial adviser is to deliver tailored wealth and/or insurance solutions to their clients. As such personal one‑to‑one communication solutions are most appropriate for delivering these ‘individualised’ advice solutions, however tailoring to client demographics can increase client satisfaction.

9CONNECTING WITH CLIENTS | © BEDDOES INSTITUTE 2013
Method
Fieldwork‘Connecting with Clients – Solving the communication matrix for financial advice practices’ white paper provides new guidelines for optimising the communication mix for clients from different generations.
A Client Experience Survey (part of The Beddoes Institute’s Leading Practices Program) was conducted in August 2013 on behalf of the 10 short‑listed advisers from the 2013 AFA Adviser of the Year Award. Those advisers who make it through to this stage of the Award represent the very best of the best and can be considered leading practices.
A total of 530 clients of these leading practices participated in the survey.
In addition to measuring the ‘client experience’ across a range of different service areas, the survey also measured the communication preferences of participating clients.
A comprehensive list of 20 different communication methods was used in the survey. This list was based on communication methods currently used by leading financial advisers. These communication methods were grouped into two categories:
1. Personal one‑to‑one communication if it was mainly used to communicate personal information to a client (i.e. the core business of financial advisers); or
2. One‑to‑many communication if it was mainly used to communicate information on general issues to a group of clients (e.g. market updates, legislative changes, trends etc.).
From this, a communication matrix was developed for analysis and reporting purposes as shown in Table 1.
Table 1: The Communication Matrix
Communication Method
Type of Communication
One‑to‑One Personal
Communication
One‑to‑Many Communication
Personal emails P ûFormal meetings at the adviser’s
officeP û
Formal meetings at your home/work P û
Informal catch‑ups (e.g. over coffee) P û
Phone calls P ûLetters/cards P û
SMS P ûSkype P û
Fax P ûElectronic
Newsletters û P
Printed information packs û P
Printed newsletters û P
FaceBook û P
Twitter û P
LinkedIn û P
Blogs û P
Podcasts (audio) û PVideos
(e.g. YouTube) û P
Apps on smart phones/tablets û P
Webinars (e.g. GoToMeeting) û P

10 CONNECTING WITH CLIENTS | © BEDDOES INSTITUTE 2013
Method
The MaxDiff Research DesignA sophisticated research technique known as MaxDiff was used to collect communication preference data. MaxDiff is a type of trade‑off technique specifically designed for obtaining preference or importance scores across multiple items. While the MaxDiff approach shares much in common with another technique called conjoint analysis, it was the chosen technique for the current study based on it being easier to use for the respondent and end user of the research. Furthermore, scale use bias is eliminated given that respondents make choices rather than expressing strength of preference using a numeric scale. Given this, MaxDiff scores demonstrate greater discrimination among items and between respondents on the items than stated preferences.
Clients were presented with a set of five (5) communication methods and were asked to select their most preferred and least preferred form of communication from this list. This represented one MaxDiff task. They repeated 10 different MaxDiff tasks, each containing a different set of five (5) communication methods. The combinations of communication methods were designed very carefully with the goal that each method was shown an equal number of times and pairs of items were shown an equal number of times. Each respondent typically saw each item two or more times across the 10 MaxDiff tasks.
AnalysisResponses across all MaxDiff tasks were analysed to obtain the likelihood of a given channel being the most preferred channel of communication for different generations.
A generation refers to a cohort of people of a comparable age and life stage who are shaped by common historical events, trends and developments that occurred during their formative years. Individuals within a generation generally share a similar set of attitudes, preferences and behaviours that stem from the environment they were exposed to during their development.
Data was segmented into the following client age cohorts for generational profiling purposes:
Generation Y ‑ defined as clients currently aged under 35 years;
Generation X ‑ defined as clients currently aged between 35 and 54 years; and
Baby Boomers ‑ defined as clients currently aged between 55 and 74 years
This paper identifies and profiles the typical
communication preferences of financial advice clients
within different generational segments.
An additional cohort of clients known as the Silent Generation (aged 75+ years) was also identified and their communication preferences analysed. Given the broad similarities between the Silent Generation and Baby Boomers, these two generational profiles have been merged for the purpose of this white paper and are collectively referred to as Baby Boomers.
Generational profiling analysis was undertaken to identify the communication preferences of Generation Y, Generation X and Baby Boomers. Communication preferences were then compared to the current communication received by clients to understand how leading financial advice practices are delivering on the communication needs of their clients. Finally, the overall satisfaction of clients’ whose communication preferences were met was compared to the overall satisfaction of clients whose communication preferences were not met to quantify the benefits to an advisory practice of delivering on communication needs.
Significance testing was conducted between each generation and all other generations to show where differences are real and not due to chance. Significant differences are denoted on charts with up and down arrows.
Respondent ProfileThe generational cohorts on which this white paper is based contain a good mix of different demographic characteristics. Across the total sample:
• Both males and females were well represented (58% and 42% respectively);
• Clients were based in all major states and territories in Australia with 62% living in a capital city, 21% in a major regional location and a further 17% in a rural area;
• A high proportion of the sample was well educated with 46% holding an undergraduate university degree or higher; a further 27% held a diploma/TAFE certificate and 28% had their high school certificate or less;
• The majority were in full time or part time employment (52%) while a further 24% were business owners or self‑employed;
• There was good representation from both high and low income earners; 25% had a household income of less than $90,000; 22% had a household income of between $90,000 and $150,000; and 34% had a household income of greater than $150,000 (19% were not willing to disclose their household income).

11CONNECTING WITH CLIENTS | © BEDDOES INSTITUTE 2013
Detailed Findings
One‑to‑One Personal Communication Preferences
Personal emails are the most preferred method of personal one‑to‑one communication. Approximately one third of all clients prefer this type of communication above everything else.
This is followed by formal meetings at the adviser’s office with just over one in five clients preferring this above all else.
Phone calls were next, which are most preferred by about one in six clients, then formal meetings at home/work and informal catch‑ups which are most preferred by one in ten clients.
Preferences for other types of personal one‑to‑one communication methods are negligible.
Gen Y Clients• Gen Y clients’ want personal emails slightly less than Gen X clients, although this is still the most
preferred form of personal one‑to‑one communication for this generation.
• Second to this, Gen Y clients want informal catch‑ups (e.g. over coffee) and prefer this style of meeting to formal meetings at their adviser’s office compared to older generations.
Gen X Clients• Gen X clients’ preference for personal email communication outstrips Gen Y and Baby Boomer
clients. This method of communication is most convenient to this generation that are typically time poor due to their age and life‑stage.
• Consistently, Gen X are less inclined to want formal meetings in their adviser’s office compared to other generations although this is still the most preferred method of meeting face‑to‑face.
Baby Boomer Clients• Baby Boomer clients’ desire for personal emails is slightly lower than Gen Y and lower still than
Gen X.
• Formal meetings at their adviser’s office is the main way that Baby Boomers like to have face‑to‑face meetings. In fact, preference for informal catch‑ups (e.g. over coffee) and formal meetings at home/work is very low for Baby Boomers compared to other generations.
The most preferred method of communication across all personal one‑to‑one communication methods is personal emails, approximately one third more important than formal meetings at the adviser’s office, the next most preferred one‑to‑one communication method overall (36% preference vs. 22% overall). Notably, Gen Y clients tend to prefer informal catch‑ups over formal meetings in their adviser’s office (17% vs. 14% preference). Phone calls are the next most preferred method of personal communication (15% preference overall), then formal meetings at home/work and informal catch‑ups which were equally preferred (10% and 9%). Preferences for other types of personal one‑to‑one communication methods are small. Refer to Figure 10 and Figure 11.

12 CONNECTING WITH CLIENTS | © BEDDOES INSTITUTE 2013
Detailed Findings
Figure 10: Most preferred one‑to‑one personal communication method across all generations
36%
22%
15%
10% 9%
3% 3% 2% 1%
PersonalEmails
Formalmeetings at theadviser's office
Phone calls Formalmeetings at
your home/work
Informalcatch-ups (e.g.over coffee)
Letters/cards SMS Skype Fax
Y X B2+ +
Figure 11: Most preferred one‑to‑one personal communication method by generation
35%
14%
3%
13%
3% 2% 1%
13%17%
39%
17%15%
4%
11%
3% 2% 1%
9%
33%30%
16%
3%8%
2% 1% 1%
7%
YGEN
XGEN
B2
BABY BOOMERS
PersonalEmails
Informalcatch-ups(e.g. overcoffee)
Formalmeetings atthe adviser’s
office
Phone calls SMSFormalmeetings at
yourhome/work
Letters/cards Skype Fax

13CONNECTING WITH CLIENTS | © BEDDOES INSTITUTE 2013
Detailed Findings
Preferences for personal emails are highest for Gen X (39%) and lowest for Baby Boomers (33%), although differences are not statistically significant. Refer to Figure 12.
Figure 12: Preferences for personal emails by generation
36% 35%
39%
33%
Total Gen Y Gen X Baby Boomers
Baby Boomers are significantly more likely than younger clients to prefer formal meetings at their adviser’s office (30% vs. 17% for Gen X and 14% for Gen Y). Refer to Figure 13.
Figure 13: Preferences for formal meetings at the adviser’s office by generation
22%
14% 17%
30%
Total Gen Y Gen X Baby Boomers
Preferences for phone calls are approximately equal for Gen Y, Gen X and Baby Boomer clients with no statistically significant differences across the generations. Refer to Figure 14.
Figure 14: Preferences for phone calls by generation
15%
13% 15%
16%
Total Gen Y Gen X Baby Boomers
Significantly more Gen X clients prefer formal meetings at their home/work (11%) while significantly few Baby Boomer clients prefer this method of communication (8%). Refer to Figure 15.
Figure 15: Preferences for formal meetings at your home/work by generation
10%
13%
11%
8%
Total Gen Y Gen X Baby Boomers

14 CONNECTING WITH CLIENTS | © BEDDOES INSTITUTE 2013
Detailed Findings
Significantly more Gen Y clients prefer informal catch‑ups (17%) while significantly fewer Baby Boomer clients prefer this method of communication (7%). Refer to Figure 16.
Figure 16: Preferences for informal catch‑ups (e.g. over coffee) by generation
9%
17%
9%
7%
Total Gen Y Gen X Baby Boomers

15CONNECTING WITH CLIENTS | © BEDDOES INSTITUTE 2013
Detailed Findings
One‑to‑Many Communication Preferences
Electronic newsletters are currently the most preferred method of one‑to‑many communication, quite possibly as a result of familiarity as this is a common marketing tool used by leading practices. Approximately one in three clients prefer this type of communication above all other forms of one‑to‑many communication.
However, digital/social media is not far behind with one in four clients most preferring this type of communication.
Printed newsletters and printed information packs trail this while webinars are the least preferred form of one‑to‑many communication across all clients.
Gen Y Clients• Gen Y clients want electronic newsletters less than Gen X and Baby Boomer clients.
• Even more than electronic newsletters, however, Gen Y clients want to interact via digital/social media channels, more so than any other generation, especially via apps. All other forms of digital/social media communication are on equal footing in terms of preferences.
• In contrast, this generation is significantly less inclined to want printed material from their adviser.
Gen X Clients• Gen X clients want electronic newsletters first and foremost.
• However, their appetite for interacting via digital/social media channels is not far behind, ahead of their desire for printed newsletters.
• Within the digital/social media mix, their preference is strongest for Apps (although not as strong as Gen Y) and then evenly spread across other forms of this communication.
Baby Boomer Clients• Baby Boomer clients also prefer electronic newsletters more than any other one‑to‑many
communication methods.
• Notably, their appetite for interacting via digital/social media channels is almost on par with Gen X, and approximately equal to their desire for printed material.
The most preferred one‑to‑many communication method across all clients is electronic newsletters (34% preference overall) however there are some differences across the generations. Specifically, while the appetite for electronic newsletters is approximately equal for Gen X and Baby Boomer clients (34% and 35% respectively), Gen Y clients prefer to interact via digital/social media channels much more than receiving electronic newsletters (44% preference vs. 26%). Printed newsletters and printed information packs trail with 18% and 17% preference overall respectively, especially among Gen Y clients (12% and 10%) while webinars is the least preferred form of one‑to‑many communication with only 7% preference overall. Refer to Figure 17 and Figure 18.

16 CONNECTING WITH CLIENTS | © BEDDOES INSTITUTE 2013
Detailed Findings
Figure 17: Most preferred one‑to‑many communication method across all generations
34%
24%
18% 17%
7%
Electronicnewsletters
Totaldigital/social
media
Printednewsletters
Printedinformation packs
Webinars
Y X B2+ +
Figure 18: Most preferred one‑to‑many communication method by generation
44%
26%
12%10% 8%
34%
25%18% 16%
7%
Totaldigital/social
media
Electronicnewsletters
Printedinformation
packs
Printednewsletters
Webinars
35%
21% 19% 18%
7%
YGEN
XGEN
B2
BABY BOOMERS

17CONNECTING WITH CLIENTS | © BEDDOES INSTITUTE 2013
Detailed Findings
Preferences for electronic newsletters are highest for Gen X (34%) and Baby Boomers (35%) and lowest for Gen Y (26%), although differences are not statistically significant. Refer to Figure 19.
Figure 19: Preferences for electronic newsletters by generation
34%
26%
34% 35%
Total Gen Y Gen X Baby Boomers
Preference for digital/social media communication is largely being driven by Gen Y (44% preference). Most notably, Gen Y clients have a thirst for apps (16% preference) more so than any other form of digital/social media communication. Significantly more Gen Y clients also prefer LinkedIn (6%), blogs (5%), FaceBook (5%) and Twitter (3%) compared to other generations.
In contrast, preferences for digital/social media communication are significantly lower for Baby Boomers than other generations, especially for apps (5%), LinkedIn (3%), blogs (3%), FaceBook (2%) and Twitter (1%).
Gen X preferences for digital/social media communication sit somewhere in between those of Gen Y and Baby Boomers. Refer to Figure 20.
Figure 20: A breakdown of different digital/social media communication method preferences
24%
7% 4% 4% 3% 3% 2% 1%
44%
16%
4% 6% 4% 5% 5% 3%
25%
7%4% 4% 3% 3% 3% 1%
21%
5% 5% 3% 3% 3% 2% 1%
Totaldigital/social
media
Apps Podcasts (audio) LinkedIn Videos(YouTube)
Blogs FaceBook Twitter
Total Gen Y Gen X Baby Boomers

18 CONNECTING WITH CLIENTS | © BEDDOES INSTITUTE 2013
Detailed Findings
Gen Y clients are significantly less likely than older clients to prefer printed newsletters (10% vs. 18% for Gen X and 19% for Baby Boomers). Refer to Figure 21.
Figure 21: Preferences for printed newsletters by generation
18%
10%
18% 19%
Total Gen Y Gen X Baby Boomers
Likewise, Gen Y clients are significantly less likely than older clients to prefer printed information packs (12% vs. 16% for Gen X and 18% for Baby Boomers). Refer to Figure 22.
Figure 22: Preferences for printed information packs by generation
17%
12%
16%
18%
Total Gen Y Gen X Baby Boomers
Preference for webinars is low with no statistically significant differences across the generations. Refer to Figure 23.
Figure 23: Preferences for webinars by generation
7%
8%
7% 7%
Total Gen Y Gen X Baby Boomers

19CONNECTING WITH CLIENTS | © BEDDOES INSTITUTE 2013
Detailed Findings
Impact of the Number of Communication Channels on SatisfactionLeading practices communicate with their clients via a number of different channels. Figure 24 shows the average adviser satisfaction split by the count of communication channels used by a practice. There is a strong relationship between satisfaction and number of communication channels up to the 4‑channel point, after which the benefits start to diminish.
Figure 24: Client satisfaction with adviser by number of communication channels used
6.9
7.9 8.5
8.9 9.1 9.3 9.4 9.5
1 2 3 4 5 6 7 8+
Number of communication channels
There is a strong relationship between
satisfaction and number of ways a practice
communicates with its clients – a ‘more is more’ effect which is consistent
across all generations.
Figure 25 shows results for satisfaction by the number of communication channels used for the three generation groups. Results suggest that this ‘more is more’ effect is consistent across ages, with clients in all three generations reporting higher satisfaction with practices who communicate via a larger number of channels.
Figure 25: Client satisfaction with adviser by number of communication channels used
7.5 8.2
9.8
7.5
8.9 9.1
7.7
8.8 9.2
1-2 3 + 4 5+
Number of communication channels
Gen Y Gen X Baby Boomers

20 CONNECTING WITH CLIENTS | © BEDDOES INSTITUTE 2013
Detailed Findings
While there is a clear relationship between the number of channels used and satisfaction, one possibility is that the clients receiving communications via more channels are in fact higher value clients, who tend to receive a special level of account management from their adviser.
To control for this possible explanation, satisfaction by number of channels used was analysed separately for three different groups of clients; 1) those whose adviser looked after one or some of their needs, 2) those whose adviser looked after most of their needs; and 3) clients whose adviser looked after all of their needs. Refer to Figure 26.
This analysis revealed that more communication results in higher client satisfaction irrespective of the value of the client. These results also indicate that multi‑channel communication is a hallmark of leading practices.
Figure 26: Client satisfaction with adviser by share of client’s wallet
6.1
8.4 9.1
7.9
8.8 9.2 8.9 9.0
9.6
1-2 3 + 4 5+
Manages one/someof clients’ needs
Manages mostof clients’ needs
Manages all of clients’ needs
21CONNECTING WITH CLIENTS | © BEDDOES INSTITUTE 2013
Detailed Findings
How do Leading Practices Communicate with their Clients?
Communication Methods used by Leading Practices
One‑to‑one Personal Communication Methods Used by Leading Practices
Almost all clients of leading practices had received personal emails, phone calls and formal meetings at the adviser’s office in the last 12 months.
However, letters/cards were only received by about one in four clients, only one in four had met with their adviser at their home/work and one in five had caught up informally with their adviser. SMS, fax and skype had rarely been used.
Leading practices appear to tailor their communication methods to the intuitive needs of each generation they are working with. For example, significantly more Baby Boomers had experienced a formal meeting in their adviser’s office and had received letters/cards than other generations. In contrast, significantly more Gen X and Gen Y clients had caught up informally with their financial adviser than Baby Boomers.
One‑to‑Many Communication Methods Used by Leading Practices
Electronic newsletters are by far the most common type of one‑to‑many communication used by leading practices with nearly half of all clients receiving these in the last 12 months. This is followed by printed newsletters received by one in five clients, digital/social media used by one in six clients, printed information packs received by just over one in ten clients and webinars which almost no one had experienced.
As with personal one‑to‑one communication, leading practices appear to tailor their one‑to‑many communication methods to the intuitive needs of each generation. Specifically, more than two times as many Gen Y clients had interacted with their adviser via digital/social media channels in the last 12 months than Gen X clients and four times more than Baby Boomer clients. Conversely, twice as many Baby Boomers had received printed newsletters compared to Gen X clients and three times as many as Gen Y clients.
Clients were asked to report on all the ways they currently receive communication from their practice from the same list of 20 different communication methods used to ascertain communication preferences.
Communication methods received by clients were again grouped into personal one‑to‑one and one‑to‑many communication methods.
Communication methods received by clients of leading practices was then analysed for each group separately at the overall level as well as by generation.
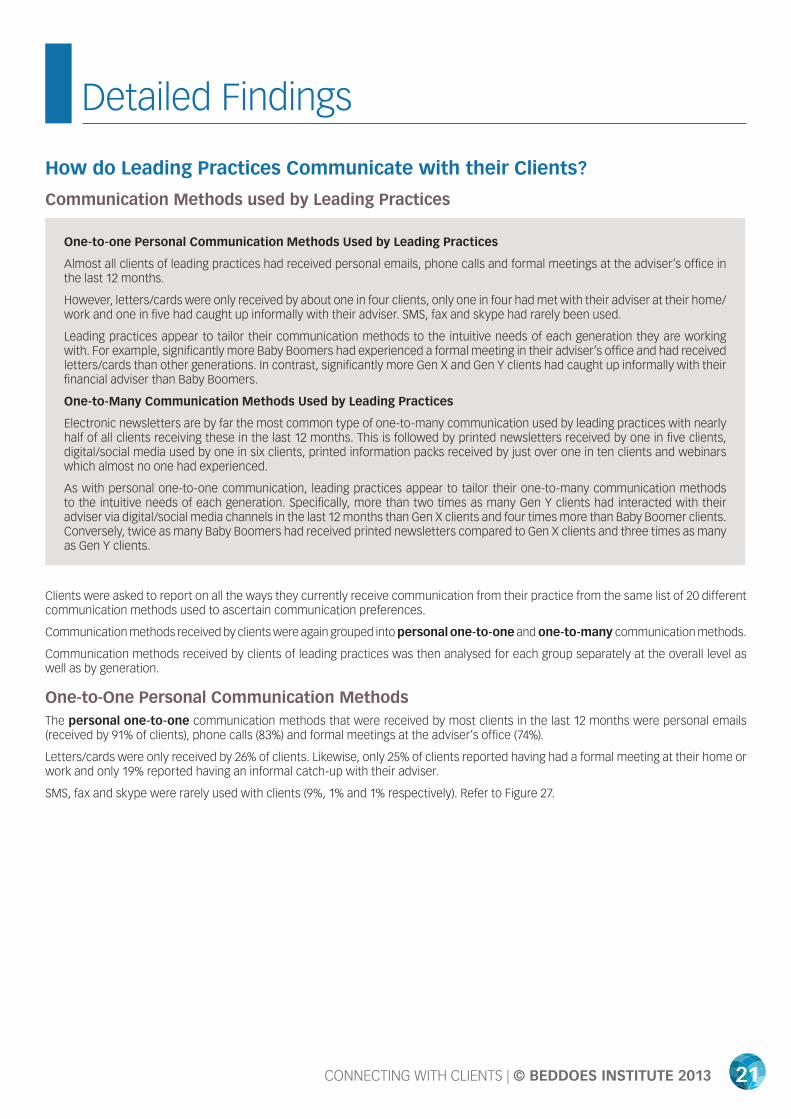
One‑to‑One Personal Communication MethodsThe personal one‑to‑one communication methods that were received by most clients in the last 12 months were personal emails (received by 91% of clients), phone calls (83%) and formal meetings at the adviser’s office (74%).
Letters/cards were only received by 26% of clients. Likewise, only 25% of clients reported having had a formal meeting at their home or work and only 19% reported having an informal catch‑up with their adviser.
SMS, fax and skype were rarely used with clients (9%, 1% and 1% respectively). Refer to Figure 27.

22 CONNECTING WITH CLIENTS | © BEDDOES INSTITUTE 2013
Detailed Findings
Figure 27: Personal one‑to‑one communication methods received by clients in the last 12 months
91% 83%
74%
26% 25% 19%
9% 1% 1%
Personalemails
Phone calls Formalmeetings atthe adviser's
office
Letters/cards Formalmeetings at
yourhome/work
Informalcatch-ups (e.g.over coffee)
SMS Fax Skype
Slightly more Gen Y clients reported receiving personal emails in the last 12 months (95%) compared to Gen X (89%) and Baby Boomer clients (92%) although differences are not statistically significant. Refer to Figure 28.
Figure 28: The proportion of clients that received personal emails in the last 12 months
91%
95%
89%
92%
Total Gen Y Gen X Baby Boomers
This trend was also true for phone calls. Slightly more Gen Y clients reporting receiving phone calls in the last 12 months (95%) compared to Gen X (83%) and Baby Boomer clients (81%) although differences are not statistically significant. Refer to Figure 29.
Figure 29: The proportion of clients that received phone calls in the last 12 months
83%
95%
83% 81%
Total Gen Y Gen X Baby Boomers

23CONNECTING WITH CLIENTS | © BEDDOES INSTITUTE 2013
Detailed Findings
Significantly more Baby Boomer clients reported having formal meetings in the adviser’s office in the last 12 months (80%) compared to the younger generations ‑ Gen X (68%) and Gen Y (62%). Refer to Figure 30.
Figure 30: The proportion of clients that received formal meetings at the adviser’s office in the last 12 months
74%
62% 68%
80%
Total Gen Y Gen X Baby Boomers
Significantly more Baby Boomer clients reported receiving letters/cards in the last 12 months (30%) compared to the younger generations ‑ Gen X (22%) and Gen Y (22%). Refer to Figure 31.
Figure 31: The proportion of clients that received letters/cards in the last 12 months
26%
22% 22%
30%
Total Gen Y Gen X Baby Boomers
More Gen Y clients reported having formal meetings at their home/work in the last 12 months (27%) compared to the Gen X (22%) and Baby Boomers (23%) although differences are not statistically significant. Refer to Figure 32.
Figure 32: The proportion of clients that received formal meetings at their home/work in the last 12 months
25%
27%
26%
23%
Total Gen Y Gen X Baby Boomers
Significantly more Gen Y clients reported having informal catch‑ups (e.g. over coffee) in the last 12 months (32%) compared to the older generations ‑ Gen X (21%) and Baby Boomers (15%). Refer to Figure 33.
Figure 33: The proportion of clients that received informal catch‑ups (e.g. over coffee) in the last 12 months
19%
32%
21%
15%
Total Gen Y Gen X Baby Boomers
24 CONNECTING WITH CLIENTS | © BEDDOES INSTITUTE 2013
Detailed Findings
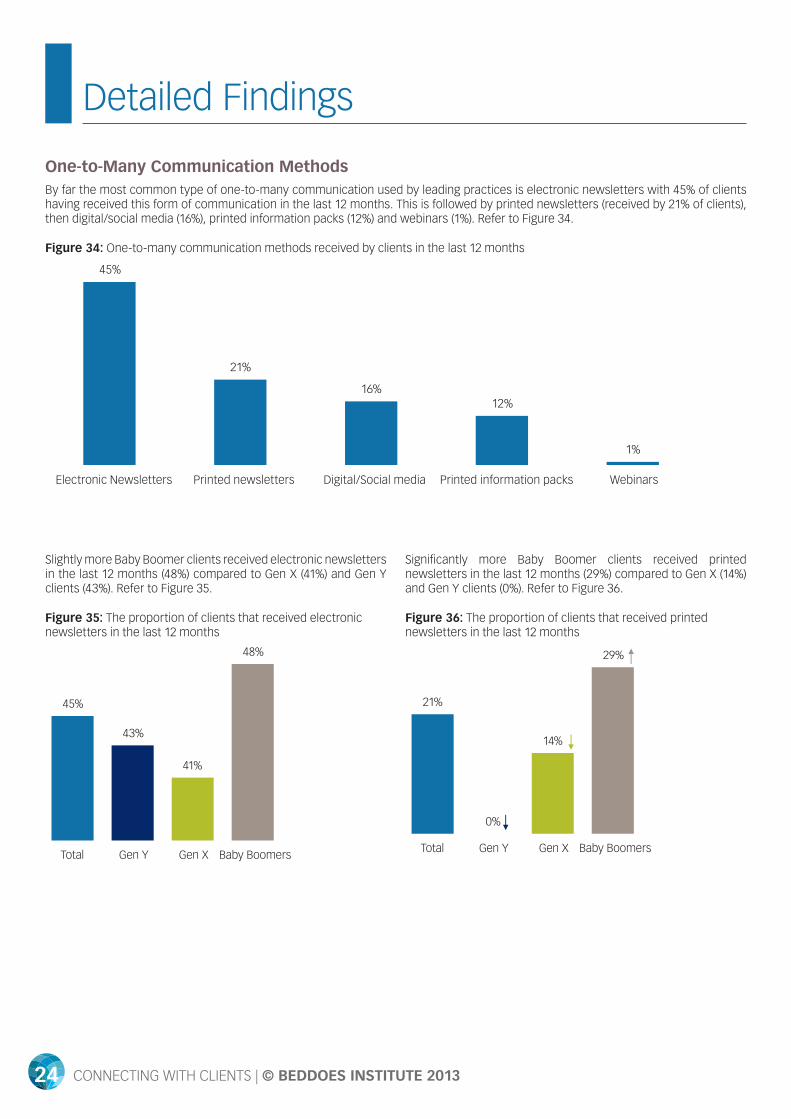
One‑to‑Many Communication MethodsBy far the most common type of one‑to‑many communication used by leading practices is electronic newsletters with 45% of clients having received this form of communication in the last 12 months. This is followed by printed newsletters (received by 21% of clients), then digital/social media (16%), printed information packs (12%) and webinars (1%). Refer to Figure 34.
Figure 34: One‑to‑many communication methods received by clients in the last 12 months
45%
21%
16% 12%
1%
Electronic Newsletters Printed newsletters Digital/Social media Printed information packs Webinars
Slightly more Baby Boomer clients received electronic newsletters in the last 12 months (48%) compared to Gen X (41%) and Gen Y clients (43%). Refer to Figure 35.
Figure 35: The proportion of clients that received electronic newsletters in the last 12 months
45%
43%
41%
48%
Total Gen Y Gen X Baby Boomers
Significantly more Baby Boomer clients received printed newsletters in the last 12 months (29%) compared to Gen X (14%) and Gen Y clients (0%). Refer to Figure 36.
Figure 36: The proportion of clients that received printed newsletters in the last 12 months
21%
0%
14%
29%
Total Gen Y Gen X Baby Boomers

25CONNECTING WITH CLIENTS | © BEDDOES INSTITUTE 2013
Detailed Findings
The proportion of Gen Y, Gen X and Baby Boomer clients that received printed information packs in the last 12 months was approximately equal (11%, 10% and 14% respectively) with no significant differences across the generations. Refer to Figure 38.
Figure 38: The proportion of clients that received printed information packs in the last 12 months
12% 11%
10%
14%
Total Gen Y Gen X Baby Boomers
More Gen Y clients received communication via digital/social media channels in the last 12 months (43%) compared to Gen X (18%) and Baby Boomer clients (10%), especially via Twitter (14% vs. 2% and 0%), and FaceBook (11% vs. 5% and 2%). Refer to Figure 37.
Figure 37: The proportion of clients that received digital/social media communication in the last 12 months
16%
6% 4%
2% 2% 2% 0% 0%
43%
11% 11% 14%
3% 5%
0% 0%
18%
7% 5%
2% 2% 1% 0% 0%
10%
4% 2%
0% 2% 2% 0% 0%
Totaldigital/social
media
LinkedIn FaceBook Twitter Videos(YouTube)
Blogs Podcasts (audio) Apps
Total Gen Y Gen X Baby Boomers
The proportion of clients that received webinars in the last 12 months was low across all generations (0% of Gen Y, 1% of Gen X and 0% of Baby Boomer clients). Refer to Figure 39.
Figure 39: The proportion of clients that received webinars in the last 12 months
1%
0%
1%
0%
Total Gen Y Gen X Baby Boomers

26 CONNECTING WITH CLIENTS | © BEDDOES INSTITUTE 2013
Detailed Findings
Current vs. Preferred Communication MethodsThis chapter compares communication preferences of clients across different generations to the current communication received by these clients to understand how leading financial advice practices are delivering on the communication needs of their clients.
To facilitate comparison, these two metrics have been charted together on different axes. The wide bar on each chart represents the percent of clients whose practices currently communicate via a given channel (charted on the left‑hand axis), while the narrow bar shows the probability of that channel being their most preferred method of communication (charted on the right‑hand axis).
It is important to note that current communication methods received and most preferred communication method are different metrics (current communication methods received was a multiple response question whereas preferred communication represents the single most preferred communication method) and so direct comparison of the percentages is not possible. Instead, inferences are made based on the overlay of communication preferences on current communication received.
One‑to‑One Personal Communication Methods
Leading practices do well in terms of meeting their clients’ communication preferences overall hence why they are leading practices in the eyes of their clients. This is especially true given that decisions regarding communication strategy have, until now, had to be made intuitively given the absence of communication preferences data. That said, subtle improvements can still be made now that data is available.
Personal emails are clients’ most preferred type of personal communication and this is also most used by leading practices. However, this style of personal communication is potentially being under‑utilised relative to client preferences for Gen X.
Additionally, formal meetings at the adviser’s office may be slightly over‑done relative to client preferences for Gen Y and Gen X clients. In contrast, informal catch‑ups (e.g. over coffee) appear to be under‑utilised relative to client preferences for Gen Ys.
The extent to which leading practices conduct formal meetings at home/work is relatively low and appears to be aligned with client preferences for this style of meeting overall. However, there is a possibility that this style of meeting is also being under‑utilised with Gen Y clients.
Phone calls are potentially being slightly over‑utilised relative to client preferences for all generations but especially for Gen Y clients.
There is a high degree of alignment between the most used and most preferred channel of communication (refer to Figure 40). Specifically, personal emails are the most preferred one‑to‑one communication method for clients and they are also the most common communication channel used by leading practices with 91% of clients receiving personal emails in the last 12 months.
Formal meetings at the adviser’s office are the second most preferred one‑to‑one communication method for clients but they are the third most common communication channel used by leading practices with 74% of clients having had a formal meeting on their adviser’s office in the last 12 months. This suggests that formal meetings at the adviser’s office are possibly being under‑done relative to client preferences.
There is an even bigger disparity with phone calls. This is the third most preferred one‑to‑one communication method but is the second most used form of one‑to‑one communication with 83% of clients receiving phone calls in the last 12 months. This suggests that phone calls are possibly being over‑done relative to client preferences.
Formal meetings at home/work are the fourth most preferred one‑to‑one communication method for clients and they are the fifth most common communication channel used by leading practices with 25% of clients reporting a formal meeting at their home/work in the last 12 months.
Informal catch‑ups are the fifth most preferred one‑to‑one communication method for clients and they are the sixth most common communication channel used by leading practices with 19% of clients reporting having had an informal catch‑up in the last 12 months.
Letters/cards are the sixth most preferred one‑to‑one communication method for clients and they are the fourth most common communication channel used by leading practices with 26% of clients reporting having received a letter/card in the last 12 months. This suggests that letters/cards are possibly being over‑done relative to client preferences.

27CONNECTING WITH CLIENTS | © BEDDOES INSTITUTE 2013
Detailed Findings
Figure 40: Current vs. preferred communication methods for personal one‑to‑one communication across all generations
0%
20%
40%
0%
50%
100%
PersonalEmails
Formalmeetings at theadviser's office
Phone calls Formalmeetings athome/work
Informalcatch-ups (e.g.over coffee)
Letters/cards SMS Skype Fax
Pref
erre
d C
han
nel
Cur
ren
t C
han
nel
s
Current Preferred
Analysis of current vs. preferred communication methods for personal one‑to‑one communication by generation (Figure 41) reveals some nuances. Specifically, personal emails are potentially being under‑utilised relative to client preferences for Gen X. Likewise, formal meetings at home/work are also potentially being under‑utilised relative to client preferences for Gen X clients and informal catch‑ups (e.g. over coffee) are also being under‑utilised relative to client preferences for Gen Y.
In contrast, formal meetings at the adviser’s office are potentially being over‑utilised relative to client preferences for Gen X and Gen Y clients. Likewise, phone calls are potentially being over‑utilised relative to client preferences for all generations but especially for Gen Y clients.
Figure 41: Current vs. preferred communication methods for personal one‑to‑one communication by generation
0%
10%
20%
30%
40%
0%
50%
100%
Personal Emails Formal meetingsat the adviser's
office
Phone calls Formal meetingsat home/work
Informal catch-ups (e.g. over
coffee)
Letters/cards SMS Skype FaxPr
efer
red
Ch
ann
el
Cur
ren
t C
han
nel
s
Gen Y Current Gen X Current Baby Boomers CurrentGen Y Preferred Gen X Preferred Baby Boomers Preferred

28 CONNECTING WITH CLIENTS | © BEDDOES INSTITUTE 2013
Detailed Findings
One‑to‑Many Communication Methods
In terms of one‑to‑many communication, it appears that digital/social media is being under‑utilised relative to client preferences across all generations.
While the same is also true for printed information packs and webinars, this is less significant as preferences for these methods of communication are much lower.
Finally, there is good alignment between the use of electronic newsletters and printed newsletters and client preferences at the overall level; however, printed newsletters appear to be under‑utilised relative to client preferences among Gen X and Gen Y.
Analysis of current vs. preferred communication methods for one‑to‑many communication methods (Figure 42) reveals more interesting findings. Most notably, it appears that digital/social media is being under‑utilised relative to client preferences across all clients. The same is also true for printed information packs and webinars although preferences for these methods of communication are much lower. In contrast, use of electronic newsletters and printed newsletters is largely aligned with client preferences.
Figure 42: Current vs. preferred communication methods for one‑to‑many communication across all generations
0%
10%
20%
30%
0%
50%
Electronic Newsletters Digital/Social media Printed newsletters Printed information packs Webinars
Pref
erre
d C
han
nel
Cur
ren
t C
han
nel
s
Current Preferred

29CONNECTING WITH CLIENTS | © BEDDOES INSTITUTE 2013
Detailed Findings
Analysis of current vs. preferred communication methods for one‑to‑many communication methods by generation (Figure 43) reveals that digital/social media communication appears to be under‑utilised relative to client preferences across all generations.
Printed newsletters also appear to be under‑utilised relative to client preferences among Gen Y and Gen X clients.
Printed information packs also appear to be under‑utilised relative to client preferences for Gen X clients while webinars appear to be under‑utilised across all generations.
Figure 43: Current vs. preferred communication methods for one‑to‑many communication by generation
55%
0%
10%
20%
30%
40%
50%
0%Electronic Newsletters Digital/Social media Printed newsletters Printed information packs Webinars
Pref
erre
d C
han
nel
Cur
ren
t C
han
nel
s
Gen Y Current Gen X Current Baby Boomers CurrentGen Y Preferred Gen X Preferred Baby Boomers Preferred
The biggest gap – and therefore the biggest opportunity – between current and preferred digital/social media communication channels across all clients is apps followed by podcasts (Figure 44). Videos and blogs are also somewhat under‑utilised relative to client preferences.
Figure 44: Current vs. preferred communication methods for digital/social media channels across all generations
0%
2%
4%
6%
0%
2%
4%
6%
8%
Apps Podcasts (audio) LinkedIn Videos (YouTube) Blogs FaceBook Twitter
Pref
erre
d C
han
nel
Cur
ren
t C
han
nel
s
Current Preferred

30 CONNECTING WITH CLIENTS | © BEDDOES INSTITUTE 2013
Detailed Findings
The Benefits of Getting the Communication Mix Right – Improved Client Satisfaction
The benefits of delivering to client expectations are clear; advisers who communicate using their clients’ favoured channels achieve higher client satisfaction, have stronger client relationships and have clients that are more likely to recommend their practice.
Importantly, multi‑channel communication is a hallmark of leading practices. Leading practices offer a mix of channels to suit their clients’ needs and reap significant rewards in terms of client engagement.
The results thus far have shown how leading practices currently communicate with their clients and how clients of various generations prefer to receive communication. This raises the question; ‘what are the benefits to a practice of meeting the communication needs of its clients?’
Clients were asked to rate their overall satisfaction with their adviser over the last 12 months. Ratings were given on a scale of 0‑10 where 0 is ‘Not at all satisfied’ and 10 is ‘Extremely satisfied’. Overall, the clients of leading practices are highly satisfied: 2 out of 3 clients rated their adviser a 9 or a 10 out of 10, with an average rating of 8.8 out of 10 across all clients.
In order to quantify the benefits to an advisory practice of delivering on communication needs, the satisfaction levels of two groups of clients were compared:
1. Clients who currently receive communication from their practices according to preferences; and
2. Clients who receive communication via methods that are not aligned with preferences.

31CONNECTING WITH CLIENTS | © BEDDOES INSTITUTE 2013
Detailed Findings
Figure 45 shows that at the overall level, practices that communicate with their clients using preferred methods achieve higher levels of overall adviser satisfaction. The largest satisfaction gaps are evident for email and phone calls:
• Clients who prefer email and also received personal email communication have adviser satisfaction scores that are an average of 0.7 points higher on an 11 point satisfaction scale than those who did not (8.8 vs. 8.1); and
• Clients who prefer phone calls and also received phone calls have adviser satisfaction scores that are an average of 0.9 points higher on an 11 point satisfaction scale than those who did not receive phone calls (8.9 vs. 8.0).
Adviser satisfaction was also significantly higher for clients who wanted and had formal meetings at their adviser’s office (8.9 vs. 8.4) or at their home or work (9.0 vs. 8.7).
These results suggest that practices who communicate with their clients in the right ways achieve higher overall satisfaction. Although not reported in this white paper, similar results were observed for the propensity to recommend the practice and strength of relationship with the practice.
Figure 45: Adviser satisfaction among clients whose communication needs are met vs. not met across all clients
Emails
Formal meetings atthe adviser’s office
Phone calls
Formal meetings atyour home/work
ElectronicNewsletters
8.8
8.9
8.9
8.9
9.0
8.1
8.4
8.0
8.7
8.7
Clients withneeds met
Clients withoutneeds met
The following charts show the average satisfaction scores for clients whose
communication needs are met vs. not met. The dark bar represents the average adviser
satisfaction score among clients who received communication via their preferred channel, while the lighter bar represents the average adviser satisfaction score among those who did not. The gap between these two scores
shows the benefits to a practice of delivering on clients’ communication preferences.

32 CONNECTING WITH CLIENTS | © BEDDOES INSTITUTE 2013
Detailed Findings
The following charts show the communication channels with the largest satisfaction gap for each generation.
Gen Y clients whose practices met their need for informal catch‑ups averaged 1.1 higher on an 11 point satisfaction scale (9.5 vs. 8.4) than those whose practices did not. A similar gap was evident for those whose practices scheduled formal meetings in‑office (9.1 vs. 8.1) while there was no difference associated with formal meetings at their home/work. Refer to Figure 46.
Figure 46: Adviser satisfaction among clients whose communication needs are met vs. not met among Gen Y clients
Informal catch-ups(e.g. over coffee)
Formal meetings atthe adviser’s office
9.5
9.1
8.7
8.4
8.1
8.7Formal meetings at
your home/work
Gen X clients whose practices met their need for email and phone calls gave significantly higher satisfaction ratings (by 1.4 and 1.2 scale points respectively) than those whose practices did not.
Informal catch‑ups and formal meetings at their home or work were linked to somewhat higher satisfaction (0.7 and 0.4 scale points) for Gen X clients while meetings at the adviser’s office were associated with slightly lower overall satisfaction (although not significantly). Refer to Figure 47.
Figure 47: Adviser satisfaction among clients whose communication needs are met vs. not met among Gen X clients
Emails
Formal meetings atthe adviser’s office
Phone calls
Formal meetings atyour home/work
Informal catch-ups(e.g. over coffee)
8.9
8.7
9.0
9.3
9.0
7.5
8.8
7.8
8.6
8.6
Baby Boomers tend to have very high satisfaction ratings across the board, and so the gaps associated with particular communication channels are smaller than for other generations. However, satisfaction is significantly higher for Baby Boomer clients whose practices met their needs for phone calls (0.8 scale points), formal meetings at the office (0.6 scale points), and formal meetings at their home or work (0.4 scale points). Gains associated with emails and electronic newsletters were not significant. Refer to Figure 48.
Figure 48: Adviser satisfaction among clients whose communication needs are met vs. not met among Baby Boomer clients
Emails
Formal meetings atthe adviser’s office
Phone calls
ElectronicNewsletters
Formal meetings atyour home/work
8.9
9.0
9.0
9.2
8.9
8.7
8.4
8.2
8.8
8.8
Emails
Formal meetings atthe adviser’s office
Phone calls
Formal meetings atyour home/work
ElectronicNewsletters
8.8
8.9
8.9
8.9
9.0
8.1
8.4
8.0
8.7
8.7
Clients withneeds met
Clients withoutneeds met

33CONNECTING WITH CLIENTS | © BEDDOES INSTITUTE 2013
Using data from this research, an interactive communication mix
simulator has now been developed. This is a purpose‑built tool that will help practice owners design
(or re‑design) their communication strategy to achieve maximum reach with the generation/s of clients they are working with, thereby improving
their business’ ability to connect with clients.
For more information on this
tool please visit the AFA website www.afa.asn.au or visit
connectingwithclients.com.au
Conclusion
This white paper contains a number of pertinent messages for financial advisers related to how they can communicate with their clients and the value in getting it right. First and foremost, financial advisers need to think about their communication mix in terms of one‑to‑one or one‑to‑many communication as each requires different methods of communication. Secondly, they must tailor their communication strategy to suit the needs of the generation/s they are working with as each generation has unique and different preferences. Finally, they need to consider how many channels of communication they are using and how often they are connecting with their clients given the ‘more is more’ effect that has been identified in this white paper.
The benefits of delivering in these three areas are clear: advisers who communicate using their clients’ favoured channels achieve higher client satisfaction, have stronger client relationships and have clients that are more likely to recommend their practice. The implications for the overall profitability of the practice are obvious.

CONNECTING WITH CLIENTS | © BEDDOES INSTITUTE 2013