connecting to nature - wessanen€¦ · as part of our mission and vision, wessanen aims to make a...
TRANSCRIPT

Connectingto nature
IntegratedAnnual Report
2017

CONTENTS
Welcome3 Letter from the CEO 5 Main Performance Dashboard
About us
6 Our purpose 7 Global food issues 8 Mission and vision 9 Food trends 10 Our strategic focus and SWOT analysis 11 Our strategy 12 How we create value 13 Our core categories 14 Our brands 15 Where we are based 16 People matter 18 Operations
Our marketplace21 A food revolution is underway 22 Reasons for buying organic food 23 Why fair trade is fair
Sustainability
26 Governance 27 Stakeholder dialogue 28 Stakeholder interviews 29 Materiality matrix 30 UN Sustainable Development Goals 32 How we manage (material) topics 40 Connectivity matrix 42 KPIs 2015 – 2017 43 Process and benchmarks 44 Dilemmas
Financial Review, Risk & Governance
47 Biographies 48 Total Performance Dashboard 49 Financial review 54 Principal risks and opportunities 66 Corporate Governance Report 71 Statements
19
24
4572
INTERVIEW We provide healthy food as
intended by nature
INTERVIEW We cooperate
with our ecosystem
INTERVIEW We are as
resource efficient
as nature
INTERVIEW We are an agile and
diversecommunity
Report of the Executive Board
Report of the Supervisory Board75 Biographies 76 To the Shareholders 79 Remuneration Report
Financial statements 83 Contents
Other information145 Independent auditor’s report 149 Independent assurance statement 150 Financial summary 2013-2017 153 Shareholder information 156 Glossary (acronyms and definitions)
2Wessanen Integrated Annual Report 2017

SustainabilityAbout us Financial Review, Risk &
Governance
Report of the Supervisory Board
Financial statements
Other information
Our marketplaceWelcome
3Wessanen Integrated Annual Report 2017
Welcome
WELCOMELetter from the CEO
Connecting to natureAs we look at the challenges of the food market today among which a global obesity epidemic, enormous sustainability challenges and social imbalance in the value chain, the key questions are ‘what has gone wrong’ and ‘how are we going to change things’? We believe the industrialisation of food has broken a vital link between humans and the food we eat. So rather than to hope that more complex science will fix the problem we believe the answer lies in connecting to nature.
Christophe Barnouin CEO
3Wessanen Integrated Annual Report 2017

SustainabilityAbout us Financial Review, Risk &
Governance
Report of the Supervisory Board
Financial statements
Other information
Our marketplaceWelcome
REPORT OF THE EXCECUTIVE BOARD
Helping people make better choices when it comes to food is a key challenge and we are seeing that just adding more and complex information will lead to more confusion and anxiety rather than to a change of behaviour. Food is one of the simplest, most intuitive parts of human life and we need to get back to making things easy to understand again. The way to make people and planet healthier is to follow natural principles rather than to get caught up in more complex science and technologies. The same is true for us as a business.
In 2017 we have continued to follow a simple and focused strategy designed to deliver long-term value for our business and its stakeholders.
Sustainable, profitable growthOur first priority is to grow our brands in core categories and we continued to make good progress in the market place, have overall strengthened our brands and achieved more international leverage of core categories. Many of our brands have recorded double-digit growth and overall autonomous growth for own brands was 7.7%. Our private label and distribution business declined significantly given our strategy to focus on own brands. In total, our business has grown by 9.8% (with 2.0% representing our autonomous growth).
Our operating result before exceptional items (‘EBITE’) has increased by 30% to €53.5 million which is 8.5% of revenue.
Our second strategic focus is on upgrading our operations. We have invested significantly into our factories and have completed a number of in-sourcing projects that positively impact margins. We are improving the management of our supply chain and have initiated projects to increase the transparency of our raw material sourcing.
Our third priority is to become a green, attractive and efficient company. 90% of the electricity we have purchased in 2017 was from renewable sources, 78% of our revenue is organic and 96% vegetarian. We have strengthened our management of human resources and are working on further improving all processes across our business.
Our French business is certified B Corp and we are working on more countries to complete this important certification. Since 2017, we are a participant in the UN Global Compact.
Finally, we have focused in 2017 on integrating the acquisitions we have made in 2016. Piramide, Destination, Mrs Crimble’s and Biogran are now full members of the Wessanen family and all integration projects are on track.
2017 has been a good year for us and I want to thank all people at Wessanen for their passion and dedication to making our business and the world of food a little better every day.
The journey aheadThe organic market has doubled every ten years and we believe the same will happen in the years to come. More and more consumers want healthier and more sustainable food, whether it’s in response to health and weight issues, concerns about our planet or animal welfare or just and simply in order to improve their well-being and quality of life.
With the definition of our purpose as ‘connect to nature’ we have set out a clear roadmap for the business and agreed clear commitments up to the year 2025. We will for example increase the share that organic products have of our business to at least 90% and will become a business that is carbon neutral and submits zero waste to landfill and incineration. These are just some of the ambitions that come directly from asking ‘how would nature do it’? We will be asking this question many more times in the years to come.
Let’s connect to nature!
Christophe Barnouin CEO
Organic agriculture is inspired by nature
Letter from the CEO 4Wessanen Integrated Annual Report 2017
SustainabilityAbout us Financial Review, Risk &
Governance
Report of the Supervisory Board
Financial statements
Other information
Our marketplaceWelcome
REPORT OF THE EXCECUTIVE BOARD
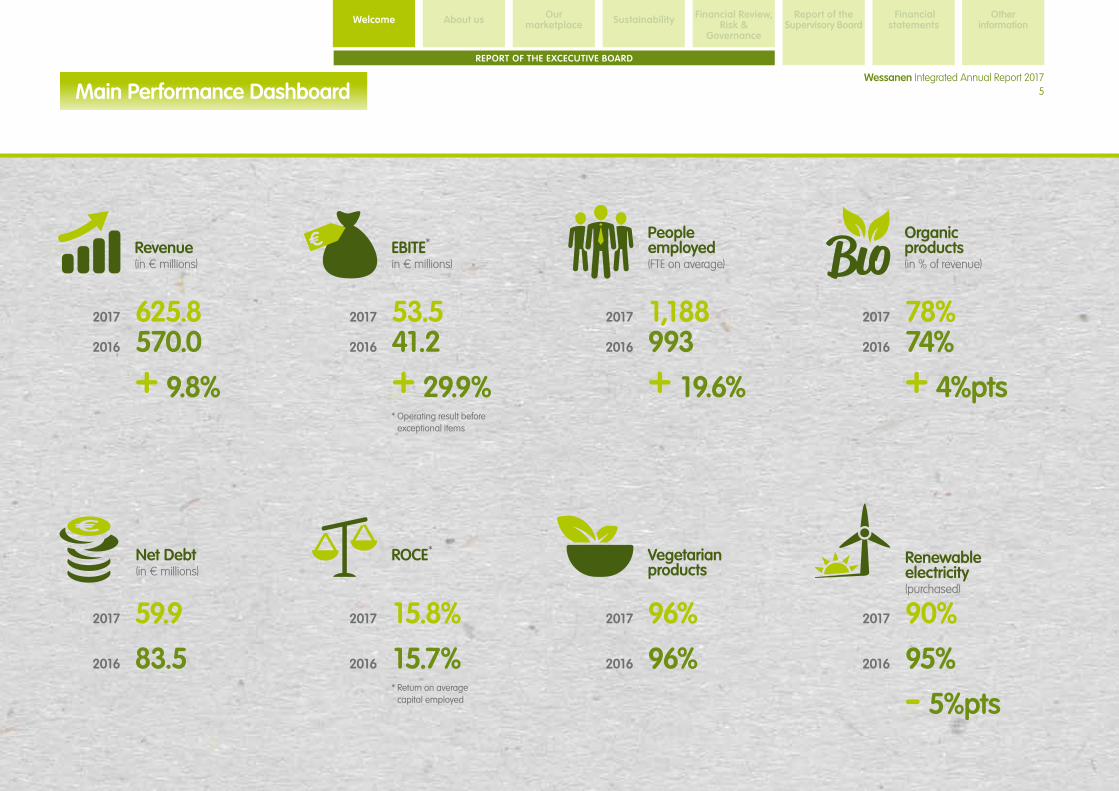
Revenue(in € millions)
2017 625.82016 570.0
* Operating result before exceptional items
2017 53.52016 41.2
+ 29.9%
EBITE*
in € millions)
2017
2016
+ 19.6%
People employed(FTE on average)
2017 15.8%
2016
* Return on average capital employed
15.7%
2017 96%
2016 96%
- 5%pts
2017 90%
2016 95%
2017 59.9
2016 83.5
2017 78%2016 74%
+ 9.8% + 4%pts
Organic products(in % of revenue)
ROCE* Vegetarian products
Renewable electricity(purchased)
Net Debt(in € millions)
1,188993
Main Performance Dashboard 5Wessanen Integrated Annual Report 2017

SustainabilityAbout us Financial Review, Risk &
Governance
Report of the Supervisory Board
Financial statements
Other information
Our marketplaceWelcome
6Wessanen Integrated Annual Report 2017
About us
ABOUT US
Indeed, nature has proven its capacity to survive and thrive while creating conditions conducive to life. So, nature is not only the best supplier but also a great teacher, and we should carefully listen and learn from it.
At Wessanen we have decided to ask nature for everything we do. We will ask nature when we think about the type of agriculture we wish to support, the food we want to make or the brands we wish to acquire.
We will ask nature when we think about the organisation of the company and how it should function, about how companies should cooperate together and when we think about building new factories and offices.
Our purpose is to connect people to nature and by doing so help them make better food choices for the sake of their own health and the health of our planet.
In order to do this we are creating a new kind of food company. A company that is inspired by nature in everything we do.
Today, eating is often synonymous with confusion, anxiety, and complexity. What food should I buy? What is healthy? What is unhealthy? Is sugar evil? At the same time, obesity and food related health issues have become the norm. Our planet is being raided in an unprecedented way while one third of the food that is produced is wasted. So, what went wrong?
The industrialisation of food has fundamentally changed the rules of the game by supplanting reliance on the sun with a food chain that draws much of its energy from fossil fuels. This broken link between food manufacture and the natural world has huge environmental and social consequences.
At Wessanen, we think there is a way for people to regain confidence in the food they eat, and feel good about it again.
To us, the answer lies in the laws of nature.
Read more about our purpose on our interview pages and in the sustainability section.
Our purpose 6Wessanen Integrated Annual Report 2017

Sustainability Financial Review, Risk &
Governance
Report of the Supervisory Board
Financial statements
Other information
Our marketplaceWelcome
7Wessanen Integrated Annual Report 2017
About us
REPORT OF THE EXCECUTIVE BOARD
Making healthier food choices becomes more urgent for people and planet everyday. As part of our mission and vision, Wessanen aims to make a substantial contribution to helping people improve their diet on a daily basis. Beyond driving our own business this also includes improving awareness of the issues among employees, consumers, customers and other stakeholders through talks, presentations and scientific articles in various media. We need a food revolution and we want to play a leading role in driving it.
The sustainability of (human) life on our planet
Rising populationLatest estimates suggest that by 2050 there will be 9.7 billion people on earth. Put differently, every four days there are 800,000 more people to feed. Providing food for them in a way that is sustainable simply won’t be possible unless we fundamentally change the food system.
Biodiversity and soil degradationSoil is the natural resource that ultimately sustains all life on land. Organic farming methods such as crop rotation, intercropping and the use of symbiotic associations are vital to maintaining and improving soil quality.
A third of our land is dedicated to livestock, while the growing demand of foodstuffs such as palm oil, soya and beef has led to the destruction of (tropical) forest, fish stock and biodiversity. About 80% of our calorie intake now comes from 12 plant species; 50% from just three grasses – wheat, maize and rice.
Overweight and diabetesOf the more than one billion people worldwide who are overweight, 600 million are obese and at significant risk of developing diet-related illnesses such as type 2 diabetes and cardiovascular diseases (350 million people worldwide suffer from diabetes). Apart from human suffering, the social cost is also enormous. In Germany, for example, the lifetime cost of overweight and obesity for the current population has been calculated as €145 billion. In the US, households with one obese person face, on average, annual healthcare costs equivalent to 8% of their annual income and in China, people diagnosed with diabetes face an average annual 16.3% loss in income.
Overconsumption of meatOverconsumption of meat is a major contributor to global climate change, can cause cancer in humans (as confirmed by the WHO) and has various side effects, such as increasing resistance to antibiotics in humans. One kilogram of beef will have used 15,000 litres of water during its journey to the table. Animal agriculture is responsible for 18 percent of greenhouse gas emissions, more than the combined exhaust from all transportation. 1-2 acres of rainforest are cleared every second and animal agriculture is responsible for up to 91% of Amazon destruction.
Food wasteAccording to FAO approximately 33% of food produced in the world for human consumption every year is lost or wasted due to inefficiency in food supply chains or households.
Chemicals and food allergiesThe number of people with food allergies and intolerances is growing. While specific reasons for this are not clear, we believe it’s related to processed food full of chemicals that has become far too common.
The rising human and social cost of food
Global food issues

Sustainability Financial Review, Risk &
Governance
Report of the Supervisory Board
Financial statements
Other information
Our marketplaceWelcome
8Wessanen Integrated Annual Report 2017
About us
REPORT OF THE EXCECUTIVE BOARD
Mission and vision
Mission
Healthier FoodWe focus on food that is healthier for people – organic, vegetarian and natural. We work hard to improve the nutritional balance of our products and will not sell products that are not healthy in some respect. By offering people healthy alternatives, we challenge our consumers and processed-food manufacturers alike to choose better.
Healthier PeopleWe want to help our consumers, employees and other stakeholders to live healthier lives by choosing the right food. This includes education and information. Apart from food we also care about the working and living conditions of people in general. That’s one of the reasons we work with labels such as fair trade.
Healthier PlanetWe want to protect our living planet for current and future generations by promoting good food. At the same time we want to conduct our business in a sustainable way.
VisionOur vision is to become a European Champion in healthy and sustainable food. Europe is our home and the European market for healthy and sustainable food is the biggest in the world, along with the United States. We believe we have ample opportunity to grow and add value while staying focused on our geography.
Sustainability Financial Review, Risk &
Governance
Report of the Supervisory Board
Financial statements
Other information
Our marketplaceWelcome
9Wessanen Integrated Annual Report 2017
About us
REPORT OF THE EXCECUTIVE BOARD
Food trends
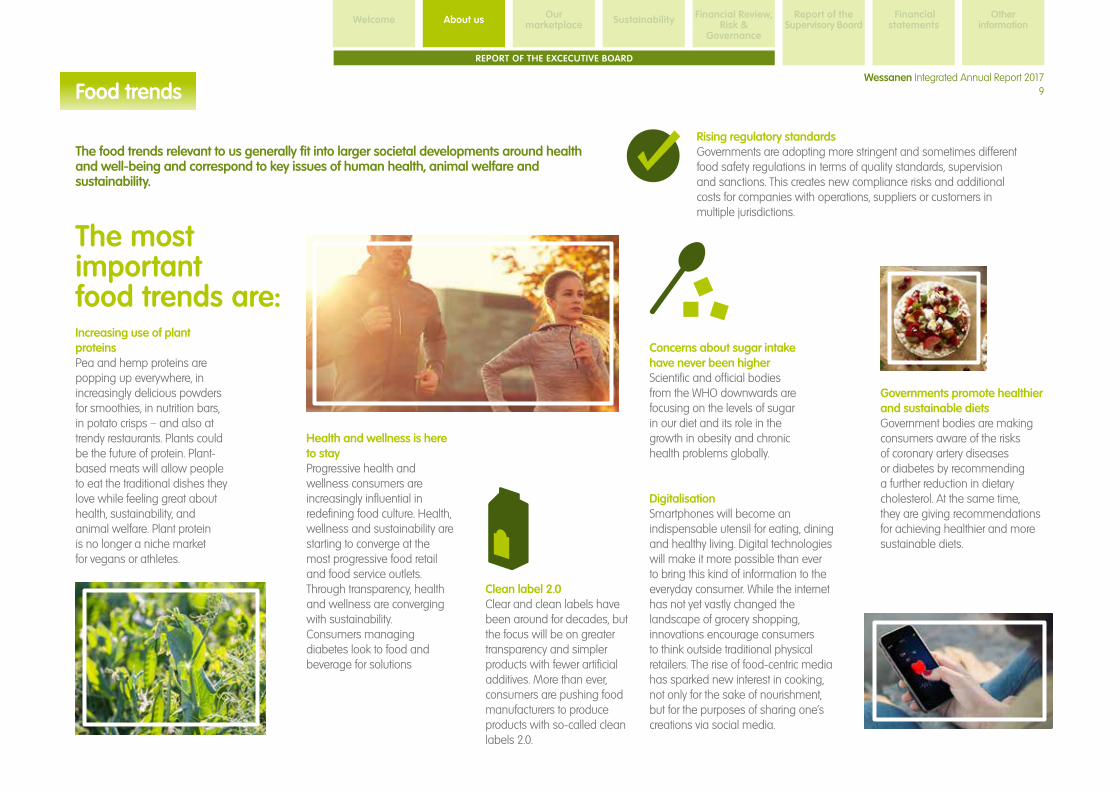
The food trends relevant to us generally fit into larger societal developments around health and well-being and correspond to key issues of human health, animal welfare and sustainability.
Health and wellness is here to stayProgressive health and wellness consumers are increasingly influential in redefining food culture. Health, wellness and sustainability are starting to converge at the most progressive food retail and food service outlets. Through transparency, health and wellness are converging with sustainability. Consumers managing diabetes look to food and beverage for solutions
Clean label 2.0 Clear and clean labels have been around for decades, but the focus will be on greater transparency and simpler products with fewer artificial additives. More than ever, consumers are pushing food manufacturers to produce products with so-called clean labels 2.0.
Rising regulatory standardsGovernments are adopting more stringent and sometimes different food safety regulations in terms of quality standards, supervision and sanctions. This creates new compliance risks and additional costs for companies with operations, suppliers or customers in multiple jurisdictions.
Increasing use of plant proteinsPea and hemp proteins are popping up everywhere, in increasingly delicious powders for smoothies, in nutrition bars, in potato crisps – and also at trendy restaurants. Plants could be the future of protein. Plant-based meats will allow people to eat the traditional dishes they love while feeling great about health, sustainability, and animal welfare. Plant protein is no longer a niche market for vegans or athletes.
DigitalisationSmartphones will become an indispensable utensil for eating, dining and healthy living. Digital technologies will make it more possible than ever to bring this kind of information to the everyday consumer. While the internet has not yet vastly changed the landscape of grocery shopping, innovations encourage consumers to think outside traditional physical retailers. The rise of food-centric media has sparked new interest in cooking, not only for the sake of nourishment, but for the purposes of sharing one’s creations via social media.
Governments promote healthier and sustainable dietsGovernment bodies are making consumers aware of the risks of coronary artery diseases or diabetes by recommending a further reduction in dietary cholesterol. At the same time, they are giving recommendations for achieving healthier and more sustainable diets.
The most important food trends are:
Concerns about sugar intake have never been higherScientific and official bodies from the WHO downwards are focusing on the levels of sugar in our diet and its role in the growth in obesity and chronic health problems globally.

Sustainability Financial Review, Risk &
Governance
Report of the Supervisory Board
Financial statements
Other information
Our marketplaceWelcome
10Wessanen Integrated Annual Report 2017
About us
REPORT OF THE EXCECUTIVE BOARD
Our strategic focus and SWOT analysis
At Wessanen, we focus on food that is good for people and for the planet. For us this means organic, vegetarian and natural food, fair trade and food that is nutritionally beneficial.
There is a consensus that consumption of animal products has a highly negative impact on the environment and that meat-heavy Western diets are a major challenge for food sustainability around the world. There is a growing body
of evidence that vegetarian and vegan diets positively contribute to human health and environmental sustainability.
Vegetarian products tend to be healthier, as shown by many epidemiological studies: vegetarian diets are associated with lower risk of cardiovascular disease, type 2 diabetes and glut disease.
Strengths
Portfolio of leading organic brands holding No. 1 or 2 positions across key
European markets.
Focus on core categories providing leverage in development, manufacturing
and innovation across countries and brands.
Speed to market.
Strong Organic Expertise and fully engaged team caring passionately about
healthy and sustainable food.
Track-record in successfully acquiring and integrating businesses.
High quality of products with certified organic manufacturing production
facilities with IFS and BRC standards.
Weaknesses
Large product portfolio.
Limited position outside Europe.
Opportunities
Continued strong growth of organic, vegetarian and healthier food.
Further leverage of cross brand and country synergies in production, research,
and innovation.
Innovation leading to new products and categories and increasing revenues.
Increased governmental support for organic and healthier food.
Threats
Significant market entrance of big conventional food players.
Short supply of selected organic raw materials.
Fraud, food safety and quality in the supply chain
Wessanen SWOT analysis
Our focus
RECO
MM
ENDE
D CO
NSUM
PTIO
N
ENvI
RONM
ENTa
l IM
PaCT
ENvIRONMENTal PYRaMID
FOOD PYRaMID
SweetsBeef
CheeseEggs
PoultryFish
Cookies
MilkYogurt
Olive Oil Dried Fruit
Bread, Pasta,Potatoes, Rice
Legumes
FruitVegetables
Beef
FishCheese
PorkOlive Oil
Poultry
Dried FruitLegumes
Eggs
SweetsYogurt
PastaCookies
RiceMilk
Bread
PotatoesFruit
Vegetables
HIGH LOW
LOW HIGH
Cheese, Cookies, Eggs, Fish, Poultry
Bread, Legumes, Pasta, Potatoes, Rice
Vegetables, Fruit
Milk, Yogurt
Sweets, Beef
Cheese,Fish
Dried Fruit, Eggs Legumes
Bread, CookiesMilk, Pasta, Rice, Sweets, Yoghurt
Vegetables, Potatoes, Fruit
Olive oil, Pork Poultry
Low
High
High
Low
Reco
mm
ende
d co
nsum
ptio
n
Envir
onm
enta
l im
pact
Food Pyramid
Environmental pyramid
Dried Fruit, Oive oil
© Barilla Center for Food and Nutrition
About us Sustainability Financial Review, Risk &
Governance
Report of the Supervisory Board
Financial statements
Other information
Our marketplaceWelcome
11Wessanen Integrated Annual Report 2017
REPORT OF THE EXCECUTIVE BOARD
Our strategy
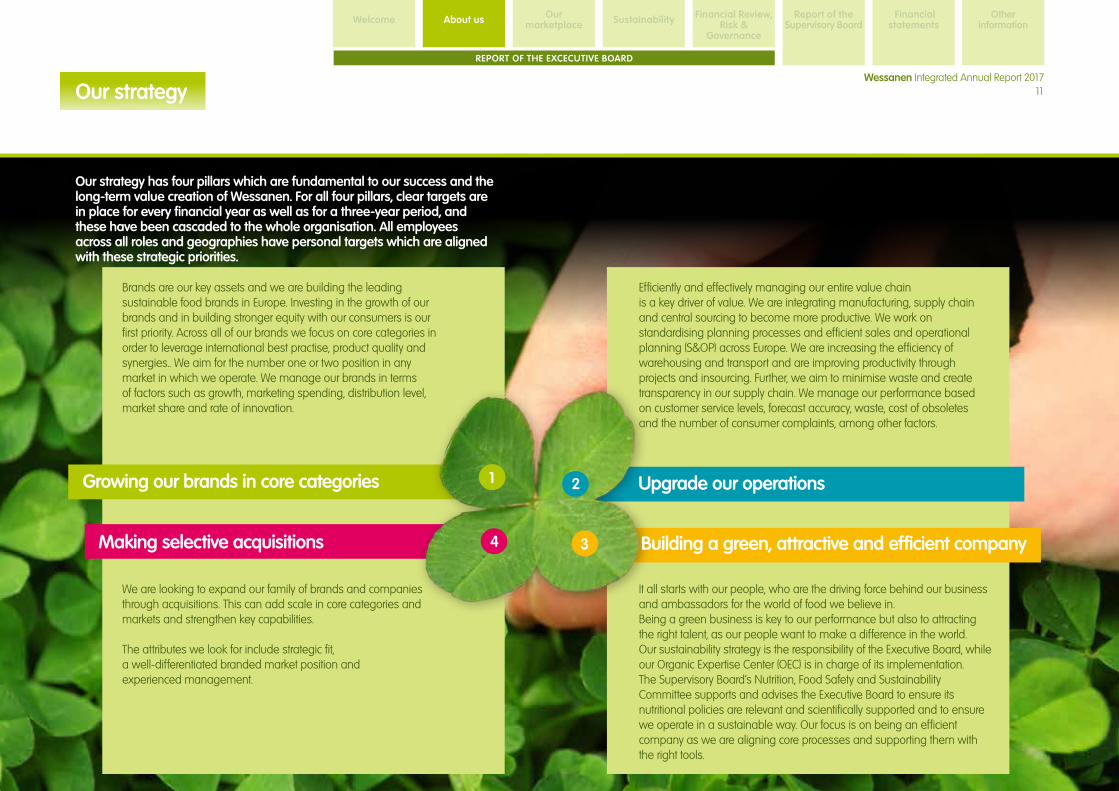
Our strategy has four pillars which are fundamental to our success and the long-term value creation of Wessanen. For all four pillars, clear targets are in place for every financial year as well as for a three-year period, and these have been cascaded to the whole organisation. All employees across all roles and geographies have personal targets which are aligned with these strategic priorities.
Upgrade our operations
Building a green, attractive and efficient company Making selective acquisitions
Growing our brands in core categories
Brands are our key assets and we are building the leading sustainable food brands in Europe. Investing in the growth of our brands and in building stronger equity with our consumers is our first priority. Across all of our brands we focus on core categories in order to leverage international best practise, product quality and synergies.. We aim for the number one or two position in any market in which we operate. We manage our brands in terms of factors such as growth, marketing spending, distribution level, market share and rate of innovation.
Efficiently and effectively managing our entire value chain is a key driver of value. We are integrating manufacturing, supply chain and central sourcing to become more productive. We work on standardising planning processes and efficient sales and operational planning (S&OP) across Europe. We are increasing the efficiency of warehousing and transport and are improving productivity through projects and insourcing. Further, we aim to minimise waste and create transparency in our supply chain. We manage our performance based on customer service levels, forecast accuracy, waste, cost of obsoletes and the number of consumer complaints, among other factors.
It all starts with our people, who are the driving force behind our business and ambassadors for the world of food we believe in. Being a green business is key to our performance but also to attracting the right talent, as our people want to make a difference in the world. Our sustainability strategy is the responsibility of the Executive Board, while our Organic Expertise Center (OEC) is in charge of its implementation. The Supervisory Board’s Nutrition, Food Safety and Sustainability Committee supports and advises the Executive Board to ensure its nutritional policies are relevant and scientifically supported and to ensure we operate in a sustainable way. Our focus is on being an efficient company as we are aligning core processes and supporting them with the right tools.
We are looking to expand our family of brands and companies through acquisitions. This can add scale in core categories and markets and strengthen key capabilities.
The attributes we look for include strategic fit, a well-differentiated branded market position and experienced management.
1
4
2
3

Input
Outcome
How we do things
Mission
Governance
Risks & Opportunities
Vision
Natural
Intellectual
Social
Financial
Manufactured
Human
Business Model & Strategy:
Exclusive focus on healthy &
sustainable food.
Build no. 1 or 2 brands in key markets & categories.
Efficient operations.
Green & lean business.
Acquire selectively.
Revenue: €625.8 million +9.8%
Growth own brands: +7.7%
Improved biodiversity and soil through organic agriculture, sustainable use of farm land and reduction of chemicals used.
EBITE: €53.5 million, Net Cash flow: €4.3 million
Increased knowledge about healthy eating and cooking; brands.
Improved public health through healthier diets.
Employment for 1,188 people; helping consumers live happier lives.
Human
Natural
Intellectual
Social
Financial
Manufactured
Our net debt is €59.9 million. Our exchange listing provides us access to capital markets, especially investors interested in sustainability-focused investments.
Our 1,188 employees are passionate about healthier food for healthier people and a healthier planet.
We maintain a network of production sites, as well as working with external manufacturers that produce our finished products. Their inputs are raw materials and packaging materials.
We draw on the knowledge of nutrition, product and sustainability experts.
We consult regularly with our stakeholders and try to assess key issues in society and how we can contribute to them.
We are using natural resources and agricultural land to grow our products and have built a sustainable supply chain mostly using certified organic farmers.
About us Sustainability Financial Review, Risk &
Governance
Report of the Supervisory Board
Financial statements
Other information
Our marketplaceWelcome
12Wessanen Integrated Annual Report 2017
REPORT OF THE EXCECUTIVE BOARD
How we create value
We are creating long-term value by delivering branded solutions that answer the key Global food issues and trends around health and sustainability. We are leveraging our inputs in order to create positive outcomes for our business and stakeholders, the health of our consumers and the sustainability of our planet.
In 2017 we have contributed to our long-term agenda by further growing our own brands (+7.7%) and strengthening their position in the market place, with focus on our core categories. The share of organic has further increased to 78%.We have invested into our operations to make them more efficient and effective and have created value by in-sourcing key products.
We have strengthened our position as a green business through starting the process of B Corp certification. Our French business is certified since 2017 and others will follow. We have joined the UN Global Compact and defined clear commitments in-line with our purpose of “connecting to nature”.
We have a clear strategy and a transparent governance structure and perform systematic assessments of our risks and opportunities.
External surroundings

About us Sustainability Financial Review, Risk &
Governance
Report of the Supervisory Board
Financial statements
Other information
Our marketplaceWelcome
13Wessanen Integrated Annual Report 2017
REPORT OF THE EXCECUTIVE BOARD
Our core categories
BREAKFAST CEREALS
A healthy start to the day is very important to our conscious consumers and cereals can play a key role. We clearly see this reflected in our numbers as this category has been the fastest growing at about 15% in total.
HOT DRINKS
Tea and coffee continue to be a key category for us and we continue to see double-digit growth overall and for key brands such as Clipper.
VEGGIE MEALS
Overconsumption of meat is one of the biggest sustainability and health issues of our time. We are continuing to respond to this challenge by offering new ranges across key brands such as Bjorg, Zonnatura, Tartex and Allos. Overall we saw low single digit growth.
We focus on six core categories across most of our brands. This gives us focus in product development and allows us to roll out successful mixes across countries and brands. We are leveraging our category expertise through European category teams. As intented, our core categories have grown ahead of our overall autonomous growth.
BREAD AND BISCUITS ALTERNATIVES
Kallø, Bjorg, Zonnatura, El Granero and Ecocesta offer a range of cereal cakes. Category development overall was behind plan especially due to Kallø in the UK.
DAIRY ALTERNATIVES
The market for Dairy Alternatives continues to grow strongly driven by health and sustainability concerns. We have achieved high single digit growth in the category and built new market positions under Zonnatura, Ecocesta and Allos.
SWEET IN BETWEEN
We are responding to the growing concern over high consumption levels of sugar with several product recipe renovations. Still, the category was affected by the trend and was overall flat in 2017.

About us Sustainability Financial Review, Risk &
Governance
Report of the Supervisory Board
Financial statements
Other information
Our marketplaceWelcome
14Wessanen Integrated Annual Report 2017
REPORT OF THE EXCECUTIVE BOARD
Our brands
Allos is exclusively available in the HFS channel in Germany and a number of international markets. Despite a decline of the channel it achieved stable results, a turn-around.
Alter Eco is a commited fair trade pioneer with a focus on coffee and chocolate in the French Grocery channel. Growth was double digit in 2017, a major turnaround from the previous year.
Bjorg is the leader of the organic market in France and also present across French overseas territories and the Middle East. Growth was yet again at double digit rates.
Bonneterre is the number 1 brand in the HFS channel in France. Growth was high single-digit.
Clipper, the No.1 fair trade and organic tea brand in Europe, has grown at double-digit rates overall and in many international markets.
While focused on the UK gluten-free Grocery market, Mrs Crimble’s. Due to distributor issues in the US and Brexit related issues.
Destination is the leader in organic coffee in the HFS channel in France and has a presence in many international markets. It grew at modest rates in 2017.
A pioneer and leader in the Spanish organic market, El Granero has continued to focus on the HFS market and grew modestly last year.
Gayelord Hauser is focused on the Dietetic market in France and has experienced a decline in 2017, partly driven by market slow down. A major relaunch has been introduced in the second half as a result of which we have seen stronger results in Q4.
Isola Bio is a leading organic Dairy Alternative brand. Results across many international markets were very positive while growth in Italy suffered from a weakness of the HFS channel.
Kallø is focused on Bread and Biscuit Alternatives in the UK Grocery channel. In 2017 it declined due to Brexit related issues and lack of trade support. Corrective actions are in place.
Tartex is the brand for the vegetarian. Due to category and channel expansion the brand achieved a turnaround and double-digit growth in 2017 in Germany and other markets.
The leading peanut butter brand in the UK Grocery trade. The brand also holds a presence across many international markets. Growth was yet again at strong double-digit levels.
Zonnatura is the leading organic brand in the Netherlands. Growth was moderate as the brand prepared for a major relaunch and activation early 2018.
Our own brands are our most valuable assets and important to our long-term value creation. In 2017 they have grown 7.7% and further strengthened their position in the respective markets.
Sustainability Financial Review, Risk &
Governance
Report of the Supervisory Board
Financial statements
Other information
Our marketplaceWelcome
15Wessanen Integrated Annual Report 2017
About us
REPORT OF THE EXCECUTIVE BOARD
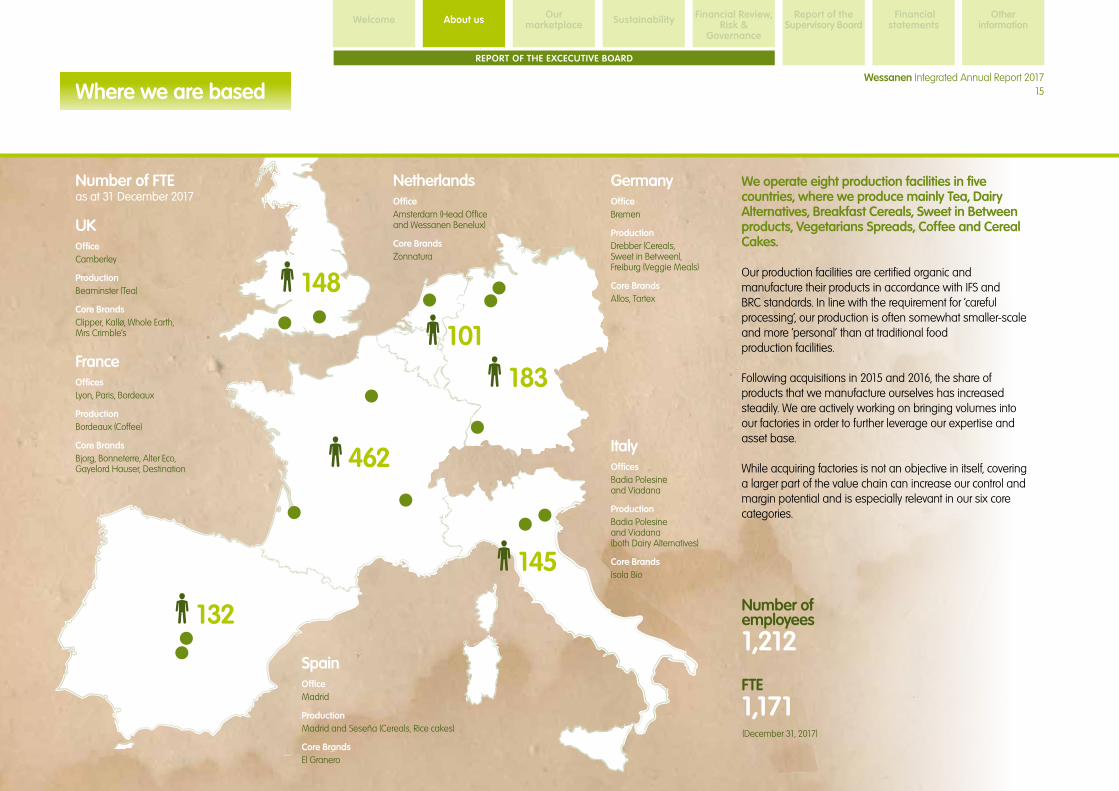
Where we are based
We operate eight production facilities in five countries, where we produce mainly Tea, Dairy Alternatives, Breakfast Cereals, Sweet in Between products, Vegetarians Spreads, Coffee and Cereal Cakes. Our production facilities are certified organic and manufacture their products in accordance with IFS and BRC standards. In line with the requirement for ‘careful processing’, our production is often somewhat smaller-scale and more ‘personal’ than at traditional food production facilities.
Following acquisitions in 2015 and 2016, the share of products that we manufacture ourselves has increased steadily. We are actively working on bringing volumes into our factories in order to further leverage our expertise and asset base.
While acquiring factories is not an objective in itself, covering a larger part of the value chain can increase our control and margin potential and is especially relevant in our six core categories.
148
145
183
462
132
101
SpainOfficeMadrid
ProductionMadrid and Seseña (Cereals, Rice cakes)
Core BrandsEl Granero
FranceOfficesLyon, Paris, Bordeaux
ProductionBordeaux (Coffee)
Core BrandsBjorg, Bonneterre, Alter Eco, Gayelord Hauser, Destination
UKOfficeCamberley
ProductionBeaminster (Tea)
Core BrandsClipper, Kallø, Whole Earth, Mrs Crimble’s
GermanyOfficeBremen
ProductionDrebber (Cereals, Sweet in Between), Freiburg (Veggie Meals)
Core BrandsAllos, Tartex
ItalyOfficesBadia Polesine and Viadana
ProductionBadia Polesine and Viadana (both Dairy Alternatives)
Core BrandsIsola Bio
NetherlandsOfficeAmsterdam (Head Office and Wessanen Benelux)
Core BrandsZonnatura
Number of FTEas at 31 December 2017
Number of employees
1,212
FTE
1,171 (December 31, 2017)

Sustainability Financial Review, Risk &
Governance
Report of the Supervisory Board
Financial statements
Other information
Our marketplaceWelcome
16Wessanen Integrated Annual Report 2017
About us
REPORT OF THE EXCECUTIVE BOARD
People matter
Work with us to change our world
It all starts with our people – they are the ones who make us who we are and help us to change the world around us. While we work across a number of countries and sites, we all share the same belief: to make the world of food a little healthier and more sustainable every day.
Our head office and the Wessanen Benelux team are located in Amsterdam, the Netherlands. Our other country offices are based in Lyon, Bordeaux and Paris in France, Camberley in the UK, Bremen, Germany, Badia Polesine and Viadana, Italy, and Madrid, Spain. We currently also operate eight production facilities in five countries. We consider ourselves a family of companies.
We have a joint strategy and a set of key values and beliefs and we share the same objectives. Having said that, we want to make sure that our local businesses can retain their individual character and that the world of Wessanen is as colourful and diverse as the world around us.
We run our business through a mix of local and central decision-making. We strive to remain close to our local customers and consumers yet drive efficiencies and consistency through centralised, European functions.
The Executive Board, selected country General Managers and Functional Heads (Marketing, Operations and Human Resources) together
form the Executive Leadership Team (ELT). The ELT drives the agenda of the business with a focus on topics of cross-country, shared relevance, providing a platform for information sharing, alignment and decisions on key strategic initiatives and programmes. The ELT meets monthly to discuss and align the strategy for the business, decide on resource allocation, discuss operating activities and financial results and prepare budgets and forecasts.
Responsible employerWe aim to be a good employer to our employees. We invest in their training and education and in making them more engaged in and knowledgeable about healthy and sustainable food.
Our family of companies is connected via a set of shared beliefs and values. Our people care passionately about healthy and sustainable food, and this is also what draws so many prospective employees to our company. We encourage the values of ownership, authenticy and entrepreneurship across all our businesses. We see our people as ambassadors to promote awareness of a healthy and sustainable diet within the organisation and beyond. Our Organic Day and Veggie Thursday are just two of the events we organise in this regard, along with a number of community-related activities we undertake at all our sites on an ongoing basis.

Sustainability Financial Review, Risk &
Governance
Report of the Supervisory Board
Financial statements
Other information
Our marketplaceWelcome
17Wessanen Integrated Annual Report 2017
REPORT OF THE EXCECUTIVE BOARD
Equal opportunitiesIt is a given that we provide equal opportunities for current and future employees, regardless of race, ethnicity, gender, sexual orientation, socioeconomic status, age, physical disabilities and religion. The Executive Board, supported by the Supervisory Board, values the importance of a diversified workforce and has established clear working principles in regards to diversity when it comes to attraction and promotion of current and future employees.
Our remunerationWe maintain a uniform, competitive and performance-based remuneration policy for the management of all operating companies and head offices. Bonus systems for senior executives are set by the head office and are based on financial targets for the operating company, the segment, Wessanen’s overall results and individual performance.
The operating companies have their own compensation and benefit structures, which comply with local requirements and customs. These schemes meet and sometimes exceed the legal requirements and include elements such as pension plans, company cars, parental leave and child care benefits.
Employee developmentWe use a goal- and target-setting model named Employee Performance Commitment (EPC). This model facilitates communication between line managers and employees in order to ensure that focused efforts are in place throughout the year and clear output measures can be tracked.
In order to support our employees in the performance of their job responsibilities, we do not only focus on performance: development is another integral part of our Employee Performance Commitment cycle. At the start of each performance year, every employee will also set one personal development goal which will help them to achieve the short- and mid- to long-term goals. We do have a variety of training initiatives in place to support the development of our staff, including both role-specific and leadership training.
A sustainable business is also one which ensures that the business is ready to take on any future challenges, and this requires appointing the right people to the right jobs. Our Management Development Review provides us with valuable insight into our senior management and talent pool and
helped us once again this year in recruiting sufficient talent to meet our future needs. Through our extensive succession planning efforts, which are all tracked online in a sustainable manner, we’ve also seen a number of moves again at all levels of the organisation ensuring our continued focus on the development and agility of our employees.
Employee engagementWe run regular employee surveys to gauge the level of engagement and commitment of our employees and the underlying factors. This allows us to identify opportunities for improving our organisation, culture and people management. As a responsible employer, we are constantly striving to ensure that all our workplaces are safe, healthy and pleasant environments.
Whistleblower policy and Code of business conductOur policy aims to support compliance with applicable laws, integrity in financial management, a healthier and safer work environment and effective corporate governance. It also provides clarity on our strict rules on anti-bribery and human rights. It ensures that any employee can make a report without the risk of retaliation and that any information they provide is treated confidentially and is promptly investigated.
For further information, please visit our corporate governance section on www.wessanen.com.
Health@work programmeOur mission of Healthier Food, Healthier People and Healthier Planet also serves to promote the health of our employees. We aim to provide them with an environmentally friendly and healthy work environment. We encourage all employees to engage in physical exercise, either on-site, by partially refunding their gym membership, or by organising team activities (such as running events). We also provide organic drinks and/or food at several of our sites; when we organise company breakfasts, lunches or dinners we focus on organic, healthier and typically vegetarian options.
Our people care passionately about healthy and sustainable food
People matter
About us

Our value chain and how we diminish waste in our supply chain
Third party contract manufacturers
Grocery retailersWholesalers
Health food retailersRaw material suppliers
Packaging material suppliers
Brokers
Our factories
SustainabilityAbout us Financial Review, Risk &
Governance
Report of the Supervisory Board
Financial statements
Other information
Our marketplaceWelcome
18Wessanen Integrated Annual Report 2017
REPORT OF THE EXCECUTIVE BOARD
Operations
We are managing operations on the full value chain, i.e. from raw materials to our final customer. This includes managing centrally our suppliers, our eight factories and our warehousing and transportation network.
In order to upgrade our operations our 3 main objectives are:
1. Support to Growth:Our first focus is to continue to improve customer service through the development and professionalisation of our sales and operational planning (S&OP). We have made good progress in 2017 and this remains a key priority for us in 2018.
2. Protect margin:We are managing a rolling productivity agenda based on operational excellence and focusing on a category approach. In 2017, we have implemented productivity improvements in our factories, optimised our in-/outsourcing set up, have reviewed and updated supplier choices and better managed our raw material and commodity suppliers. Overall this allowed us to protect our margins.
3. Develop sustainable operations:We are working on reducing our environmental footprint and waste throughout the chain and further developing the expertise of our people.
Our supply chain is a possible area of vulnerability in terms of sustainability, including soil, air and water emissions, quality standards, safe working conditions, fair wages and possible disruptions.
To deal with these potential risks we have created a framework of standards that brings our supply chain into alignment with our overall business principles. The objective is to ensure that our suppliers comply with these common criteria and with our commitment to transparency and sustainability.
Our sourcingWe operate a practice of sustainable sourcing right through our supply chain. As most of our products are organic, a seamless, well-controlled and fully certified supply chain is needed to safeguard the quality of the ingredients, processes and products. All parts are checked on a regular basis, both planned and unannounced.
We use mostly organic raw materials, whose production maintains and improves the biodiversity of soil and water, reduces the carbon footprint, improves animal welfare and lowers the risk of antibiotic-resistant organisms.
We also choose fair trade materials for most of our tea, coffee and chocolate as this allows farmers who produce these to live decently.
Our central sourcing team concentrates on managing the costs of goods sold and creating strategic partnerships with
numerous suppliers. We have a single, centralised way of working. Reducing complexity within the supply chain is an ongoing priority for us and we are following a category based approach on this.
Our manufacturingWe manage eight factories located in five countries. They report centrally, focus on core categoriies and produce for multiple countries. Our share of own production has increased significantly in 2017.
A sustainable, ethical supply chain is of key importance to us
– Raw material out of date– During production (overweight, low quality, rework, switches)– Finished product (obsoletes)– Packaging (printed)
– Damage during transport
Waste diminishing (for our factories only)
– Damage during transport
About us

19Wessanen Integrated Annual Report 2017
Albert Einstein
Look deep into nature, and then you will understand everything better.
We provide healthy food as intended by natureThere was a time when farmers only used renewable resources to produce food. Through photosynthesis, plants convert the energy from the sun into carbohydrates, and they get essential nutrients from a living soil.
But the industrialisation of food has fundamentally changed the rules of the game by supplanting a complete reliance on the sun for our calories with a food chain that draws much of its energy from fossil fuels. In addition, the use of chemicals has been generalised to agriculture, ensuring the development of monoculture, where soil does no longer play any role.
Organic farmers do not rely on fossil fuels, but use natural elements to grow plants. They observe how nature does and take learnings. They constantly innovate to improve the production or to use less resources. They associate plants, for example in cover crops to improve nitrogen intake, they build hedges to host birds which will eat insects, they select plants which are less water dependent.
Organic agriculture is inspired by nature.

SustainabilityAbout us Financial Review, Risk &
Governance
Report of the Supervisory Board
Financial statements
Other information
Our marketplaceWelcome
20Wessanen Integrated Annual Report 2017
REPORT OF THE EXCECUTIVE BOARD
“All our effort is concentrated on improving the conditions for the growth of organic, both in quantity and in quality.”
“Since 2008 I am also active as board-member of IFOAM EU, the EU organisation for the organic sector. Wessanen as members of BioNederland, is an active member in Bionext; on different levels and in different projects Wessanen is represented in Bionext.”
We want to open people’s eyes“The battle of the day is to open the eyes of politicians, scientists, media and consumers and make them realise which tremendous advantages organic food and farming delivers in the fields of sustainability, nature, biodiversity, clean water, soil fertility, animal welfare and health. All our effort is concentrated on improving the conditions for the growth of organic, both in quantity and in quality.”
Agriculture with respect to nature“Organic agriculture can be defined as agriculture with respect to nature. Improving the soil conditions for micro-organism, worms and insects, taking measures to give space to biodiversity from insect to birdlife, measures that avoid negative outputs in soil and water, those are some important daily organic practices that are essential for a healthy nature. But organic agriculture has to deliver more: expert soil management by organic farmers results in taking up higher levels of carbon in the soil, which really contributes to lower the CO2 pressure in the air. And as we all know,
the climate change that is directed by enlargement of CO2 emissions is one of the major threats for all nature on earth.”
Be ambitious “Main challenge for Wessanen is to enlarge the sales in organic quality products, which would mean expansion of organic agriculture and that is a good message for nature. As organic sector we can’t be ambitious enough in that direction. Let’s go for a 100% organic consumption. Furthermore, a market-leader like Wessanen could really contribute to the further development and innovation of organic agriculture. In the basis organic regulation is high level ecology and animal welfare, but the sector develops faster than the regulation. And it has to act in that direction, but further development of what is good makes it even better.”
Bavo van den Idsert is director of Bionext, the umbrella organisation of the organic sector in the Netherlands, organised from farmer till consumer. For over 30 years he is working in the organic sector, for most part on the level of representative of the common interests of the organic sector.
LAURENCE BECKDirector Organic expertise, Quality and R&D
I joined Wessanen 10 years ago where I have been in charge of Quality, Sustainability and R&D of Wessanen since 2013. I animate a team of engaged quality leaders who make sure that our products are at the highest quality level to fulfil the consumer expectations. I also coordinate CSR and R&D networks across the company.
I am convinced that by changing how we eat, we can change the world. In my opinion, organic food, because it restricts the use of chemicals and takes care of the soil and biodiversity, should be the norm to preserve the planet and future generations.
Organic has been at the heart of Wessanen’s strategy for many years and organic products today represent 78% of Wessanen sales. Because organic agriculture and manufacturing are the most natural ways to produce food, we decided to grow further this ratio and to reach 90% by 2025. We will also continuously support the organic movement in Europe.
SustainabilityAbout us Financial Review, Risk &
Governance
Report of the Supervisory Board
Financial statements
Other informationWelcome Our
marketplace
OUR MARKETPLACEA food revolution is underway
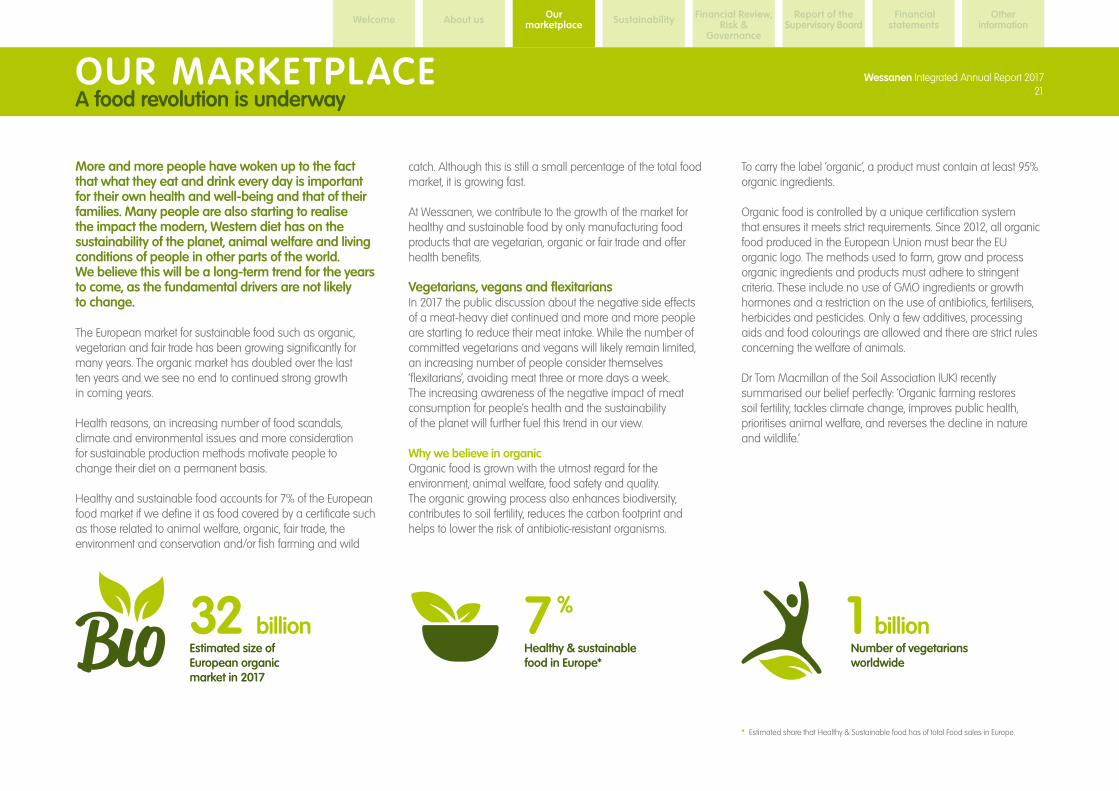
More and more people have woken up to the fact that what they eat and drink every day is important for their own health and well-being and that of their families. Many people are also starting to realise the impact the modern, Western diet has on the sustainability of the planet, animal welfare and living conditions of people in other parts of the world. We believe this will be a long-term trend for the years to come, as the fundamental drivers are not likely to change.
The European market for sustainable food such as organic, vegetarian and fair trade has been growing significantly for many years. The organic market has doubled over the last ten years and we see no end to continued strong growth in coming years.
Health reasons, an increasing number of food scandals, climate and environmental issues and more consideration for sustainable production methods motivate people to change their diet on a permanent basis.
Healthy and sustainable food accounts for 7% of the European food market if we define it as food covered by a certificate such as those related to animal welfare, organic, fair trade, the environment and conservation and/or fish farming and wild
catch. Although this is still a small percentage of the total food market, it is growing fast.
At Wessanen, we contribute to the growth of the market for healthy and sustainable food by only manufacturing food products that are vegetarian, organic or fair trade and offer health benefits.
Vegetarians, vegans and flexitariansIn 2017 the public discussion about the negative side effects of a meat-heavy diet continued and more and more people are starting to reduce their meat intake. While the number of committed vegetarians and vegans will likely remain limited, an increasing number of people consider themselves ‘flexitarians’, avoiding meat three or more days a week. The increasing awareness of the negative impact of meat consumption for people’s health and the sustainability of the planet will further fuel this trend in our view.
Why we believe in organicOrganic food is grown with the utmost regard for the environment, animal welfare, food safety and quality. The organic growing process also enhances biodiversity, contributes to soil fertility, reduces the carbon footprint and helps to lower the risk of antibiotic-resistant organisms.
To carry the label ‘organic’, a product must contain at least 95% organic ingredients.
Organic food is controlled by a unique certification system that ensures it meets strict requirements. Since 2012, all organic food produced in the European Union must bear the EU organic logo. The methods used to farm, grow and process organic ingredients and products must adhere to stringent criteria. These include no use of GMO ingredients or growth hormones and a restriction on the use of antibiotics, fertilisers, herbicides and pesticides. Only a few additives, processing aids and food colourings are allowed and there are strict rules concerning the welfare of animals.
Dr Tom Macmillan of the Soil Association (UK) recently summarised our belief perfectly: ‘Organic farming restores soil fertility, tackles climate change, improves public health, prioritises animal welfare, and reverses the decline in nature and wildlife.’
* Estimated share that Healthy & Sustainable food has of total Food sales in Europe.
Estimated size of European organic market in 2017
32 billionNumber of vegetarians worldwide
1billionHealthy & sustainable food in Europe*
7 %
21Wessanen Integrated Annual Report 2017

SustainabilityAbout us Financial Review, Risk &
Governance
Report of the Supervisory Board
Financial statements
Other information
Our marketplaceWelcome
22Wessanen Integrated Annual Report 2017
Our marketplace
21% 20% 19%
52%
25%16% 18%
41%
Ethics andAnimal Welfare
16% 13% 16%
45%
Tasteand Quality
46%51%
31%35%
Health
IT UK FR GER IT UK FR GER IT UK FR GER IT UK FR GER
Environment
21% 20% 19%
52%
25%16% 18%
41%
Ethics andAnimal Welfare
16% 13% 16%
45%
Tasteand Quality
46%51%
31%35%
Health
IT UK FR GER IT UK FR GER IT UK FR GER IT UK FR GER
Environment
21% 20% 19%
52%
25%16% 18%
41%
Ethics andAnimal Welfare
16% 13% 16%
45%
Tasteand Quality
46%51%
31%35%
Health
IT UK FR GER IT UK FR GER IT UK FR GER IT UK FR GER
Environment
21% 20% 19%
52%
25%16% 18%
41%
Ethics andAnimal Welfare
16% 13% 16%
45%
Tasteand Quality
46%51%
31%35%
Health
IT UK FR GER IT UK FR GER IT UK FR GER IT UK FR GER
Environment
REPORT OF THE EXCECUTIVE BOARD
Reasons for buying organic food
The real price of organicOrganic food is more expensive than conventional food because it requires more man-hours and can lead to lower yields. However, we can consider the price of organic food to be a real price, as organic generates less external costs for society.
For consumers, the higher price is one of the key reasons they might not buy more organic products. Making organic products significantly cheaper will be difficult, but we believe that society and authorities will have to realise over time that conventional food is too cheap, as many of its external costs are not covered by its price, such, as for example: – Water treatment to control contamination by nitrates and
pesticides – Subsidies paid to farmers to maintain their competitiveness
in the market – Healthcare expenses related to farmers’ diseases caused
by the use of pesticides, as recognised by the French Institute of Health and Medical Research (INSERM)
Reasons for buying organic foodAcross all countries, consumer play back four main reasons they choose organic products. They believe these are healthier than conventional products, are better for the environment, provide better welfare for farm animals, and the products are of a higher quality and taste better.
Trust in organic foodIn a recent study by PwC in Germany (January 2017) , 44% of consumers said that they had high trust in certified organic products. Only 14%, however, bought more organic than conventional products. The main barrier was confirmed to be price, especially in categories where the premium exceeds 40-60% in comparison to the conventional alternative.
Organic market developmentThe Organic market has seen steady growth of 5-7% p.a. over the past 20 years and we believe this will continue to be the case in future years. Overall, the share that Organic has of total food is still not higher than 4-5% in Europe, the highest being Denmark and Switzerland with more than 7% and on the low side Spain with only 1% of total food.
European Organic Market 2010-2020Revenues (€ billion)
2010 2011 2012
45
30
15
02013 2014 2015 2016 2017 2018 2019 2020
19.621.4
22.724.3
2628.3
30.432.5
34.536.6
38.7
Top reasons for buying organic food
Source: PwC, Statista.de, Agence Bio, Sana, Shoppers who claim to actively buy organic food.

Our marketplace SustainabilityAbout us Financial Review,
Risk & Governance
Report of the Supervisory Board
Financial statements
Other information
Our marketplaceWelcome
23Wessanen Integrated Annual Report 2017
Our marketplace
REPORT OF THE EXCECUTIVE BOARD
Why fair trade is fair
Size of global Fair trade market
7.3 billionFair trade farmers globally
1.6 million
Why fair trade is fairFair trade aims to help producers in developing countries to improve their living conditions and promote sustainability. It advocates the payment of a higher price to farmers as well as higher social and environmental standards.
There are several recognised fair trade certifiers, including Max Havelaar and Fair Trade International. These are umbrella organisations whose mission is to set the fair trade standards and to support, inspect and certify disadvantaged producers and harmonise the fair trade message.
The real price of fair tradeFair trade corresponds to the real price to producers as it also includes a premium, used by the cooperative for projects to develop the community. Premium allocation, decided by the farmers, goes to community projects.
Fair trade marketsThere are 1,240 fair trade producer organisations in 74 countries providing work to more than 1.6m people. Around 80% of producer organisations worldwide are smallholders.
In 2015, the estimated fair trade premium exceeded €138 million, 26% of which was spent on education. In Europe, the global fair trade market has grown to more than €7.3 billion in retail value. Fair trade is especially relevant in our coffee, tea and chocolate business.
Our competitive landscape overallWe are one of a handful of dedicated players with a strong European presence and we compete with a range of very different companies in our markets.
Most organic producers are small to medium-sized, family-owned, and operate in just one country. Often, they cover several product categories.
Fair trade, in contrast, has been embraced by many producers. This is almost becoming a requirement in several product categories, such as coffee.
The larger European grocery chains, including the hard discounters, offer their own range of private-label organic products, as do larger health food store chains.
Premium brands and private labels have a symbiotic relationship in our view as they jointly help to drive the growth of the organic market versus that of conventional food products.
Fair trade producers globally
1,240

24
Wessanen Integrated Annual Report 2017
Tobias Bandel (Soil & More)
Nature is a fantastic model of balance
We are as resource efficient as nature
Nature is a fantastic model of balance. Natural systems cascade nutrients, matter and energy – waste does not exist. Any by-product is a source for a new product. The tree takes its nutrients from the soil and when tree leaves fall, they form humus which will enrich the soil. Nature can inspire us to recycle our waste and create recyclable packaging.
Nature only uses renewable energy, such as sun, geothermic and wind, to create biomass. The sun energy does not generate neither CO2 emissions like fossil energies, nor radioactive wastes like nuclear. And it is unlimited. Nature must inspire us to think of how to reduce our emissions and to make our waste a resource.
SustainabilityAbout us Financial Review, Risk &
Governance
Report of the Supervisory Board
Financial statements
Other information
Our marketplaceWelcome
25Wessanen Integrated Annual Report 2017
REPORT OF THE EXCECUTIVE BOARD
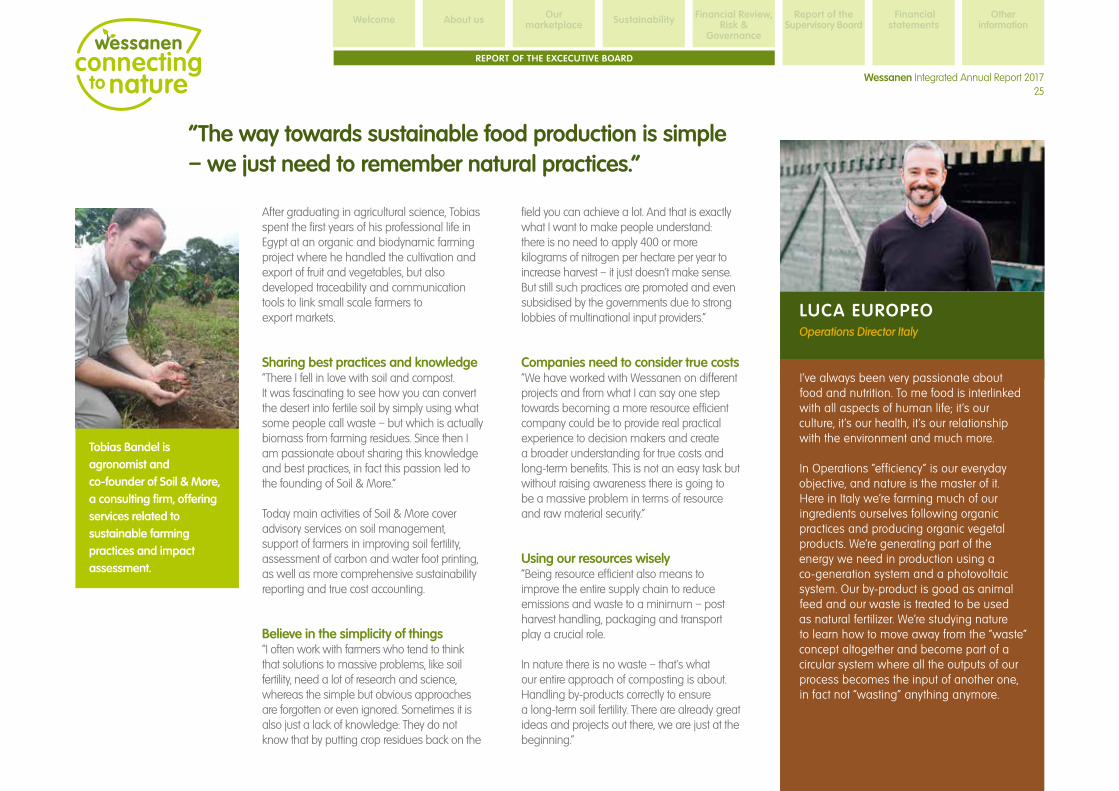
“The way towards sustainable food production is simple – we just need to remember natural practices.”
After graduating in agricultural science, Tobias spent the first years of his professional life in Egypt at an organic and biodynamic farming project where he handled the cultivation and export of fruit and vegetables, but also developed traceability and communication tools to link small scale farmers to export markets.
Sharing best practices and knowledge“There I fell in love with soil and compost. It was fascinating to see how you can convert the desert into fertile soil by simply using what some people call waste – but which is actually biomass from farming residues. Since then I am passionate about sharing this knowledge and best practices, in fact this passion led to the founding of Soil & More.”
Today main activities of Soil & More cover advisory services on soil management, support of farmers in improving soil fertility, assessment of carbon and water foot printing, as well as more comprehensive sustainability reporting and true cost accounting.
Believe in the simplicity of things“I often work with farmers who tend to think that solutions to massive problems, like soil fertility, need a lot of research and science, whereas the simple but obvious approaches are forgotten or even ignored. Sometimes it is also just a lack of knowledge: They do not know that by putting crop residues back on the
field you can achieve a lot. And that is exactly what I want to make people understand: there is no need to apply 400 or more kilograms of nitrogen per hectare per year to increase harvest – it just doesn’t make sense. But still such practices are promoted and even subsidised by the governments due to strong lobbies of multinational input providers.”
Companies need to consider true costs“We have worked with Wessanen on different projects and from what I can say one step towards becoming a more resource efficient company could be to provide real practical experience to decision makers and create a broader understanding for true costs and long-term benefits. This is not an easy task but without raising awareness there is going to be a massive problem in terms of resource and raw material security.”
Using our resources wisely“Being resource efficient also means to improve the entire supply chain to reduce emissions and waste to a minimum – post harvest handling, packaging and transport play a crucial role.
In nature there is no waste – that’s what our entire approach of composting is about. Handling by-products correctly to ensure a long-term soil fertility. There are already great ideas and projects out there, we are just at the beginning.”
Tobias Bandel is agronomist and co-founder of Soil & More, a consulting firm, offering services related to sustainable farming practices and impact assessment.
LUCA EUROPEOOperations Director Italy
I’ve always been very passionate about food and nutrition. To me food is interlinked with all aspects of human life; it’s our culture, it’s our health, it’s our relationship with the environment and much more.
In Operations “efficiency” is our everyday objective, and nature is the master of it. Here in Italy we’re farming much of our ingredients ourselves following organic practices and producing organic vegetal products. We’re generating part of the energy we need in production using a co-generation system and a photovoltaic system. Our by-product is good as animal feed and our waste is treated to be used as natural fertilizer. We’re studying nature to learn how to move away from the “waste” concept altogether and become part of a circular system where all the outputs of our process becomes the input of another one, in fact not “wasting” anything anymore.

About us Financial Review, Risk &
Governance
Report of the Supervisory Board
Financial statements
Other information
Our marketplaceWelcome Sustainability
26Wessanen Integrated Annual Report 2017
In order to further strengthen how we embed sustainability across the entire business, we have run a project to define our reason to be, our so-called purpose. We have run this project with the help of internal and external stakeholders and closely connected it to our material topics as well as the UN Sustainable Development Goals.
The resulting purpose of “connecting to nature” will become a key foundation for our company. It not only defines our approach to sustainability but will increasingly determine how we approach our business and operations overall.
We have translated this purpose into 4 pillars and a total of 8 commitments that define how we will continue to re-shape our business by 2025. This affects the way we report on sustainability compared to the previous years.
Sustainability governanceThe Executive Vice President of Marketing, who is also a member of the Executive Leadership Team, is responsible for sustainability within the company. The Director of Quality, Sustainability and R&D reports to him and centrally coordinates the Corporate Social Responsibility.
While we have limited dedicated sustainability resources in place across the business, roughly 5 FTEs are allocated to this key part of our strategy. The Organic Expertise Centre [email protected] can be contacted for any questions about our approach to sustainability.
SUSTAINABILITYGovernance
#3 We are a diverse and agile community
Wessanen, connecting to nature
#1 We provide healthy food as intended by nature
#2 We are as resource- efficient as nature
#4 We cooperatewith our ecosystem
Our 4 sustainability pillars

SustainabilityAbout us Financial Review, Risk &
Governance
Report of the Supervisory Board
Financial statements
Other information
Our marketplaceWelcome
27Wessanen Integrated Annual Report 2017
Stakeholder dialogue
Sustainability
REPORT OF THE EXCECUTIVE BOARD
How we engage our stakeholders Key topics discussed in 2017 Impact on strategy
Employees – Day-to-day contacts – Annual Great Place To Work survey – Quarterly CEO meeting to share business results – Regular town hall meetings with Executive Leadership Team
– People Development – Employee development plan (page 17) – Commitments on diversity and agility: 50% women in executive position and at least 50% of internal mobility by end 2022
Consumers – Product labelling, Consumer care, social media (Facebook, Twitter, etc.)
– Nutrition – Further improve our nutritional policies
Customers – Day-to-day contacts – Annual reviews – Advertising and promotions – Participation in trade shows (e.g. Biofach, Biobeurs)
– Develop the organic market – Commitment to reach 90% organic in sales by 2025
Organic associations
– Meetings, conferences – Memberships in organisation (ex: IFOAM EU)
– Develop the organic market – Commitment to reach 90% organic in sales by 2025
Suppliers – Day-to-day contacts – Technical visits and meetings – Specifications
– Long term partnership – Commitment to build sustainable supply chains on 4 key raw materials
Shareholders & investors
– Annual shareholder meeting – Integrated annual report, website – Quarterly road shows
– Climate change – Food waste – UN SDG’s
– Commitment to reduce further our emissions and be carbon neutral by 2025 – Commitment to Zero waste to landfill & incineration by 2025
NGOs – Meetings, conferences – Climate change – Food waste – UN SDG’s
– Commitment to reduce further our emissions and be carbon neutral by 2025 – Commitment to Zero waste to landfill & incineration by 2025
Experts – Consultation – Conferences
– Climate change – Food waste
– Commitment to reduce further our emissions and be carbon neutral by 2025 – Commitment to Zero waste to landfill & incineration by 2025
This table presents the stakeholders groups with whom we cooperated in 2017 and the impact this cooperation had on our sustainability strategy. This selection is based on frequency of contact and its relevance.
SustainabilityAbout us Financial Review, Risk &
Governance
Report of the Supervisory Board
Financial statements
Other information
Our marketplaceWelcome
28Wessanen Integrated Annual Report 2017
Sustainability
REPORT OF THE EXCECUTIVE BOARD
Stakeholder interviews
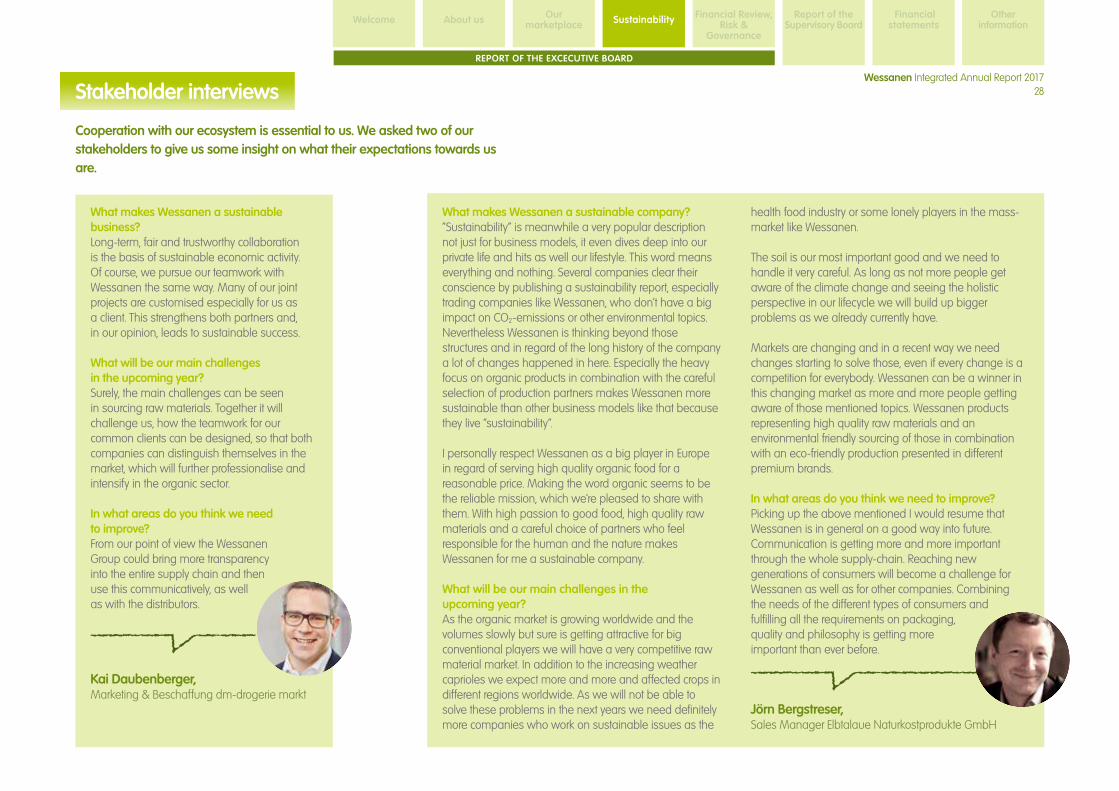
What makes Wessanen a sustainable company?“Sustainability” is meanwhile a very popular description not just for business models, it even dives deep into our private life and hits as well our lifestyle. This word means everything and nothing. Several companies clear their conscience by publishing a sustainability report, especially trading companies like Wessanen, who don’t have a big impact on CO2-emissions or other environmental topics. Nevertheless Wessanen is thinking beyond those structures and in regard of the long history of the company a lot of changes happened in here. Especially the heavy focus on organic products in combination with the careful selection of production partners makes Wessanen more sustainable than other business models like that because they live “sustainability”.
I personally respect Wessanen as a big player in Europe in regard of serving high quality organic food for a reasonable price. Making the word organic seems to be the reliable mission, which we’re pleased to share with them. With high passion to good food, high quality raw materials and a careful choice of partners who feel responsible for the human and the nature makes Wessanen for me a sustainable company.
What will be our main challenges in the upcoming year?As the organic market is growing worldwide and the volumes slowly but sure is getting attractive for big conventional players we will have a very competitive raw material market. In addition to the increasing weather caprioles we expect more and more and affected crops in different regions worldwide. As we will not be able to solve these problems in the next years we need definitely more companies who work on sustainable issues as the
health food industry or some lonely players in the mass-market like Wessanen.
The soil is our most important good and we need to handle it very careful. As long as not more people get aware of the climate change and seeing the holistic perspective in our lifecycle we will build up bigger problems as we already currently have.
Markets are changing and in a recent way we need changes starting to solve those, even if every change is a competition for everybody. Wessanen can be a winner in this changing market as more and more people getting aware of those mentioned topics. Wessanen products representing high quality raw materials and an environmental friendly sourcing of those in combination with an eco-friendly production presented in different premium brands.
In what areas do you think we need to improve?Picking up the above mentioned I would resume that Wessanen is in general on a good way into future. Communication is getting more and more important through the whole supply-chain. Reaching new generations of consumers will become a challenge for Wessanen as well as for other companies. Combining the needs of the different types of consumers and fulfilling all the requirements on packaging, quality and philosophy is getting more important than ever before.
Jörn Bergstreser, Sales Manager Elbtalaue Naturkostprodukte GmbH
What makes Wessanen a sustainable business?Long-term, fair and trustworthy collaboration is the basis of sustainable economic activity. Of course, we pursue our teamwork with Wessanen the same way. Many of our joint projects are customised especially for us as a client. This strengthens both partners and, in our opinion, leads to sustainable success.
What will be our main challenges in the upcoming year? Surely, the main challenges can be seen in sourcing raw materials. Together it will challenge us, how the teamwork for our common clients can be designed, so that both companies can distinguish themselves in the market, which will further professionalise and intensify in the organic sector.
In what areas do you think we need to improve?From our point of view the Wessanen Group could bring more transparency into the entire supply chain and then use this communicatively, as well as with the distributors.
Kai Daubenberger, Marketing & Beschaffung dm-drogerie markt
Cooperation with our ecosystem is essential to us. We asked two of our stakeholders to give us some insight on what their expectations towards us are.
16 Educating consumers about sustainable food
14 Packaging
15 Sustainable employability
7 Origin of raw materials used
8 Food waste management
9 Fair working conditions
10 Healthy lifestyle
11 Fair trade
12 Genetically-Modified Organism (GMO)
13 Green entrepreneurial culture
23 Vegetarian
22 Labour relations andunion practices
21 Water efficiency
20 Use of (sustainable) palm oil
18 Fair and ethical advertising
17 Community involvement
19 Biodiversity
1 Carbon-emissions and climate change
3 Healthy food5 Organic
6 Ethics in the supply chain
2 Regulatory complianceand labelling
4 Consumer health and safety
SustainabilityAbout us Financial Review, Risk &
Governance
Report of the Supervisory Board
Financial statements
Other information
Our marketplaceWelcome
29Wessanen Integrated Annual Report 2017
Sustainability
REPORT OF THE EXCECUTIVE BOARD
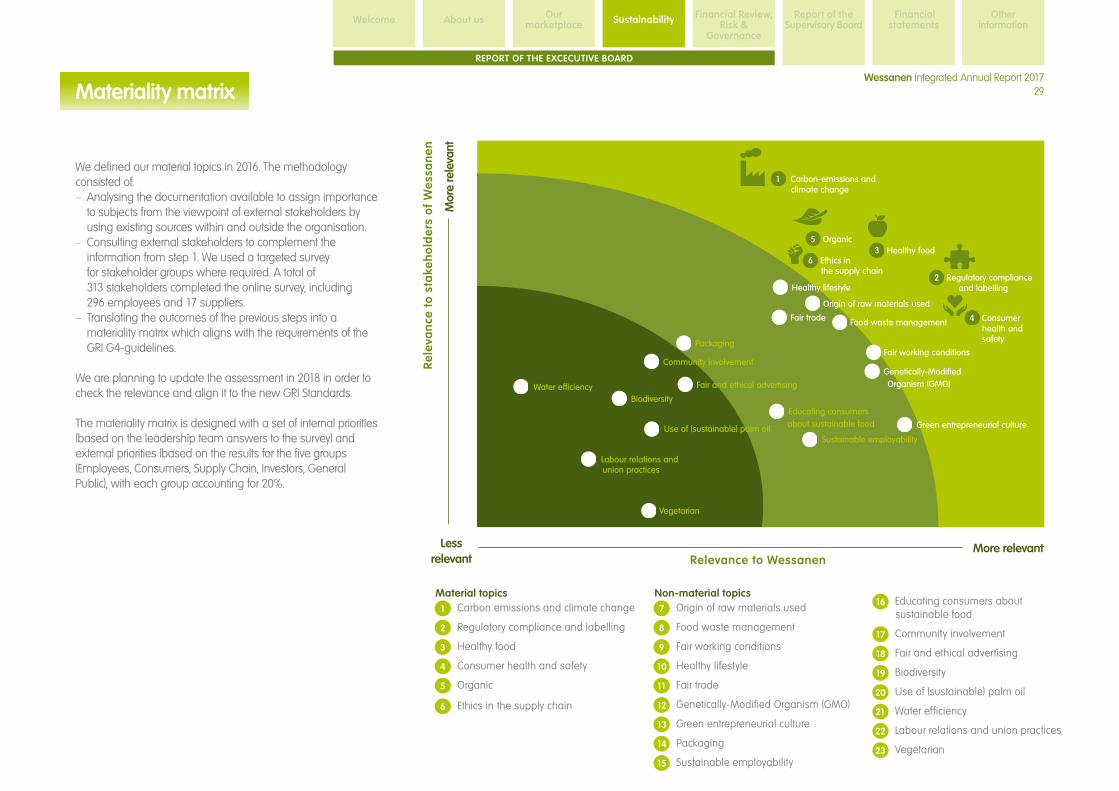
Materiality matrix
We defined our material topics in 2016. The methodology consisted of: – Analysing the documentation available to assign importance to subjects from the viewpoint of external stakeholders by using existing sources within and outside the organisation.
– Consulting external stakeholders to complement the information from step 1. We used a targeted survey for stakeholder groups where required. A total of 313 stakeholders completed the online survey, including 296 employees and 17 suppliers.
– Translating the outcomes of the previous steps into a materiality matrix which aligns with the requirements of the GRI G4-guidelines.
We are planning to update the assessment in 2018 in order to check the relevance and align it to the new GRI Standards.
The materiality matrix is designed with a set of internal priorities (based on the leadership team answers to the survey) and external priorities (based on the results for the five groups (Employees, Consumers, Supply Chain, Investors, General Public), with each group accounting for 20%.
Material topics1 Carbon emissions and climate change
2 Regulatory compliance and labelling
3 Healthy food
4 Consumer health and safety
5 Organic
6 Ethics in the supply chain
Non-material topics7 Origin of raw materials used
8 Food waste management
9 Fair working conditions
10 Healthy lifestyle
11 Fair trade
12 Genetically-Modified Organism (GMO)
13 Green entrepreneurial culture
14 Packaging
15 Sustainable employability
16 Educating consumers about sustainable food
17 Community involvement
18 Fair and ethical advertising
19 Biodiversity
20 Use of (sustainable) palm oil
21 Water efficiency
22 Labour relations and union practices
23 Vegetarian
Relevance to Wessanen
Rele
van
ce t
o st
ake
ho
lde
rs o
f W
ess
an
en
More relevantLessrelevant
Mor
e re
leva
nt

SustainabilityAbout us Financial Review, Risk &
Governance
Report of the Supervisory Board
Financial statements
Other information
Our marketplaceWelcome
30Wessanen Integrated Annual Report 2017
Sustainability
Topicswe
address
Organic
Consumer health& safety
– Organic products– % of products compliant with
nutritional policies– Suppliers certified GFSI– Number of fines for regulatory
non-compliance– % vegetarian
– Number of training hours– % women/in executive positions – % women– Lost Time Injury
– % renewable electricity– Scope 1 emisions– Scope 2 emisions– Emissions from transport
(part scope 3)– Total emissions– Total emissions ratio– % physical waste– Packaging ratio
– Volume fair trade products as a means of contributing to a fair living wage for farmers in the developing world
– Suppliers having signed Code of conduct
Fair working conditions Ethics in the supply chain
Sustainable employabilityFood waste management Fair tradeRegulatory
compliance &labelling
Carbonemissions andclimate change
Healthy food Packaging
Vegetarian
We provide healthy food asintended by nature
We are a diverse and agilecommunity
We are as resource-efficientas nature
We cooperate withour ecosystem
KPIs
– By 2025, 90% of our sales will be organic products. – At least 95% of our products will be vegetarian products.
Our commitments
SDGs
– By 2025 we will be carbon–neutral and have reduced significantly our carbon emissions.
– By 2025 we will submit zero waste to landfill and incineration and will have reduced our physical waste.
– By end 2022 we will have gender balance across our executive management.
– By end 2022 we will have increased our internal mobility, meaning that at least 50% of jobs will be fulfilled by internal recruits.
– By 2025 we will have built sustainable supply chains from farm to customers for 4 key organic raw materials (Tea, Oat, Almond, Cocoa)
– We will have increased the sales of fair trade certified products for southern countries raw materials
#2 #3 #4
REPORT OF THE EXCECUTIVE BOARD
Governments, businesses and civil society together with the United Nations have started to mobilise efforts to achieve the Sustainable Development Agenda by 2030. Together they defined 17 goals essential to transforming our world.
As a responsible company, we have a role to play in society and we analysed how we are contributing to these goals. The link is described in this table.
#1
UN Sustainable Development Goals

SustainabilityAbout us Financial Review, Risk &
Governance
Report of the Supervisory Board
Financial statements
Other information
Our marketplaceWelcome
31Wessanen Integrated Annual Report 2017
Sustainability
REPORT OF THE EXCECUTIVE BOARD
1. No Poverty1.1. ‘By 2030, eradicate extreme poverty for all people everywhere,
currently measured as people living on less than $ 1.25 a day’ Fair trade products
2. Zero Hunger: achieve food security and improved nutrition, and promote sustainable agriculture
2.4. ‘By 2030 ensure sustainable food production systems and implement resilient agricultural practices that increase productivity and production, that help maintain ecosystems, that strengthen capacity for adaptation to climate change, extreme weather, drought, flooding and other disasters, and that progressively improve land and soil quality’
Organic products Physical waste
Nutrition Suppliers certified GFSI
Vegetarian
8. Decent work and economic growth8.3. ‘Promote development-oriented policies that support productive
activities, decent job creation, entrepreneurship, creativity and innovation, and encourage the formalisation and growth of micro-, small- and medium-sized enterprises, including through access to financial services’
Employee training hours
8.5. ‘By 2030, achieve full and productive employment and decent work for all women and men, including for young people and persons with disabilities, and equal pay for work of equal value’
% women in executive positions
8.8. ‘Protect labour rights and promote safe and secure working environments for all workers, including migrant workers, in particular women migrants, and those in precarious employment’
Lost time injury
12. Responsible consumption and production12.3. ‘By 2030, halve per capita global food waste at the retail and
consumer levels and reduce food losses along production and supply chains, including post-harvest losses’
12.4. ‘By 2020, achieve the environmentally sound management of chemicals and all wastes throughout their life cycle, in accordance with agreed international frameworks, and significantly reduce their release to air, water and soil in order to minimise their adverse impacts on human health and the environment’
12.5. ‘By 2030, substantially reduce waste generation through prevention, reduction, recycling and reuse’
Organic products Physical waste
12.6 ‘Encourage companies, especially large and transnational companies, to adopt sustainable practices and to integrate sustainability information into their reporting cycle’. Suppliers having signed Code of Conduct
13. Climate change13.2. ‘Integrate climate change measures into national policies,
strategies and planning’ % renewable electricity Carbon equivalent emissions
Below are the details of the Sustainable Development Goals addressed by our strategy.
UN Sustainable Development Goals

SustainabilityAbout us Financial Review, Risk &
Governance
Report of the Supervisory Board
Financial statements
Other information
Our marketplaceWelcome
32Wessanen Integrated Annual Report 2017
Sustainability
REPORT OF THE EXCECUTIVE BOARD
OrganicOrganic food is at the heart of our strategy, representing 78% of our sales. We aim at reaching 90% of organic sales by 2025.
We believe that organic food is the ultimate form of natural food, as it does not involve the use of synthetic pesticides and fertilisers during agricultural production and only a few additives of natural origin during transformation.
Organic agriculture promotes crop rotations and focuses on soil fertility and closed nutrient cycles. The positive performance of organic agriculture when measured against a range of environmental indicators has been widely reported.
Find more information on carbon sequestration in the report “Organic farming, climate change mitigation and beyond” published by IFOAM EU and Fibl.
We support the organic community through the following memberships: – Wessanen is a member of IFOAM and IFOAM EU; – Our operating companies are members of the following organic trade associations: Bionext, Synabio, AOL, Soil Association;
– Wessanen supports the FQH (Food Quality and Health) group, an international research network for Food Quality and Health.
Healthy foodFood connected to nature is less refined to keep the intrinsic goodness of the plant.We have adopted for many years nutritional policies for our own nutritional brands (Bjorg, Zonnatura, Kallø, Allos, Tartex, Evernat, Isola Bio). The policies and guidelines for salt, sugar and whole cereals are applied primarily to innovations. Progress is monitored annually.Our sugar policy aims to increase nutritional density by limiting ‘empty calories’ in our products. We prefer natural sugar, low refined and raw sugar (honey, agave syrup and concentrated fruit juices), and we tolerate organic sugar not fully refined. Our policy forbids fully refined sugars.
Our whole cereals policy defines a minimum ratio for unrefined cereals in cereal-based products. This makes it possible to keep the intrinsic goodness from the cereal, especially fibres and minerals.
Our salt policy defines maximum thresholds on salt for product categories which are contributors to salt intake.
In 2017, 85% of net sales from nutritional brands comply with our nutritional policies. Despite we think that less refined ingredients is preferable, we want to focus more on the quantities of sugar and salt.
In 2016, we benchmarked our products of nutritional brands with the market average and identified some issues (products sweeter or saltier than the market average). This led to a renovation plan of 88 recipes that we agreed to renovate by 2020 to bring them below the market average on sugar and salt. So far we are on track as we have already renovated 32 recipes and delisted 5, so we have achieved 42% of therenovation plan.
How we manage (material) topics
#1 We provide healthy food as intended by nature Food is the first connection that we, consumers, have with nature. It comes originally from the earth, through more or less complex chains before reaching the consumer.Our priority is to deliver safe and healthy food as intended by nature, meaning freefrom any contaminants and processed with care.

SustainabilityAbout us Financial Review, Risk &
Governance
Report of the Supervisory Board
Financial statements
Other information
Our marketplaceWelcome
33Wessanen Integrated Annual Report 2017
Sustainability
REPORT OF THE EXCECUTIVE BOARD
Product Quality ManagementWe rigorously monitor the quality of our products in the marketplace through ongoing contacts with our consumers and customers and regular product testing. Overall, we have had 29,998 consumers contacting our consumer care centres, which represent an increase of 30% versus 2016. A total of 10,745 of these contacts were classified as consumer complaints. Absolute number of complaints increased by 22% versus 2016, but the complaints per million units sold was slightly reduced for our own brands and core categories. Our quality teams are working closely with factories and suppliers to improve the level of satisfaction of our consumers. For example, some actions have been taken to mitigate the impact of heat waves on the blooming of chocolate. This has resulted in a reduction of consumer complaints for this default.
How we manage (material) topics
VegetarianVegetarian diets are known to be healthier and resource efficient. So it is important for us to ensure our portfolio is predominantly composed of products suitable for vegetarians, this KPI is stable at 96%. We aim at keeping it above 95%.
Consumer health and safetyFood safety is a priority for Wessanen. We produce an increasing number of our products in our own production facilities. Some of our products are manufactured for us by selected third parties, and we always make sure potential suppliers are subjected to a careful auditing process.
Vegan & Warm range launch in Germany
With our vegetarian snacks such as Vegan & Warm we offer healthy alternatives for our consumers.
#1 We provide healthy food as intended by nature
Our Croustillants chocolat Bjorg now reduced in sugarA successful example of our nutritional renovation plan is the reformulation of Croustillants chocolat Bjorg. This was a challenging project, as this product is a bestseller in France.
Nevertheless, the content in sugar has been reduced from 21g/100 g to 15g/100g without compromising on taste. The recipe was at parity on the global appreciation, but performed better than the current one for texture and aspect, by a consumer panel.The new recipe was launched with the claim “reduced in sugar”.

SustainabilityAbout us Financial Review, Risk &
Governance
Report of the Supervisory Board
Financial statements
Other information
Our marketplaceWelcome
34Wessanen Integrated Annual Report 2017
Sustainability
REPORT OF THE EXCECUTIVE BOARD
Consumer health and safetyWe aim at having all our products manufactured in GFSI-certified factories. – All our factories are GFSI-certified, except Destination, for which this certification is in preparation;
– To date 93% of our PTO (Purchase Turnover) is manufactured in GFSI-certified plants. Suppliers which are not certified according to GFSI are subjected to an on-site evaluation by the Quality Assurance department before being selected.
In parallel, we continually and rigorously manage the quality of our products via a risk-based monitoring system. Legal and regulatory compliance, food safety and our own quality policies are key aspects we check and manage. We are in touch with consumers via our consumer care centres and investigate any issues that are brought to our attention. Extra attention is given to
fraud prevention, again based on screening the risk associated with certain sourcing countries, types of commodities or supplier track record.
Our Product Quality Booklet (ex-Supplier Quality Booklet) details our expectations for products, such as ensuring that each supplier who produces food for us has a Quality Management System in place and requires proof of compliance with the agreed specifications. This Booklet is available on our website. We progressively and formally assess each supplier, via a Supplier Quality Declaration (SQD), to understand their capability to meet our requirements and we evaluate these proportionally, based on the level of business and food safety risks. By the end of 2020, we will have assessed 100% of suppliers versus this standard.
In case of minor or major shortcomings, we discuss improvement plans with suppliers, while those not able or willing to meet our expectations will be delisted. We expect our suppliers to work in a transparent manner, thereby refraining from fraud, corruption and bribery. We also expect our suppliers to maintain the same standards for their suppliers.
We are conscious that this topic needs further verification and are working on how to progressively verify compliance at our suppliers.
Regulatory complianceWe pay much attention to guarantee the regulatory compliance of our products. This is a key requirement for our suppliers and our factories, specified in our Product (ex-Supplier) Quality Booklet and in specifications. Our pesticides and GMO policies go beyond organic regulation requirements. For example, we have a non-
GMO packaging policy in place. We monitor closely the change of regulation, conduct risk assessment on products and carry out monitoring plans to manage risks.
We did not have any incidents of non-compliance (product, environment or social) with a fine in 2017.
In 2017, we have worked closely with the organic associations on the organic regulation in preparation. This text should be approved in 2018 and aims at improving the rules on organic production across Europe.
How we manage (material) topics
#1 We provide healthy food as intended by nature

SustainabilityAbout us Financial Review, Risk &
Governance
Report of the Supervisory Board
Financial statements
Other information
Our marketplaceWelcome
35Wessanen Integrated Annual Report 2017
Sustainability
REPORT OF THE EXCECUTIVE BOARD
Carbon emissions and climate changeCarbon emissions and climate change have been highlighted as the most material topics, especially for our stakeholders.
We have undertaken the commitment to reduce our emissions in line with science-based targets and to neutralise them by 2025.
We have improved the robustness of scope 1 and 2 emissions and have them externally verified for the second year.
Our scope 2 emissions have been reduced consistently in the last years by converting progressively our electricity consumption to renewable sources. In 2017, 90% of our electricity consumption was from renewable sources. The newly acquired businesses, Destination and Biogran, reduced this ratio in 2017, but we aim at reaching 100% again by 2019.This leads us to net scope 2 emissions of 232 tonnes, but they would represent 4,044 tonnes (gross scope 2) if we were using non renewable electricity.As for any consumer goods company, scope 3 is the most important source of emissions but also the most complex one to measure. The main contributors are raw materials, transportation and packaging.
– Raw materials: we do not measure emissions generated by raw materials, which would be extremely complex. However we believe that organic is the most sustainable form of agriculture and we will work on building sustainable supply chains for our top 4 organic raw materials.
– Transportation: we measure and report our emissions from transportation inbound, outbound and business travels, but we need to improve robustness.
– Packaging: we do not measure yet the carbon emissions related to packaging. We follow the ratio of packaging weight over product net weight. This ratio has increased from 0.12 to 0.14. This can be explained by an increase of our tea category which has a high ratio packaging/product. We will look at the carbon emissions of our packaging in 2018 in order to reduce it.
In 2017, we emitted 37,400 tonnes of CO2, so 19% more versus 2016. This is due to increasing activities and an improvement of our measurement method. 2.5% of reported scope 3 correspond to our business travels, the rest corresponds to goods transportation.Our carbon intensity (versus €) evolved from 57 to 60.Across our business, we compensated 12,211 tonnes, which represent 33% of our measured emissions. Wessanen UK and Alter Eco products are carbon neutral. We will continuously improve the robustness and the scope of measure, and will be carbon neutral on scope 1, 2 and part of 3 (transportation and packaging) in 2025.
#2 We are as resource efficient as nature Nature is the perfect model of recycling and resource-efficiency. We consider it the best model to inspire us to be as efficient as possible.
How we manage (material) topics
Raising awareness on climate change
For our 6th edition of the Organic Day event, we chose to investigate how organic agriculture can contribute to climate change reduction. We invited some agriculture experts who shared knowledge on organic agriculture practices and how they can play a role in climate change, but most of all on
crop resilience. We also carried out some activities like ranking products based on their emissions or calculating the carbon footprint of Wessanen products. 96% of people answering the event survey stated they improved their knowledge of climate change thanks to the event.

SustainabilityAbout us Financial Review, Risk &
Governance
Report of the Supervisory Board
Financial statements
Other information
Our marketplaceWelcome
36Wessanen Integrated Annual Report 2017
Sustainability
REPORT OF THE EXCECUTIVE BOARD
Water efficiencyWater was not highlighted as material; however, water is essential in the food chain. Farming accounts for 70% of water used in the world (source OECD: http://www.oecd.org/agriculture/water-use-in-agriculture.htm)
Our direct impact on water usage is limited. Out of our eight factories, only three have humid processes requiring a significant amount of water for cleaning. Water consumption is set out in our KPIs.Our indirect impact is much bigger. It is predominant at agricultural stage, but also first and second transformation.
At the agriculture level, we should not only consider water consumption (irrigation), but also water pollution, which is a key societal issue. The cost of water de-pollution in France has been estimated at 1.3 billions (CGDD, Conseil Général au Développement durable).With 78% of organic products, we limit the pollution of ground water.
The water footprint of vegetarian products is much lower
than the one of animal products. Further information on www.waterfootprint.org.
The average water footprint per calorie for beef is twenty times larger than for cereals and starchy roots. When we look at the water requirements for protein, it has been found that the water footprint per gram of protein for milk, eggs and chicken meat is about 1.5 times larger than for pulses. For beef, the water footprint per gram of protein is 6 times larger than for pulses.Focusing on organic and vegetarian products helps to limit our water footprint.
Our factories of Dairy Alternatives have implemented systems of water stewardship through water cleaning installations. At Abafoods, the water is taken from wells and analysis demonstrated that rejected water is cleaner than accepted water. The factory has a positive impact on the water quality in the community.
We do not control the use of water at our supplier level. We require our third-party suppliers to have a management system in place (Product (ex-Supplier) Quality Booklet), but this is not currently part of our supplier selection criteria. However, this is an improvement area we will address. We started to measure the consumption of water in order to monitor the trend. In 2017 our factories used 33,060 m3 of water for their operation.
How we manage (material) topics
#2 We are as resource efficient as nature
Isola Bio Italian HazlenutWe select the best hazelnuts from Sicilyand Lazio regions in Italy. We roast themfor an enhanced and naturally strong taste. Our Dairy Alternatives from Isola Bio are produced in Abafoods, one of our Italian factories.
Waste managementReducing waste is one of our society’s main challenges. A recent article published in Nature Communications highlights that it is possible to feed the world more sustainably with organic agriculture if we reduce in parallel waste and animal product consumption.
(https://www.nature.com/articles/s41467-017-01410-w)
By 2025 we will be Zero waste to landfill and incineration, meaning all our waste will be either recycled in material, agriculture or biogas. Some of our sites already have less than 3% of their waste going to landfill or incineration.
We will develop the measure across the business in 2018. We are also monitoring our physical waste to progressively reduce it. The ratio physical waste over sold volumes was 0.48% in 2016. Applying same scope for 2017 it was reduced to 0.38%. Including Abafoods it moves to 0.65%. This is a focus in our strategy.
SustainabilityAbout us Financial Review, Risk &
Governance
Report of the Supervisory Board
Financial statements
Other information
Our marketplaceWelcome
37Wessanen Integrated Annual Report 2017
Sustainability
REPORT OF THE EXCECUTIVE BOARD
Fair working conditions
DiversityNature is a model of diversity and inspiring to us. We measure diversity through gender balance. We have noticed that although our gender balance is very good, it is lower at senior management level (30%). We aim to reach a gender balance (50%) at the senior management level (executive board, corporate and staff directors, management teams).
AgilityAgility is also a key characteristic of nature. We want to develop our people and encourage mobility. We provided 21.3 hours of training per FTE in 2017 versus 19.9 in 2016. Mobility will be measured as the number
of jobs fulfilled internally. It will be a clear focus in the next years.
Community engagementWe also encourage and support our employees to get involved in community actions. Some organisations have implemented the voluntary days, which offers to employees one day to spend for a cause. In 2017, 69 of our employees have spent 1 day in a community project. We aim at growing this number.
Employee satisfactionFair working conditions and green entrepreneurial culture are moderately material for our stakeholders but are key for us as a company. We are deploying the survey engagement tool Great Place to Work across the organisation and will disclose and monitor the KPI as of 2018.
Bjorg Bonneterre and Compagnie and Destination certified B Corp.
B Corp is a high standard for companies which want to make a positive contribution to society. We were very proud when Bjorg Bonneterre & Compagnie and Destination both received B Corp certification in 2017. This is the recognition of all the positive actions that these companies have on workers, the environment and the community. B Corp certification also recognises the quality of governance and transparency.
The certification tool, called the BIA (Business Impact Assessment), is an excellent KPI to monitor progresses on CSR.
We aim at having all businesses certified B Corp before 2025.
How we manage (material) topics
#3 We are a diverse and agile community
SustainabilityAbout us Financial Review, Risk &
Governance
Report of the Supervisory Board
Financial statements
Other information
Our marketplaceWelcome
38Wessanen Integrated Annual Report 2017
Sustainability
REPORT OF THE EXCECUTIVE BOARD
Sustainable supply chainAlthough we are a food company, we are far from the agricultural part of food production and we identified this as a threat in a world where raw material production can become scarce.
We are committed to building sustainable chains for our four key raw materials in the next seven years.
Our brand Alter Eco has already implemented strong partnerships with producers.
In 2017, we started a partnership with a farmer producing soy with excellent practices in terms of crop rotation and biodiversity preservation. These volumes will be used in our Bonneterre soy drink.
Fair tradePurchasing fair trade-certified products ensures that producers receive appropriate pay and work in decent conditions.
Our brands Alter Eco and Clipper currently purchase through fair trade-certified schemes. In addition, Alter
Eco has a clear preference for smallholders and cooperatives.
We follow two standards: FL and ESR/FFL (Fair For Life).We used to report our fair trade sales as a % of product categories Hot Drinks and Chocolate. As of this year we will report volumes of fair trade products, as we believe
this indicator is a better representative of our fair trade engagement.
In 2017 we sold 7,748 tonnes of fair trade-certified products, which represented 8% of our total net sales.
Ethics in the supply chainIt is important to ensure that we have a responsible supply chain management in place. The highest risks are for raw materials sourced from southern countries, such as tea, coffee and cocoa. This is why we are striving for growing the fair trade part of these products. In addition to fair trade certifications, Alter Eco and Clipper both regularly visit producers of our raw materials. For the rest of the portfolio, we ask our suppliers to commit to our Suppliers Code which follows ILO-based
principles. For our Suppliers Code of Conduct, please see www.wessanen.com.
To date, suppliers representing 92% of our PTO have accepted our code. We are still in the process of consulting suppliers.
In addition to this indicator, we have also assessed the social risks (including social impacts) for our finished product suppliers based on locations.
We have compared the countries where our finished
products suppliers are based with the BSCI countries risk classification, also called WGI (Worldwide Governance Indicators):http://www.amfori.org/news/bsci-supports-improved-working-conditions-risk-classification-list
Over 260 suppliers of finished product (FR, Benelux, UK, GER): – 95% are located in low-risk countries (WGI score >60) – 5% are located in medium-risk (WGI between 30 and 60)
– None are in high-risk countries.
How we manage (material) topics
#4 We cooperate with our ecosystem
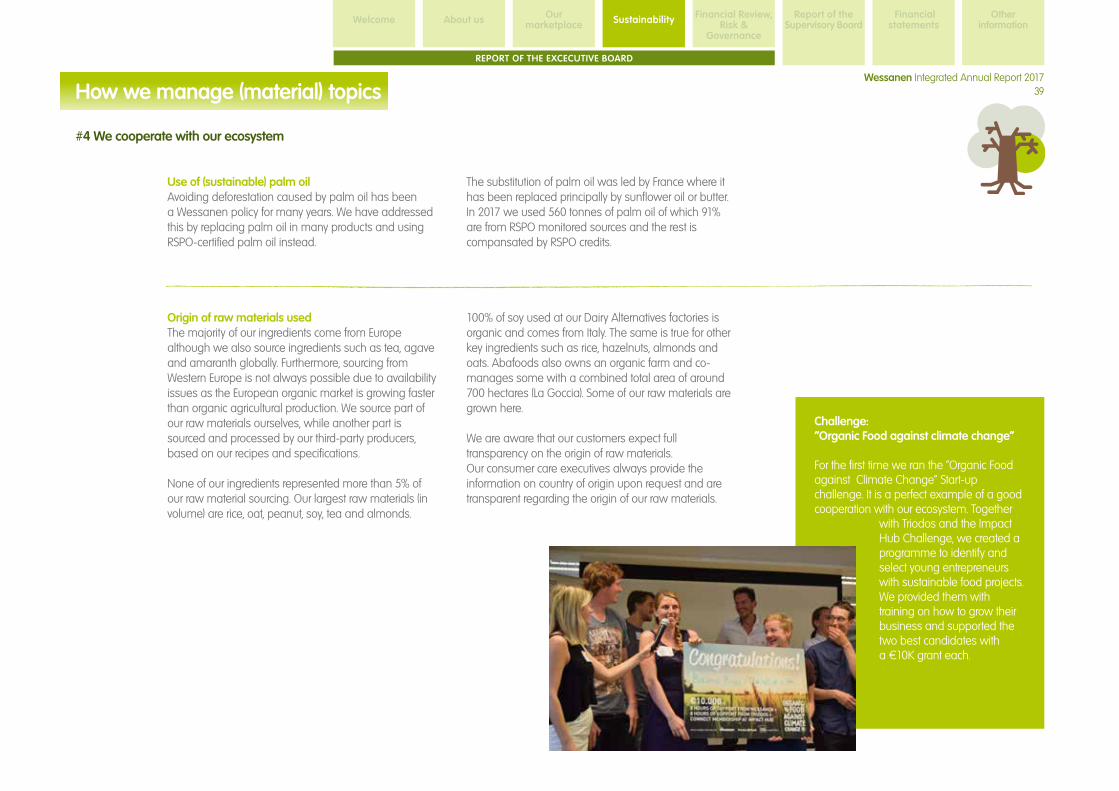
SustainabilityAbout us Financial Review, Risk &
Governance
Report of the Supervisory Board
Financial statements
Other information
Our marketplaceWelcome
39Wessanen Integrated Annual Report 2017
Sustainability
REPORT OF THE EXCECUTIVE BOARD
Use of (sustainable) palm oilAvoiding deforestation caused by palm oil has been a Wessanen policy for many years. We have addressed this by replacing palm oil in many products and using RSPO-certified palm oil instead.
The substitution of palm oil was led by France where it has been replaced principally by sunflower oil or butter.In 2017 we used 560 tonnes of palm oil of which 91% are from RSPO monitored sources and the rest is compansated by RSPO credits.
Origin of raw materials usedThe majority of our ingredients come from Europe although we also source ingredients such as tea, agave and amaranth globally. Furthermore, sourcing from Western Europe is not always possible due to availability issues as the European organic market is growing faster than organic agricultural production. We source part of our raw materials ourselves, while another part is sourced and processed by our third-party producers, based on our recipes and specifications.
None of our ingredients represented more than 5% of our raw material sourcing. Our largest raw materials (in volume) are rice, oat, peanut, soy, tea and almonds.
100% of soy used at our Dairy Alternatives factories is organic and comes from Italy. The same is true for other key ingredients such as rice, hazelnuts, almonds and oats. Abafoods also owns an organic farm and co-manages some with a combined total area of around 700 hectares (La Goccia). Some of our raw materials are grown here.
We are aware that our customers expect full transparency on the origin of raw materials. Our consumer care executives always provide the information on country of origin upon request and are transparent regarding the origin of our raw materials.
Challenge: “Organic Food against climate change”
For the first time we ran the “Organic Food against Climate Change” Start-up challenge. It is a perfect example of a good cooperation with our ecosystem. Together
with Triodos and the Impact Hub Challenge, we created a programme to identify and select young entrepreneurs with sustainable food projects. We provided them with training on how to grow their business and supported the two best candidates with a €10K grant each.
How we manage (material) topics
#4 We cooperate with our ecosystem

SustainabilityAbout us Financial Review, Risk &
Governance
Report of the Supervisory Board
Financial statements
Other information
Our marketplaceWelcome
40Wessanen Integrated Annual Report 2017
Sustainability
REPORT OF THE EXCECUTIVE BOARD
Connectivity matrix
#1 We provide healthy food as intended by nature
#2 We are as resource efficient as nature
At Wessanen, Sustainability is not an extra aspect of our business, it is right at the core of what we do. That’s why we believe in integrated thinking, planning and execution.
In the following table we aim to give insight into the way our Sustainability KPIs connect to our mission, strategy and risk management approach. We are working on further defining and detailing these connections.
KPI Target Result 2017 (Material) topic Related risks Strategic pillar
Organic products 90% by 2025 78% 5 Organic Sustainability of our strategy Innovations to create revenue growth
1 3
Vegetarian products >95% 96% 3
1
Healthy foodCarbon emissions and climate change
Sustainability of our strategy 1 3
Products respecting nutritional policies 95% by 2020 85% 3 Healthy food Food safety issues in our business increase competition from new entrants and private label
1
Finished products suppliers certified GFSI 95% by 2018 93% 3 Healthy food Food safety issues in our business 2
Number of fines 0 0 2 Regulatory compliance and labelling Food safety issues in our business 1 2
KPI Target Result 2017 (Material) topic Related risks Strategic pillar
Renewable electricity (% of purchased electricity)
100% in 2020 90% 1 Carbon emissions and climate change Sustainability of our strategyDependency on raw materials
3
Emissions scope 1 (tonnes CO2) Reduced and neutralised by 2025
6,842 1 Carbon emissions and climate change Sustainability of our strategyDependency on raw materials
2
Emissions scope 2 (tonnes CO2) (net) 0 232 1 Carbon emissions and climate change Sustainability of our strategyDependency on raw materials
2
Emissions scope 3 (tonnes CO2) (subcontracted transportation and business travels)
To be defined 30,327 1 Carbon emissions and climate change Sustainability of our strategyDependency on raw materials
2
Total emissions (tonnes CO2) 37,400 1 Carbon emissions and climate change Sustainability of our strategyDependency on raw materials
2
Emissions compensated (tonnes CO2) Total emissions neutralised by 2025
12,211 1 Carbon emissions and climate change Sustainability of our strategyDependency on raw materials
3
Total emissions ratio – 60 1 Carbon emissions and climate change Sustainability of our strategyDependency on raw materials
2
Physical waste 0.34% by 2020 0.65% 8 Food waste management Effective and efficient supply chains 2 Packaging ratio Further reduce 0.14 1 Carbon emissions and climate change Sustainability in our strategy 3

SustainabilityAbout us Financial Review, Risk &
Governance
Report of the Supervisory Board
Financial statements
Other information
Our marketplaceWelcome
41Wessanen Integrated Annual Report 2017
Sustainability
REPORT OF THE EXCECUTIVE BOARD
KPI Target Result 2017 (Material) topic Related risks Strategic pillar
Employees training hours No target 21.2 9 Fair working conditions People and talent management 3
Women No target 51% 9 Fair working conditions Sustainability of our strategy 3
Women in senior management positions 50% by end 2022 30% 9 Fair working conditions Sustainability of our strategy 3
Lost time injury no target 2.9 NA Effective and efficient supply chains 2 Mobility >50 % by end 2022 not
measured9 Fair working conditions People and talent management 3
#3 We are a diverse and agile community
#4 We cooperate with our ecosystemKPI Target Result 2017 (Material) topic Related risks Strategic pillar
Fair trade sales (tonnes) No target - increase
7,448 6
11
Ethics in supply chainFair trade
Sustainability of our strategyDependency on raw materials
1 3
Finished product suppliers having signed code of conduct (%PTO)
100% by 2020 92% 6 Ethics in supply chain (including prevention of bribery and corruption)
Sustainability of our strategyStrategic position of suppliers
2 3
Donationof products (tonnes) No target 49 8
17
Food waste managementCommunity involvement
Sustainability of our strategy 3
Connectivity matrix

SustainabilityAbout us Financial Review, Risk &
Governance
Report of the Supervisory Board
Financial statements
Other information
Our marketplaceWelcome
42Wessanen Integrated Annual Report 2017
Sustainability
REPORT OF THE EXCECUTIVE BOARD
KPIs 2015 – 2017
Indicator 2017 2017 (scope 16) 2016 2015
Organic products (% of net sales)
78% 77% 74% 72%
Vegetarian products (% of net sales)
96% 96% 96% 96%
Products respecting nutritional policies (%)
85% 85% 86% 87%
Finished products suppliers certified GFSI (%PTO) 3
93% – 82% 63%
Number of fines 0 0 0 0
Indicator 2017 2017 (scope 16) 2016 2015
Employees training hours 21.3 25.2 19.9 25.0Women (% of total) 51% 52% 53% 52%Women in senior management positions (% of senior management) 7
30% – nm nm
Lost Time Injury 2.9 2.6 2.6 3.1Indicator 2017 2017 (scope 16) 2016 2015
Fair trade sales (tonnes) 7,448 6,857 nm nmFinished products suppliers having signed code of conduct (%PTO) 3
92% – 85% 81%
Donation of products (tonnes) 49 – nm nm
#1 We provide healthy food as intended by nature
#3 We are a diverse and agile community
#2 We are as resource efficient as nature
#4 We cooperate with our ecosystem
Indicator 2017 2017 (scope 16) 2016 2015
Renewable electricity (% of purchased electricity)
90% 99% 95% 94%
Emissions scope 1 (tonnes CO2) 1 6,842 6,696 6,649 5,888Emissions scope 2 (tonnes CO2) 9 232 32 229 380Emissions scope 3 (tonnes CO2) 10 30,327 30,327 24,492 25,322Total emissions (tonnes CO2) 37,400 37,055 31,394 31,590Emissions compensated (tonnes CO2) 7
12,211 – nm nm
Total emissions ratio (tonnes CO2/net sales € millions)
60 64 57 63
Physical waste 0.65%6 0.38% 0.48% 0.41%
Packaging ratio 0.14 0.14 0.12 0.12
2
4 4 4 5
8
1 Direct emissions from operations include our natural gas consumption, as well as the consumption of leased cars. All other possible scope 1 sources as included in the GHG protocol are excluded because they are not relevant for us or non-material accounting for <0.5% of total scope 1 and 2 emissions.
2 The 2015 diesel and petrol consumption for the German sites (Bremen, Drebber and Freiburg) have been adjusted during the data review in 2016. Bioslym 2015 figure of gasonline/petrol was adjusted to diesel.
3 Biogran, Bioslym and Destination not included.
4 Abafoods data not available.
5 Flights have been adjusted. In 2016 intercontinetal flights were reported which were in fact continental flights. Based on new insights the outsourced diesel consumption (customer to warehouse) was adjusted for 2015.
6 Biogran, Bioslym and Destinatio not included.
7 New KPI.
8 The 2015 figures of weight of packaging and product weight are adjusted for Bioslym.
9 Net emissions.
10 Subcontracted transportation and business travel.
SustainabilityAbout us Financial Review, Risk &
Governance
Report of the Supervisory Board
Financial statements
Other information
Our marketplaceWelcome
43Wessanen Integrated Annual Report 2017
Sustainability
REPORT OF THE EXCECUTIVE BOARD
Process and benchmarks
Reporting process for sustainability informationSustainability data is collected in January of each year. Some data have been collected in each location, others have been collected centrally. Once collected, the data was consolidated and submitted to trend analyses.
Where necessary, data was verified with the relevant data provider. The data for this report was quantified. Where no data was available, it was estimated. No uncertainties or inherent limitations to the data were identified as a result of the measurement, estimation or calculation of data.
Our sustainability KPIs are presented in a table (page 42). Significant changes in definitions and measurement methods versus previous reporting periods are explained at the bottom of this table.
In 2017 we revised our sustainability policy and objectives, but the material topics have not changed. We have mandated a third party to provide limited assurance on six KPIs, namely: organic, vegetarian, fair trade, renewable electricity, carbon emissions scope 1 and 2 and suppliers having signed the code of conduct.
We aim to provide our stakeholders with reliable data. As part of this process, our goal is to expand the external audit on our report in the coming years.
The reporting period refers to 1. January 2017 - 31. December 2017. The previous report was published on 22. February 2017. Our reporting cycle is annually.
We welcome feedback from the readers and other interested stakeholders, emails can be send to [email protected].
Reporting scopeThe scope of our CSR performance includes all entities for which Wessanen holds management responsibility. This also means that subcontractors are not included, unless stated otherwise.
We report additional financial and non-financial information according to the GRI Standards, core applicationThe aim is to inform our stakeholders about our financial and non-financial developments, covering the calendar year 2017. In this report we present our progress on the material topics. The material topics, boundaries and scope were determined in conjunction with our stakeholders. The process for defining the material topics and report content, as well as the list of material topics, is described in the materiality determination.
Find more information (including the GRI refernence table) on www.wessanen.com in our “What we care for” section.
Carbon Disclosure Project (CDP)We annually participate in the Carbon Disclosure Project (www.cdproject.net), which is intended to inform investors, legislators and other stakeholders on global carbon emissions and climate change. For the year 2016 we were ranked at level B (Management) which is an improvement from level C the previous year. Dutch Transparency BenchmarkThe Transparency Benchmark of the Dutch Ministry of Economic Affairs, Agriculture and Innovation (EL&I) provides details on how over 400 of the largest Dutch companies report on their CSR activities. It charts transparency in sustainability reporting and also measures trends in the quality and quantity of CSR reporting.
Every year the Netherlands Ministry of Economic Affairs scores all listed companies based on the transparency of their communications and the content of their annual report.
In 2017, we were ranked 47 out of 477 companies, with a total of 176 of 200 possible points.
Assurance statementThe SGS Nederland BV’s assurance opinion on selected sustainability KPI’s is disclosed at the end of this report in “Other information” on page 149.
We are evolving our sustainability reporting every year with an aim to provide more insight and transparency. We are participating in key external benchmarks in order to learn and further improve.

SustainabilityAbout us Financial Review, Risk &
Governance
Report of the Supervisory Board
Financial statements
Other information
Our marketplaceWelcome
44Wessanen Integrated Annual Report 2017
Sustainability
REPORT OF THE EXCECUTIVE BOARD
Dilemmas
Sugar is a key public concern, as high sugar consumption can lead to a variety of non-communicable diseases, including diabetes. The total cost of type 2 diabetes at the European level has been estimated to be of EUR 29 billion a year. Another study, led by scientists from the Imperial College London in association with the T.H. Chan School of Public Health at Harvard University, the World Health Organisation, and nearly 500 researchers across the globe, estimated the global cost at $825 billion per year.
Sugar consumed in excess can also increase the risk of obesity and tooth decay, as well as being suspected of contributing to hyperactivity in children.
Sweet products are significant in our portfolio. This is a dilemma, as sugar should
not be consumed in excess for the reasons above, but it is a key element of consumer preference. It could potentially be replaced by artificial sweeteners, but this is not an option for us, as we aim at using the most natural ingredients.
Though we can consider that a product is not unhealthy in isolation but only when it is part of an unbalanced diet, we aim at offering products which can easily be integrated into healthy diets. So we must take in consideration the sugar quantity we put on the market.
As mentioned previously, we have a renovation plan in place to improve the nutritional profile of many products, by reducing the level of sugar and quantity per portion.
Nature is the best model of recycling. Natural systems cascade nutrients, matter and energy – waste does not exist. Any by-product is the source for a new product. This inspiring principle is not easy to apply to packaging, which is clearly a dilemma. How to choose a recyclable packaging material?
Recycling capability is variable and depends on the model in place in the country or even in the region. One type of packaging, for example multi-layer drink cartons, can be recycled in a region (mainly the cellulose part) and not in another one.
We also should question the efficiency of recyclability. Ideally a material should be recycled in the same material, like paper recycling. However, this is not the case for all materials considered recyclable. For example, although PET is considered highly recyclable, it is often recycled into
fleece, which qualifies more as downcycling than as true recycling.
And we should also look at the environmental impact of the recycling process, for example for glass. Glass is a highly recyclable material, however the process is very energy-consuming due to the high temperature required. Its transportation has also a high environmental impact due to its weight.
These various elements must be considered when choosing a packaging material, keeping in mind its primary functions such as transporting the product and protecting it from breakage, spoilage, quality loss and food waste. It is therefore good to realise that fully recyclable materials do not always have the lowest environmental impact.
SugarPackaging: recyclability
As we pursue our sustainability strategy we constantly have to manage a number of key trade offs in order to consider the overall best outcome for Wessanen and its various stakeholders. Two typical dilemmas are outlined in the following.
We are an agile and diverse community
In nature the more diverse is an ecosystem, the richer. Nature hates emptiness, each vacuum is filled by a new form of life which will create new interactions with others. And every element has a role in the ecosystem, either by
producing a by-product which will be a resource for other or by being itself an element in the food chain, maintaining the ecosystem balanced.
Nature is interconnected. The different elements are interdependent and connected, which allows a fast communication. This network maximizes information spreading while minimizing the number of contacts. It was recently observed that trees can communicate when they
are under threat. They emit a gas to inform other trees about a hazard , so they can get prepared , for example by producing a protecting substance. Indeed, nature is very agile and adaptable.
This can be very inspiring for any organisation : it must be diverse to have complementary people and agile to have efficient cooperation.
Nathan Gilbert (B Corp)
Nature evolved along 4.5 billion years from a few species to a rich biodiversity
45
Wessanen Integrated Annual Report 2017

SustainabilityAbout us Financial Review, Risk &
Governance
Report of the Supervisory Board
Financial statements
Other information
Our marketplaceWelcome
46Wessanen Integrated Annual Report 2017
REPORT OF THE EXCECUTIVE BOARD
“The richness of our biodiversity and ecosystems only exists because of cooperation and sharing of our resources.”
Currently his role is Executive Director for B Lab Europe. He has been working with Wessanen for the past two years on the B Corp Certification of Bjorg Bonneterre et Compagnie and will continue to support that journey so that soon other entities within Wessanen will be certified too.
Everything in life is interconnected“We share the view that everything in life is interconnected and interdependent. Business, since the industrial revolution, has become the most powerful manmade force on the planet. In that evolution, to be successful, business and the whole capitalism system have disconnected from the environment and social communities. However, that success, mainly financial value, can only exist if you choose to remain disconnected from the world. As we know it, the degradation of the environment, limited or non-existent social benefits, and other examples of business externalities can no longer continue to produce limitless growth. We must pursue a more multi-capital model that recognises the connections of human, social, environmental, and financial capital.”
It is about a balanced governance approach“B Corps are great examples of how business takes into account its negative and positive impacts with a more balanced governance approach. While competition exists in nature, think survival of the fittest, the richness of our biodiversity and ecosystems only exists because of cooperation and sharing of our resources. In my view Wessanen supports positive benefits to our natural environments through its business activities, together we can support a more inclusive economy through our business interdependencies.”
Nathan Gilbert (B Corp) has been working for the B Corp Movement over the last seven years. Today, there is a growing community of more than 2,100 Certified B Corps from 50 countries and over 130 industries working together toward one unifying goal: using business as a force for good.
STENDERT KROMMENDAM Group HR Director
I am working as Group HR Director for Wessanen since January 2017, a very diverse role in which I have the privilege to work with many talented colleagues from around Europe to further shape the people agenda for Wessanen.
We’re a different kind of food company; one where both autonomy, collaboration and accountability are really at the heart of our own operating model. In order to be able to support this we actively and continuously seek for diversity and agility in our people. Both talent management and development are part of the core pillars of our European Human Resources plan. That means that on the one hand we aim to stimulate internal mobility through internal job rotation, international opportunities and training. On the other hand we continuously search the markets we operate in to attract the talent that best fits our diverse workforce. This does give us the required agility and diversity we aim to have in order to continuously meet the consumer needs around Europe.

Financial review, Risk &
Governance
SustainabilityAbout us Financial Review, Risk &
Governance
Report of the Supervisory Board
Financial statements
Other information
Our marketplaceWelcomeWelcome
47Wessanen Integrated Annual Report 2017
Biographies
R.J.J.B. (Ronald) Merckx1967 Dutch nationality
Executive Board member and CFO
CURRENT TERM OF APPOINTMENT
2015–2019; first appointed in 2011.
EXPERIENCE
Joined Wessanen in June 2011 as CFO.
Former positions include CFO Europe for Britax Childcare International and financial positions in internal audit, controlling, investor relations and financial management at Unilever in the Netherlands, the UK and Germany.
Ownership of Wessanen shares 61,150
C.P.J. (Christophe) Barnouin1968 French nationality
Executive Board member and CEO
CURRENT TERM OF APPOINTMENT
2016–2020; first appointed in 2014.
EXPERIENCE
Joined Wessanen in April 2006. Became CEO on 25 January 2014.
Former positions include managing director of Wessanen’s French and Italian operations, marketing director at Mars and marketing and sales positions at Reckitt Benckiser and Orangina.
Other positions: Chairman Supervisory Board Yarrah Organic Pet Food Holding BV.
Ownership of Wessanen shares 137,069
FINANCIAL REVIEW, RISK & GOVERNANCE
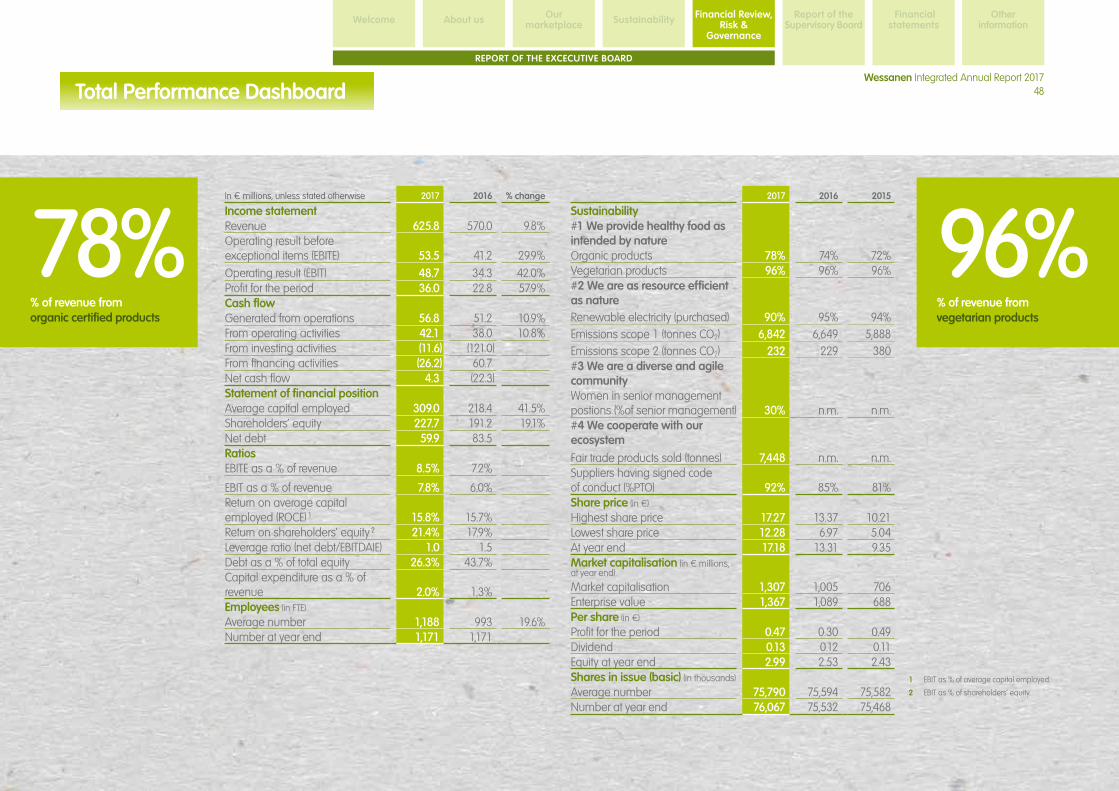
SustainabilityAbout us Financial Review, Risk &
Governance
Report of the Supervisory Board
Financial statements
Other information
Our marketplaceWelcome
48Wessanen Integrated Annual Report 2017
REPORT OF THE EXCECUTIVE BOARD
96% % of revenue from vegetarian products
78% % of revenue from organic certified products
1 EBIT as % of average capital employed.
2 EBIT as % of shareholders’ equity.
In € millions, unless stated otherwise 2017 2016 % change
Income statementRevenue 625.8 570.0 9.8%Operating result before exceptional items (EBITE) 53.5 41.2 29.9%
Operating result (EBIT) 48.7 34.3 42.0%Profit for the period 36.0 22.8 57.9%Cash flowGenerated from operations 56.8 51.2 10.9%From operating activities 42.1 38.0 10.8%From investing activities (11.6) (121.0)From financing activities (26.2) 60.7Net cash flow 4.3 (22.3)Statement of financial positionAverage capital employed 309.0 218.4 41.5%Shareholders’ equity 227.7 191.2 19.1%Net debt 59.9 83.5RatiosEBITE as a % of revenue 8.5% 7.2%
EBIT as a % of revenue 7.8% 6.0%Return on average capital employed (ROCE) 1 15.8% 15.7%Return on shareholders’ equity 2 21.4% 17.9%Leverage ratio (net debt/EBITDAIE) 1.0 1.5Debt as a % of total equity 26.3% 43.7%Capital expenditure as a % of revenue 2.0% 1.3%Employees (in FTE)
Average number 1,188 993 19.6%Number at year end 1,171 1,171
2017 2016 2015
Sustainability#1 We provide healthy food as intended by natureOrganic products 78% 74% 72%Vegetarian products 96% 96% 96%#2 We are as resource efficient as natureRenewable electricity (purchased) 90% 95% 94%Emissions scope 1 (tonnes CO2) 6,842 6,649 5,888Emissions scope 2 (tonnes CO2) 232 229 380#3 We are a diverse and agile communityWomen in senior management postions (%of senior management) 30% n.m. n.m.#4 We cooperate with our ecosystem
Fair trade products sold (tonnes) 7,448 n.m. n.m.Suppliers having signed code of conduct (%PTO) 92% 85% 81%Share price (in €)
Highest share price 17.27 13.37 10.21Lowest share price 12.28 6.97 5.04At year end 17.18 13.31 9.35Market capitalisation (in € millions, at year end)
Market capitalisation 1,307 1,005 706Enterprise value 1,367 1,089 688Per share (in €)
Profit for the period 0.47 0.30 0.49Dividend 0.13 0.12 0.11Equity at year end 2.99 2.53 2.43Shares in issue (basic) (in thousands)
Average number 75,790 75,594 75,582Number at year end 76,067 75,532 75,468
Total Performance Dashboard

SustainabilityAbout us Financial Review, Risk &
Governance
Report of the Supervisory Board
Financial statements
Other information
Our marketplaceWelcome
49Wessanen Integrated Annual Report 2017
REPORT OF THE EXCECUTIVE BOARD
In 2017, Wessanen realised revenue of €625.8 million and an operating result of €48.7 million. Net profit amounted to €36.0 million, resulting in earnings per share of €0.47. A dividend of €0.13 per share will be proposed to the AGM.
RevenueIn 2017, revenue amounted to €625.8 million, an increase of 9.8% compared to last year’s revenue of €570.0 million. Autonomous growth of our own brands was 7.7%, Total autonomous revenue growth amounted to €12.4 million, or 2.0%, as a result of the decline in private label and distribution brands. The prior year acquisitions of the Piramide tea business in the Netherlands, Ineobio in France, Mrs Crimble’s in the UK and Biogran in Spain added €49.0 million, or 8.6%. A weakening of the British pound exchange rate impacted revenue adversely with €(5.6) million or (1.0)%.
Operating costsGross contribution margin increased from 41.1% in 2016 to 41.5% in 2017.
Personnel expenses increased by €4.8 million to €96.5 million (2016: €91.7 million). The increase can mainly be explained by the acquisition of Ineobio and Biogran in 2016. In 2017, personnel expenses are impacted by severance payments and termination benefits of €3.0 million, mainly relating to the announced relocation of the distribution centre of Bonneterre et Compagnie (2016: severance payments and termination benefits of €4.8 million mainly related to the restructuring at our German manufacturing plants Allos and Allos Schwarzwald in order to drive sustainable profit improvement).
Depreciation, amortisation and impairments increased by €2.1 million to €9.9 million in 2017, including an impairment loss recognised of €(1.1) million related to the building and
machinery and equipment at Bonneterre et Compagnie (France) following the announced relocation of the distribution centre.
Other operating expenses, were up €4.2 million, or 4.2%, to €104.8 million, mainly due to the acquisitions in 2016.
Operating result and EBITEWessanen’s operating result increased to €48.7 million (2016: €34.3 million). Excluding non-recurring items, EBITE increased by 30% to €53.5 million from €41.2 million last year, representing a 8.5% margin (2016: 7.2%).
2016reported
Autonomous growth
2017CurrencyAcquisitions
€570.0
€49.0 €625.8€12.4 €(5.6)
Revenue development in € millions
Financial overview per segment
In € millions BrandedNon-
allocated Total
2017Revenue 625.8 – 625.8Operating result before exceptional items (EBITE) 56.8 (3.3) 53.5
EBITE margin as a % of revenue 9.1% – 8.5%Operating result (EBIT) 52.0 (3.3) 48.7Average capital employed 304.9 4.1 309.0Return on average capital employed (ROCE) 17.1% – 15.8%
2016Revenue 570.0 – 570.0Operating result before exceptional items (EBITE) 44.8 (3.6) 41.2EBITE margin as a % of revenue 7.9% – 7.2%Operating result (EBIT) 37.9 (3.6) 34.3Average capital employed 209.0 9.4 218.4Return on average capital employed (ROCE) 18.1% – 15.7%
Financial review

SustainabilityAbout us Financial Review, Risk &
Governance
Report of the Supervisory Board
Financial statements
Other information
Our marketplaceWelcome
50Wessanen Integrated Annual Report 2017
REPORT OF THE EXCECUTIVE BOARD
EBITE development in € millions
2016 Branded 2017Non-allocated
€41.2
€0.3€12.0 €53.5
Operating result BrandedThe operating result of Branded increased to €52.0 million (2016: €37.9 million). Excluding non-recurring items, EBITE amounted to €56.8 million versus €44.8 million last year. Non-recurring items totalled €(4.8) million in 2017, mainly including restructuring- and impairment expenses incurred (of €(2.7) million and €(1.1) million respectively) in respect of the announced relocation of the distribution centre of Bonneterre et Compagnie (France) and restructuring related costs in Germany (€(0.6) million) (2016: €(6.9) million, mainly including (1) restructuring costs of €(6.6) million relating to Germany, to streamline the German operations and to downsize the Allos plant, and (2) integration costs of €(0.3) million in respect of Mrs Crimble’s in the UK).
Non-allocated costsAll corporate costs other than shareholder and stewardship costs are charged to the operating segments.
In 2017, these non-allocated costs amounted to €(3.3) million, compared to €(3.6) million in 2016. Non-allocated costs have not been impacted by non-recurring items in both 2016 and 2017.
Net financing costsNet financing costs were €(1.9) million (2016: €(1.8) million). Interest expenses amounted to €(0.9) million (2016: €(0.4) million), due to increased loan financing following the acquisition of Biogran in December 2016. Other financial income and expenses decreased to €(1.0) million (2016: €(1.4) million), mainly as a result of a lower net foreign exchange loss of €(0.4) million (2016: €(0.7) million).
Income tax expenses and paidIncome tax expense increased by €(1.1) million to €(10.8) million (2016: €(9.7) million), mainly as a result of the increase in profit before income tax. The effective tax rate of 23% in 2017 (2016: 30%) deviates from the weighted average statutory income tax rate of 30%, mainly as a result of (1) a decrease of the enacted income tax rate in France, resulting in an income tax gain of €1.0 million, (2) the recognition and utilisation of an accumulated income tax credit (a notional interest deduction) in Italy of €1.2 million, (3) the recognition and partial utilisation of unrecognised income tax losses in France and the Netherlands of €2.0 million, partly offset by (4) unrecognised income tax losses incurred in Germany of €(0.9) million.
Income tax paid in 2017 amounted to €(13.5) million (2016: €(12.4) million).
Corporate tax policyAt Wessanen, we believe that paying taxes is ordinary behaviour and part of our corporate social responsibility. Our corporate tax policy is in essence reflected by the following proclamations: – Tax is not limited to corporate income tax but also entails VAT, wage withholding tax, social securities, stamp duties, packaging tax, dividend withholding tax, sales and use tax, (exceptional) solidarity surcharges, real estate tax, excise duties and any other taxes that Wessanen pays annually in multiple jurisdictions;
– Wessanen is tax compliant and pays the tax that is due and owed;
– Tax should be aligned with our commercial business and we therefore do not establish artificial tax driven structures that are not in line with (the spirit of) any tax regulations. This means that we do not maintain or implement aggressive tax planning structures or have entities located in tax haven jurisdictions solely for tax optimisation purposes;
– Wessanen has a limited tax risk appetite. With the strategic focus to build the most desired brands in healthy and sustainable food, Wessanen is aware of its brand and corporate reputational importance. Wessanen also believes that a high tax risk appetite may jeopardise this objective;
– Periodical meetings are scheduled by the tax department (joined by the CFO) with local management to discuss tax developments, our tax policy and any local uncertain tax positions in detail;
– Wessanen has a procedure in place that requires either the consultation or approval from Wessanen’s Vice President Tax on certain material transactions or business restructurings in any of our jurisdictions to, amongst others, ascertain compliance with our tax policy and strategy;
– Wessanen’s tax policy is subject to discussion with our stakeholders, including investors, NGO’s and local tax authorities. Currently, the latter stakeholder dialogue further strengthens Wessanen in enhancing our low risk appetite tax policy;
Financial review

SustainabilityAbout us Financial Review, Risk &
Governance
Report of the Supervisory Board
Financial statements
Other information
Our marketplaceWelcome
51Wessanen Integrated Annual Report 2017
REPORT OF THE EXCECUTIVE BOARD
– The effective tax rate of Wessanen or any of its affiliated companies is not a KPI of the tax department. Our tax department is measured against compliance targets and adherence to local tax regulations, such as compliance to local transfer pricing documentation requirements and establishing a legal framework in line with commercial business operations;
– Wessanen is transparent towards tax authorities and participates in a cooperative compliance program (horizontal monitoring ruling with the Dutch tax authorities);
– Wessanen has identified key tax controls that are part of the Company’s Internal Control Framework (‘ICF’). The effectiveness of the tax controls are also subject to review by our Internal Audit department;
– Annually, our tax advisors issue a ‘tax letter’ to our auditors and tax department in which the main fiscal position of said jurisdiction is summarised, providing additional independent tax assurance;
– Wessanen monitors and tests its tax control framework on a regular basis. Errors detected will be corrected within the fiscal year;
– Tax systems are often complex and the application of tax law to the facts of a particular case may be unclear. For material transactions, independent external tax advice is generally sought and, if appropriate, approval from tax authorities can be obtained in relation to the application of specific tax legislation;
– The Vice President Tax informs the Audit Committee at least twice a year regarding tax developments, any uncertain tax positions and tax strategies;
– Wessanen is not impacted by current fiscal legislation to file tax on a country by country basis to local tax authorities in any of our jurisdictions in which we are active (due to the size of our operations);
– All our legal entities are solely domiciled in EU countries, which at the fiscal year end 2017 are: France, Germany, Italy, the Netherlands, Spain and the UK.
Our entities are subject to the following corporate income tax rates for 2017: the Netherlands 25%, France 34%, Germany 31%, Italy 28%, Spain 25% and the UK 19%.
Net profitNet profit amounts to €36.0 million (2016: €22.8 million). The increase in net profit compared to 2016 of €13.2 million is mainly the result of the increased operating profit of €14.4 million, partly as a result of the acquisitions in 2016.
Earnings per shareEarnings per share increased from €0.30 in 2016 to €0.47 in 2017. The average number of shares outstanding amounted to 75.8 million (2016: 75.6 million).
Dividend policy and 2017 dividend proposalThe dividend policy of the Company aims at creating value in the long term. The objective of the dividend policy is to maintain a healthy financial structure and to retain sufficient earnings in order to execute Wessanen’s four pillar strategy. Wessanen aims at paying out a dividend that is stable or growing over time. Before deciding to pay out dividend, Wessanen will assess whether more value could be created by (i) investing profit in the execution of Wessanen’s strategy (such as investments in R&D, capital expenditures or acquisitions), (ii) improving Wessanen’s financial position (debt repayment), or (iii) improving the position of its shareholders (share repurchasing). Accordingly, it may be decided not to pay dividend or to pay a lower dividend in any year in the future. No interim dividends will be paid.
In line with the dividend policy, it is proposed to the Annual General Meeting of Shareholders to pay a dividend of 13 eurocent per share. The dividend will be paid wholly in cash.
Capex and depreciation/amortisationThe acquisition of property, plant and equipment amounted to €10.0 million (2016: €5.2 million), which represents 1.6% of revenue (2016: 0.9%) and 156% of depreciation (2016: 91%). The acquisition of intangible assets amounted to €2.3 million (2016: €2.1 million).
Depreciation was €(6.4) million (2016: €(5.7) million) and amortisation was €(2.6) million (2016: €(1.9) million). Impairments were recognised in the amount of €(0.9) million in 2017, mainly including an impairment loss recognised of €(1.1) million related to the building and machinery and equipment at Bonneterre et Compagnie (France) following the announced relocation of the distribution centre, and the reversal of an impairment loss recognised in 2015 of €0.2 million relating to capitalised costs for a building construction project in France.
Financial review
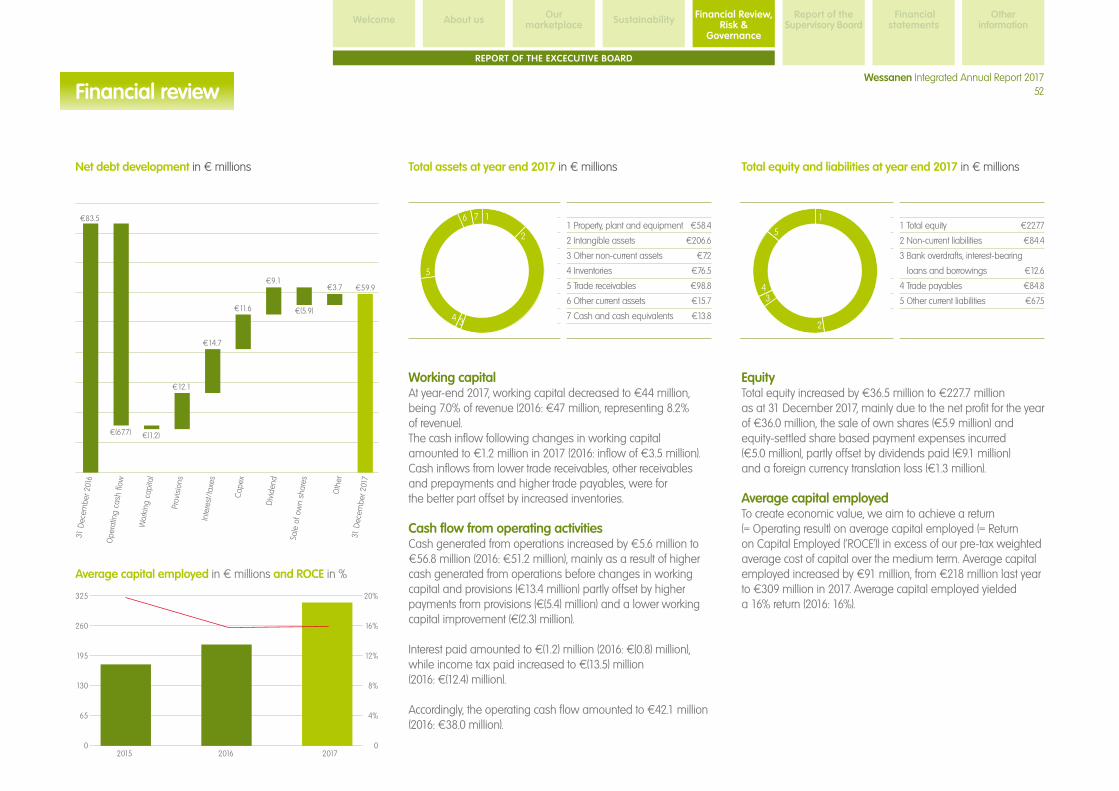
SustainabilityAbout us Financial Review, Risk &
Governance
Report of the Supervisory Board
Financial statements
Other information
Our marketplaceWelcome
52Wessanen Integrated Annual Report 2017
REPORT OF THE EXCECUTIVE BOARD
Working capitalAt year-end 2017, working capital decreased to €44 million, being 7.0% of revenue (2016: €47 million, representing 8.2% of revenue).The cash inflow following changes in working capital amounted to €1.2 million in 2017 (2016: inflow of €3.5 million). Cash inflows from lower trade receivables, other receivables and prepayments and higher trade payables, were for the better part offset by increased inventories.
Cash flow from operating activitiesCash generated from operations increased by €5.6 million to €56.8 million (2016: €51.2 million), mainly as a result of higher cash generated from operations before changes in working capital and provisions (€13.4 million) partly offset by higher payments from provisions (€(5.4) million) and a lower working capital improvement (€(2.3) million).
Interest paid amounted to €(1.2) million (2016: €(0.8) million), while income tax paid increased to €(13.5) million (2016: €(12.4) million).
Accordingly, the operating cash flow amounted to €42.1 million (2016: €38.0 million).
EquityTotal equity increased by €36.5 million to €227.7 million as at 31 December 2017, mainly due to the net profit for the year of €36.0 million, the sale of own shares (€5.9 million) and equity-settled share based payment expenses incurred (€5.0 million), partly offset by dividends paid (€9.1 million) and a foreign currency translation loss (€1.3 million).
Average capital employedTo create economic value, we aim to achieve a return (= Operating result) on average capital employed (= Return on Capital Employed (‘ROCE’)) in excess of our pre-tax weighted average cost of capital over the medium term. Average capital employed increased by €91 million, from €218 million last year to €309 million in 2017. Average capital employed yielded a 16% return (2016: 16%).
31 D
ecem
ber 2
016
Ope
ratin
g ca
sh fl
ow
Wor
king
cap
ital
Prov
isio
ns
Inte
rest
/tax
es
Cap
ex
Div
iden
d
Sale
of o
wn
shar
es
Oth
er
31 D
ecem
ber 2
017
€83.5
€(1.2)
€12.1
€(67.7)
€14.7
€11.6
€9.1
€(5.9)
€3.7 €59.9
Net debt development in € millions
1 Property, plant and equipment
2 Intangible assets
3 Other non-current assets
4 Inventories
5 Trade receivables
6 Other current assets
7 Cash and cash equivalents
€58.4
€206.6
€7.2
€76.5
€98.8
€15.7
€13.8
1
2
34
5
6 7
Total assets at year end 2017 in € millions Total equity and liabilities at year end 2017 in € millions
Average capital employed in € millions and ROCE in %
1 Total equity
2 Non-current liabilities
3 Bank overdrafts, interest-bearing
loans and borrowings
4 Trade payables
5 Other current liabilities
€227.7
€84.4
€12.6
€84.8
€67.5
1
2
34
5
20162015
325
260
195
130
65
0
20%
16%
12%
8%
4%
02017
Financial review

SustainabilityAbout us Financial Review, Risk &
Governance
Report of the Supervisory Board
Financial statements
Other information
Our marketplaceWelcome
53Wessanen Integrated Annual Report 2017
REPORT OF THE EXCECUTIVE BOARD
Net debt, debt funding and liquidityNet debt developmentThe net debt position decreased by €23.6 million from €83.5 million at year end 2016 to €59.9 million at year end 2017, mainly due to cash generated from operations of €42.1 million and the sale of own shares (€5.9 million), partly offset by the acquisition of property, plant and equipment (€10.0 million) and intangible assets (€2.3 million) and dividends paid (€9.1 million).
Net debt/(cash) in € millions and leverage ratio
20162015
90
60
30
0
-30
-60
4
3
2
1
0
-12017
Revolving credit facilityThe Group has a committed €125 million revolving credit facility in place, provided by ABN AMRO and ING. In April 2017, the initial termination date of the credit facility was extended for an additional period of two years, that is to 23 July 2022. The pricing grid over the relevant floating rate (EURIBOR or LIBOR) is based on the leverage ratio (Net debt to EBITDAIE of total Wessanen). The maximum aggregate amount which can be drawn under the ‘accordion facility’ (optional increase of the credit facility) is €25 million.
Under its financial covenants, Wessanen has to ensure that total net debt does not exceed 3.0 times consolidated EBITDAIE. A spike up to 3.5 times consolidated EBITDAIE is allowed under
specific conditions for a maximum duration of two (consecutive) quarters.
At 31 December 2017 our net debt of €59.9 million amounted to 1.0 times consolidated EBITDAIE (2016: 1.5 times consolidated EBITDAIE). The facility has various other general and financial covenants that are customary for its type, amount and tenor. For example, Wessanen is not permitted to declare or pay a dividend exceeding 45% of its net results, excluding any non-recurring items, and there are certain restrictions in place in case of acquisitions. A violation of any of these covenants constitutes an event of default under our credit facility, which would, unless waived by our lenders, provide our lenders with the right to request for immediate repayment of the outstanding loan without the requirement of notice or any other formality. The Group has the ability to draw loans from the syndicated credit facility with maturities ranging between 1 week and 9 months. When a loan expires, this is, ceteris paribus, refinanced with a new loan drawn from the facility. The average interest rate on drawings for 2017 was 0.7% (2016: 0.7%).
Other loans and facilitiesOther loans and liabilities as per year end 2017 mainly consist of loan financing, finance lease liabilities, including a lease building under construction in France and reverse factoring at Abafoods.
Liquidity managementWessanen manages its liquidity by monitoring and forecasting cash flow of its operating companies, debt servicing requirements, dividends to shareholders and other obligations. This approach ensures that, as far as possible, the Group will always have sufficient liquidity to meet its financial obligations when due, without incurring unacceptable losses or risking damage to the Group’s reputation.
Financing strategyOur financing strategy is centred on securing long term financing in order to support autonomous growth and acquisitions.
The Company’s capital structure balances the following objectives in order to meet its strategic and operational needs: – Ongoing access to debt and equity markets; – Sufficient flexibility to fund add-on acquisitions; – Optimal weighted average cost of capital; – Mitigating financial risks.
Our targeted net debt level is below 2.5 times consolidated EBITDAIE, but our actual net debt levels can be higher or lower depending on acquisitions and divestments, access to capital markets and the timing of cash flows.
Financial review

Upgrade our operations
Building a green, attractive and efficient company
Making selective acquisitions
Growing our brands in core categories
SustainabilityAbout us Financial Review, Risk &
Governance
Report of the Supervisory Board
Financial statements
Other information
Our marketplaceWelcome
54Wessanen Integrated Annual Report 2017
1
4
2
3
REPORT OF THE EXCECUTIVE BOARD
The Executive Board has the overall responsibility for achieving our strategy, objectives, goals and results as well as for establishing and maintaining adequate internal risk management and control systems and procedures consistent with our business. Wessanen’s Risk Management and Internal Control Framework are integral parts of our business model and are designed to identify and manage risks as we pursue our overall corporate objectives.
Doing business and risk managementIn our business process framework we have defined how we manage our business from setting our high level vision, mission and strategy, down to day-to-day operations. The related processes we have implemented help us understanding, managing, monitoring and improving our activities. As part of this framework we have identified controls in the Internal Control Framework (ICF) which is designed to actively mitigate various risks at all levels and in all areas of our organisation. As such risk management is not seen as a separate element of doing business; it’s an integral part of our business model. Moreover, the way we deal with it is considered to be a key driver to the long-term success of Wessanen.
Based on Wessanen’s vision and mission, the Executive Board determines the strategy of the Company and aligns it with, among others the Supervisory Board and the Executive Leadership Team (ELT). Annual plans and budgets including KPIs are set for all operating companies. Consequently, Quarterly and Monthly Business Reviews (QBRs and MBRs) between the Executive Board and the management teams of our operating companies are held. In these meetings, both the financial and non-financial performance is discussed and where necessary improvement plans are agreed upon and progress is actively monitored. As an integral part of QBRs, forecasts and related risks and opportunities of these plans are specifically addressed.
Principal risks and opportunities
Executive Board / Audit Committee / Supervisory Board
Guidelines 3rd line of defence
Internal Audit1st line of defence
Management control
Internal Controls
2nd line of defence
Financial controlQuality
Self-assessmentsCompliance
Core Values
Key Behaviours
Business Principles
Guidelines
External Audit & Regulators
Vision
Mission

SustainabilityAbout us Financial Review, Risk &
Governance
Report of the Supervisory Board
Financial statements
Other information
Our marketplaceWelcome
55Wessanen Integrated Annual Report 2017
REPORT OF THE EXCECUTIVE BOARD
Additionally, our policies and procedures including controls should ensure that on a daily basis our key processes, such as purchasing, sales, tax and financial reporting operate as intended.
Process owners and control testers of these processes in our operating companies and at head office actively assess the effectiveness of their internal controls by performing ongoing reviews which are recorded and documented in a designated tool. This assessment also includes entity-wide controls and general IT controls. Any improvement points are to be addressed by an action plan. Both the assessments and the potential action plans for identified issues are reviewed by Internal Audit. Internal Audit reports to the Executive Board and Audit Committee about the progress of the tests, the outcome and the action plans on a quarterly basis.
The quality departments within Wessanen address food related risks throughout the entire supply chain. The team reports any issues to the Organic Expertise Centre to ensure issues are analysed and proper actions are taken to resolve the issues and prevent them from happening again.
At least annually the Executive Board assesses risks and opportunities based on input from senior management. These risks relate to strategy, operations, finance, and compliance, and includes a review of fraud risk too. Identified risks are periodically assessed on vulnerability and potential impact and where deemed necessary action plans are defined and follow-up is monitored.
Risk response and appetiteOur response to risks identified are categorised along four types: Terminate, Treat, Transfer and Tolerate. They also reflect the risk appetite, i.e. the willingness to take risks.
The lowest risk appetite often results in a response to Terminate the risk. However, when doing business we take risks but take
them carefully, in other words we mitigate or reduce risks (Treat). Sometimes we choose to Transfer risks partly to other parties. For instance, the financial risks related to a fire in our factory are insured. Finally, there is an option to accept risks (Tolerate)
as we deem the risk and impact low or we cannot influence a certain risk.
Below we show our risk appetite per category.
Category Generic risk response and appetite
Strategy – longer term objectivesAs part of our multi-year strategy, we are developing new and growing existing products, and we are extending our customer-base, channels and markets in line with our strategic objectives.
Treat We take risks when doing business but we take them carefully. Our planning and control processes and procedures support our decisions. They should also give us the right information on the Key Performance Indicators (KPIs) set, to take timely action in case the outcome of our decision is not in line with our plans. As one of our strategic pillars specifically focuses on building a green, attractive and efficient company we ensure that our activities are aligned with our sustainability goals.
Operational activities – shorter term objectivesImproving and maintaining operations effectively and efficiently is an ongoing activity. By making it one of our strategic pillars, we are highlighting its importance for the long-term success of our organisation.
Treat We take risks when doing business but we take them carefully. Our planning and control processes and procedures support our decisions.
Financial positionThis category relates to risks and uncertainties with respect to our financial position (e.g. foreign exchange risk, currency risk, interest rate risk and uncertainties in acquiring financing).
Treat / Terminate
In order to be able to achieve our goals we take decisions that may affect our financial position. However, we have strict policies and procedures including KPIs, part of which are also formally determined by the covenants agreed with the banks.
Financial reportingThis category relates to accurate and transparent reporting, complying with IFRS, as well as following internal policies and procedures to ensure consistent and accurate reporting in order to support decision making processes and to create the right level of transparency to our stakeholders.
Terminate We do not allow issues here, we simply want to and have to comply with the rules. Hence, our risk appetite is nil.
Rules and regulationsThis category relates to complying with (inter)national laws and regulations, both general and business specific rules, such as those related to food quality and safety. It is the basis of good governance, but it also has a high strategic relevance.
Terminate We do not allow issues here, we simply want to and have to comply with the rules. Hence, our risk appetite is nil.
Principal risks and opportunities

SustainabilityAbout us Financial Review, Risk &
Governance
Report of the Supervisory Board
Financial statements
Other information
Our marketplaceWelcome
56Wessanen Integrated Annual Report 2017
1
3
2
REPORT OF THE EXCECUTIVE BOARD
Top risksAs a result of risk management sessions and ongoing assessments of our risks (through ICF testing and QBRs) we have identified the three top risks. In our definition these risks score relatively higher on vulnerability and potential impact than other risks identified. Although risks may have a negative connotation, adequately dealing with them could enable us in reaching our strategic objectives. Hence, they can be seen as opportunities as well. We also refer to the Sustainability chapter where we discuss in more detail how we manage environmental, social, human rights and anti-corruption challenges and how that relates to our overall strategy.
Food safety, food quality and integrity in the food chain. Controlling risks related to food safety and quality are of utmost importance to our Company. Customers and consumers need to fully trust the quality and safety of our products. This relates not just to the safety of our consumers but also to fraud, for example with ingredients. Although we can control our own risks, we may be affected by issues that occur outside of our control. In case our operations remain flawless and consumers see us as a good and trustworthy alternative, the risk becomes an opportunity with positive effect on our organisation. If issues or scandals happen within the arena we operate in (organic products) it could also damage our reputation. We have strict policies and procedures ensuring we prevent issues from happening, and detect risks as quickly as possible. One of the initiatives we started in 2017 to further improve the control over our food chain is to increase the transparency of our raw material sourcing.
Effective and efficient supply chain An effective and efficient supply chain is another important element of doing business successfully. In this respect our main suppliers have a strategic position: they cooperate with us in the innovation process and they should deliver goods without any issues. As a consequence, we ensure there is an intense relationship with them and monitor the quality of their services continuously. We secure our position by clear contractual agreements with the suppliers and we tender where deemed necessary. We may also decide to insource the production in order to avoid being too dependent on a specific supplier. In 2017 we have completed a number of such projects.
Internally we also have the challenge to run our processes efficiently. Smooth and lean supply chain helps us serving our customers in the best way possible. We continuously run projects to improve them and IT plays a major role in these initiatives. This year we have worked hard on centrally driven improvement projects and more specifically in Germany (introducing the new Logistic Service Supplier) and UK (SAP roll-out in our Beaminster based tea factory). More information on Operations on page 18.
A more comprehensive list of key risks and opportunities has been included on pages 58-64.
Principal risks and opportunities
Innovation to create revenue growthWessanen operates in a competitive market, which implies that innovation is a key driver for long-term success. We see that conventional food companies, new entrants as well as private label are entering the attractive (niche) markets. Innovations which we are able to bring to the market successfully and quickly should secure or even improve the good position of our brands, without compromising our impeccable standards. With our Innovation Boards we coordinate and evaluate innovation projects in order to improve on an ongoing basis. In 2017 we have been strengthening the international leverage of our business.

SustainabilityAbout us Financial Review, Risk &
Governance
Report of the Supervisory Board
Financial statements
Other information
Our marketplaceWelcome
57Wessanen Integrated Annual Report 2017
REPORT OF THE EXCECUTIVE BOARD
Wessanen’s risk profile and main developments in 20171. Having all our businesses on the same ERP platform (SAP)
creates consistency and reduces complexity and also this year we have integrated parts of our processes into SAP. Examples are the Clipper tea factory in Beaminster (UK) and moving to one Human resources platform (SuccessFactors).
2. From an internal control perspective we have been able to further reduce the segregation of duty risks in SAP. For all remaining key risks we tested in detail whether it may have resulted in any issues, in terms of unauthorised transactions done or even fraud. Although we still see room for improvement, we have not found any issues. Additionally, we have tested in detail that remaining risks are strongly mitigated by compensating controls.
3. We are implementing the implications of the EU General Data Protection Regulation (GDPR). A side effect of this project is that we are improving various processes and strengthening internal controls at the same time, such as setting stricter policies for access rights, better retention procedures and improved (personal) data protection processes.
4. In November 2017 we have kicked off Project Blooming which is a programme to identify opportunities to harmonise, digitalise and improve efficiency and effectiveness of our business processes., such as in our supply chain and new product development. Through business process mapping we are getting detailed insights in our 11 key processes. In the first half of 2018 we will complete the assessments of the current set-up. Next, we will start defining and implementing improvement projects.
Management Letter 2017: main conclusions and status As part of their financial statement audit, our External Auditor shared their observations and recommendations on Wessanen’s systems of internal control. More specifically, their test procedures focused on relevant controls that address the significant risks of any material error or omission in Wessanen’s financial reporting in the following business processes and control areas:
Components of Internal Control (COSO based)
– Control Environment– Wessanen’s Risk Assessment Process– Control activities – The information system relevant to
financial reporting and communication – Monitoring controls
Process Controls at component level and corporate functions
– Transactional and monitoring controls within: Sales, Purchasing and Financial reporting
– Corporate functions (financial accounting and control)
IT Control Environment
– Follow-up on previously reported findings – Mitigating controls to address segregation
of duty conflicts– System generated information
The following observations are the main management letter issues reported by our External Auditor in 2017. These items were also identified in the Wessanen control self-assessments.
The auditor concluded that: – Wessanen’s system of internal control has strengthened, is considered fit for purpose and Wessanen has full visibility over the areas with scope for improvement or which
require further remediation. Ongoing initiatives such as implementing the master data workflow tool (WinShuttle), project Blooming and solving remaining segregation of duty (SoD) conflicts will further strengthen the effectiveness of Wessanen’s system of internal controls.
– With respect to process controls at the level of Wessanen’s operating units and corporate functions we observed a similar picture as reported in previous year. This means that no material weaknesses have been found. In case of ineffective controls we were able to identify and test satisfactorily compensating controls or, in some cases, design alternative procedures to address the associated risks.
Improvement plan for 2018As part of our programme to continuously improve our internalcontrol framework we have initiated the following projects:
1. Continuation of Project Blooming that entails standardising and improving our processes where possible, in order to create more effective and efficient operations;
2. Complete integration of Biogran and Ineobio;3. Finalise the project to resolve the remaining SoD issues
(‘Get Clean’) and roll out a Stay Clean process that ensures no new conflicts will emerge; and
4. Completion of the project to improve master data management by means of a work flow system (WinShuttle);
Principal risks and opportunities
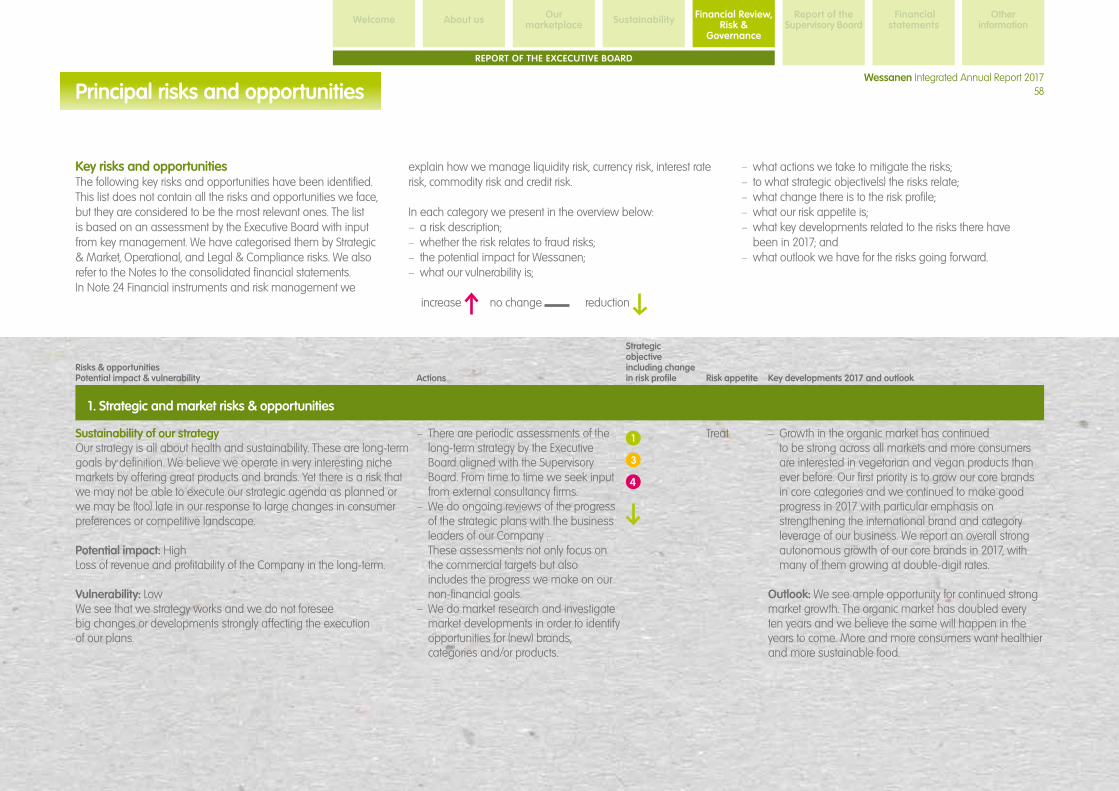
SustainabilityAbout us Financial Review, Risk &
Governance
Report of the Supervisory Board
Financial statements
Other information
Our marketplaceWelcome
58Wessanen Integrated Annual Report 2017
REPORT OF THE EXCECUTIVE BOARD
Risks & opportunities Potential impact & vulnerability Actions
Strategic objectiveincluding change in risk profile Risk appetite Key developments 2017 and outlook
1. Strategic and market risks & opportunities
Sustainability of our strategyOur strategy is all about health and sustainability. These are long-term goals by definition. We believe we operate in very interesting niche markets by offering great products and brands. Yet there is a risk that we may not be able to execute our strategic agenda as planned or we may be (too) late in our response to large changes in consumer preferences or competitive landscape.
Potential impact: High Loss of revenue and profitability of the Company in the long-term.
Vulnerability: Low We see that we strategy works and we do not foresee big changes or developments strongly affecting the execution of our plans.
– There are periodic assessments of the long-term strategy by the Executive Board aligned with the Supervisory Board. From time to time we seek input from external consultancy firms.
– We do ongoing reviews of the progress of the strategic plans with the business leaders of our Company . These assessments not only focus on the commercial targets but also includes the progress we make on our non-financial goals.
– We do market research and investigate market developments in order to identify opportunities for (new) brands, categories and/or products.
Treat
– Growth in the organic market has continued to be strong across all markets and more consumers are interested in vegetarian and vegan products than ever before. Our first priority is to grow our core brands in core categories and we continued to make good progress in 2017 with particular emphasis on strengthening the international brand and category leverage of our business. We report an overall strong autonomous growth of our core brands in 2017, with many of them growing at double-digit rates.
Outlook: We see ample opportunity for continued strong market growth. The organic market has doubled every ten years and we believe the same will happen in the years to come. More and more consumers want healthier and more sustainable food.
Key risks and opportunitiesThe following key risks and opportunities have been identified. This list does not contain all the risks and opportunities we face, but they are considered to be the most relevant ones. The list is based on an assessment by the Executive Board with input from key management. We have categorised them by Strategic & Market, Operational, and Legal & Compliance risks. We also refer to the Notes to the consolidated financial statements. In Note 24 Financial instruments and risk management we
explain how we manage liquidity risk, currency risk, interest rate risk, commodity risk and credit risk.
In each category we present in the overview below: – a risk description; – whether the risk relates to fraud risks; – the potential impact for Wessanen; – what our vulnerability is;
– what actions we take to mitigate the risks; – to what strategic objective(s) the risks relate; – what change there is to the risk profile; – what our risk appetite is; – what key developments related to the risks there have been in 2017; and
– what outlook we have for the risks going forward.
Principal risks and opportunities
increase no change reduction

SustainabilityAbout us Financial Review, Risk &
Governance
Report of the Supervisory Board
Financial statements
Other information
Our marketplaceWelcome
59Wessanen Integrated Annual Report 2017
REPORT OF THE EXCECUTIVE BOARD
Risks & opportunities Potential impact & vulnerability Actions
Strategic objectiveincluding change in risk profile Risk appetite Key developments 2017 and outlook
Increased competition from new entrants and private labelOperating in interesting markets may attract new entrants to the market, such as conventional food companies or private label.
Potential impact: MediumOn one hand this means more attention for the area we work in. On the other hand it could result in increased pressure on our market share, availability of organic raw materials and potentially affect our revenue and sales margins.
Vulnerability: MediumSome of our competitors are much bigger than we are. However, we focus on our own strengths which have proven to work.
– Being in a branded business, we focus on our own core brands by creating products that our consumers believe in and love.
– Marketing spend on our core brands, categories and products.
– We offer products for a fair but competitive price without compromising the integrity of our strategy.
– We perform external scans to identify latest developments which are also input to innovations.
Treat and Tolerate
– We continued to invest in marketing to build our core brands and strengthen their positions in our markets.
– We are strengthening our innovate to market power through cross-functional European Category Teams (ECTs), which includes Marketing, Sales and R&D.
– We are offering new products and brands in existing and new channels across Europe (e.g. Whole Earth peanut butter in the Netherlands, Clipper in the drugstores in Germany and Zonnatura in Belgium). Outlook: We expect to get more competition, but we are well prepared by continuing to offer great brands and (new) products and find new markets to operate in.
Innovation to create revenue growth In order to realise long-term growth through innovation power we rely to a large extent on our internal competencies and capacity. However, we are also dependent on our key suppliers and our position with them.
Potential Impact: HighNot being able to introduce successful innovations could lead to a soften revenue growth or decline.
Vulnerability: MediumAlthough we have our own R&D departments and factories we are dependent on the relationships with our main suppliers. Switching suppliers or insourcing may not always be easy or could be expensive.
– Well planned product innovation, renovation and activation in core brands and categories to keep and to grow our unique position in the market.
– Building strong relationships with our key suppliers in order to jointly come to new innovations.
– Strengthening the link between R&D and market facing ECTs.
– Successful products are introduced under key brands in other countries and where necessary adjusted to local preferences.
– The success of innovations and product improvement projects are evaluated through our Innovation Boards.
Treat – We have launched key innovations for our brands such as Bjorg and Clipper and in our core categories. Not all innovations are successful. We analyse the root causes of those in the Innovation Boards to learn for future innovations. Outlook: We should further benefit from the improvements we are making in our innovation process.
Principal risks and opportunities
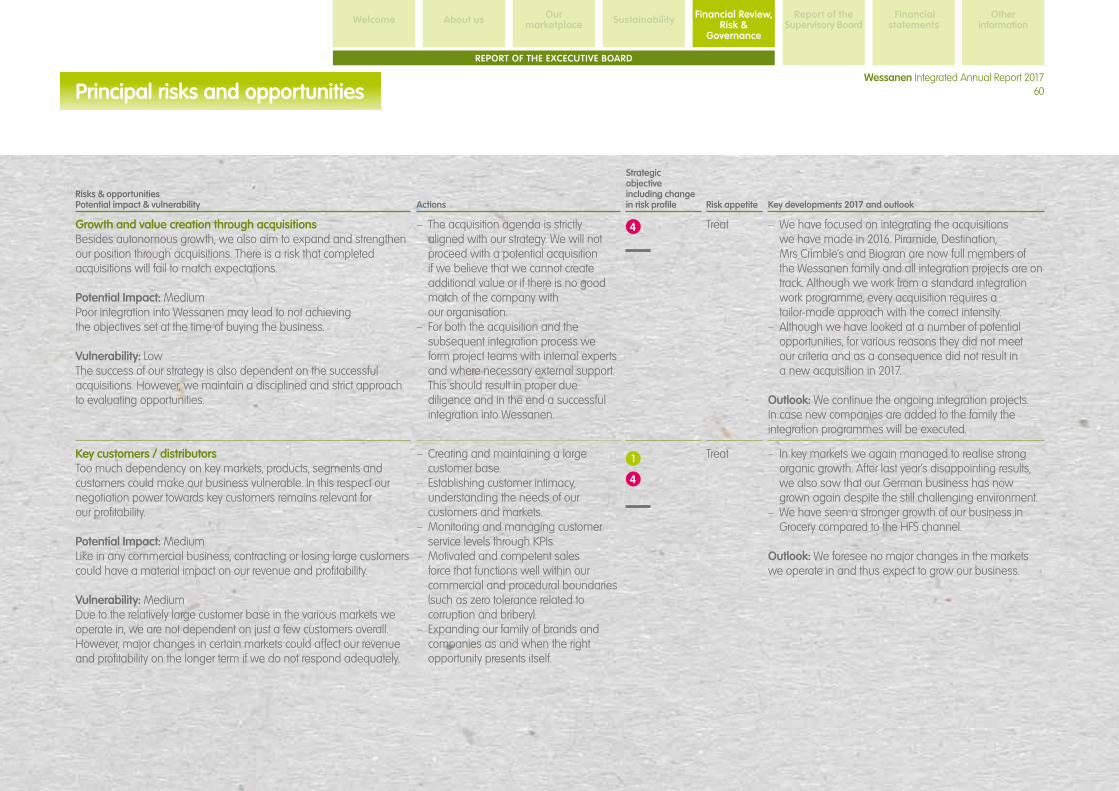
SustainabilityAbout us Financial Review, Risk &
Governance
Report of the Supervisory Board
Financial statements
Other information
Our marketplaceWelcome
60Wessanen Integrated Annual Report 2017
REPORT OF THE EXCECUTIVE BOARD
Risks & opportunities Potential impact & vulnerability Actions
Strategic objectiveincluding change in risk profile Risk appetite Key developments 2017 and outlook
Growth and value creation through acquisitionsBesides autonomous growth, we also aim to expand and strengthen our position through acquisitions. There is a risk that completed acquisitions will fail to match expectations.
Potential Impact: MediumPoor integration into Wessanen may lead to not achieving the objectives set at the time of buying the business.
Vulnerability: LowThe success of our strategy is also dependent on the successful acquisitions. However, we maintain a disciplined and strict approach to evaluating opportunities.
– The acquisition agenda is strictly aligned with our strategy. We will not proceed with a potential acquisition if we believe that we cannot create additional value or if there is no good match of the company with our organisation.
– For both the acquisition and the subsequent integration process we form project teams with internal experts and where necessary external support. This should result in proper due diligence and in the end a successful integration into Wessanen.
Treat – We have focused on integrating the acquisitions we have made in 2016. Piramide, Destination, Mrs Crimble’s and Biogran are now full members of the Wessanen family and all integration projects are on track. Although we work from a standard integration work programme, every acquisition requires a tailor-made approach with the correct intensity.
– Although we have looked at a number of potential opportunities, for various reasons they did not meet our criteria and as a consequence did not result in a new acquisition in 2017.
Outlook: We continue the ongoing integration projects. In case new companies are added to the family the integration programmes will be executed.
Key customers / distributorsToo much dependency on key markets, products, segments and customers could make our business vulnerable. In this respect our negotiation power towards key customers remains relevant for our profitability.
Potential Impact: MediumLike in any commercial business, contracting or losing large customers could have a material impact on our revenue and profitability.
Vulnerability: MediumDue to the relatively large customer base in the various markets we operate in, we are not dependent on just a few customers overall. However, major changes in certain markets could affect our revenue and profitability on the longer term if we do not respond adequately.
– Creating and maintaining a large customer base.
– Establishing customer intimacy, understanding the needs of our customers and markets.
– Monitoring and managing customer service levels through KPIs.
– Motivated and competent sales force that functions well within our commercial and procedural boundaries (such as zero tolerance related to corruption and bribery).
– Expanding our family of brands and companies as and when the right opportunity presents itself.
Treat – In key markets we again managed to realise strong organic growth. After last year’s disappointing results, we also saw that our German business has now grown again despite the still challenging environment.
– We have seen a stronger growth of our business in Grocery compared to the HFS channel.
Outlook: We foresee no major changes in the markets we operate in and thus expect to grow our business.
Principal risks and opportunities
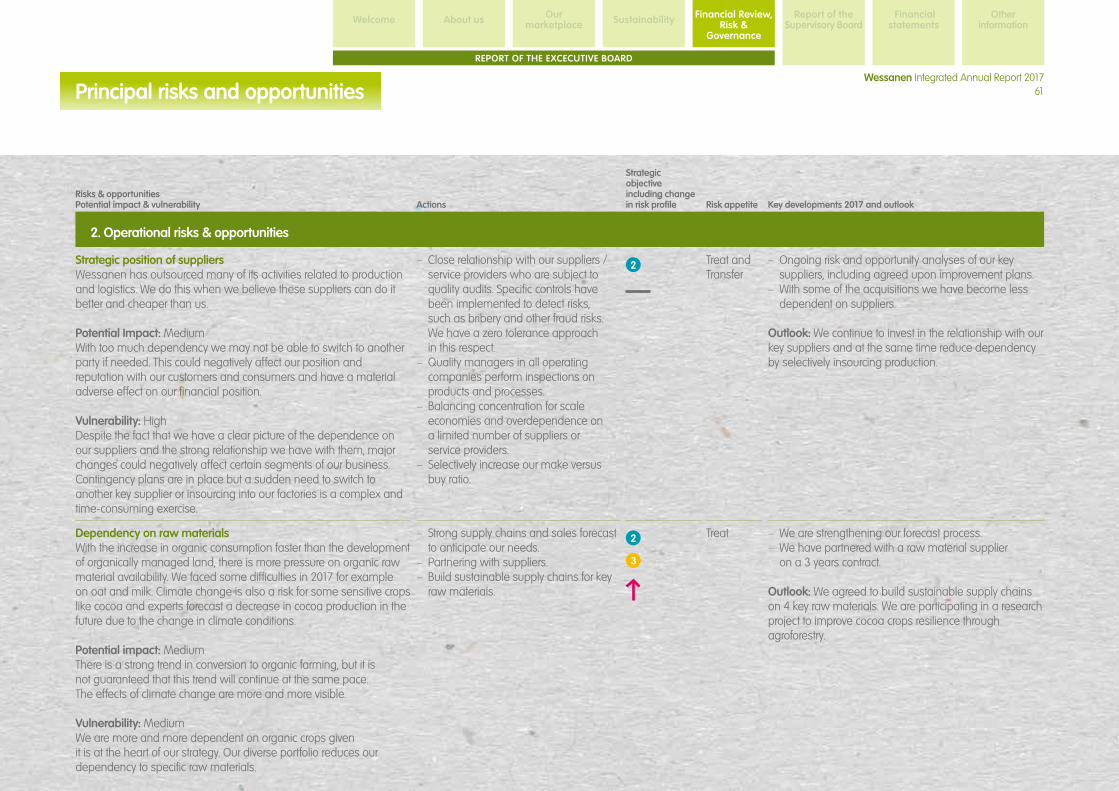
SustainabilityAbout us Financial Review, Risk &
Governance
Report of the Supervisory Board
Financial statements
Other information
Our marketplaceWelcome
61Wessanen Integrated Annual Report 2017
REPORT OF THE EXCECUTIVE BOARD
Risks & opportunities Potential impact & vulnerability Actions
Strategic objectiveincluding change in risk profile Risk appetite Key developments 2017 and outlook
2. Operational risks & opportunities – •
Strategic position of suppliersWessanen has outsourced many of its activities related to production and logistics. We do this when we believe these suppliers can do it better and cheaper than us.
Potential Impact: MediumWith too much dependency we may not be able to switch to another party if needed. This could negatively affect our position and reputation with our customers and consumers and have a material adverse effect on our financial position.
Vulnerability: High Despite the fact that we have a clear picture of the dependence on our suppliers and the strong relationship we have with them, major changes could negatively affect certain segments of our business. Contingency plans are in place but a sudden need to switch to another key supplier or insourcing into our factories is a complex and time-consuming exercise.
– Close relationship with our suppliers / service providers who are subject to quality audits. Specific controls have been implemented to detect risks, such as bribery and other fraud risks. We have a zero tolerance approach in this respect.
– Quality managers in all operating companies perform inspections on products and processes.
– Balancing concentration for scale economies and overdependence on a limited number of suppliers or service providers.
– Selectively increase our make versus buy ratio.
Treat and Transfer
– Ongoing risk and opportunity analyses of our key suppliers, including agreed upon improvement plans.
– With some of the acquisitions we have become less dependent on suppliers.
Outlook: We continue to invest in the relationship with our key suppliers and at the same time reduce dependency by selectively insourcing production.
Dependency on raw materials With the increase in organic consumption faster than the development of organically managed land, there is more pressure on organic raw material availability. We faced some difficulties in 2017 for example on oat and milk. Climate change is also a risk for some sensitive crops like cocoa and experts forecast a decrease in cocoa production in the future due to the change in climate conditions.
Potential impact: MediumThere is a strong trend in conversion to organic farming, but it is not guaranteed that this trend will continue at the same pace. The effects of climate change are more and more visible.
Vulnerability: MediumWe are more and more dependent on organic crops given it is at the heart of our strategy. Our diverse portfolio reduces our dependency to specific raw materials.
– Strong supply chains and sales forecast to anticipate our needs.
– Partnering with suppliers. – Build sustainable supply chains for key raw materials.
Treat – We are strengthening our forecast process. – We have partnered with a raw material supplier on a 3 years contract.
Outlook: We agreed to build sustainable supply chains on 4 key raw materials. We are participating in a research project to improve cocoa crops resilience through agroforestry.
Principal risks and opportunities
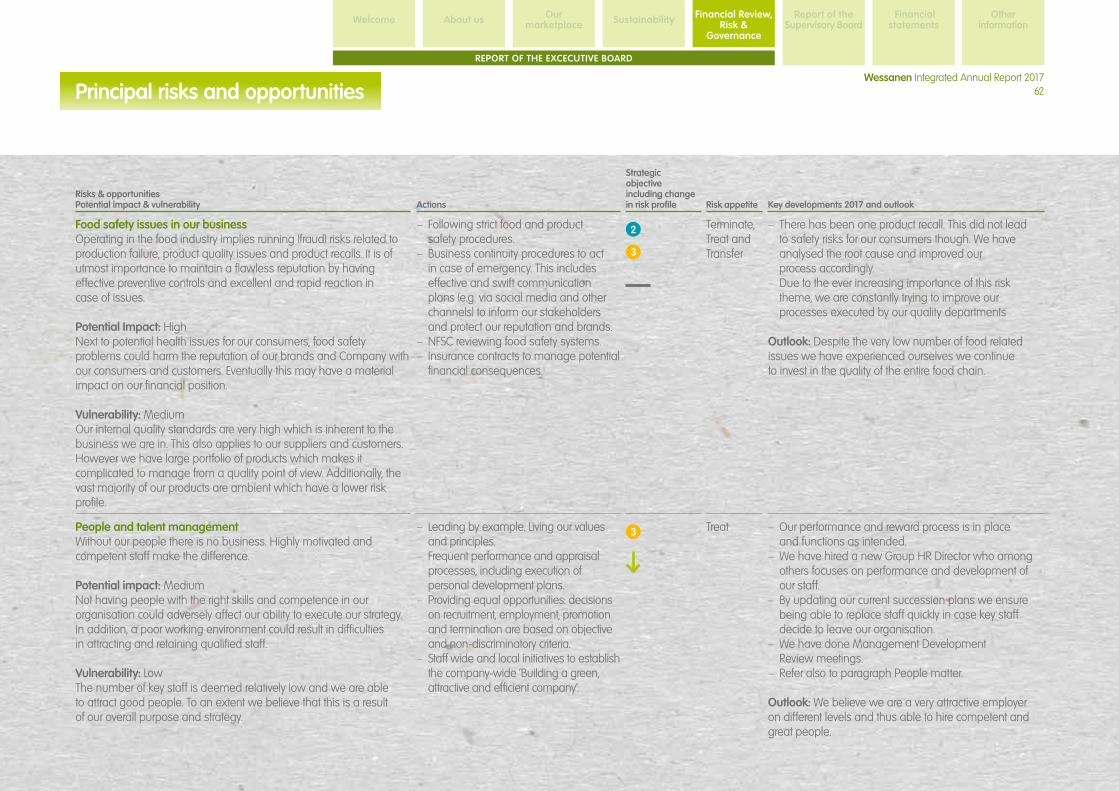
SustainabilityAbout us Financial Review, Risk &
Governance
Report of the Supervisory Board
Financial statements
Other information
Our marketplaceWelcome
62Wessanen Integrated Annual Report 2017
•••
REPORT OF THE EXCECUTIVE BOARD
Principal risks and opportunities
Risks & opportunities Potential impact & vulnerability Actions
Strategic objectiveincluding change in risk profile Risk appetite Key developments 2017 and outlook
Food safety issues in our businessOperating in the food industry implies running (fraud) risks related to production failure, product quality issues and product recalls. It is of utmost importance to maintain a flawless reputation by having effective preventive controls and excellent and rapid reaction in case of issues.
Potential Impact: HighNext to potential health issues for our consumers, food safety problems could harm the reputation of our brands and Company with our consumers and customers. Eventually this may have a material impact on our financial position.
Vulnerability: MediumOur internal quality standards are very high which is inherent to the business we are in. This also applies to our suppliers and customers. However we have large portfolio of products which makes it complicated to manage from a quality point of view. Additionally, the vast majority of our products are ambient which have a lower risk profile.
– Following strict food and product safety procedures.
– Business continuity procedures to act in case of emergency. This includes effective and swift communication plans (e.g. via social media and other channels) to inform our stakeholders and protect our reputation and brands.
– NFSC reviewing food safety systems. – Insurance contracts to manage potential financial consequences.
Terminate,Treat and Transfer
– There has been one product recall. This did not lead to safety risks for our consumers though. We have analysed the root cause and improved our process accordingly.
– Due to the ever increasing importance of this risk theme, we are constantly trying to improve our processes executed by our quality departments
Outlook: Despite the very low number of food related issues we have experienced ourselves we continue to invest in the quality of the entire food chain.
People and talent managementWithout our people there is no business. Highly motivated and competent staff make the difference.
Potential impact: MediumNot having people with the right skills and competence in our organisation could adversely affect our ability to execute our strategy. In addition, a poor working environment could result in difficulties in attracting and retaining qualified staff.
Vulnerability: LowThe number of key staff is deemed relatively low and we are able to attract good people. To an extent we believe that this is a result of our overall purpose and strategy.
– Leading by example. Living our values and principles.
– Frequent performance and appraisal processes, including execution of personal development plans.
– Providing equal opportunities: decisions on recruitment, employment, promotion and termination are based on objective and non-discriminatory criteria.
– Staff wide and local initiatives to establish the company-wide ‘Building a green, attractive and efficient company’.
Treat – Our performance and reward process is in place and functions as intended.
– We have hired a new Group HR Director who among others focuses on performance and development of our staff.
– By updating our current succession plans we ensure being able to replace staff quickly in case key staff decide to leave our organisation.
– We have done Management Development Review meetings.
– Refer also to paragraph People matter.
Outlook: We believe we are a very attractive employer on different levels and thus able to hire competent and great people.
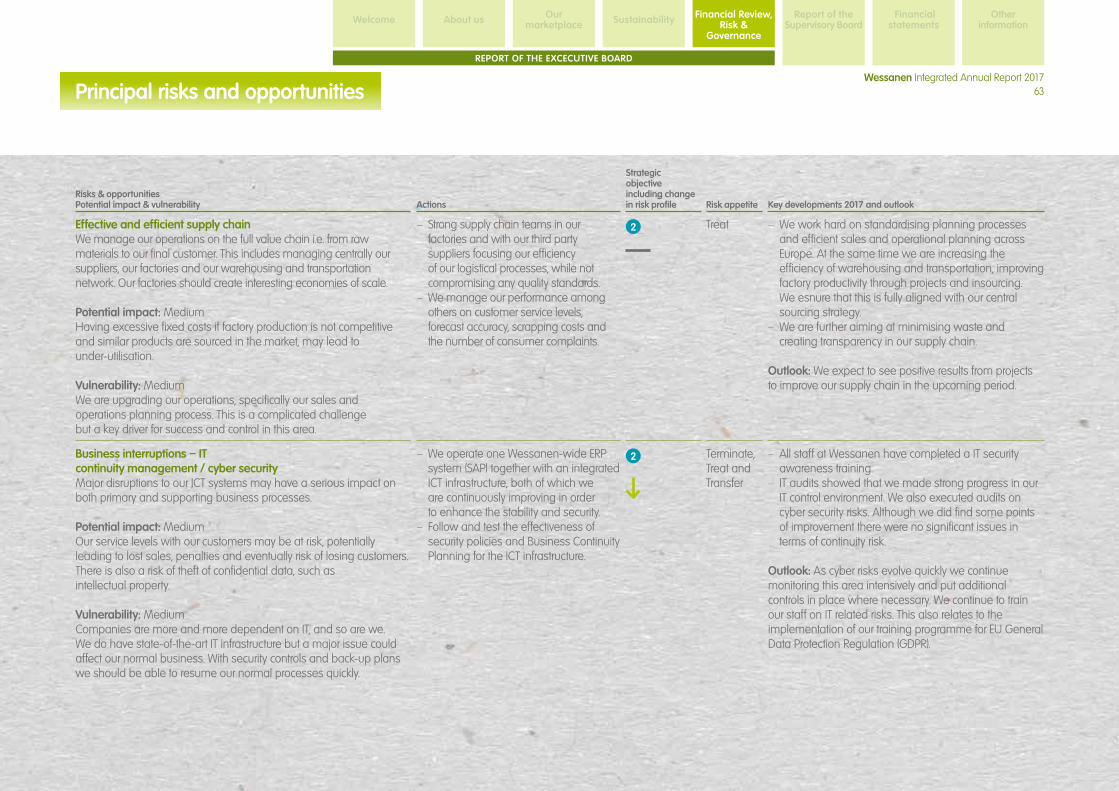
SustainabilityAbout us Financial Review, Risk &
Governance
Report of the Supervisory Board
Financial statements
Other information
Our marketplaceWelcome
63Wessanen Integrated Annual Report 2017
REPORT OF THE EXCECUTIVE BOARD
Principal risks and opportunities
Risks & opportunities Potential impact & vulnerability Actions
Strategic objectiveincluding change in risk profile Risk appetite Key developments 2017 and outlook
Effective and efficient supply chain We manage our operations on the full value chain i.e. from raw materials to our final customer. This includes managing centrally our suppliers, our factories and our warehousing and transportation network. Our factories should create interesting economies of scale.
Potential impact: MediumHaving excessive fixed costs if factory production is not competitive and similar products are sourced in the market, may lead to under-utilisation.
Vulnerability: MediumWe are upgrading our operations, specifically our sales and operations planning process. This is a complicated challenge but a key driver for success and control in this area.
– Strong supply chain teams in our factories and with our third party suppliers focusing our efficiency of our logistical processes, while not compromising any quality standards.
– We manage our performance among others on customer service levels, forecast accuracy, scrapping costs and the number of consumer complaints.
Treat – We work hard on standardising planning processes and efficient sales and operational planning across Europe. At the same time we are increasing the efficiency of warehousing and transportation, improving factory productivity through projects and insourcing. We esnure that this is fully aligned with our central sourcing strategy.
– We are further aiming at minimising waste and creating transparency in our supply chain.
Outlook: We expect to see positive results from projects to improve our supply chain in the upcoming period.
Business interruptions – ITcontinuity management / cyber security Major disruptions to our ICT systems may have a serious impact on both primary and supporting business processes.
Potential impact: MediumOur service levels with our customers may be at risk, potentially leading to lost sales, penalties and eventually risk of losing customers. There is also a risk of theft of confidential data, such as intellectual property.
Vulnerability: MediumCompanies are more and more dependent on IT, and so are we. We do have state-of-the-art IT infrastructure but a major issue could affect our normal business. With security controls and back-up plans we should be able to resume our normal processes quickly.
– We operate one Wessanen-wide ERP system (SAP) together with an integrated ICT infrastructure, both of which we are continuously improving in order to enhance the stability and security.
– Follow and test the effectiveness of security policies and Business Continuity Planning for the ICT infrastructure.
Terminate, Treat and Transfer
– All staff at Wessanen have completed a IT security awareness training.
– IT audits showed that we made strong progress in our IT control environment. We also executed audits on cyber security risks. Although we did find some points of improvement there were no significant issues in terms of continuity risk.
Outlook: As cyber risks evolve quickly we continue monitoring this area intensively and put additional controls in place where necessary. We continue to train our staff on IT related risks. This also relates to the implementation of our training programme for EU General Data Protection Regulation (GDPR).
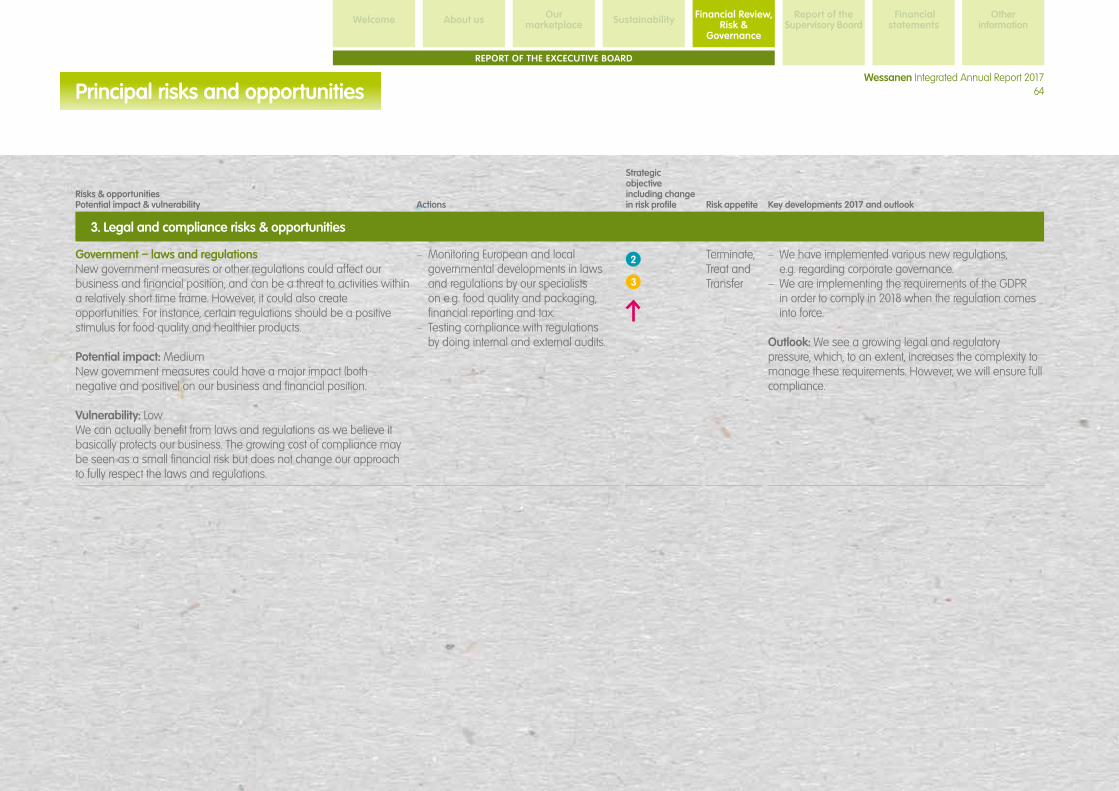
SustainabilityAbout us Financial Review, Risk &
Governance
Report of the Supervisory Board
Financial statements
Other information
Our marketplaceWelcome
64Wessanen Integrated Annual Report 2017
REPORT OF THE EXCECUTIVE BOARD
Principal risks and opportunities
Risks & opportunities Potential impact & vulnerability Actions
Strategic objectiveincluding change in risk profile Risk appetite Key developments 2017 and outlook
3. Legal and compliance risks & opportunities
Government – laws and regulations New government measures or other regulations could affect our business and financial position, and can be a threat to activities within a relatively short time frame. However, it could also create opportunities. For instance, certain regulations should be a positive stimulus for food quality and healthier products.
Potential impact: MediumNew government measures could have a major impact (both negative and positive) on our business and financial position.
Vulnerability: LowWe can actually benefit from laws and regulations as we believe it basically protects our business. The growing cost of compliance may be seen as a small financial risk but does not change our approach to fully respect the laws and regulations.
– Monitoring European and local governmental developments in laws and regulations by our specialists on e.g. food quality and packaging, financial reporting and tax.
– Testing compliance with regulations by doing internal and external audits.
Terminate, Treat and Transfer
– We have implemented various new regulations, e.g. regarding corporate governance.
– We are implementing the requirements of the GDPR in order to comply in 2018 when the regulation comes into force.
Outlook: We see a growing legal and regulatory pressure, which, to an extent, increases the complexity to manage these requirements. However, we will ensure full compliance.
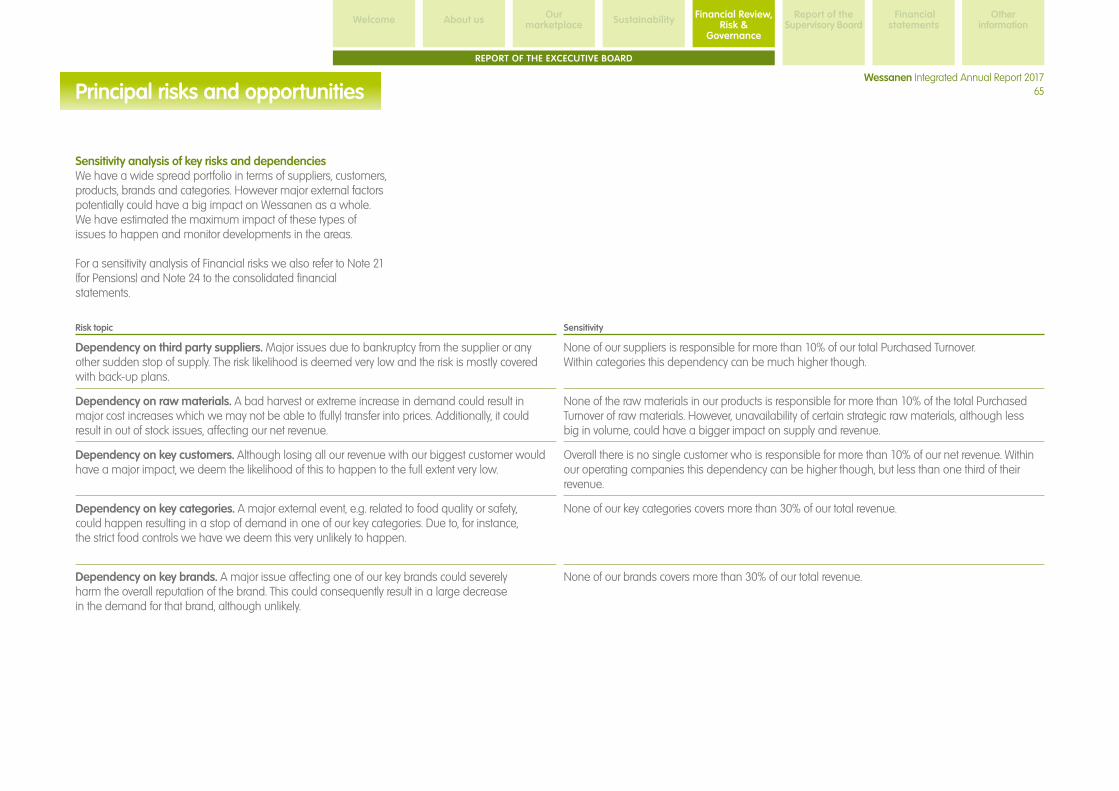
Principal risks and opportunities
SustainabilityAbout us Financial Review, Risk &
Governance
Report of the Supervisory Board
Financial statements
Other information
Our marketplaceWelcome
65Wessanen Integrated Annual Report 2017
REPORT OF THE EXCECUTIVE BOARD
Sensitivity analysis of key risks and dependenciesWe have a wide spread portfolio in terms of suppliers, customers, products, brands and categories. However major external factors potentially could have a big impact on Wessanen as a whole. We have estimated the maximum impact of these types of issues to happen and monitor developments in the areas.
For a sensitivity analysis of Financial risks we also refer to Note 21 (for Pensions) and Note 24 to the consolidated financialstatements.
Risk topic Sensitivity
Dependency on third party suppliers. Major issues due to bankruptcy from the supplier or any other sudden stop of supply. The risk likelihood is deemed very low and the risk is mostly covered with back-up plans.
None of our suppliers is responsible for more than 10% of our total Purchased Turnover. Within categories this dependency can be much higher though.
Dependency on raw materials. A bad harvest or extreme increase in demand could result in major cost increases which we may not be able to (fully) transfer into prices. Additionally, it could result in out of stock issues, affecting our net revenue.
None of the raw materials in our products is responsible for more than 10% of the total Purchased Turnover of raw materials. However, unavailability of certain strategic raw materials, although less big in volume, could have a bigger impact on supply and revenue.
Dependency on key customers. Although losing all our revenue with our biggest customer would have a major impact, we deem the likelihood of this to happen to the full extent very low.
Overall there is no single customer who is responsible for more than 10% of our net revenue. Within our operating companies this dependency can be higher though, but less than one third of their revenue.
Dependency on key categories. A major external event, e.g. related to food quality or safety, could happen resulting in a stop of demand in one of our key categories. Due to, for instance, the strict food controls we have we deem this very unlikely to happen.
None of our key categories covers more than 30% of our total revenue.
Dependency on key brands. A major issue affecting one of our key brands could severely harm the overall reputation of the brand. This could consequently result in a large decrease in the demand for that brand, although unlikely.
None of our brands covers more than 30% of our total revenue.

SustainabilityAbout us Financial Review, Risk &
Governance
Report of the Supervisory Board
Financial statements
Other information
Our marketplaceWelcome
66Wessanen Integrated Annual Report 2017
REPORT OF THE EXCECUTIVE BOARD
Corporate governance structure WessanenWessanen is a public limited liability company, incorporated under Dutch Law. Wessanen is listed at the Euronext Amsterdam stock exchange.
Wessanen has a two-tier board structure consisting of the Executive Board and an independent Supervisory Board, which are both accountable to the General Meeting of Shareholders for the performance of their duties. In this two-tier corporate structure the Supervisory Board is a separate body that is independent of the Executive Board.
Wessanen’s corporate governance structure is based on the articles of association, the Dutch Civil Code, the Corporate Governance Code and the applicable securities laws. Substantial changes to Wessanen’s corporate governance structure will be submitted to the General Meeting of Shareholders for discussion.
The Executive BoardThe responsibility for the day-to-day management and general affairs of Wessanen is vested collectively with the Executive Board. Accountabilities include, but are not limited to, determining and deploying Wessanen’s strategy and policies, achieving its objectives and results, risk management, control, financing and developing a sound personnel policy. The Executive Board is responsible for the continuity of the company and its affiliated enterprise. It focuses on long-term value creation for the company and its affiliated enterprise, and takes into account the stakeholder interests that are relevant in this context. The Supervisory Board monitors the Executive Board in this.
The Executive Board is accountable for the performance of its assignment to the Supervisory Board and to the General Meeting of Shareholders. In discharging its duty, the Executive Board focuses on the interests of Wessanen, taking into consideration the interests of its shareholders and other capital
providers, employees, customers and suppliers. The members of the Executive Board are appointed by the General Meeting of Shareholders. The full procedure of appointment and dismissal of members of the Executive Board is set out in articles 15 and 16 of Wessanen’s Articles of Association.
Members of the Executive Board are appointed for a term of four years. The composition of the Executive Board, its performance as well as the performance of individual members of the Executive Board are reviewed annually by the Supervisory Board. The remuneration of the members of the Executive Board is proposed by the Supervisory Board based on the advice of the Selection, Appointment and Remuneration Committee (SARC) and presented by the Supervisory Board to the General Meeting of Shareholders for adoption.
The Supervisory BoardThe Supervisory Board should supervise the manner in which the management board implements the long-term value creation strategy. The Supervisory Board should regularly discuss the strategy, the implementation of the strategy and the principal risks associated with it. In doing so, the Supervisory Board is guided by the interests of Wessanen and the relevant interests of its stakeholders. Major decisions and the Group’s strategy are discussed with and require the approval from the Supervisory Board. The Supervisory Board should supervise the policies carried out by the Executive Board and the general affairs of the Company and its affiliated enterprise. In so doing, the Supervisory Board should also focus on the effectiveness of the Company’s internal risk management and control systems and the integrity and quality of the financial reporting.
The members of the Supervisory Board are appointed by the General Meeting of Shareholders for a term of four years and may, further to the Dutch Corporate Governance Code dated 8 December 2016, in principle serve a maximum of two terms of four years. The full procedure of appointment and dismissal of members of the Supervisory Board is set out in article 23 of
Wessanen’s Articles of Association. The General Meeting of Shareholders determines the remuneration of the Supervisory Board members.
Committees of the Supervisory BoardThe Supervisory Board, while retaining overall responsibility, has delegated certain tasks to the Audit Committee, the SARC and the Nutrition, Food Safety and Sustainability Committee (NFSC). The main purpose of these Committees is to prepare the foundations that support the decision-making processes of the Supervisory Board.
The Audit Committee assists the Supervisory Board in fulfilling its supervising responsibilities in relation to inter alia Wessanen’s accounting and financial reporting practice, policies and procedures, the operation of internal risk management and control systems and the performance and evaluation of the Internal Audit department and the External Auditor.
The SARC is responsible for, amongst other things, establishing policies for the remuneration of the members of the Executive Board and Wessanen’s top management, making proposals for the remuneration of individual Executive Board Members and assessing the composition and performance of the Executive Board and Supervisory Board and advising on selection criteria and appointment procedures.
The NFSC supports and advises the Executive Board in fulfilling its responsibility to ensure that Wessanen’s nutritional policies are relevant to its business and are scientifically supported and that Wessanen operates in a sustainable way.
The Supervisory Board’s profile, size and composition, which are reviewed at least once a year, reflect the expertise required to supervise Wessanen’s activities.
Corporate Governance Report
SustainabilityAbout us Financial Review, Risk &
Governance
Report of the Supervisory Board
Financial statements
Other information
Our marketplaceWelcome
67Wessanen Integrated Annual Report 2017
REPORT OF THE EXCECUTIVE BOARD
Conflict of interestIn compliance with the Code, the By-Laws of the Supervisory Board and Executive Board have formalised strict rules to avoid conflicts of interests between Wessanen on the one hand and the individual members of the Executive Board and Supervisory Board on the other hand.
Decisions to engage in transactions in which interests of members of the Executive Board and Supervisory Board play a role, which have a material significance for Wessanen or for the Board member concerned, require approval by the Supervisory Board and conflicted members of the Executive Board and Supervisory Board may not participate in deliberating or decision-making, if with respect to the matter concerned he has a direct or indirect personal interest that conflicts with the interests of the Company and the business connected with it.
The Supervisory Board is responsible for taking decisions on handling conflicts of interest between Wessanen and the members of the Executive Board and Supervisory Board.
No conflicts of interest were reported in 2017.
The General Meeting of Shareholders At least once a year a General Meeting of Shareholders will be held. The agenda of the Annual General Meeting of Shareholders shall at least contain the report of the Executive Board, the adoption of the financial statements, including the appropriation of the results, the proposal to distribute dividends and the proposal to discharge the members of the Executive Board and Supervisory Board. Shareholders, who, alone or jointly, represent at least 1% of Wessanen’s issued capital or a block of shares, alone or jointly, at least worth 50 million euro (€50,000,000) shall have the right to request the Executive Board or the Supervisory Board that items be placed on the agenda of the General Meeting of Shareholders.
The General Meetings of Shareholders shall be convened by public notice given by the Supervisory Board or the Executive Board, which can be found on Wessanen’s website https://wessanen.com/en/corporate-governance/shareholders/agm-agenda-and-minutes/. The notice convening the meeting shall be given no later than the 42nd day prior to the date of the meeting and shall specify the subjects to be discussed.
Resolutions of General Meeting of Shareholders; Appointment of Executive Board and Supervisory BoardResolutions of the General Meeting of Shareholders shall be passed on the basis of an absolute majority of votes cast, unless a greater majority is required by law or by the Articles of Association. The appointment of members of the Executive Board and of the Supervisory Board shall be made following a non-binding nomination by the Supervisory Board. A resolution of the General Meeting of Shareholders to approve an appointment in accordance with a nomination by the Supervisory Board requires an absolute majority of the votes cast. In the event of a candidate nominated by the Supervisory Board not being appointed by the General Meeting of Shareholders, the Supervisory Board will nominate a new candidate.Shareholders who have the right to place an item on the agenda of the General Meeting of Shareholders are also entitled to nominate a candidate. A resolution of the General Meeting to appoint a member of the Executive Board or of the Supervisory Board other than in accordance with a nomination by the Supervisory Board requires an absolute majority of the votes cast representing more than one-third of the issued capital. At a General Meeting of Shareholders, votes can only be cast for candidates named in the agenda or explanatory notes of the meeting. Similarly, a resolution of the General Meeting of Shareholders to suspend or remove a Board member that is not in accordance with a proposal of the Supervisory Board requires an absolute majority of the votes cast representing more than one-third of the issued capital.
DividendsThe proposed dividend for a financial year must be approved by the General Meeting of Shareholders, and the dividend is paid after this meeting. Dividend payments are only allowed to the extent that the shareholders’ equity is in excess of the sum of the paid-up capital and any reserves required under Dutch law. Dividend payments shall be made not later than 14 days after adoption of the dividend.
The Executive Board, with the approval of the Supervisory Board, determines which part of the profit is to be appropriated to the reserves. The remaining profit may be distributed as a dividend to the holders of the shares. The General Meeting of Shareholders may, at the proposal of the Executive Board that has been approved by the Supervisory Board, resolve that payment of dividend be wholly or partly in shares. If a loss is sustained in any year, no dividend shall be distributed for that year and for subsequent years until the loss has been defrayed out of the profit. The General Meeting may, however, resolve on a motion of the Executive Board that has been approved by the Supervisory Board, to defray any such loss out of the distributable part of the shareholders’ equity or to charge the dividend to the distributable part of the shareholders’ equity.
Capital reductionUpon the proposal of the Executive Board and subject to the approval of the Supervisory Board, the General Meeting of Shareholders may resolve to reduce Wessanen’s issued share capital by cancellation of shares or by reducing the nominal value of the shares through amendment of the Articles of Association, subject to certain statutory provisions and the provisions of the Articles of Association.
Corporate Governance Report

SustainabilityAbout us Financial Review, Risk &
Governance
Report of the Supervisory Board
Financial statements
Other information
Our marketplaceWelcome
68Wessanen Integrated Annual Report 2017
REPORT OF THE EXCECUTIVE BOARD
Appointment of External AuditorsThe General Meeting of Shareholders appoints the External Auditor. The Audit Committee recommends to the Supervisory Board the External Auditor to be proposed for reappointment by the General Meeting of Shareholders. On 12 April 2017, the General Meeting of Shareholders appointed Deloitte Accountants B.V. as external auditors for Wessanen for the financial year 2018.
Amendment of Articles of AssociationA resolution to amend the Articles of Association can only be adopted by the General Meeting of Shareholders on a motion of the Executive Board acting with the approval of the Supervisory Board. The full procedure of the amendment of the Articles of Association is set out in article 43 of Wessanen’s Articles of Association.
Compliance with Dutch Corporate Governance CodeThe Dutch Corporate Governance Code (the ‘Code’) forms the basis for Wessanen’s governance structure. Koninklijke Wessanen N.V. (‘Wessanen’ or the ‘Company’) complies with the Code by either applying its principles and best practice provisions or by explaining why it deviates from the Code. The Code’s principles and best practice provisions are fully applied, with currently the following two exceptions: – In deviation of best practice 3.1.2. which states that if shares are being awarded, they should be retained for at least five years, members of the Executive Board may sell shares to pay wage withholding taxes in connection with the delivery of shares related to such grant of shares. In view of the parallel requirement to build up and hold on to a significant portfolio of Wessanen shares under Wessanen’s amended remuneration policy, which was approved at Wessanen’s Annual General Shareholders Meeting in April 2015, members of the Executive Board may, in deviation of the best practice at all times sell shares provided that the share ownership guidelines are met.
– In deviation of best practice 3.2.3 which stipulates that the maximum remuneration in case of dismissal of a member of the Executive Board shall not exceed one year’s salary, the severance pay of an Executive Board member may consist of one year’s salary plus pay-out of the short-term cash incentive ‘at target’, plus the cash equivalent of the exercise value of all outstanding performance shares, if the dismissal is a result of a change of control over Wessanen.
Corporate Governance statementIn accordance with the Decree of 23 December 2004 regarding the implementation of further accounting standards for the content of annual reports (‘Besluit van 23 December 2004 tot vaststelling van nadere voorschriften omtrent de inhoud van de jaarrekening’), as amended on 29 Augustus 2017, Wessanen annually publishes a statement relating to corporate governance. As permitted under the regulations, Wessanen has opted to publish its corporate governance statement by posting it on its website, www.wessanen.com, in the Corporate Governance section.
This corporate governance statement, which describes Wessanen’s corporate governance structure in detail, is incorporated by reference in Wessanen’s 2017 Integrated Annual Report and Financial Statements and as such cannot be amended.
Information required pursuant to article 10 of the Takeover Directive Decree Capital structure (article 1, paragraph 1a)As of 31 December 2017, Wessanen’s authorised share capital amounted to €300 million divided into 300,000,000 shares, with a nominal value of €1.00 per share each. Each share entitles the holder to cast one vote and to dividend payments. All shares are registered shares and can be included in the deposit system of the Act on deposit securities transactions (‘Wet giraal effectenverkeer’). On 31 December 2017, the issued
share capital was divided into 76,067,324 shares all of which have been fully paid up.
Restrictions on transfer of shares or depository receipts (article 1, paragraph 1b)The Company does not impose under contract or in its Articles of Association any limitation on the transfer of shares or their depositary receipts issued with the cooperation of the Company.
Substantial participating interests (article 1, paragraph 1c)Pursuant to Section 5.3 of the Financial Markets Supervision Act (‘Wet op het Financieel Toezicht’) shareholders having (potential) ownership of and (potential) voting rights on the issued capital in excess of 3% are required to disclose their interest to the Authority Financial Markets (AFM). As per 31 December 2017 the following entities had reported a direct or indirect substantial holding of shares in the issued capital of Wessanen:
Share ownership HoldingDelta Partners, LLC 15-20%Mr. C. Jobson 5-10%Invesco Limited 3-5%Groupama 3-5%
No special controlling rights (article 1, paragraph 1d)There are no special controlling rights attached to the shares into which the Company capital is divided.
No share schemes (article 1, paragraph 1e) The Company does not have any employee participation plan or employee share option plan and hence no mechanism for monitoring such scheme.
No limitations on voting rights (article 1, paragraph 1f) There are no limitations on the exercising of the voting rights attached to ordinary shares or the depositary receipts for ordinary shares.
Corporate Governance Report

SustainabilityAbout us Financial Review, Risk &
Governance
Report of the Supervisory Board
Financial statements
Other information
Our marketplaceWelcome
69Wessanen Integrated Annual Report 2017
REPORT OF THE EXCECUTIVE BOARD
No agreements limiting transfer of shares or depository receipts (article 1, paragraph 1g)The Company is not aware of any agreements with shareholders which might give rise to a limitation on the transfer of ordinary shares or depositary receipts for ordinary shares issued with the cooperation of the Company, or in a limitation on voting rights.
Appointment and removal of members of Executive Board and Supervisory Board. Amendment of Articles of Association (article 1, paragraph 1h)The members of the Executive Board are appointed and removed by the General Meeting of Shareholders. The full procedure of appointment and removal of members of the Executive Board is set out in articles 15 and 16 of Wessanen’s Articles of Association. The members of the Supervisory Board are appointed by the General Meeting of Shareholders. The full procedure of appointment and dismissal of members of the Supervisory Board is set out in article 23 and 24 of Wessanen’s Articles of Association. A resolution to amend the Articles of Association can only be adopted by the General Meeting of Shareholders on a motion of the Executive Board acting with the approval of the Supervisory Board. The full procedure of the amendment of the Articles of Association is set out in article 43 of Wessanen’s Articles of Association.
Issue of shares and repurchase of shares (article 1, paragraph 1i)Shares are issued pursuant to a resolution of the Executive Board, subject to the prior approval of the Supervisory Board. The authority vested in the Executive Board relates to all unissued shares in the authorised capital. The duration of this authority is determined by a resolution of the General Meeting of Shareholders and shall amount to a maximum of five years. If no authorisation is given, the issue of shares requires a resolution of the General Meeting of Shareholders. Such resolution may only be taken upon a proposal by the Executive Board that has been approved by the Supervisory
Board. Currently, the Executive Board is authorised to resolve the issuance of shares for the purpose of employee, senior management and Executive Board long term stock option and share incentive plans, with a maximum of 1% of the issued share capital per annum as per 12 April 2017. The General Meeting of Shareholders granted this authorisation until 12 October 2018 by resolution dated 12 April 2017.
Unless Dutch law prescribes otherwise, Wessanen shareholders have pro rata pre-emptive rights to subscribe for new issuances of shares. These pre-emptive rights may, subject to the prior approval of the Supervisory Board, be restricted or excluded by the corporate body that is authorised to issue shares.
Wessanen may repurchase its own shares, subject to certain provisions of Dutch law and the Articles of Association. Wessanen may not repurchase its own shares if (i) the payment required to make the repurchase would reduce shareholders’ equity to an amount less than the sum of paid-in and called portions of the share capital and any reserves required by law or our Articles of Association or (ii) Wessanen and its subsidiaries would thereafter hold shares with an aggregate nominal value equal to more than 10% of the issued share capital. Shares owned by Wessanen may not be voted. Any repurchase of shares that are not fully paid-up is null and void.
A repurchase of shares may be effected by the Executive Board if the Executive Board has been so authorised by the General Meeting of Shareholders, which authorisation may not be granted for a period of more than 18 months. Most recently, the General Meeting of Shareholders granted this authorisation until 12 October 2018 by resolution dated 12 April 2017.
Change of control (article 1, paragraph 1k and 1j)In the event of a change of control Wessanen’s Revolving credit facility becomes immediately due and payable. Also, in the
event of a change of control the members of the Executive Board and a small group of senior executives are entitled to a severance payment in case their employment agreement would end following such change of control, their annual short-term incentive will be paid out on the fixed assumption of at least an ‘at target’ performance and outstanding long-term incentive rights will vest. There are no other agreements that come into existence or may be amended or terminated in the case of a change of control and whose effect could reasonably be expected to have a material adverse effect on Wessanen’s business, operations, property and condition (financially or otherwise).
Diversity PolicyCurrently, Wessanen’s Executive Board consists of two members and its Supervisory Board of four members. Within the Boards, diversity in work background, education, nationality, age and gender are essential for Wessanen to succeed in its mission. Wessanen needs Board members to have diverse work backgrounds and education, including at least experience and expertise in international FMCG business in managerial positions, finance & accounting, organic & speciality foods and food safety. Given the international presence of the Company, it is desirable that the members of the Executive Board and Supervisory Board have different nationalities. The Supervisory Board is of the opinion that the current composition of the Executive Board and the Supervisory Board is diverse and balanced with regard to work background, education and nationality. For future appointments, the Supervisory Board will pay attention to age as one of the aspects of diversity.
The statutory requirement that at least 30% of the seats of the Executive Board and Supervisory board should be taken by men and at least 30% by women, is currently not met. It is the aim of the Supervisory Board and Executive board to have a representation of 50% male and 50% female members in the Supervisory Board, the Executive Board and Wessanen’s other
Corporate Governance Report
SustainabilityAbout us Financial Review, Risk &
Governance
Report of the Supervisory Board
Financial statements
Other information
Our marketplaceWelcome
70Wessanen Integrated Annual Report 2017
REPORT OF THE EXCECUTIVE BOARD
executive positions by 2022. In the selection of new candidates, the Supervisory Board commits to maintain diversity in work background, education, nationality, age and gender within the Boards. In addition, the Supervisory Board aims to balance experience and connection with Wessanen and its culture. To this end, the Supervisory Board will follow female talent within the Company closely. With regard to vacancies, the Supervisory Board will compose a profile based on the required experience and education and will actively search for female candidates.
Corporate Governance Report

SustainabilityAbout us Financial Review, Risk &
Governance
Report of the Supervisory Board
Financial statements
Other information
Our marketplaceWelcome
71Wessanen Integrated Annual Report 2017
REPORT OF THE EXCECUTIVE BOARD
Statements by the Executive Board
Statement of Internal Control In accordance with the best practise provision 1.4.3. of the Dutch Corporate Governance Code Wessanen’s Executive Board makes the following statement:
The Executive Board is responsible for achieving the Company’s strategy, objectives, goals and results as well as for establishing and maintaining adequate internal risk management and control systems consistent with our business.
We have assessed whether the risk assessment executed showed any material failings in the effectiveness of the Company’s internal risk management and control systems. Though such systems are designed to manage and control risks, they can provide reasonable, but not absolute, assurance against material misstatements. Based on this assessment, to the best of our knowledge and belief, no material failings of the effectiveness of the Company’s internal risk management and control systems occurred and the internal risk and control systems provides reasonable assurance that the 2017 financial statements do not contain any errors of material importance.
In accordance with the Dutch Corporate Governance Code, we hereby state that to the best of our knowledge and belief, it is justified to adopt the going concern basis in preparing the Integrated Annual Report and we have the reasonable expectation that the Company will be able to continue in operation and meet its liabilities for at least twelve months.
Compliance statementIn accordance with Section 5:25c, paragraph 2 of the Dutch Act on Financial Supervision, we confirm that to the best of our knowledge: – The 2017 financial statements included in this Integrated Annual Report give a true and fair view of the assets, liabilities, financial position and profit or loss of the Company and the undertakings included in the consolidation taken as a whole;
– The report of the Executive Board included in this Integrated Annual Report gives a true and fair view of the position of the Company and the undertakings included in the consolidation taken as a whole as of 31 December 2017 and of the development and performance of the business for the financial year then ended; and
– The report of the Executive Board includes a description of the principal risks and uncertainties that the Company faces.
Amsterdam, 12 February 2018
Executive Board
Christophe Barnouin (CEO)Ronald Merckx (CFO)
Statement by Wessanen
Non-financial information statementThe Chapters About us, Sustainability and Financial Review, Risk & Governance, including the parts of the annual management report incorporated by reference, together comprise the consolidated “non-financial information statement” as specified in the Non-Financial Information Decree and in section 2:391(1) of the Dutch Civil Code.
Statements

72
Wessanen Integrated Annual Report 2017
Philippe Pointereau (Solagro)
Nature is an endless
source of inspiration
for cooperation
We cooperate with our ecosystem
Nature has created an amazing way to facilitate reproduction of plants: pollination. As there is not always enough wind to bring the pollen - which contains the male cells – to female plants, bees have taken over this task. When they search for nectar to feed the hive, they go from one plant to another. Their small legs have a lot of tiny hair to which pollen sticks and can be spread between flowers.
Of course, flowers have evolved to very appealing colored places to attract the maximum of bees. By the way, do you know why they are only a few red flowers in nature? Because bees are blind to red. Red flowers like poppies are usually in fields where they can get pollinated by the wind.

SustainabilityAbout us Financial review, Risk &
Governance
Report of the Supervisory Board
Financial statements
Other information
Our market placeWelcome
73Wessanen Annual Report 2017
“Nature does best. That is why agroecology is inspired by nature and its practices.”
“Solagro was born in 1981 in Toulouse as a student initiative. Together with our teachers and farmers we were working on topics around renewable energies. At some point we decided to continue with the project. Today we are 30 people trying to help farmers to improve their practices.”
We need to understand how things work“Our work always starts with analysing farms and local conditions. To be able to improve farming practices and its impact on the environment we need to fully understand how farms work. Based on this we can really tell how to produce food in a sustainable manner adapted to local conditions.
This is exactly what we did in a project we worked on with Wessanen to improve soy sourcing for plant based drinks. We visited several farms, did assessments, set up an action plan and so transformed the soy supply chain.”
Agroecology – going beyond organic“Agroecology means reducing the amount of pesticides, chemicals as well as emissions by understanding how nature is connected and analysing the impact of our actions. For me it also means going even beyond organic.Nature does best. That is why agroecology is inspired by nature and its practices.
For example crop rotation, which means planting different types of crops in the same area in sequenced seasons, and implementing a cover crop system to cover the soil the entire year. This helps to reduce soil erosion and to increase long-term soil fertility. Furthermore including legumes into the rotation makes mineral nitrogen obsolete.Last but not least: a minimum of semi-natural habitats, edge rows, flowers and tree strips to maintain biodiversity.”
Change the landscape“Personally I think todays biggest challenge is to return to a more natural way of producing food. We need to leave conventional monoculture behind and work towards a diverse and sustainable system. We need to start building real agro-ecosystems and change the landscapes. Just by looking at a landscape you can understand a lot about the past, environmental priorities and what practices and crops should be promoted.”
Philippe Pointereau (Solagro) is agronomist, specialised in agro-ecology and agri-environmental evaluation, and leads the department of agroecology at Solagro. Since he joined, Solagro developed from a student project to a NGO focusing on biodiversity, global issues such as climate change and the adaption of farming systems.
GWENAELLE FUZELLIER R&D Director Bjorg, Bonneterre & Cie
A full traceable and sustainable soy from farm to the drinks. I joined Bjorg, Bonneterre & Cie in 2011, and I have always been working in the field of nutrition and food development. Every day, I lead and push my team to develop healthy and sustainable innovations in collaboration with marketing and manufacturers. I have a recent example on how it is successful and meaningful to cooperate with ecosystem to create value.This year we transformed and redesigned our soy supply chain for Bonneterre Soy Drinks for a sustainable one. We co-developed with Solagro association our vision of good practices on soy farming beyond organic standards. We visited our producers and chose the best farmer Gianmario Viola that could fit with that ambition. We decided that the soy from his farm would be dedicated to soy Bonneterre drinks which induce a long-term commitment between Gianmario and us. From now we will have a yearly open discussion on his farming practices and how to improve further more. We go beyond cooperating with our ecosystem we even created a bigger ecosystem by linking farmers and experts, working as a project team.

Sustainability ReportAbout us Financial Review,
Risk & Governance
Report of the Supervisory Board
Our marketplaceWelcome Report of the
Supervisory Board Financial
statementsOther
information
74Wessanen Integrated Annual Report 2017
From left to right: Patrick Mispolet, Frank van Oers,
Ivonne Rietjens, Rudy Kluiber
REPORT OF THE SUPERVISORY BOARD

Sustainability ReportAbout us Financial Review,
Risk & Governance
Report of the Supervisory Board
Our marketplaceWelcome
75Wessanen Integrated Annual Report 2017
Report of the Supervisory Board
Financial statements
Other information
REPORT OF THE EXCECUTIVE BOARD
Biographies
F. (Frank) van Oers1959 Dutch nationality
Supervisory Board ChairmanMember of the Audit CommitteeMember of the SARC
Current term of appointment2017–2021; first appointed in 2009.
Ownership of Wessanen sharesNone.
ExperienceManaging Partner Vorwerk & Co. KG.Former CEO of Sara Lee International Beverage & Bakery Division. Former Executive Vice-President of Sara Lee Corporation.
I.M.C.M. (Ivonne) Rietjens1958 Dutch nationality
Supervisory Board memberChairman of the NFSC
Current term of appointment2016–2018; first appointment in 2012.
Ownership of Wessanen sharesNone.
ExperienceFull professor of Toxicology at the Agrotechnology & Food Sciences Department at Wageningen University. Member of the Dutch Royal Academy of Sciences (KNAW). Amongst others member of the Expert Panel of the Flavor and Extract Manufacturers Association (FEMA) (USA), the European Scientific Committee on Occupational Limit Values (SCOEL), the Dutch Health Council, the Scientific Advisory Board of the National Institute of Public Health & Hygiene (RIVM), and the Board of Trustees of the ILSI (International Life Sciences Institute).
P.E.M. (Patrick) Mispolet1958 French nationality
Supervisory Board memberMember of the NFSC
Current term of appointment2016–2020; first appointment in 2016.
Ownership of Wessanen sharesNone.
ExperiencePrivate investor in consumer focused businesses. Former CEO of Orangina Schweppes for France and Belgium.
R.K. (Rudy) Kluiber1959 American nationality
Supervisory Board memberChairman of the Audit CommitteeChairman of the SARC
Current term of appointment2016–2019; first appointment in 2012.
Ownership of Wessanen sharesNone.
ExperienceCo-founder and managing director of Shepherd, Kaplan, Krochuk LLC. Former Senior Vice-President and portfolio manager at State Street Research & Management Company.
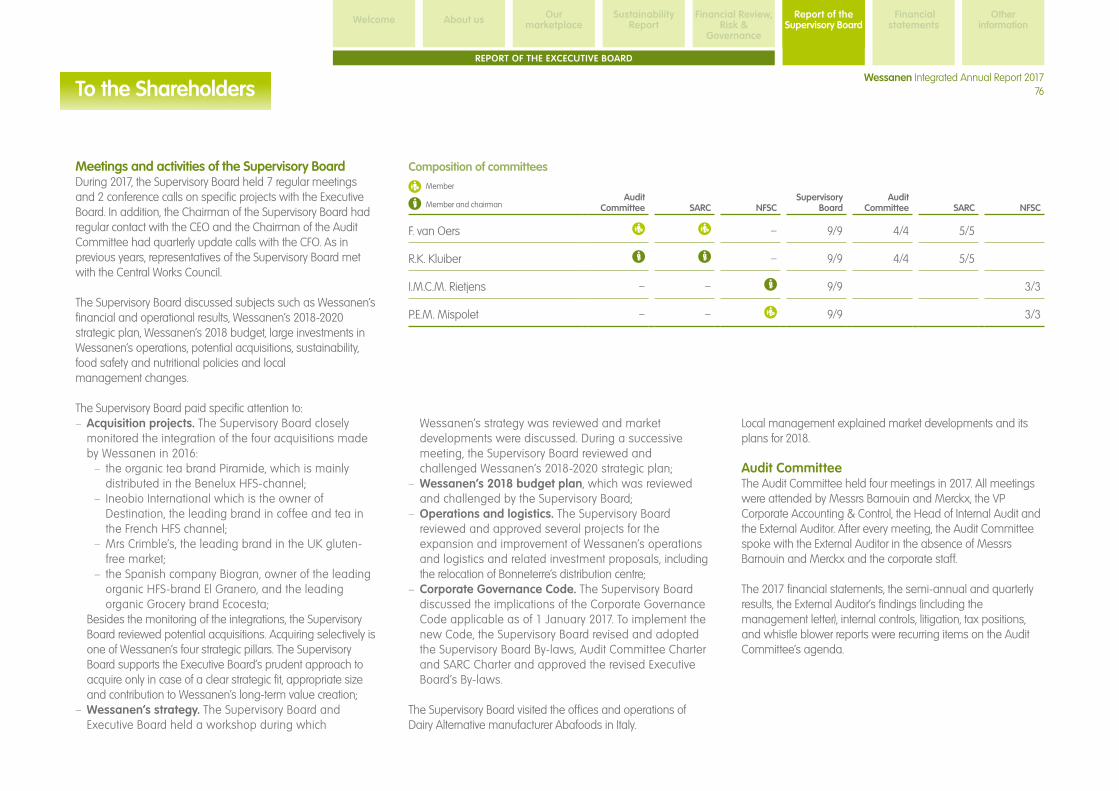
Sustainability ReportAbout us Financial Review,
Risk & Governance
Report of the Supervisory Board
Our marketplaceWelcome
76Wessanen Integrated Annual Report 2017
Report of the Supervisory Board
Financial statements
Other information
REPORT OF THE EXCECUTIVE BOARD
Meetings and activities of the Supervisory Board During 2017, the Supervisory Board held 7 regular meetings and 2 conference calls on specific projects with the Executive Board. In addition, the Chairman of the Supervisory Board had regular contact with the CEO and the Chairman of the Audit Committee had quarterly update calls with the CFO. As in previous years, representatives of the Supervisory Board met with the Central Works Council.
The Supervisory Board discussed subjects such as Wessanen’s financial and operational results, Wessanen’s 2018-2020 strategic plan, Wessanen’s 2018 budget, large investments in Wessanen’s operations, potential acquisitions, sustainability, food safety and nutritional policies and local management changes.
The Supervisory Board paid specific attention to: – Acquisition projects. The Supervisory Board closely monitored the integration of the four acquisitions made by Wessanen in 2016:
– the organic tea brand Piramide, which is mainly distributed in the Benelux HFS-channel;
– Ineobio International which is the owner of Destination, the leading brand in coffee and tea in the French HFS channel;
– Mrs Crimble’s, the leading brand in the UK gluten-free market;
– the Spanish company Biogran, owner of the leading organic HFS-brand El Granero, and the leading organic Grocery brand Ecocesta;
Besides the monitoring of the integrations, the Supervisory Board reviewed potential acquisitions. Acquiring selectively is one of Wessanen’s four strategic pillars. The Supervisory Board supports the Executive Board’s prudent approach to acquire only in case of a clear strategic fit, appropriate size and contribution to Wessanen’s long-term value creation;
– Wessanen’s strategy. The Supervisory Board and Executive Board held a workshop during which
Wessanen’s strategy was reviewed and market developments were discussed. During a successive meeting, the Supervisory Board reviewed and challenged Wessanen’s 2018-2020 strategic plan;
– Wessanen’s 2018 budget plan, which was reviewed and challenged by the Supervisory Board;
– Operations and logistics. The Supervisory Board reviewed and approved several projects for the expansion and improvement of Wessanen’s operations and logistics and related investment proposals, including the relocation of Bonneterre’s distribution centre;
– Corporate Governance Code. The Supervisory Board discussed the implications of the Corporate Governance Code applicable as of 1 January 2017. To implement the new Code, the Supervisory Board revised and adopted the Supervisory Board By-laws, Audit Committee Charter and SARC Charter and approved the revised Executive Board’s By-laws.
The Supervisory Board visited the offices and operations of Dairy Alternative manufacturer Abafoods in Italy.
Local management explained market developments and its plans for 2018.
Audit CommitteeThe Audit Committee held four meetings in 2017. All meetings were attended by Messrs Barnouin and Merckx, the VP Corporate Accounting & Control, the Head of Internal Audit and the External Auditor. After every meeting, the Audit Committee spoke with the External Auditor in the absence of Messrs Barnouin and Merckx and the corporate staff.
The 2017 financial statements, the semi-annual and quarterly results, the External Auditor’s findings (including the management letter), internal controls, litigation, tax positions, and whistle blower reports were recurring items on the Audit Committee’s agenda.
Composition of committees
Member
Member and chairmanAudit
Committee SARC NFSCSupervisory
BoardAudit
Committee SARC NFSC
F. van Oers – 9/9 4/4 5/5
R.K. Kluiber – 9/9 4/4 5/5
I.M.C.M. Rietjens – – 9/9 3/3
P.E.M. Mispolet – – 9/9 3/3
To the Shareholders
Sustainability ReportAbout us Financial Review,
Risk & Governance
Report of the Supervisory Board
Our marketplaceWelcome
77Wessanen Integrated Annual Report 2017
Report of the Supervisory Board
Financial statements
Other information
REPORT OF THE EXCECUTIVE BOARD
Specific attention was paid to: – The effectiveness and outcome of Wessanen’s Framework of Internal Control. In 2017 the effectiveness of internal controls were generally found to be adequate. For those few controls that were ineffective, actions were put in place to resolve the issues. Additionally, the risks related to the ineffective controls were analysed and additional reviews were performed where necessary. With regard to IT, due to the investments made in tooling and automated solutions, compared to 2016, less Segregation of Duty conflicts were reported in 2017. In addition, a project was initiated to structurally reduce Segregation of Duty conflicts, which will be finalised in 2018.
– The integration of the 2016 acquisitions Piramide, Ineobio, Mrs Crimble’s and Biogran.
– The valuation of assets and annual impairment testing; – The audit plan of the external auditor and the internal audit plan;
– New IFRS standards and legal developments, including reporting on non-financial obligations;
– Updates on reports under Wessanen’s Whistle Blower policy.
The Audit Committee evaluated the performance of Wessanen’s External Auditor Deloitte. It concluded that Deloitte is sufficiently independent and objective and Deloitte displays a critical and challenging attitude in respect of key audit matters identified and at times acts as the sparring partner for the CFO and the wider finance team. In view of Deloitte’s continued satisfactory performance the Supervisory Board will propose to appoint Deloitte as Wessanen’s External Auditor for 2019, after which Deloitte will have served as Wessanen’s external auditor for ten years. During 2018, the Audit Committee will organise a procedure for the selection of a new auditor, based on transparent and non-discriminatory selection criteria. Subsequently, the Audit Committee will submit a duly justified recommendation to the Supervisory Board.
Selection, Appointment and Remuneration Committee (SARC)The Selection, Appointment and Remuneration Committee held four meetings in 2017 and one meeting by conference call. Mr Barnouin and the HR Director attended all meetings.
The SARC verified the 2016 remuneration of the Executive Board. For the Short Term Incentive Plan, it verified the achievement of the 2016 targets and the items that were proposed by the Executive Board to be treated as exceptional items. Moreover, the SARC set the Executive Board’s personal and financial targets for 2017.
The SARC set the ROIC performance hurdle of the 2017 Long Term Incentive Plan and approved the grant of long term incentive rights to Mr Barnouin and Mr Merckx. Furthermore, the SARC set the performance conditions for the 2017 Share Matching Plan. On the 2014 Long Term Incentive Plan, the SARC established that the TSR performance hurdle was achieved. Finally, the SARC established that on 31 December 2016, both Executive Board members met the requirements of the Share Ownership Guidelines. The SARC discussed and approved the proposal to change the LTIP for specific Wessanen employees from cash-settled to equity-settled.
Besides remuneration, the SARC paid specific attention to management development and succession planning, and the development of a diversity policy for both the Supervisory and Executive Board.
Nutrition, Food safety and Sustainability Committee (NFSC)The Nutrition, Food safety and Sustainability Committee supports and advises the Executive Board in matters related to nutrition, food safety and sustainability. In 2017, the NFSC held three meetings.
The NFSC discussed various topics, including amongst others Wessanen’s purpose ‘Connect with nature’, Wessanen’s packaging policy and waste reduction project, Wessanen’s nutritional policies on the reduction of sugar and salt in its products, carbon reduction and neutralisation and the auditing of Wessanen’s sustainability KPI’s.
Remuneration reportThe Remuneration report can be found on pages 79-81.
Supervisory Board and Executive Board evaluationThe Supervisory Board assessed its functioning and that of its individual members, the Audit Committee, SARC and NFSC, outside the presence of the Executive Board. The evaluation mainly focused on the Supervisory Board’s mutual interaction and the collaboration with the Executive Board and the Supervisory Board discussed whether there were events that occurred in practice from which lessons could be learned. In addition, specific attention was paid to the desired profile of the Supervisory Board and its composition, and expertise. The evaluation led to the conclusion that the Supervisory Board functions well; some recommendations were made which will be implemented in the course of 2018.
The Supervisory Board also assessed the functioning of the Executive Board as a whole and that of its individual members, outside the presence of the Executive Board. The Supervisory Board concluded that the Executive Board’s performance, as a team as well as individually, is strong. The conclusions of the evaluation were shared with the individual Executive Board members.
Composition of the Supervisory BoardAfter the AGM of 12 April 2018, the second term of Mrs Rietjens will expire, after which she will have served 6 years. In 2016, Mrs Rietjens was appointed for a two-year term in order to avoid simultaneous retirement of the Supervisory Board members. Mrs Rietjens is available for reappointment, also
To the Shareholders
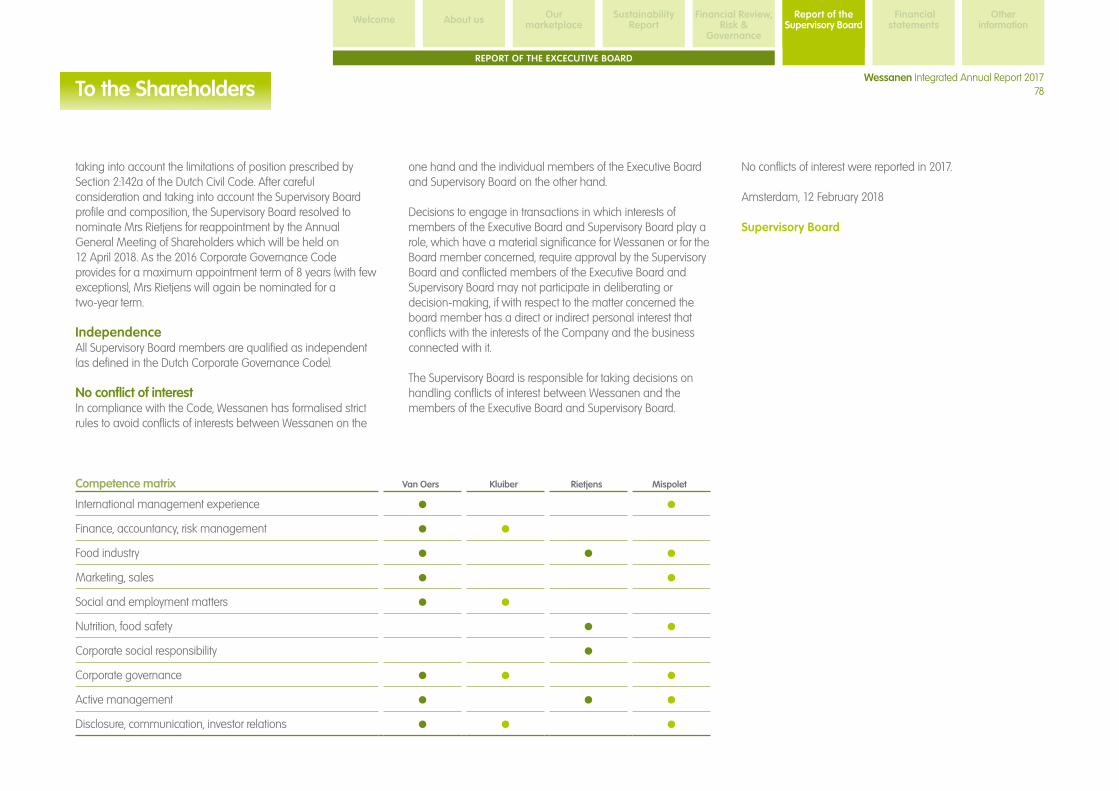
Sustainability ReportAbout us Financial Review,
Risk & Governance
Report of the Supervisory Board
Our marketplaceWelcome
78Wessanen Integrated Annual Report 2017
Report of the Supervisory Board
Financial statements
Other information
REPORT OF THE EXCECUTIVE BOARD
taking into account the limitations of position prescribed by Section 2:142a of the Dutch Civil Code. After careful consideration and taking into account the Supervisory Board profile and composition, the Supervisory Board resolved to nominate Mrs Rietjens for reappointment by the Annual General Meeting of Shareholders which will be held on 12 April 2018. As the 2016 Corporate Governance Code provides for a maximum appointment term of 8 years (with few exceptions), Mrs Rietjens will again be nominated for a two-year term.
IndependenceAll Supervisory Board members are qualified as independent (as defined in the Dutch Corporate Governance Code).
No conflict of interestIn compliance with the Code, Wessanen has formalised strict rules to avoid conflicts of interests between Wessanen on the
one hand and the individual members of the Executive Board and Supervisory Board on the other hand.
Decisions to engage in transactions in which interests of members of the Executive Board and Supervisory Board play a role, which have a material significance for Wessanen or for the Board member concerned, require approval by the Supervisory Board and conflicted members of the Executive Board and Supervisory Board may not participate in deliberating or decision-making, if with respect to the matter concerned the board member has a direct or indirect personal interest that conflicts with the interests of the Company and the business connected with it.
The Supervisory Board is responsible for taking decisions on handling conflicts of interest between Wessanen and the members of the Executive Board and Supervisory Board.
No conflicts of interest were reported in 2017.
Amsterdam, 12 February 2018
Supervisory Board
Competence matrix Van Oers Kluiber Rietjens Mispolet
International management experience
Finance, accountancy, risk management
Food industry
Marketing, sales
Social and employment matters
Nutrition, food safety
Corporate social responsibility
Corporate governance
Active management
Disclosure, communication, investor relations
To the Shareholders

Sustainability ReportAbout us Financial Review,
Risk & Governance
Report of the Supervisory Board
Our marketplaceWelcome
79Wessanen Integrated Annual Report 2017
Report of the Supervisory Board
Financial statements
Other information
REPORT OF THE EXCECUTIVE BOARD
Summary Remuneration Policy The objective of Wessanen’s Remuneration Policy is to attract, motivate and retain experienced executives with an international outlook and focuses on long-term value creation for the company. The structure of the remuneration package for the Executive Board strives to achieve a balance between Wessanen’s short-term and long-term strategy while taking into account the interest of Wessanen’s stakeholders and to reward the Executive Board appropriately for their ability to achieve stretch targets for short-term and long-term performance. The variable compensation is linked to measurable predetermined targets, which are predominantly long-term in character and are closely aligned with Wessanen’s strategy. The Long Term Incentive Plan (LTIP) and the Share Matching Plan (SMP) and their performance conditions motivate the Executive Board members to focus on long-term sustainable value creation for the company and its affiliated enterprise.
Share Ownership GuidelineIn order to increase the alignment of members of the Executive Board with the interests of shareholders, members of the Executive Board will be required to build up share ownership of Wessanen, equal to the value of 100% of their annual gross base salary, within four years after election as a member of the Executive Board. The current members of the Executive Board have four years after the adoption of the Remuneration Policy in 2015 to comply with the aforementioned share ownership requirement.
The best practice that shares granted without financial consideration must be retained for at least five years, will not be applied. In view of the parallel requirement to build up and hold on to a significant portfolio of Wessanen shares under Wessanen’s amended remuneration policy, members of the Executive Board may, at all times sell shares provided that the share ownership guidelines are met.
Furthermore, members of the Executive Board may sell shares if to pay wage withholding taxes in connection with the delivery of shares related to such grant of shares.
Remuneration componentsThe remuneration for Executive Board members comprises the following components:– A base salary, which is reviewed annually;– A short-term cash incentive, ranging from 0%-100% of the
base salary depending on the achievement of performance targets (Short Term Incentive Plan: “STIP”);
– A long-term incentive, ranging from 0%-50% of the base salary at grant date depending on the achievement of performance hurdles (Long Term Incentive Plan: “LTIP”);
– Share Matching, ranging from 0 – 150% of the mandatory and/or voluntary investment in Wessanen Shares; vesting will depend on the achievement of performance conditions;
– Pension contributions;– Benefits in kind such as a contribution to health and medical
insurance premium, a company car, a contribution to telephone costs and a fixed expense allowance for business purposes and housing.
Base SalaryOn joining the Executive Board, members receive a base salary that is comparable with the median of the labour-market peer group. Adjustment of the base salary is at the discretion of the Supervisory Board, which takes into account external and internal developments. The annual review date for the base salary is 1 April.
Short Term Incentive Plan (STIP)The Wessanen STIP rewards the Executive Board for sound operational performance in Wessanen’s competitive environment. The financial objectives operating result before exceptional items (‘EBITE’), annual sales growth and working capital targets account for 70% of the STI. Personal targets account for the remaining 30% of the STI.
The STIP targets, including the personal objectives, are clear and measurable and set each year in advance at a challenging level, taking into account general trends in the relevant markets. Both financial and personal targets aim at contributing to long-term value creation. The targets are predominantly long-term in character and are closely aligned with Wessanen’s strategy. At least one of the personal targets is related to sustainability.
Members of the Executive Board have to invest at least 25% (as long as they have not yet met the number of shares as required by the share ownership guideline), and might voluntarily choose to invest up to 100%, of the (after tax) STIP pay out in Wessanen shares per year.
Operating result before exceptional items (EBITE), annual sales growth and primary working capital days reflect the elements of Wessanen’s financial performance. These elements respectively account for 30%, 30% and 10% of the STI.
The short-term incentive related to financial targets will only be paid if the minimum EBITE target has been achieved.
Remuneration Report
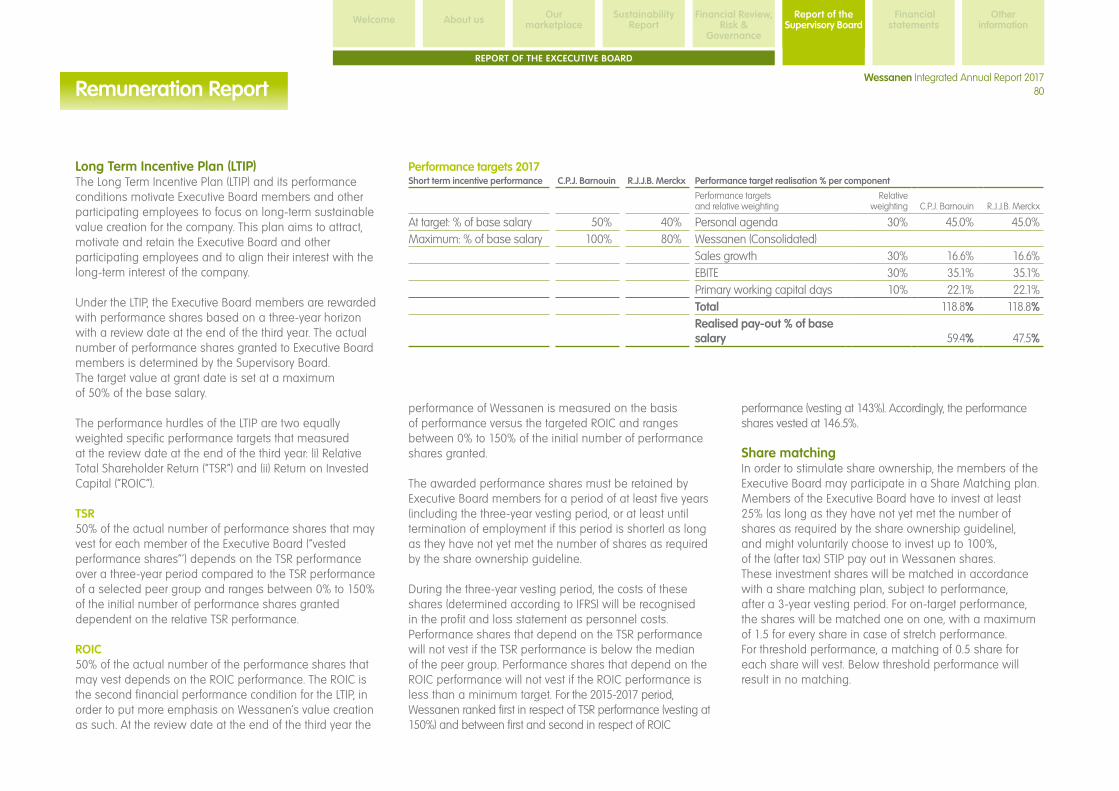
Sustainability ReportAbout us Financial Review,
Risk & Governance
Report of the Supervisory Board
Our marketplaceWelcome
80Wessanen Integrated Annual Report 2017
Report of the Supervisory Board
Financial statements
Other information
REPORT OF THE EXCECUTIVE BOARD
Long Term Incentive Plan (LTIP)The Long Term Incentive Plan (LTIP) and its performance conditions motivate Executive Board members and other participating employees to focus on long-term sustainable value creation for the company. This plan aims to attract, motivate and retain the Executive Board and other participating employees and to align their interest with the long-term interest of the company.
Under the LTIP, the Executive Board members are rewarded with performance shares based on a three-year horizon with a review date at the end of the third year. The actual number of performance shares granted to Executive Board members is determined by the Supervisory Board. The target value at grant date is set at a maximum of 50% of the base salary.
The performance hurdles of the LTIP are two equally weighted specific performance targets that measured at the review date at the end of the third year: (i) Relative Total Shareholder Return (“TSR”) and (ii) Return on Invested Capital (“ROIC”).
TSR50% of the actual number of performance shares that may vest for each member of the Executive Board (“vested performance shares”’) depends on the TSR performance over a three-year period compared to the TSR performance of a selected peer group and ranges between 0% to 150% of the initial number of performance shares granted dependent on the relative TSR performance.
ROIC50% of the actual number of the performance shares that may vest depends on the ROIC performance. The ROIC is the second financial performance condition for the LTIP, in order to put more emphasis on Wessanen’s value creation as such. At the review date at the end of the third year the
performance of Wessanen is measured on the basis of performance versus the targeted ROIC and ranges between 0% to 150% of the initial number of performance shares granted.
The awarded performance shares must be retained by Executive Board members for a period of at least five years (including the three-year vesting period, or at least until termination of employment if this period is shorter) as long as they have not yet met the number of shares as required by the share ownership guideline.
During the three-year vesting period, the costs of these shares (determined according to IFRS) will be recognised in the profit and loss statement as personnel costs.Performance shares that depend on the TSR performance will not vest if the TSR performance is below the median of the peer group. Performance shares that depend on the ROIC performance will not vest if the ROIC performance is less than a minimum target. For the 2015-2017 period, Wessanen ranked first in respect of TSR performance (vesting at 150%) and between first and second in respect of ROIC
performance (vesting at 143%). Accordingly, the performance shares vested at 146.5%.
Share matchingIn order to stimulate share ownership, the members of the Executive Board may participate in a Share Matching plan. Members of the Executive Board have to invest at least 25% (as long as they have not yet met the number of shares as required by the share ownership guideline), and might voluntarily choose to invest up to 100%, of the (after tax) STIP pay out in Wessanen shares. These investment shares will be matched in accordance with a share matching plan, subject to performance, after a 3-year vesting period. For on-target performance, the shares will be matched one on one, with a maximum of 1.5 for every share in case of stretch performance. For threshold performance, a matching of 0.5 share for each share will vest. Below threshold performance will result in no matching.
Performance targets 2017Short term incentive performance C.P.J. Barnouin R.J.J.B. Merckx Performance target realisation % per component
Performance targets and relative weighting
Relative weighting C.P.J. Barnouin R.J.J.B. Merckx
At target: % of base salary 50% 40% Personal agenda 30% 45.0% 45.0%Maximum: % of base salary 100% 80% Wessanen (Consolidated)
Sales growth 30% 16.6% 16.6%EBITE 30% 35.1% 35.1%Primary working capital days 10% 22.1% 22.1%Total 118.8% 118.8%Realised pay-out % of base salary 59.4% 47.5%
Remuneration Report
Sustainability ReportAbout us Financial Review,
Risk & Governance
Report of the Supervisory Board
Our marketplaceWelcome
81Wessanen Integrated Annual Report 2017
Report of the Supervisory Board
Financial statements
Other information
REPORT OF THE EXCECUTIVE BOARD
A limited number of senior executives designated by the SARC upon recommendation of the Executive Board are also required to participate in the share matching plan.
Adjustment of remunerationThe Supervisory Board has the ‘ultimate remedy’ power to adjust the value of the variable remuneration components awarded, either downwards or upwards, if this remuneration produces an unfair result.
In addition, a variable remuneration component will be recovered from an Executive Board member if it appears that such remuneration component was granted on the basis of incorrect (financial) data (i.e. clawback).
Pay Ratio To attract, motivate and retain employees with the right competences, Wessanen has a balanced remuneration strategy which takes into account both the weight, complexity and responsibilities of a role whilst in return rewards good performance that generates long-term value creation. For this reason Wessanen has long term incentive plans for all executive positions. This remuneration strategy is consistently applied and executed. In addition, the remuneration strategy is regularly benchmarked in order to ensure fair and market competitive practices.
In compliance with the Corporate Governance Code applicable as of 1 January 2017, an additional internal benchmark was conducted on the pay ratios between Executive Board members and other employees within the Company when formulating the remuneration policy for the Executive Board. These pay ratios, which are specific to the company’s industry, geographical footprint and organisational model, will be disclosed annually in the Remuneration Report.
In 2017, the pay ratio for the CEO is 16.0 (2016: 13.9) and 12.6 for the CFO (2016: 11.0). These ratios are obtained by dividing the 2017 total remuneration for the CEO and CFO by the 2017 average total remuneration of all other employees worldwide as the common denominator. The denominator is derived from Note 7 to the consolidated financial statements on page 100 by dividing the 2017 total personnel expenses (after subtracting the Executive Board’s remuneration), by the reported average number of full-time employees (minus two), leading to an amount of €79.5 thousand. The total remuneration for the CEO and CFO is disclosed in Note 7 to the consolidated financial statements on page 100.
The increase of the pay ratio in 2017 versus 2016, is mainly caused by the decrease of the average remuneration per full-time equivalent (excluding the CEO and CFO) following the acquisitions in the course of 2016 (including Biogran in December 2016).
Change of controlIn the event of a change of control, the Executive Board members are entitled to a severance payment in case their employment agreement would end following such change of control, their annual short-term incentive will be paid out on the fixed assumption of at least an ‘at target’ performance and outstanding long-term incentive will vest. With regard to performance shares awarded under the share matching plan, vesting of the matching shares will however be time pro-rated.
Remuneration of the Executive Board 2017In connection with the contemplated amendment of the Remuneration Policy the SARC performed a scenario analysis and concluded that the remuneration of the Executive Board was fair and did not have unreasonable effects under any of the tested scenarios.
Remuneration of the Supervisory Board 2017In 2017, each member of the Supervisory Board received a fixed fee of €45,000 and a fixed cost allowance of €3,176. The Chairman of the Supervisory Board was awarded an additional fee of €20,000 and an additional cost allowance of €454. The Chairman of the Audit Committee was awarded an additional fee of €10,000 and the Chairmen of the SARC and NFSC were each awarded an additional fee of €5,000.
Further details of the remuneration of the members of the Executive Board and Supervisory Board in 2017 can be found in Note 7 to the consolidated financial statements.
Remuneration Report


83Wessanen Integrated Annual Report 2017Wessanen Integrated Annual Report 2017
SustainabilityAbout us Financial Review, Risk &
Governance
Report of the Supervisory Board
Our marketplaceWelcome
Wessanen Integrated Annual Report 2017
Report of the Supervisory Board
Financial statements
Other information
REPORT OF THE EXCECUTIVE BOARD
Consolidated financial statements Consolidated income statement 84Consolidated statement of comprehensive income 85Consolidated statement of financial position 86Consolidated statement of changes in equity 87Consolidated statement of cash flows 88
Notes to the consolidated financial statements1. The Company and its operations 892. Basis of preparation 893. Significant accounting policies 904. Determination of fair value 965. Acquisitions 966. Segment information 977. Personnel expenses and remuneration
key management 1008. Share-based payments 1039. Net financing costs 10810. Income tax expense 10911. Earnings per share 11112. Property, plant and equipment 11213. Intangible assets 11414. Other investments 11615. Deferred tax assets and liabilities 11716. Inventories 11917. Trade and other receivables and prepayments 11918. Net cash and cash equivalents 11919. Equity attributable to equity holders of Wessanen 12020. Interest-bearing loans and borrowings 12121. Employee benefits 12322. Provisions 12823. Trade and non-trade payables and accrued
expenses 13024. Financial instruments and risk management 13025. Commitments and contingencies 13826. Related parties 13927. Principal auditor’s remuneration 13928. Cash flow 14029. List of subsidiaries 141
Financial statements of the Company Income statement and balance sheet of the Company 142
Notes to the financial statements of the Company1. Principles of valuation and income determination 1432. Personnel expenses 1433. Other operating income 1434. Net financing costs 1435. Income tax 1436. Financial assets 1437. Current assets 1438. Shareholders’ equity 1439. Current liabilities 14310. Commitments and contingencies 14411. Remuneration Executive Board
and Supervisory Board 14412. Principal auditor’s remuneration 14413. Appropriation of result 2017 14414. Dividend proposal 14415. Subsequent events 144
Contents

84Wessanen Integrated Annual Report 2017Wessanen Integrated Annual Report 2017
SustainabilityAbout us Financial Review, Risk &
Governance
Report of the Supervisory Board
Our marketplaceWelcome
Wessanen Integrated Annual Report 2017
Report of the Supervisory Board
Financial statements
Other information
REPORT OF THE EXCECUTIVE BOARD
In € millions, unless stated otherwise Notes 2017 2016
Revenue 625.8 570.0 Raw materials and supplies (365.9) (335.6)Personnel expenses 7, 8 (96.5) (91.7)Depreciation, amortisation and impairments 12, 13 (9.9) (7.8)Other operating expenses (104.8) (100.6)Operating expenses (577.1) (535.7)
Operating result 48.7 34.3 Interest expenses (0.9) (0.4)Other financial income and expenses (1.0) (1.4)Net financing costs 9 (1.9) (1.8)
Profit before income tax 46.8 32.5 Income tax expense 10 (10.8) (9.7)
Profit for the period 36.0 22.8
Attributable to equity holders of Wessanen 36.0 22.8
Earnings per share attributable to equity holders of Wessanen (in €) 11
Basic 0.47 0.30 Diluted 0.47 0.30
Average number of shares (in thousands) 11
Basic 75,790 75,594 Diluted 76,738 76,116 Average GBP exchange rate (GBP per Euro) 0.8757 0.8227
Consolidated income statement

85Wessanen Integrated Annual Report 2017Wessanen Integrated Annual Report 2017
SustainabilityAbout us Financial Review, Risk &
Governance
Report of the Supervisory Board
Our marketplaceWelcome
Wessanen Integrated Annual Report 2017
Report of the Supervisory Board
Financial statements
Other information
REPORT OF THE EXCECUTIVE BOARD
In € millions Notes 2017 2016
Profit for the period 36.0 22.8
Other comprehensive lossRemeasurements of post employment benefit obligations, net of income tax 10, 21 – (0.5)Other comprehensive loss that will not be reclassified to profit or loss – (0.5)Foreign currency translation differences, net of income tax 10, 24 (1.3) (5.2)Effective portion of changes in fair value of cash flow hedges, net of income tax 10, 24 – (0.1)Other comprehensive loss that may be reclassified to profit or loss (1.3) (5.3)
Total other comprehensive loss (1.3) (5.8)
Total comprehensive income 34.7 17.0
Attributable to equity holders of Wessanen 34.7 17.0
Consolidated statement of comprehensive income

86Wessanen Integrated Annual Report 2017Wessanen Integrated Annual Report 2017
SustainabilityAbout us Financial Review, Risk &
Governance
Report of the Supervisory Board
Our marketplaceWelcome
Wessanen Integrated Annual Report 2017
Report of the Supervisory Board
Financial statements
Other information
REPORT OF THE EXCECUTIVE BOARD
In € millions, unless stated otherwise Notes
31 December
2017
31 December
2016
AssetsProperty, plant and equipment 12 58.4 51.2 Intangible assets 13 206.6 203.3 Other investments 14 0.2 0.6 Deferred tax assets 15 7.0 8.8 Total non-current assets 272.2 263.9 Inventories 16 76.5 68.5 Income tax receivables 0.8 0.4 Trade receivables 17 98.8 101.0 Other receivables and prepayments 17 14.9 15.5 Cash and cash equivalents 18 13.8 9.4 Total current assets 204.8 194.8
Total assets 477.0 458.7
In € millions, unless stated otherwise Notes
31 December
2017
31 December
2016
EquityShare capital 76.1 76.0 Share premium 102.8 102.9 Reserves (17.5) (20.1)Retained earnings 66.3 32.4 Total equity 19 227.7 191.2
LiabilitiesInterest-bearing loans and borrowings 20 61.1 81.2 Employee benefits 21 7.9 7.7 Provisions 22 2.3 3.0 Deferred tax liabilities 15 13.1 10.9 Total non-current liabilities 84.4 102.8 Bank overdrafts 18 8.8 8.7 Interest-bearing loans and borrowings 20 3.8 3.0 Provisions 22 4.6 12.1 Income tax payables 1.4 2.6 Trade payables 23 84.8 80.5 Non-trade payables and accrued expenses 23 61.5 57.8 Total current liabilities 164.9 164.7
Total liabilities 249.3 267.5
Total equity and liabilities 477.0 458.7
End of period GBP exchange rate (GBP per Euro) 0.8872 0.8562
Consolidated statement of financial position

87Wessanen Integrated Annual Report 2017Wessanen Integrated Annual Report 2017
SustainabilityAbout us Financial Review, Risk &
Governance
Report of the Supervisory Board
Our marketplaceWelcome
Wessanen Integrated Annual Report 2017
Report of the Supervisory Board
Financial statements
Other information
REPORT OF THE EXCECUTIVE BOARD
In € millions Notes
Issued and paid-up share
capitalShare
premium ReservesRetained earnings
Totalequity
2016Treasury
sharesTranslation
reserveHedging
reserve
Balance of beginning of year 76.0 102.9 (3.5) (11.0) 0.1 18.9 183.4
Comprehensive income and expense for the periodProfit/(loss) for the period – – – – – 22.8 22.8 Foreign currency translation differences1 10, 24 – – – (5.2) – – (5.2)Remeasurements of post employment benefit obligations1 10, 21 – – – – – (0.5) (0.5)Effective portion of changes in fair value of cash flow hedges1 10, 24 – – – – (0.1) – (0.1)Total comprehensive income and expense for the period – – – (5.2) (0.1) 22.3 17.0
Contributions by and distributions to ownersShares issued 19 – – – – – – – Shares delivered 19 – – 1.7 – – (1.7) – Dividends 19 – – – – – (8.3) (8.3)Sale/(purchase) of own shares 19 – – (2.1) – – – (2.1)Share-based payments 8 – – – – – 1.2 1.2 Total contributions by and distributions to owners – – (0.4) – – (8.8) (9.2)
Balance at year end 76.0 102.9 (3.9) (16.2) – 32.4 191.2
2017Balance of beginning of year 76.0 102.9 (3.9) (16.2) – 32.4 191.2
Comprehensive income and expense for the periodProfit/(loss) for the period – – – – – 36.0 36.0 Foreign currency translation differences1 10, 24 – – – (1.3) – – (1.3)Remeasurements of post employment benefit obligations1 10, 21 – – – – – – – Effective portion of changes in fair value of cash flow hedges1 10, 24 – – – – – – – Total comprehensive income and expense for the period – – – (1.3) – 36.0 34.7
Contributions by and distributions to ownersShares issued 19 0.1 (0.1) – – – – – Shares delivered 19 – – 0.5 – – (0.5) – Dividends 19 – – – – – (9.1) (9.1)Sale/(purchase) of own shares 19 – – 3.4 – – 2.5 5.9 Share-based payments 8 – – – – – 5.0 5.0 Total contributions by and distributions to owners 0.1 (0.1) 3.9 – – (2.1) 1.8
Balance at year end 76.1 102.8 – (17.5) – 66.3 227.7 1 Net of income tax.
Consolidated statement of changes in equity
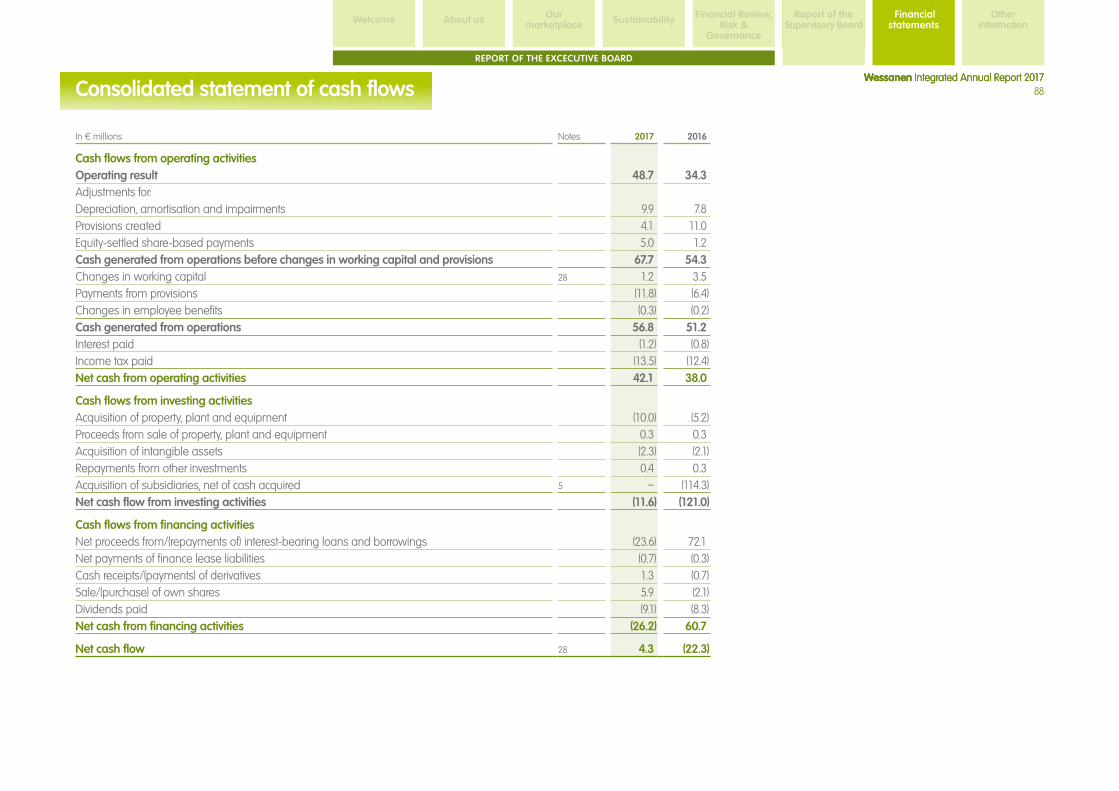
88Wessanen Integrated Annual Report 2017Wessanen Integrated Annual Report 2017
SustainabilityAbout us Financial Review, Risk &
Governance
Report of the Supervisory Board
Our marketplaceWelcome
Wessanen Integrated Annual Report 2017
Report of the Supervisory Board
Financial statements
Other information
REPORT OF THE EXCECUTIVE BOARD
In € millions Notes 2017 2016
Cash flows from operating activitiesOperating result 48.7 34.3 Adjustments for:Depreciation, amortisation and impairments 9.9 7.8 Provisions created 4.1 11.0 Equity-settled share-based payments 5.0 1.2 Cash generated from operations before changes in working capital and provisions 67.7 54.3 Changes in working capital 28 1.2 3.5 Payments from provisions (11.8) (6.4)Changes in employee benefits (0.3) (0.2)Cash generated from operations 56.8 51.2 Interest paid (1.2) (0.8)Income tax paid (13.5) (12.4)Net cash from operating activities 42.1 38.0
Cash flows from investing activitiesAcquisition of property, plant and equipment (10.0) (5.2)Proceeds from sale of property, plant and equipment 0.3 0.3 Acquisition of intangible assets (2.3) (2.1)Repayments from other investments 0.4 0.3 Acquisition of subsidiaries, net of cash acquired 5 – (114.3)Net cash flow from investing activities (11.6) (121.0)
Cash flows from financing activitiesNet proceeds from/(repayments of) interest-bearing loans and borrowings (23.6) 72.1 Net payments of finance lease liabilities (0.7) (0.3)Cash receipts/(payments) of derivatives 1.3 (0.7)Sale/(purchase) of own shares 5.9 (2.1)Dividends paid (9.1) (8.3)Net cash from financing activities (26.2) 60.7
Net cash flow 28 4.3 (22.3)
Consolidated statement of cash flows

89Wessanen Integrated Annual Report 2017Wessanen Integrated Annual Report 2017
SustainabilityAbout us Financial Review, Risk &
Governance
Report of the Supervisory Board
Our marketplaceWelcome
Wessanen Integrated Annual Report 2017
Report of the Supervisory Board
Financial statements
Other information
REPORT OF THE EXCECUTIVE BOARD
1. The Company and its operationsKoninklijke Wessanen N.V. (‘Wessanen’ or ‘the Company’) is a public limited company domiciled in the Netherlands. It is a leading company in the European market for healthy and sustainable food. Our focus is on organic, vegetarian, fair trade and natural ingredients as these are healthier and more sustainable. Operating mainly in the Benelux, France, Germany, Italy, Spain and the UK, we manage and develop well-known local brands such as Bjorg, el Granero, Whole Earth, Zonnatura, Kallø, Alter Eco, Gayelord Hauser, Allos and Bonneterre and European brands such as Clipper, Tartex, Destination and Mrs. Crimble’s.
The consolidated financial statements of Wessanen for the year ended 31 December 2017, comprise Wessanen and its subsidiaries (together referred to as ‘the Group’). Wessanen’s subsidiaries as at 31 December 2017 are listed in Note 29. The address of the Company’s registered office is Hoogoorddreef 5, Amsterdam Zuidoost, the Netherlands.
2. Basis of preparationStatement of complianceThe consolidated financial statements for the year ended 31 December 2017 have been prepared in accordance with International Financial Reporting Standards (IFRS) as adopted by the European Union (EU) and also comply with the financial reporting requirements included in Part 9 of Book 2 of the Dutch Civil Code.
The financial statements were signed and authorised for issuance by the Supervisory Board and the Executive Board on 12 February 2018, and will be submitted for adoption to the Annual General Meeting of Shareholders on 12 April 2018.
Basis of measurementThe consolidated financial statements have been prepared under the historical cost convention, unless otherwise indicated, including the following assets and liabilities that are stated
at their fair value: derivative financial instruments, defined benefit plan assets and liabilities for cash-settled share-based payment arrangements (applicable until 1 October 2017). The methods used to measure fair value are disclosed in Note 4.
Functional and presentation currencyThe functional currency of Wessanen is the Euro. These consolidated financial statements are presented in millions of Euro.
Use of estimates and judgementsThe preparation of Wessanen’s consolidated financial statements in conformity with IFRS requires management to make estimates and assumptions that affect the application of accounting policies and the reported amounts of assets and liabilities, of revenues and expenses and the disclosure of contingent assets and liabilities. Although these estimates and associated assumptions are based on management’s best knowledge of current events and actions, actual results may ultimately differ materially from these estimates and assumptions.
The estimates and underlying assumptions are reviewed on an ongoing basis. Revisions to accounting estimates are recognised in the period in which the estimate is revised if the revision affects only that period, or in the period of the revision and future periods if the revision affects both current and future periods.
The estimates and assumptions, that management considers most critical and that have a significant inherent risk of causing a material adjustment to the carrying amounts of assets and liabilities within the next financial year, are disclosed hereinafter.
Impairment of non-current assetsDetermining whether non-current assets are to be impaired requires an estimation of the recoverable amount of the asset (or cash-generating unit), which is the greater of fair value
less cost to sell and value in use. The value in use calculation requires management to estimate the future cash flows expected to arise from the asset (or cash-generating unit) and an appropriate discount rate, in order to calculate the present value of the expected future economic benefits of an asset (or cash-generating unit). See Note 13 for specific information on the carrying amounts of goodwill and brands, the cash-generating units affected and the estimates and assumptions applied.
Customer incentivesJudgements and estimates are required regarding the timing and the amount of outflow of resources in respect of customer incentives, including trade promotions and customer rebates. Estimated customer incentives are calculated and recorded at the time related sales are made based on contractual arrangements, and subsequently monitored carefully, as settlement only takes place periodically.
Provisions and contingenciesThe recognition of provisions requires estimates and judgement regarding the timing and the amount of outflow of resources.
The main estimates are as follows:
– Restructuring: the provisions are based on formal and approved plans using the best information available at the time. The amounts that are ultimately incurred may change as the plans are executed.
– Claims and legal disputes: management, supported by internal and external legal counsel, where appropriate, determines whether it is more likely than not that an outflow of resources will be required to settle an obligation. If this is the case, the best estimate of the outflow of resources is recognised.
See Notes 22 and 25 for specifc information on provisions and contingencies.
Notes to the consolidated financial statements

90Wessanen Integrated Annual Report 2017
Sustainability ReportAbout us Financial Review,
Risk & Governance
Report of the Supervisory Board
Our marketplaceWelcome
Wessanen Integrated Annual Report 2017
Report of the Supervisory Board
Financial statements
Other information
REPORT OF THE EXCECUTIVE BOARD
Notes to the consolidated financial statements
PensionsThe calculation of the defined benefit obligations and, in relation to that, the net periodic benefit costs for the periods presented, requires management to estimate, amongst others, future benefit levels, discount rates, investment returns on plan assets and life expectancy. Due to the long term nature of these plans such estimates are subject to considerable uncertainties and may require adjustments in future periods, impacting future liabilities and expenses. See Note 21 for specific information on the estimates and assumptions applied in respect of the calculation of the defined benefit obligations.
Income taxWessanen is subject to income tax in several jurisdictions. The ultimate tax effects of transactions may be uncertain for a considerable amount of time, requiring management to estimate the related current and deferred tax positions. Judgement is required in determining whether deferred tax assets are realisable. The Group has tax loss carry-forward positions whereby the realisation of deferred tax assets will be largely dependent upon the availability of future taxable income, as estimated from time to time by management and the availability of tax planning. The Group recognises liabilities for uncertain tax positions when it is more likely than not that additional tax will be due. See Notes 10 and 15 for specific information on income tax and deferred tax assets and liabilities.
New and revised IFRSs appliedA number of amendments is effective for annual periods that begin on or after 1 January 2017 and have been adopted in preparing these consolidated financial statements. None of these amendments had a significant effect on the consolidated financial statements.
3. Significant accounting policiesThe accounting policies set out below have been consistently applied to all periods presented in these consolidated financial statements, and have been applied consistently by all Group entities.
Basis of consolidationSubsidiariesThe consolidated financial statements incorporate the financial statements of Wessanen and all entities that are controlled by Wessanen (‘subsidiaries’). Wessanen controls an entity when it is exposed to, or has rights to, variable returns from its involvement with the entity and has the ability to affect those returns through its power over the entity. The financial statements of subsidiaries are included in the consolidated financial statements from the date that control commences until the date that control ceases.
Transactions eliminated on consolidationIntra-group balances and transactions and any unrealised gains and losses arising from intra-group transactions are eliminated in preparing the consolidated financial statements. Unrealised losses are eliminated in the same way as unrealised gains, but only to the extent that there is no evidence of impairment.
Foreign currencyForeign currency transactionsTransactions in foreign currencies (not being the functional currency) are translated to the functional currency using the exchange rate ruling at the date of the transaction. Monetary assets and liabilities denominated in foreign currencies are translated into Euro at the exchange rates ruling at the balance sheet date. Foreign exchange differences arising on translation are recognised in the income statement. Non-monetary assets and liabilities denominated in foreign currencies that are stated at historical cost are translated into Euro at foreign exchange rates ruling at the date of the transaction. Non-monetary assets and liabilities denominated
in foreign currencies that are stated at fair value are translated into Euro at foreign exchange rates ruling at the dates the fair value was determined.
Financial statements of foreign operationsThe assets and liabilities of foreign operations, including goodwill and fair value adjustments arising on acquisition, are translated into Euro at foreign exchange rates ruling at the balance sheet date. The revenues and expenses of foreign operations are translated into Euro at annual average exchange rates (the average is calculated based on 12 month-end closing rates). The resulting foreign exchange differences arising on translation are recognised directly in a separate component of equity, the translation reserve.
Net investment in foreign operationsForeign exchange differences arising from the translation of the net investment in foreign operations, and of related hedges, are taken to the translation reserve. Such differences are recognised in the income statement upon disposal of the foreign operation or settlement of the net investment.
The principal exchange rates against the Euro used in the statement of financial position and income statement are:
Currency per €Statement of
financial position Income statement
31 December
2017
31 December
2016 2017 2016
£ 0.8872 0.8562 0.8757 0.8227
Derivative financial instrumentsWessanen uses derivative financial instruments to hedge its exposure to foreign exchange, interest rate and commodity risks arising from operating, investing and financing activities. These instruments are initially recognised in the statement of financial position at fair value on a settlement date basis and are subsequently remeasured at their fair value. Gains and losses resulting from the fair value remeasurement are

91Wessanen Integrated Annual Report 2017
Sustainability ReportAbout us Financial Review,
Risk & Governance
Report of the Supervisory Board
Our marketplaceWelcome
Wessanen Integrated Annual Report 2017
Report of the Supervisory Board
Financial statements
Other information
REPORT OF THE EXCECUTIVE BOARD
Notes to the consolidated financial statements
recognised directly in the income statement, unless the derivative qualifies and is effective as a hedging instrument in a designated hedging relationship. Derivatives that are designated as hedges are accounted for as either cash flow hedges or fair value hedges. In both 2017 and 2016 Wessanen did not enter into any fair value hedges.
Gains and losses on derivative financial instruments are (ultimately) recognised in the income statement under financial income and expenses, except for the effective portion of those derivative financial instruments that are designated as hedges and entered into to mitigate operational risks. This portion is recognised in operating result.
HedgingCash flow hedgesIf a derivative financial instrument is designated as a hedge of the variability in cash flows of a recognised liability, a firm commitment or a highly probable forecasted transaction, the effective part of any gain or loss on the derivative financial instrument is recognised directly in other comprehensive income. When the firm commitment or forecasted transaction results in the recognition of an asset or liability, the cumulative gain or loss is removed from other comprehensive income and included in the initial measurement of the asset or liability. Otherwise, the cumulative gain or loss is removed from other comprehensive income and recognised in the income statement at the same time as the hedged transaction. The ineffective part of any gain or loss is immediately recognised in the income statement.
When a hedging instrument or hedge relationship is terminated, but the hedged transaction still is expected to occur, the cumulative gain or loss at that point remains in other comprehensive income and is recognised in the income statement in accordance with the above policy when the transaction occurs. If the hedged transaction is no longer expected to take place, the cumulative unrealised gain or
loss recognised in other comprehensive income is recognised immediately in the income statement.
Hedge of net investment in a foreign operationThe portion of the gain or loss on an instrument used to hedge a net investment in a foreign operation that is determined to be an effective hedge is recognised directly in other comprehensive income. The ineffective portion is recognised in the income statement.
Segment reportingAn operating segment is a component of Wessanen that engages in business activities from which it may earn revenues and incur expenses, including revenues and expenses that relate to transactions with any of the Company’s other components.
The operating segment’s operating result (EBIT) is reviewed regularly by the Executive Board of Wessanen to make decisions about resources to be allocated to the segment and assess the performance, and for which discrete financial information is available. The ‘Branded’ operating segment is managed by the ‘Executive Leadership Team (ELT)’. The members of the ELT are the Executive Board members, the directors Human Resources, Marketing & Quality and Operations and selected operating company general managers.
Segment results that are reported to the Executive Board of Wessanen include items directly attributable to a segment as well as those that can be allocated on a reasonable basis. Unallocated items mainly comprise part of the overhead expenses (corporate costs being shareholder and stewardship costs), financial income and expenses and income tax gains and losses. Corporate assets and liabilities and income tax assets and liabilities are excluded from segment assets and liabilities. Segment capital expenditure is the total cost incurred during the period to acquire property, plant and equipment, and intangible assets other than goodwill.
Property, plant and equipmentProperty, plant and equipment are stated at cost less accumulated depreciation and impairment losses. Cost includes expenditures that are directly attributable to the acquisition or construction of the asset.
Expenditure incurred to replace a component of an item of property, plant and equipment that is accounted for separately, including major inspection and overhaul expenditure, is capitalised. Other subsequent expenditure is capitalised only when it increases the future economic benefits embodied in the item of property, plant and equipment. All other expenditure is recognised in the income statement as an expense as incurred.
Depreciation is charged to the income statement on a straight-line basis over the estimated useful lives. Land is not depreciated. Where an item of property, plant or equipment comprises major components having different useful lives, these are accounted for as separate items of property, plant and equipment. Depreciation methods, useful lives, as well as residual values are re-assessed annually.
Assets not in use are recorded at the lower of their book value and recoverable amount.
The estimated useful lives of property, plant and equipment for the current and comparative period are as follows:
Buildings and offices 15 – 30 yearsMachinery and equipment 5 – 20 yearsIT equipment 3 – 5 yearsOther 3 – 5 years
Assets not in use and assets classified as held for sale are not depreciated.
92Wessanen Integrated Annual Report 2017
Sustainability ReportAbout us Financial Review,
Risk & Governance
Report of the Supervisory Board
Our marketplaceWelcome
Wessanen Integrated Annual Report 2017
Report of the Supervisory Board
Financial statements
Other information
REPORT OF THE EXCECUTIVE BOARD
Notes to the consolidated financial statements
Intangible assetsGoodwillAll business combinations are accounted for by applying the acquisition method as at the acquisition date. Goodwill represents amounts arising on acquisition of subsidiaries.
In respect of acquisitions that have occurred since 1 January 2010, goodwill represents the excess of the cost of the acquisition over the Group’s interest in the net fair value of the identifiable assets and liabilities and contingent liabilities at the date of acquisition (measured based on methods as described in Note 4). Costs related to the acquisition, other than those associated with the issue of debt or equity securities, that Wessanen incurs in connection with a business combination are expensed as incurred.
Goodwill is stated at cost less any accumulated impairment losses. Goodwill is allocated to cash-generating units and is not amortised but tested annually for impairment.
Brands and customer listsCapitalised brands and customer lists are measured at cost less accumulated amortisation and impairment losses. Brands and customer lists acquired in business acquisitions are initially measured at fair value.
The useful lives of brands have been determined on the basis of certain factors such as the economic environment, the expected use of the asset and related assets or groups of assets and legal or other provisions that might limit the useful life. Based on this assessment, the useful life is determined to be indefinite, since there is no foreseeable limit to the period of time over which the brands are expected to contribute to the cash flows of the Group. Capitalised brands with an indefinite life are not amortised, but tested annually for impairment.
Customer lists are amortised over their estimated useful lives of maximum 20 years.
Research and developmentExpenditure on research activities, undertaken with the prospect of gaining new scientific or technological knowledge and understanding, is recognised in the income statement as an expense when incurred.
Expenditure on development activities, of which research findings are applied to a plan or design for the production of new or substantially improved products and processes, is capitalised if development costs can be measured reliably, the product or process is technically and commercially feasible, future economic benefits are probable, and the Group intends to and has sufficient resources to complete development and to use or sell the asset. The expenditure capitalised includes the cost of materials, direct labour and overhead costs that are directly attributable to preparing the assets for its intended use. Other development expenditure is recognised in the income statement as an expense when incurred. Capitalised development expenditure is stated at cost less accumulated amortisation and accumulated impairment losses.
Other intangible assetsOther intangible assets that are acquired by Wessanen, which have finite useful lives, are stated at cost less accumulated amortisation and impairment losses.
Subsequent expenditureSubsequent expenditure on capitalised intangible assets is capitalised only when it increases the future economic benefits embodied in the specific asset to which it relates. All other expenditure is expensed as incurred.
AmortisationAmortisation is charged to the income statement on a straight-line basis over the estimated useful lives of intangible assets unless such lives are indefinite. Intangible assets are amortised from the date these are available for use. Residual useful life is re-assessed annually.
InventoriesInventories are stated at the lower of cost and net realisable value. The cost of inventories is based on the weighted average principle and includes expenditure incurred in acquiring the inventories and bringing them to their existing location and condition.
In the case of manufactured inventories and work in progress, cost includes an appropriate share of production overheads based on normal operating capacity. Inventory is valued net of vendor allowances if applicable.
Net realisable value is the estimated selling price in the ordinary course of business, less the estimated costs of completion and selling expenses.
Trade and other receivablesTrade and other receivables are stated at their amortised cost less impairment losses. Amortised cost is determined using the effective interest rate.
Cash and cash equivalents and bank overdraftsCash and cash equivalents comprise cash and bank balances and call deposits with original maturities of three months or less. Cash equivalents are only recognised when control over the possibility to convert to cash is transferred to or from Wessanen.
Bank overdrafts that are repayable on demand and form an integral part of Wessanen’s cash management are included as a component of net cash and cash equivalents for the purpose of the statement of cash flows.
Net cash and cash equivalents represent cash and cash equivalents, net of bank overdrafts.
Bank accounts are netted if the Company has a legal enforceable right to offset and offsetting takes place on a regular basis.
93Wessanen Integrated Annual Report 2017
Sustainability ReportAbout us Financial Review,
Risk & Governance
Report of the Supervisory Board
Our marketplaceWelcome
Wessanen Integrated Annual Report 2017
Report of the Supervisory Board
Financial statements
Other information
REPORT OF THE EXCECUTIVE BOARD
Notes to the consolidated financial statements
Impairment of assetsThe carrying amounts of Wessanen’s assets, other than inventories, financial assets and deferred tax assets, are reviewed at each balance sheet date to determine whether there is any indication of impairment. If any such indication exists, the asset’s recoverable amount is estimated. For intangible assets that are not yet available for use, the recoverable amount is estimated at each balance sheet date. An impairment loss is recognised whenever the carrying amount of an asset or its cash-generating unit exceeds its recoverable amount. A cash-generating unit is the smallest identifiable asset group that generates cash flows that largely are independent from other assets and groups. Impairment losses are recognised in the income statement.
Goodwill and brands with indefinite useful lives are subject to annual impairment testing, irrespective of whether indications of impairment exist.
Calculation of recoverable amountThe recoverable amount is the greater of an asset’s fair value less cost to sell and the asset’s value in use. In assessing value in use, the estimated future cash flows are discounted to their present value using a pre-tax discount rate that reflects current market assessments of the time value of money and the risks specific to the asset. For an asset that does not generate largely independent cash inflows, the recoverable amount is determined for the cash-generating unit to which the asset belongs.
Reversal of impairmentAn impairment loss in respect of goodwill is not reversed. In respect of other assets, an impairment loss is reversed when there is an indication that the impairment may no longer exist and when there has been a change in the estimates used to determine the recoverable amount.
An impairment loss is reversed only to the extent that the asset’s carrying amount does not exceed the carrying amount
that would have been determined, net of depreciation or amortisation, if no impairment loss had been recognised.
EquityIssued and paid-up capitalWessanen’s issued capital comprises of €1.00 par value common shares and is stated at nominal value.
DividendsDividends are recognised as a liability in the period in which they are declared.
Interest-bearing borrowingsInterest-bearing borrowings are recognised initially at fair value less attributable transaction costs. Subsequent to initial recognition, interest-bearing borrowings are stated at amortised cost with any difference between cost (excluding attributable transaction costs) and redemption value being recognised in the income statement over the period of the borrowings on an effective interest basis. Capitalised transaction respectively financing costs are amortised on a straight-line basis over the term of the facility.
Employee benefitsDefined contribution plansObligations for contributions to defined contribution pension plans are recognised as an expense in the income statement as incurred.
Defined benefit plansFor defined benefit retirement benefit plans, the cost of providing benefits is determined using the projected unit credit method, with actuarial valuations being carried out at the end of each annual reporting period. Remeasurement, comprising actuarial gains and losses, the effect of the changes to the asset ceiling (if applicable) and the return on plan assets (excluding interest), is reflected immediately in the statement of financial position with a charge or credit recognised in other comprehensive income in the period in which they occur.
Remeasurement recognised in other comprehensive income is reflected immediately in retained earnings and will not be classified to profit or loss.Past service cost is recognised in profit or loss in the period of a plan amendment. Net interest is calculated by applying the discount rate at the beginning of the period to the net defined benefit liability or asset. Defined benefit costs are categorised as follows:
– Service cost (including current service cost, past service cost, as well as gains and losses on curtailments and settlements);
– Net interest expense or income;
– Remeasurement.
Wessanen presents the first two components of defined benefit costs in profit or loss in the line item ‘personnel expenses’ and ‘other financial income and expense’ respectively. Curtailment gains and losses are accounted for as past service costs. The retirement benefit obligation recognised in the consolidated statement of financial position represents the actual deficit or surplus in Wessanen’s defined benefit plans. Any surplus resulting from this calculation is limited to the present value of any economic benefits available in the form of refunds from the plans or reductions in future contributions to the plans.
Long term service benefitsWessanen’s net obligation in respect of long term service benefits, other than pension plans, is the amount of the future benefit that employees have earned in return for their service in the current and prior periods. The obligation is calculated using the projected unit credit method and is discounted to its present value while the fair value of any related assets is deducted. The discount rate is the yield at balance sheet date on high-quality corporate bonds that have maturity dates approximating the terms of Wessanen’s obligations.

94Wessanen Integrated Annual Report 2017
Sustainability ReportAbout us Financial Review,
Risk & Governance
Report of the Supervisory Board
Our marketplaceWelcome
Wessanen Integrated Annual Report 2017
Report of the Supervisory Board
Financial statements
Other information
REPORT OF THE EXCECUTIVE BOARD
Notes to the consolidated financial statements
Share-based payment transactionsThe performance shares and matching shares programme grants conditional rights to receive shares to members of the Executive Board and other designated senior executives of Wessanen (equity-settled share-based payment transactions). As from 2017, the performance shares programme also grants conditional rights to receive shares to other eligible employees of Wessanen. In the fourth quarter of 2017, the terms and conditions of the running performance incentive right plans 2015 and 2016 were modified that changed the classification of these plans from cash-settled to equity-settled.
For equity-settled share-based payment transactions, the grant date fair value of share-based compensation plans is expensed, with a corresponding increase in equity, on a straight-line basis over the vesting periods of the grants. The cumulative expense recognised at each balance sheet date reflects the extent to which the vesting period has expired and the Company’s best estimate of the number of shares that will eventually vest. No expense is recognised for awards that do not ultimately vest, except for awards where vesting is conditional upon a market condition (e.g. total shareholder return), which are treated as vested irrespective of whether or not the market condition is satisfied, provided that all non-market conditions (e.g. Return on Invested Capital (‘ROIC’), Earnings Before Interest, Taxation and Exceptional items (‘EBITE’) as a percentage of revenue, and continued employment) are satisfied. ProvisionsA provision is recognised in the statement of financial position if, as a result of a past event, the Group has a present legal or constructive obligation that can be estimated reliably, and it is probable that an outflow of economic benefits will be required to settle the obligation.
If the effect is material, provisions are determined by discounting the expected future cash flows at a pre-tax rate that reflects current market assessments of the time value of money and, where appropriate, the risks specific to the liability.
A restructuring provision is recognised when certain criteria are met. Such criteria include the existence of a detailed formal plan that identifies at least the business or part of the business concerned, the principal location(s) affected, the approximate number of employees whose employment contracts will be terminated, the estimated costs and the timing of when the plan will be implemented. Furthermore, the Company must have raised a valid expectation with those affected that it will carry out the restructuring, by starting to implement that plan or announcing its main features to those affected by it. Future operating costs are not provided for.
Trade and other payablesTrade and other payables are stated at amortised cost. Amortised cost is determined using the effective interest rate.
RevenueRevenue represents the value of goods delivered to third parties, less any value-added tax or other sales tax. Revenue is recognised in the income statement when the significant risks and rewards of ownership have been transferred to the buyer. Customer deductions, coupons, rebates, and sales returns and discounts are recorded as reductions to sales and are included in revenue in the consolidated income statement.
Fair value of the consideration received or receivable is allocated between (1) the goods and/or services purchased and delivered and (2) the award credits that will be redeemed in the future, if applicable. The consideration allocated to the award credits is presented as ‘deferred revenue’ in the statement of financial position. No revenue is recognised if there are significant uncertainties regarding recovery of the consideration due, associated costs or the possible return of goods.
ExpensesOperating lease paymentsPayments made under operating leases are recognised in the income statement on a straight-line basis over the term of the lease.
Net financing costsNet financing costs comprise interest payable on borrowings calculated using the effective interest rate method, commitment, utilisation and agency fees, amortisation of capitalised financing costs, losses on unwinding the discount on provisions, interest expense related to defined benefit plans, foreign exchange gains and losses, and gains and losses on hedging instruments that are recognised in the income statement.
Income taxIncome tax expense comprises current and deferred tax. Income tax expense is recognised in the income statement except to the extent that it relates to items recognised directly in equity, in which case it is recognised in equity.
Current tax is the expected tax payable on the taxable income for the year, using tax rates enacted or substantially enacted at the balance sheet date, and any adjustments to current tax payable in respect of previous years. Provisions for uncertain tax positions are reported under the income tax payables.
Deferred tax is recognised using the statement of financial position liability method, providing for temporary differences between the carrying amounts of assets and liabilities for financial reporting purposes and the amounts used for taxation purposes. Deferred tax liabilities are generally recognised for all taxable temporary differences. Deferred tax assets and liabilities are not recognised for temporary differences arising from the initial recognition of goodwill. Deferred tax is measured at tax rates that are expected to be applied to the temporary differences when they reverse, based on the

95Wessanen Integrated Annual Report 2017
Sustainability ReportAbout us Financial Review,
Risk & Governance
Report of the Supervisory Board
Our marketplaceWelcome
Wessanen Integrated Annual Report 2017
Report of the Supervisory Board
Financial statements
Other information
REPORT OF THE EXCECUTIVE BOARD
Notes to the consolidated financial statements
laws that have been enacted or substantively enacted at the balance sheet date.
Deferred tax assets, including deferred tax assets for tax loss carry-forwards, are recognised to the extent that the Company has sufficient taxable temporary differences or it is probable that future taxable profits will be available (over a five-year horizon) against which deductible temporary differences can be utilised and deferred tax assets realised. The recoverable amount of deferred tax assets is reviewed at each balance sheet date and reduced to the extent that it is no longer probable that sufficient taxable income will be available to allow all or part of the asset to be recovered. Deferred tax assets and liabilities are not discounted.
Additional income tax that arise from the distribution of dividends are recognised at the same time as the liability to pay the related dividend is recognised.
Deferred tax assets and liabilities are offset in the balance sheet when there is a legally enforceable right to offset current tax assets against current tax liabilities and when the deferred income tax is levied by the same fiscal authority.
Statement of cash flowsCash flows from operating activitiesCash flows from operating activities are calculated by the indirect method, by adjusting the consolidated operating result of Wessanen for expenses that are not cash flows (such as amortisation, depreciation and impairments), and for autonomous movements in consolidated working capital (respectively excluding the impact from acquisitions, divestments and foreign currency differences). Cash payments to employees and suppliers are all recognised as cash flows from operating activities. Operating cash flows also include costs of financing operating activities, income tax paid on all activities, and spending on restructuring and other provisions.
Cash flows from investing activitiesCash flows from investing activities are those arising from net capital expenditure and from the acquisition and sale of subsidiaries and businesses. Cash and cash equivalents (net of bank overdrafts) available at the time of acquisition or sale are deducted from the related payments or proceeds.
Cash flows from financing activitiesCash flows from financing activities comprise the cash receipts and payments from dividend, debt instruments and derivatives. Cash flows from short term financing are also included.
Cash receipts and payments from derivative financial instruments are classified in the same manner as the cash flows of the hedged items. Cash flows in foreign currencies are translated into Euro at foreign exchange rates ruling at the date of transaction.
New standards and interpretations not yet effectiveA number of new standards, amendments to standards and interpretations is effective for annual periods beginning after 1 January 2017, and have not been applied in preparing these consolidated financial statements.
IFRS 9 ‘Financial Instruments’, published in July 2014, is effective for annual periods beginning on or after 1 January 2018. IFRS 9 includes revised guidance on classification and measurement of financial instruments, including a new expected credit loss model for calculating impairment on financial assets, and new general hedge accounting requirements. Wessanen will adopt IFRS 9 as per 1 January 2018. The Company expects that the adoption of IFRS 9 will have only limited impact on the consolidated financial statements, as the number and size of hedging contracts entered into are limited (see Note 24). In addition, the impact of the implementation of the new impairment model on the Company’s allowance for impairments on trade receivables (the Company’s main financial asset) is expected to be limited, as the default rate incurred respectively expected is rather low (see Note 24).
In case the adoption of IFRS 9 would result in any changes in the carrying amounts of the financial assets and liabilities as per 1 January 2018, this will be recognised against equity.
In May 2014, IFRS 15 ‘Revenue from contracts with customers’ was published. According to the new standard, revenue is recognised to depict the transfer of promised goods or services to a customer in an amount that reflects the consideration to which the Company expects to be entitled in exchange for those goods or services. Revenue is recognised when, or as, the customer obtains control of the goods or services. IFRS 15 also includes guidance on the presentation of contract balances, that is, assets and liabilities arising from contracts with customers, depending on the relationship between the entity’s performance and the customer’s payment. In addition, the new standard requires a set of quantitative and qualitative disclosures to enable users of the Company’s consolidated financial statements to understand the nature, amount, timing and uncertainty of revenue and cash flows arising from contracts with customers. IFRS 15 supersedes IAS 11 ‘Construction contracts’ and IAS 18 ‘Revenue’ as well as related interpretations. The standard is effective for annual periods beginning on or after 1 January 2018. Based on internal review procedures, Wessanen concluded that the application of IFRS 15 will not have a significant effect on the consolidated financial statements, partly as a result of the nature of the industry Wessanen is operating in, being the ‘consumer goods–food products’ industry. Wessanen concluded that IFRS 15 will impact the presentation in the income statement of ‘coupon expenses incurred and paid to consumers’. These expenses, amounting to €1.5 in 2017, are currently classified as ‘other operating expenses’, but should be classified as a reduction of ‘revenue’ under IFRS 15 as from 1 January 2018. In our 2018 reporting, ‘coupon expenses incurred and paid to consumers’ will be classified as a reduction of ‘revenue’; the 2017 comparatives will be restated accordingly.
IFRS 16 ‘Leases’ was published in January 2016 and is effective for annual periods beginning on or after 1 January 2019;

96Wessanen Integrated Annual Report 2017
Sustainability ReportAbout us Financial Review,
Risk & Governance
Report of the Supervisory Board
Our marketplaceWelcome
Wessanen Integrated Annual Report 2017
Report of the Supervisory Board
Financial statements
Other information
REPORT OF THE EXCECUTIVE BOARD
Notes to the consolidated financial statements
early application is permitted. IFRS 16 ‘Leases’, eliminates the current dual accounting model for lessees under IAS 17, which distinguishes between on-balance sheet finance leases and off-balance sheet operating leases. Instead, IFRS 16 requires a lessee to recognise a right of use asset and a lease liability at lease commencement for all leases, except for short-term leases and leases of low value assets. Wessanen anticipates that the application of IFRS 16 will have a significant effect on its reported assets and liabilities, operating and financing expenses, and cash flows from operating and financing activities. However, it is not practicable to provide a reasonable estimate of the effect of IFRS 16 until a detailed review has been completed. As an indication only, reference is made to Note 25: ‘Commitments and contingencies’, in which the total of non-cancellable operating lease commitments at year-end and operating lease expenses for the year are disclosed. Wessanen will adopt this standard as from 1 January 2019, and will apply the modified retrospective approach. The adoption of IFRS 16 will not affect the Group’s ability to satisfy the bank covenants, as described in Note 20.
4. Determination of fair valueA number of the Group’s accounting policies and disclosures requires the determination of fair value, for both financial and non-financial assets and liabilities. Fair values have been determined for measurement and/or disclosure purposes based on the following methods. When applicable, further information about the assumptions made in determining fair values is disclosed in the notes specific to that asset or liability.
Property, plant and equipmentThe fair value of property, plant and equipment recognised as a result of a business combination is based on market prices for similar items when available, and replacement cost when appropriate.
Intangible assetsThe fair value of brands acquired in a business combination is based on the ‘relief from royalty’ method, whereby estimated royalty payments that have been avoided as a result of the brand being owned are discounted, or determined using the multi-period excess earnings method. The fair value of customer lists acquired in a business combination is determined using the multi-period excess earnings method, whereby the subject asset is valued after deducting a fair return on all other assets that are part of creating the related cash flows. The fair value of other intangible assets is based on the discounted cash flows expected to be derived from the use and eventual sale of the assets.
InventoriesThe fair value of inventories acquired in a business combination is determined based on its estimated selling price in the ordinary course of business less the estimated costs of completion and sale, and a reasonable profit margin based on the effort required to complete and sell the inventories.
Trade and other receivablesThe fair value of trade and other receivables is estimated as the present value of future cash flows, discounted at the market rate of interest at the reporting date.
DerivativesThe fair value of forward exchange contracts is based on their listed market price, if available. If a listed market price is not available, then fair value is estimated by discounting the difference between the contractual forward price and the current forward price for the residual maturity of the contract using a risk-free interest rate (based on government bonds).
Non-derivative financial liabilitiesFair value, which is determined for disclosure purposes, is calculated based on the present value of future principal and
interest cash flows, discounted at the market rate of interest at the reporting date.
Share-based payment transactionsThe fair value of performance shares is recognised as personnel expense over the vesting period of the performance shares with a corresponding increase in equity. The fair value of performance shares is measured at grant date and spread over the period during which the employees become unconditionally entitled to the performance shares. The fair value of the performance shares granted is: (a) for the portion of the grant (= 50%) subject to the Total Shareholder Return (‘TSR’) performance condition measured using a Monte Carlo simulation model, taking into account the terms and conditions upon which the instruments were granted and (b) for the portion of the grant (= 50%) subject to the Return on Invested Capital (‘ROIC’) performance condition measured based on the Wessanen share price at grant date.
5. AcquisitionsIn 2017 Wessanen made no acquisitions.
The allocation of the purchase consideration paid in respect of the Biogran acquisition in 2016 could not be completed in time, due to the fact that the acquisition was only done in December 2016. Of the initial goodwill recognised of €62.8 (see Wessanen Annual Report 2016, page 92) an amount of €16.6 has been allocated to (a) the trade names El Granero (€8.8) and Ecocesta (€9.4), (b) customer lists (€3.9) and (c) the related deferred tax liabilities (€(5.5)) in 2017. Accordingly, after completion of the purchase price allocation, the goodwill on the Biogran acquisition amounts to €46.2.

97Wessanen Integrated Annual Report 2017
Sustainability ReportAbout us Financial Review,
Risk & Governance
Report of the Supervisory Board
Our marketplaceWelcome
Wessanen Integrated Annual Report 2017
Report of the Supervisory Board
Financial statements
Other information
REPORT OF THE EXCECUTIVE BOARD
Notes to the consolidated financial statements
6. Segment informationThe accounting policies used for the segments are the same as the accounting policies applied in the consolidated financial statements as described in Note 3.
Segment Significant operating companies
Branded Bjorg et Compagnie, Bonneterre et Compagnie, Destination1, Wessanen Benelux, Kallø Foods, Bio Slym, Abafoods, Allos Hof-Manufaktur, Allos Schwarzwald, Allos, Biogran2.
Non-Allocated Corporate entities
1 Destination is a wholly owned subsidiary of Ineobio which was acquired as per 1 June 2016.
2 Acquired as per 5 December 2016.
2016In € millions Branded
Nonallocated
Total Wessanen
Income statement informationRevenue 570.0 – 570.0 Operating result (EBIT) 37.9 (3.6) 34.3 Net financing costs (1.8)Profit/(loss) before income tax 32.5
Statement of financial positionAssets Assets related to operations 442.3 7.2 449.5 Deferred and current income tax 4.2 5.0 9.2
Total assets 446.5 12.2 458.7
Liabilities Liabilities related to operations 155.8 98.2 254.0 Deferred and current income tax 13.2 0.3 13.5
Total liabilities 169.0 98.5 267.5
Other informationInvestments in PP&E and IA1 5.0 2.3 7.3 Depreciation, amortisation 5.9 1.7 7.6 Impairments 0.2 – 0.2 Total other non-cash items2 6.3 5.9 12.2 Average capital employed 209.0 9.4 218.4 Average number of employees 947 46 993 1 Investments in property, plant and equipment (‘PP&E’) and intangible assets (‘IA’).
2 Total of provisions recognised, results from disposals, and equity-settled share-based payment expenses as reflected in the consolidated statement of cash flows.
3 Non-allocated consists of corporate entities.
3

98Wessanen Integrated Annual Report 2017
Sustainability ReportAbout us Financial Review,
Risk & Governance
Report of the Supervisory Board
Our marketplaceWelcome
Wessanen Integrated Annual Report 2017
Report of the Supervisory Board
Financial statements
Other information
REPORT OF THE EXCECUTIVE BOARD
Notes to the consolidated financial statements
2017In € millions Branded
Nonallocated
Total Wessanen
Income statement informationRevenue 625.8 – 625.8 Operating result (EBIT) 52.0 (3.3) 48.7 Net financing costs (1.9)Profit/(loss) before income tax 46.8
Statement of financial positionAssetsAssets related to operations 460.8 8.4 469.2 Deferred and current income tax 2.8 5.0 7.8
Total assets 463.6 13.4 477.0
LiabilitiesLiabilities related to operations 164.7 70.1 234.8 Deferred and current income tax 14.5 – 14.5
Total liabilities 179.2 70.1 249.3
Other information Investments in PP&E and IA 1 9.9 2.4 12.3 Depreciation, amortisation 7.0 2.0 9.0 Impairments 0.9 – 0.9 Total other non-cash items 2 3.6 5.5 9.1 Average capital employed 304.9 4.1 309.0 Average number of employees 1,141 47 1,188 1 Investments in property, plant and equipment (‘PP&E’) and intangible assets (‘IA’).
2 Total of provisions recognised, results from disposals, and equity-settled share-based payment expenses as reflected in the consolidated statement of cash flows.
3 Non-allocated consists of corporate entities.
3

99Wessanen Integrated Annual Report 2017
Sustainability ReportAbout us Financial Review,
Risk & Governance
Report of the Supervisory Board
Our marketplaceWelcome
Wessanen Integrated Annual Report 2017
Report of the Supervisory Board
Financial statements
Other information
REPORT OF THE EXCECUTIVE BOARD
Notes to the consolidated financial statements
Geographical informationIn € millions
RevenueAverage number
of FTEs Non-current assets
2017 2016 2017 2016
31 December
2017
31 December
2016
The Netherlands (country of domicile) 46.0 43.6 98 96 17.6 17.4
France 357.7 335.6 465 404 53.5 51.2 United Kingdom 80.0 77.2 144 132 51.1 47.0 Germany 46.3 47.4 205 229 19.1 18.5 Italy 21.0 22.7 144 122 54.7 56.4 Spain 37.6 7.2 132 10 69.0 64.0 Other countries 37.2 36.3 – – – –
Total Group 625.8 570.0 1,188 993 265.0 254.5 1 Property, plant and equipment and intangible assets.
Revenue by product categoryIn € millions 2017 2016
Core categories 473.6 423.1Other categories 152.2 146.9
Total Group 625.8 570.0
Wessanen defined the following six core product categories: Dairy Alternatives, Sweet in Between, Bread and Biscuits Alternatives, Veggie Meals, Breakfast Cereals and Hot Drinks. Core categories have been defined to give focus in product development and to allow to leverage successful mixes across countries and brands. In both 2017 and 2016 the following (core) product categories represent more than 10% of Wessanen’s total revenue: Dairy Alternatives, Sweet in Between, Hot Drinks and Veggie Meals.
Wessanen has no customers that represent revenue of greater than 10% of Wessanen’s total revenue.
1

100Wessanen Integrated Annual Report 2017
Sustainability ReportAbout us Financial Review,
Risk & Governance
Report of the Supervisory Board
Our marketplaceWelcome
Wessanen Integrated Annual Report 2017
Report of the Supervisory Board
Financial statements
Other information
REPORT OF THE EXCECUTIVE BOARD
Notes to the consolidated financial statements
7. Personnel expenses and remuneration key managementPersonnel expensesIn € millions 2017 2016
Salaries and wages 55.6 51.3 Severance payments and termination benefits1 3.0 4.8 Social security 12.7 12.3 Defined contribution plans2 3.5 3.1 Defined benefit plans2 0.4 0.3 Share-based payment expenses3 4.5 5.4 Other personnel expenses 16.8 14.5
Total personnel expenses 96.5 91.7 1 Severance payments and termination benefits mainly comprise additions to restructuring provisions as described in Note 22.
2 See Note 21.
3 See Note 8.
The average number of full-time employees in 2017 amounted to 1,188 (2016: 993). In the Netherlands, Wessanen employed on average 98 (2016: 96) full-time employees. The increase in the average number of full-time employees is mainly driven by the impact of the first full year inclusion in 2017 of the businesses acquired by Wessanen in 2016. Severance payments and termination benefits in 2017 of €3.0, mainly relate to the announced relocation of the distribution centre of Bonneterre et Compagnie (France). Severance payments and termination in 2016 of €4.8, mainly related to the sourcing units Allos and Allos Schwarzwald, to streamline the German operations and to downsize the Allos plant.
Remuneration of key managementKey management are those persons having authority and responsibility for planning, directing and controlling the activities of the Company as a whole. The Company determined that key management consist of the members of the Executive Board and the members of the Supervisory Board. The total remuneration of key management in 2017 amounts to €2,513 thousand (2016: €2,346 thousand, including a release from a tax provision made of €136 thousand relating to contract termination benefits provided to Mr Merckens (former CEO of Wessanen)). The total remuneration of the members of the Executive Board and Supervisory Board is specified in the tables below.

101Wessanen Integrated Annual Report 2017
Sustainability ReportAbout us Financial Review,
Risk & Governance
Report of the Supervisory Board
Our marketplaceWelcome
Wessanen Integrated Annual Report 2017
Report of the Supervisory Board
Financial statements
Other information
REPORT OF THE EXCECUTIVE BOARD
Notes to the consolidated financial statements
Executive Board remuneration expenses
In € thousands Direct remuneration Deferred remuneration Total
2016 SalaryShort termbonuses Other
Total direct remuneration
Share-basedcompensation
Pension costs
Total remune-
ration
Remuneration expensesC.P.J. Barnouin 410 314 95 819 385 50 1,254 R.J.J.B. Merckx 359 220 50 629 279 87 995 Sub-total 769 534 145 1,448 664 137 2,249 Former employee expenses 4 – – (136) (136) – – (136)
Total 769 534 9 1,312 664 137 2,113
2017
Remuneration expensesC.P.J. Barnouin 419 251 92 762 455 54 1,271 R.J.J.B. Merckx 367 175 56 598 306 95 999 Sub-total 786 426 148 1,360 761 149 2,270 Former employee expenses – – – – – – –
Total 786 426 148 1,360 761 149 2,270
1 Short term bonuses relate to the performance in the year reported and are to be paid in the subsequent year. Each member of the Executive Board may choose to invest part of the short term bonus in shares; these shares will be matched in accordance with the Share Matching plan.
2 Other compensation mainly includes social security charges, contributions to health and medical insurances, company car expenses, fixed expense allowances for business purposes and housing.
3 Share-based compensation represents the share-based compensation expense calculated under IFRS 2 related to share rights granted to the Executive Board. The fair value of the share-based compensation grants at the grant date is expensed on a straight-line basis over the vesting period of the grants. The share-based payment expenses relating to Mr Barnouin of €455 thousand (2016: €385 thousand) can be specified into expenses relating to performance share rights granted of €252 thousand (2016: €243 thousand), matching shares granted of €100 thousand (2016: €68 thousand) and extraordinary (one-off) share rights granted of €103 thousand (2016: €74 thousand). The share-based payment expenses relating to Mr Merckx in 2017 of €306 thousand (2016: €279 thousand) can be specified into expenses relating to performance share rights granted of €182 thousand (2016: €203 thousand) and matching shares granted of €124 thousand (2016: €76 thousand).
4 Former employee expenses in 2016 of €(136) thousand related to a release from the tax provision relating to contract termination benefits provided to Mr Merckens (former CEO of Wessanen).
The remuneration for the members of the Executive Board comprises a base salary and related pension benefits, and, subject to meeting performance criteria, a short term bonus and a long term equity based component. The short term bonus can be paid out in cash or as an investment in matching shares. The main elements of the Remuneration Policy are described in the Remuneration Report (pages 79-81). The members of the Executive Board participate in the Wessanen Pension Plan. The Wessanen Pension Plan for corporate staff in the Netherlands comprises a basic scheme (with a maximum pension salary of €85 thousand) and a surplus scheme (above the amount of €85 thousand). Both schemes qualify as a defined contribution system.
1 2 3

102Wessanen Integrated Annual Report 2017
Sustainability ReportAbout us Financial Review,
Risk & Governance
Report of the Supervisory Board
Our marketplaceWelcome
Wessanen Integrated Annual Report 2017
Report of the Supervisory Board
Financial statements
Other information
REPORT OF THE EXCECUTIVE BOARD
Notes to the consolidated financial statements
Short term bonuses to members of the Executive Board are granted according to performance criteria which in 2017 were based on earnings before interest, taxation and exceptional items (‘EBITE’), revenue, primary working capital days and personal targets (for 30%, 30%, 10% and 30% respectively).
As the minimum EBITE target for 2017 was met, both Mr Barnouin and Mr Merckx will be awarded a pay-out related to the financial targets of 73.8%. As personal targets of both Mr Barnouin and Mr Merckx were fully met, the pay-out related to personal agenda items will be 150% of the total target incentive, being 45%. In total the 2017 target realisation amounts to 118.8% (2016: 152.7%). Accordingly, the short term bonus pay-out to Mr Barnouin and Mr Merckx amounted to 59.4% (based on the incentive reward at target of 50% of base salary) and 47.5% (based on the incentive reward at target of 40% of base salary) respectively. Share rights were granted in 2017 under vesting conditions based on a three-year service period and performance hurdles for the total test period of three years. Based on this plan, Wessanen granted share rights to members of the Executive Board in 2017. In addition, Mr Merckx opted to invest part of the short term bonus 2016 in shares, resulting in a grant of 7,654 matching shares (following the short term bonus 2015 investment, Mr Barnouin and Mr Merckx were granted 18,265 and 9,150 matching shares respectively). Further reference is made to Note 8: Share-based payments and the Remuneration Report (pages 79-81). In the Annual General Meeting on 14 April 2016, Mr Barnouin was granted a one-off award of 42.917 share rights. This share grant will vest on 1 April 2020 in case (i) Mr Barnouin is still, on that date, member of the Executive Board in the position of Chief Executive Officer and (ii) Mr Barnouin has not given notice to terminate the relationship with Wessanen on or before 1 April 2020.
Supervisory Board remuneration expenses
In € thousands Fixed Other compensation1 Total
2017 2016 2017 2016 2017 2016
R.K. Kluiber 2 60 60 3 3 63 63 P.E.M. Mispolet 3 55 32 3 2 58 34 F. van Oers 4 65 65 4 4 69 69 I.M.C.M. Rietjens 5 50 50 3 3 53 53 M.M. van Zuijlen 6 – 13 – 1 – 14
Total 230 220 13 13 243 233 1 Other compensation includes expense allowances.
2 R.K. Kluiber was appointed as Chairman of the Audit Committee on 24 January 2014, and as Chairman of the SARC on 27 November 2015.
3 P.E.M. Mispolet was appointed as member of the Supervisory Board on 14 April 2016. In 2017, Mr Mispolet received fixed compensation of €5 thousand relating to 2016.
4 F. Van Oers was appointed as Chaiman of the Supervisory Board on 24 January 2014.
5 I.M.C.M. Rietjens was appointed as Chairman of the NSFC on 17 April 2012.
6 M.M. Van Zuijlen resigned from the Supervisory Board on 14 April 2016.

103Wessanen Integrated Annual Report 2017
Sustainability ReportAbout us Financial Review,
Risk & Governance
Report of the Supervisory Board
Our marketplaceWelcome
Wessanen Integrated Annual Report 2017
Report of the Supervisory Board
Financial statements
Other information
REPORT OF THE EXCECUTIVE BOARD
Notes to the consolidated financial statements
Members of the Supervisory Board each received a fixed compensation of €45 thousand in both 2017 and 2016, excluding expenses. The Chairman of the Supervisory Board was awarded an additional fee of €20 thousand, the Chairman of the Audit Committee was awarded an additional fee of €10 thousand and the Chairman of the SARC and NFSC were each awarded an additional fee of €5 thousand in both 2017 and 2016 as well. The proportionate amounts are included above, if applicable. No loans, advances or related guarantees were provided to the present or former members of the Executive Board or the Supervisory Board.
8. Share-based paymentsMain characteristics The purpose of the share-based compensation plans is to reward eligible employees for their contribution, loyalty and commitment to Wessanen and to align the interests of eligible employees with those of shareholders by providing incentives to improve the Company’s performance on a long term basis, thereby increasing shareholder value.
In 2017, it was decided by the Selection, Appointment and Remuneration Committee (SARC) to modify the running (extraordinary) performance incentive rights plans for the years 2015 and 2016 from cash-settled to equity-settled share-based compensation plans effectively as from 1 October 2017. Accordingly, the Company has the following running plans as from that date: – Performance share plan: rights to receive shares in the future based on performance and service conditions (equity-settled share-based payments).
– Share matching plan: rights to receive matching shares in the future based on performance and service conditions (equity-settled share-based payments).
– Extraordinary performance share plan: rights to receive shares in the future based on service conditions only (equity-settled share-based payments).
In 2015, the share matching plan was introduced following the implementation of share ownership guidelines for executives. In order to increase the alignment of the members of the Executive Board and designated other senior executives with the interest of shareholders, members of the Executive Board and other senior executives are required to build up share ownership of Wessanen, equal to the value of 100% respectively 50% of their annual gross base salary, within four years. Based on the share matching plan, members of the Executive Board and other senior executives can invest part of their short term incentives in Wessanen shares, which under certain conditions, may have such shares matched by the Company. Delivery of shares generally depends on the achievement of performance hurdles (for a three-year test period ending at 31 December in the third year), in addition to a three year service condition (as from grant date). If a participant ceases to be employed by the Group for any other reason than death, disability or retirement, before the vesting date, all shares granted lapse automatically unless otherwise decided by the Supervisory Board or Executive Board.

104Wessanen Integrated Annual Report 2017
Sustainability ReportAbout us Financial Review,
Risk & Governance
Report of the Supervisory Board
Our marketplaceWelcome
Wessanen Integrated Annual Report 2017
Report of the Supervisory Board
Financial statements
Other information
REPORT OF THE EXCECUTIVE BOARD
Notes to the consolidated financial statements
The two equally weighted performance conditions for the Long Term Incentive Plan 2015, 2016 and 2017 are (a) the market condition: relative Total Shareholder Return (‘TSR’) and (b) the non-market condition: Return on Invested Capital (‘ROIC’). The performance condition for the Share Matching plans 2015, 2016 and 2017 is a (non-market) financial performance condition, defined as an EBITE percentage of revenue realised in the third year.
At target performance, 100% of the awarded rights vests. At threshold performance, 50% of the awarded rights vests. At maximum performance, 150% of the awarded rights vests. ROIC performance between the performance hurdles defined will be measured on a linear scale.
All costs of the plans are borne by the Group; any and all tax which arise are for the sole risk and account of the eligible employee.
Fair value of performance shares The fair value of performance shares granted to the Executive Board and Other employees is for the portion of the grant (= 50%) subject to the Total Shareholder Return (‘TSR’) performance condition measured based on a Monte Carlo simulation model. The model inputs for the valuation of the share rights granted to the members of the Executive Board and Other employees can be specified as follows:
20174 20173 20172 20162
Date of grant respectively modification 1 October
2017 1 October
2017 1 May
2017 1 May
2016 Share price at grant respectively modification date 15.90 15.90 13.70 9.02 Expected volatility 25.0% 21.0% 30.0% 30.0%Term (in years) 1 1.6 0.7 3.0 3.0 Expected dividend 0.13 - 0.14 0.13 0.13 - 0.15 0.14 - 0.18 Risk free interest rate -0.17% -0.24% -0.04% -0.10%Fair value at measurement date 16.97 21.40 9.44 5.39
1 Best practice provision II.2.5, which provides that shares granted without financial consideration must be retained for at least 5 years or until at least the end of the employment, will not be applied. In view of the parallel requirement to build up and hold on to a significant portfolio of Wessanen shares under Wessanen’s amended remuneration policy, members of the Executive Board may, at all times sell shares provided that the share ownership guidelines are met. Furthermore, members of the Executive Board may sell shares if to pay wage withholding taxes in connection with the delivery of shares related to such grant of shares.
2 Performance share plan 2016 and 2017 respectively.
3 Performance incentive right plan 2015 modified from cash-settled to equity-settled as per 1 October 2017.
4 Performance incentive right plan 2016 modified from cash-settled to equity-settled as per 1 October 2017.
The expected volatility has been determined based on the historic volatility, adjusted for any expected changes to future volatility due to publicly available information.
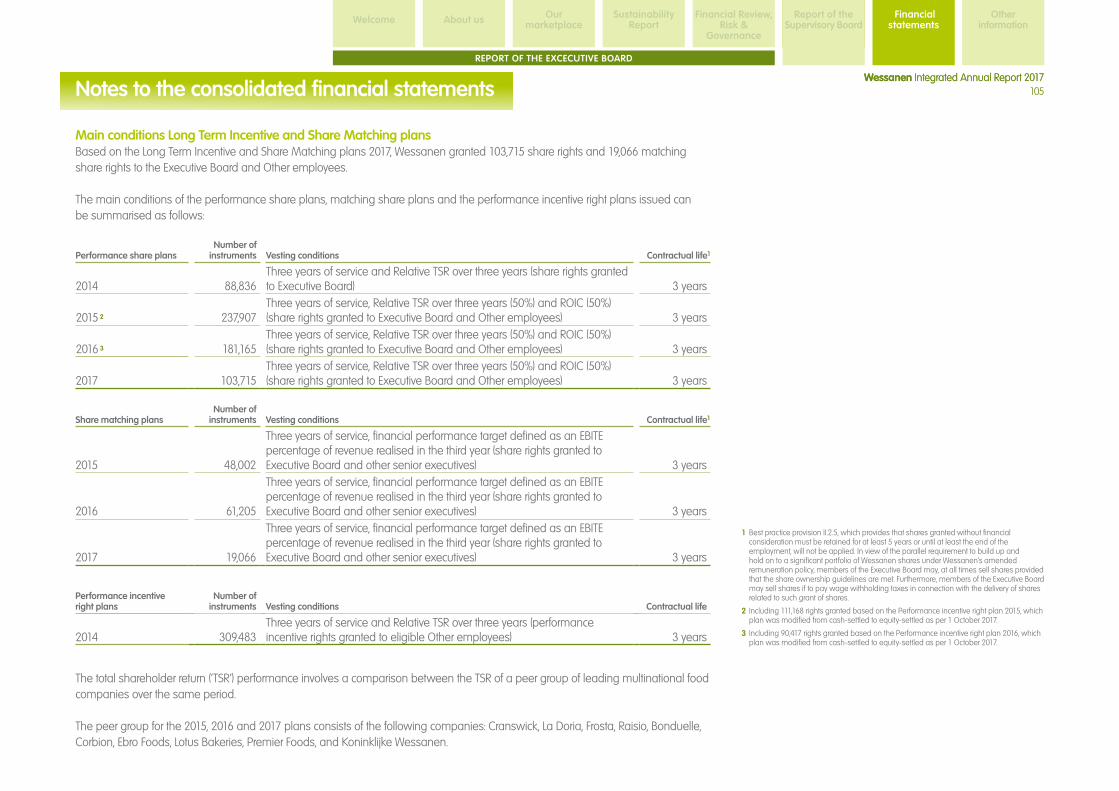
105Wessanen Integrated Annual Report 2017
Sustainability ReportAbout us Financial Review,
Risk & Governance
Report of the Supervisory Board
Our marketplaceWelcome
Wessanen Integrated Annual Report 2017
Report of the Supervisory Board
Financial statements
Other information
REPORT OF THE EXCECUTIVE BOARD
Notes to the consolidated financial statements
Main conditions Long Term Incentive and Share Matching plans Based on the Long Term Incentive and Share Matching plans 2017, Wessanen granted 103,715 share rights and 19,066 matching share rights to the Executive Board and Other employees. The main conditions of the performance share plans, matching share plans and the performance incentive right plans issued can be summarised as follows:
Performance share plansNumber of
instruments Vesting conditions Contractual life1
2014 88,836 Three years of service and Relative TSR over three years (share rights granted to Executive Board) 3 years
2015 2 237,907 Three years of service, Relative TSR over three years (50%) and ROIC (50%) (share rights granted to Executive Board and Other employees) 3 years
2016 3 181,165 Three years of service, Relative TSR over three years (50%) and ROIC (50%) (share rights granted to Executive Board and Other employees) 3 years
2017 103,715 Three years of service, Relative TSR over three years (50%) and ROIC (50%) (share rights granted to Executive Board and Other employees) 3 years
Share matching plansNumber of
instruments Vesting conditions Contractual life1
2015 48,002
Three years of service, financial performance target defined as an EBITE percentage of revenue realised in the third year (share rights granted to Executive Board and other senior executives) 3 years
2016 61,205
Three years of service, financial performance target defined as an EBITE percentage of revenue realised in the third year (share rights granted to Executive Board and other senior executives) 3 years
2017 19,066
Three years of service, financial performance target defined as an EBITE percentage of revenue realised in the third year (share rights granted to Executive Board and other senior executives) 3 years
Performance incentive right plans
Number of instruments Vesting conditions Contractual life
2014 309,483 Three years of service and Relative TSR over three years (performance incentive rights granted to eligible Other employees) 3 years
The total shareholder return (‘TSR’) performance involves a comparison between the TSR of a peer group of leading multinational food companies over the same period. The peer group for the 2015, 2016 and 2017 plans consists of the following companies: Cranswick, La Doria, Frosta, Raisio, Bonduelle, Corbion, Ebro Foods, Lotus Bakeries, Premier Foods, and Koninklijke Wessanen.
1 Best practice provision II.2.5, which provides that shares granted without financial consideration must be retained for at least 5 years or until at least the end of the employment, will not be applied. In view of the parallel requirement to build up and hold on to a significant portfolio of Wessanen shares under Wessanen’s amended remuneration policy, members of the Executive Board may, at all times sell shares provided that the share ownership guidelines are met. Furthermore, members of the Executive Board may sell shares if to pay wage withholding taxes in connection with the delivery of shares related to such grant of shares.
2 Including 111,168 rights granted based on the Performance incentive right plan 2015, which plan was modified from cash-settled to equity-settled as per 1 October 2017.
3 Including 90,417 rights granted based on the Performance incentive right plan 2016, which plan was modified from cash-settled to equity-settled as per 1 October 2017.
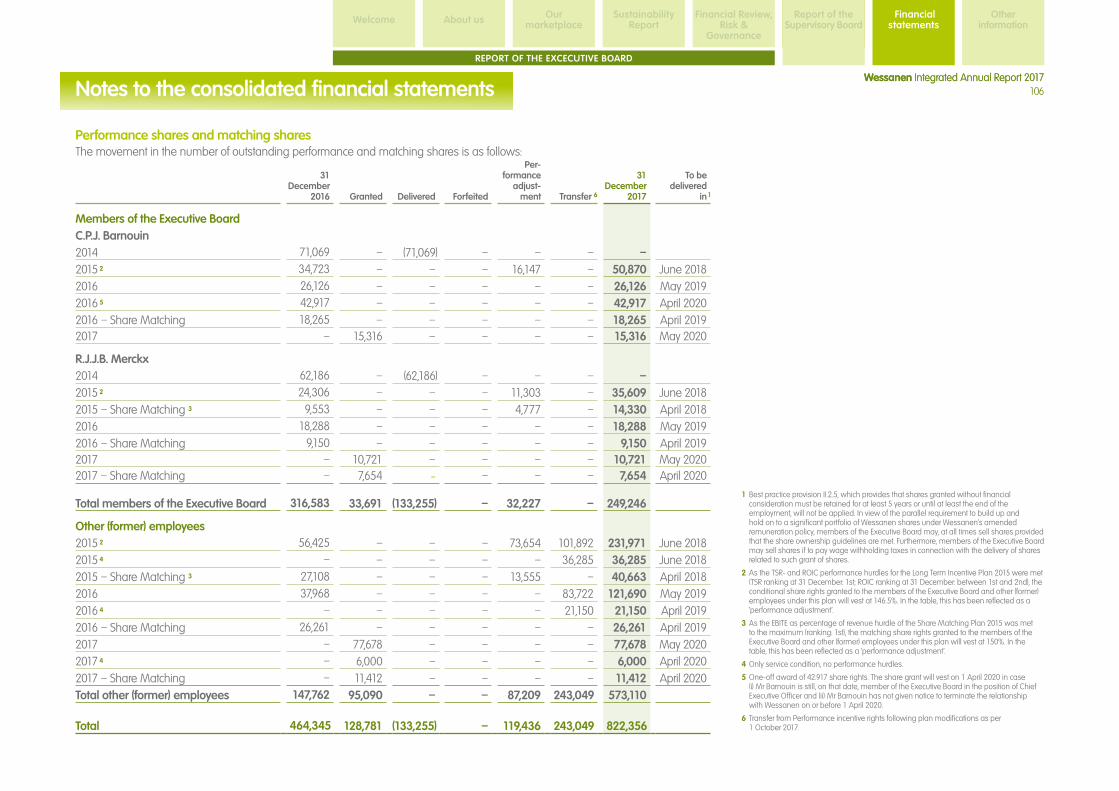
106Wessanen Integrated Annual Report 2017
Sustainability ReportAbout us Financial Review,
Risk & Governance
Report of the Supervisory Board
Our marketplaceWelcome
Wessanen Integrated Annual Report 2017
Report of the Supervisory Board
Financial statements
Other information
REPORT OF THE EXCECUTIVE BOARD
Notes to the consolidated financial statements
Performance shares and matching sharesThe movement in the number of outstanding performance and matching shares is as follows:
31 December
2016 Granted Delivered Forfeited
Per-formance
adjust-ment Transfer 6
31 December
2017
To bedelivered
in
Members of the Executive BoardC.P.J. Barnouin2014 71,069 – (71,069) – – – – 2015 2 34,723 – – – 16,147 – 50,870 June 2018 2016 26,126 – – – – – 26,126 May 2019 2016 5 42,917 – – – – – 42,917 April 2020 2016 – Share Matching 18,265 – – – – – 18,265 April 2019 2017 – 15,316 – – – – 15,316 May 2020
R.J.J.B. Merckx2014 62,186 – (62,186) – – – – 2015 2 24,306 – – – 11,303 – 35,609 June 2018 2015 – Share Matching 3 9,553 – – – 4,777 – 14,330 April 2018 2016 18,288 – – – – – 18,288 May 2019 2016 – Share Matching 9,150 – – – – – 9,150 April 2019 2017 – 10,721 – – – – 10,721 May 2020 2017 – Share Matching – 7,654 – – – – 7,654 April 2020
Total members of the Executive Board 316,583 33,691
(133,255) – 32,227 – 249,246
Other (former) employees2015 2 56,425 – – – 73,654 101,892 231,971 June 2018 2015 4 – – – – – 36,285 36,285 June 2018 2015 – Share Matching 3 27,108 – – – 13,555 – 40,663 April 2018 2016 37,968 – – – – 83,722 121,690 May 2019 2016 4 – – – – – 21,150 21,150 April 2019 2016 – Share Matching 26,261 – – – – – 26,261 April 2019 2017 – 77,678 – – – – 77,678 May 2020 2017 4 – 6,000 – – – – 6,000 April 2020 2017 – Share Matching – 11,412 – – – – 11,412 April 2020 Total other (former) employees 147,762 95,090 – – 87,209 243,049 573,110
Total 464,345 128,781
(133,255) – 119,436 243,049 822,356
1
1 Best practice provision II.2.5, which provides that shares granted without financial consideration must be retained for at least 5 years or until at least the end of the employment, will not be applied. In view of the parallel requirement to build up and hold on to a significant portfolio of Wessanen shares under Wessanen’s amended remuneration policy, members of the Executive Board may, at all times sell shares provided that the share ownership guidelines are met. Furthermore, members of the Executive Board may sell shares if to pay wage withholding taxes in connection with the delivery of shares related to such grant of shares.
2 As the TSR- and ROIC performance hurdles for the Long Term Incentive Plan 2015 were met (TSR ranking at 31 December: 1st; ROIC ranking at 31 December: between 1st and 2nd), the conditional share rights granted to the members of the Executive Board and other (former) employees under this plan will vest at 146.5%. In the table, this has been reflected as a ‘performance adjustment’.
3 As the EBITE as percentage of revenue hurdle of the Share Matching Plan 2015 was met to the maximum (ranking: 1st), the matching share rights granted to the members of the Executive Board and other (former) employees under this plan will vest at 150%. In the table, this has been reflected as a ‘performance adjustment’.
4 Only service condition, no performance hurdles.
5 One-off award of 42.917 share rights. The share grant will vest on 1 April 2020 in case (i) Mr Barnouin is still, on that date, member of the Executive Board in the position of Chief Executive Officer and (ii) Mr Barnouin has not given notice to terminate the relationship with Wessanen on or before 1 April 2020.
6 Transfer from Performance incentive rights following plan modifications as per 1 October 2017.

107Wessanen Integrated Annual Report 2017
Sustainability ReportAbout us Financial Review,
Risk & Governance
Report of the Supervisory Board
Our marketplaceWelcome
Wessanen Integrated Annual Report 2017
Report of the Supervisory Board
Financial statements
Other information
REPORT OF THE EXCECUTIVE BOARD
Notes to the consolidated financial statements
Performance incentive rights
The movement in the number of outstanding performance incentive rights is as follows:
31 December
2016 Granted Delivered Forfeited
Per-formance
adjust-ment Transfer 3
31 December
2017
Other (former) employees 1
2014 385,205 10,558 (397,142) (3,900) 5,279 – – 2014 2 13,350 – (13,350) – – – – 2015 108,432 – – (6,540) – (101,892) – 2015 2 40,785 – – – – (40,785) – 2016 89,967 – – (6,245) – (83,722) – 2016 2 16,650 – – – – (16,650) –
Total 654,389 10,558 (410,492) (16,685) 5,279
(243,049) – 1 A performance incentive right is a conditional right as set by the Company to receive remuneration in cash, whereby each performance incentive right has a value that is equal to the closing price
of a share at Euronext Amsterdam on the day prior to the date of vesting. A performance incentive right does not entitle the employee to any right related to the share of the Company including but not limited to dividend or the right to vote.
2 Only service condition, no performance hurdles.
3 Transfer to performance shares.
Actual performance and share-based payments expensesAs the TSR-performance hurdle for the Long Term Incentive Plan 2014 was met (TSR ranking at 31 December 2016: 1st), the performance shares and performamce incentive rights granted to the Executive Board and Other employees under this plan vested at 150%. As both the TSR-performance and ROIC hurdles for the Long Term Incentive Plan 2015 were met as at 31 December 2017 (TSR ranking: 1st; ROIC ranking: between 1st and 2nd), the performance shares granted to the Executive Board and Other employees under this plan vested at 146.5%. In addition, as the EBITE performance hurdle for the Share Matching plan 2015 was met at the maximum, this plan vested at 150%.
As at 31 December 2017, Wessanen’s TSR is ranking as number two (= vesting at 125%) in respect of the Long Term Incentive Plan 2016 and as number five (= vesting at 100%) in respect of the Long Term Incentive Plan 2017. In 2017, total expenses arising from transactions accounted for as equity-settled and cash-settled share-based compensation transactions amounted to €5.0 and €(0.5) respectively (2016: €1.2 and €4.2 respectively), excluding related social security expenses of €1.0 (2016: €0.7). The cost impact of the modification of the running Long Term Incentive Plan 2015 and 2016 as per 1 October 2017 amounted to €0.0; the derecognition of the provision for cash-settled share-based payments of €3.1 was almost fully offset by the recognition of equity-settled share-based payment expenses against equity.

108Wessanen Integrated Annual Report 2017
Sustainability ReportAbout us Financial Review,
Risk & Governance
Report of the Supervisory Board
Our marketplaceWelcome
Wessanen Integrated Annual Report 2017
Report of the Supervisory Board
Financial statements
Other information
REPORT OF THE EXCECUTIVE BOARD
Notes to the consolidated financial statements
As at 31 December 2017, other provisions include a provision for social security costs relating to share-based compensation in the amount of €1.0 (2016: €7.6, including a provision for cash-settled share-based payments as well as social security costs related to share-based compensation) (see Note 22). Of this provision €0.7 has been classified as current representing the social security costs liability related to the performance shares vested (LTIP 2015).
9. Net financing costsIn € millions 2017 2016
Interest expenses (0.9) (0.4)Net foreign exchange loss (0.4) (0.7)Net change in fair value of derivatives – 0.2 Interest expense defined benefit plans (0.1) (0.1)Commitment and agency fee (0.2) (0.2)Other 1 (0.3) (0.6)Total other financial income and expenses (1.0) (1.4)
Net financing costs (1.9) (1.8)1 Other includes amortisation of capitalised finance costs of €0.1 (2016: €0.2).
Interest expenses in 2017 of €0.9 (2016: €0.4) originate from Wessanen’s credit facilities, finance leases and other long term loans and borrowings. See Note 20 for more information on the interest-bearing loans and borrowings.
Foreign exchange results on financing transactions and on financial assets and liabilities are presented as part of total net foreign exchange loss. Wessanen mitigates its foreign currency exchange exposure by entering into various financial instruments. For more information on Wessanen’s foreign currency exposure and financial risk management reference is made to Note 24.
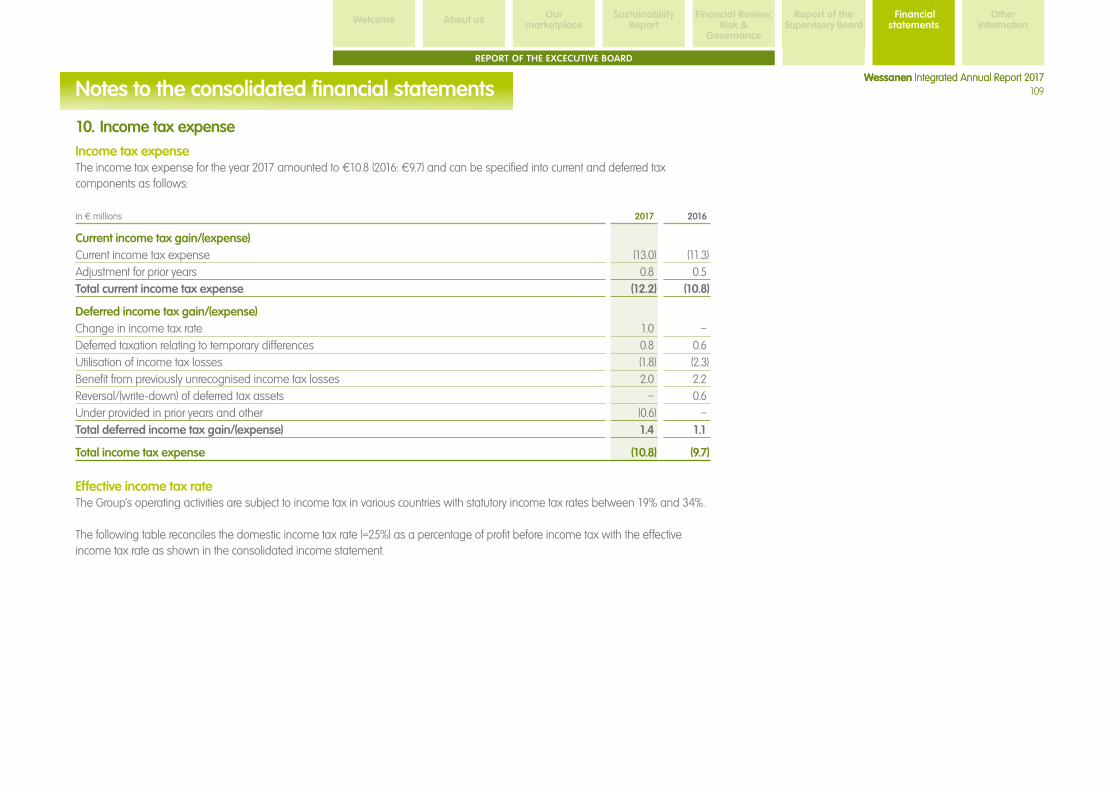
109Wessanen Integrated Annual Report 2017
Sustainability ReportAbout us Financial Review,
Risk & Governance
Report of the Supervisory Board
Our marketplaceWelcome
Wessanen Integrated Annual Report 2017
Report of the Supervisory Board
Financial statements
Other information
REPORT OF THE EXCECUTIVE BOARD
Notes to the consolidated financial statements
10. Income tax expenseIncome tax expenseThe income tax expense for the year 2017 amounted to €10.8 (2016: €9.7) and can be specified into current and deferred tax components as follows:
In € millions 2017 2016
Current income tax gain/(expense)Current income tax expense (13.0) (11.3)Adjustment for prior years 0.8 0.5 Total current income tax expense (12.2) (10.8)
Deferred income tax gain/(expense)Change in income tax rate 1.0 – Deferred taxation relating to temporary differences 0.8 0.6 Utilisation of income tax losses (1.8) (2.3)Benefit from previously unrecognised income tax losses 2.0 2.2 Reversal/(write-down) of deferred tax assets – 0.6 Under provided in prior years and other (0.6) – Total deferred income tax gain/(expense) 1.4 1.1
Total income tax expense (10.8) (9.7)
Effective income tax rateThe Group’s operating activities are subject to income tax in various countries with statutory income tax rates between 19% and 34%.
The following table reconciles the domestic income tax rate (=25%) as a percentage of profit before income tax with the effective income tax rate as shown in the consolidated income statement.
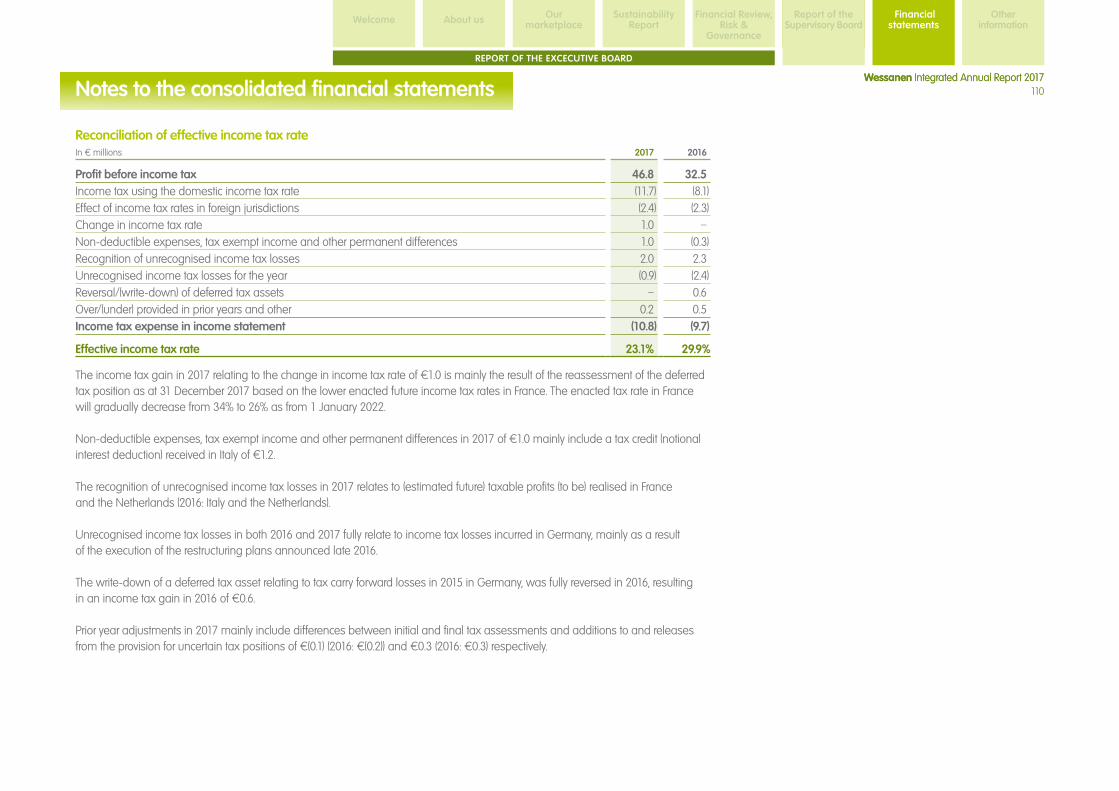
110Wessanen Integrated Annual Report 2017
Sustainability ReportAbout us Financial Review,
Risk & Governance
Report of the Supervisory Board
Our marketplaceWelcome
Wessanen Integrated Annual Report 2017
Report of the Supervisory Board
Financial statements
Other information
REPORT OF THE EXCECUTIVE BOARD
Notes to the consolidated financial statements
Reconciliation of effective income tax rateIn € millions 2017 2016
Profit before income tax 46.8 32.5 Income tax using the domestic income tax rate (11.7) (8.1)Effect of income tax rates in foreign jurisdictions (2.4) (2.3)Change in income tax rate 1.0 – Non-deductible expenses, tax exempt income and other permanent differences 1.0 (0.3)Recognition of unrecognised income tax losses 2.0 2.3 Unrecognised income tax losses for the year (0.9) (2.4)Reversal/(write-down) of deferred tax assets – 0.6 Over/(under) provided in prior years and other 0.2 0.5 Income tax expense in income statement (10.8) (9.7)
Effective income tax rate 23.1% 29.9%
The income tax gain in 2017 relating to the change in income tax rate of €1.0 is mainly the result of the reassessment of the deferred tax position as at 31 December 2017 based on the lower enacted future income tax rates in France. The enacted tax rate in France will gradually decrease from 34% to 26% as from 1 January 2022. Non-deductible expenses, tax exempt income and other permanent differences in 2017 of €1.0 mainly include a tax credit (notional interest deduction) received in Italy of €1.2. The recognition of unrecognised income tax losses in 2017 relates to (estimated future) taxable profits (to be) realised in France and the Netherlands (2016: Italy and the Netherlands). Unrecognised income tax losses in both 2016 and 2017 fully relate to income tax losses incurred in Germany, mainly as a result of the execution of the restructuring plans announced late 2016.
The write-down of a deferred tax asset relating to tax carry forward losses in 2015 in Germany, was fully reversed in 2016, resulting in an income tax gain in 2016 of €0.6.
Prior year adjustments in 2017 mainly include differences between initial and final tax assessments and additions to and releases from the provision for uncertain tax positions of €(0.1) (2016: €(0.2)) and €0.3 (2016: €0.3) respectively.

111Wessanen Integrated Annual Report 2017
Sustainability ReportAbout us Financial Review,
Risk & Governance
Report of the Supervisory Board
Our marketplaceWelcome
Wessanen Integrated Annual Report 2017
Report of the Supervisory Board
Financial statements
Other information
REPORT OF THE EXCECUTIVE BOARD
Notes to the consolidated financial statements
Income tax on other comprehensive incomeIn € millions 2017 2016
Amount before tax Tax
Amount net of
taxAmount
before tax Tax
Amount net of
tax
Remeasurements of post employment benefit obligations – – – (0.6) 0.1 (0.5)Foreign currency translation differences (1.3) – (1.3) (5.2) – (5.2)Effective portion of changes in fair value of cash flow hedges – – – (0.1) – (0.1)
Total other comprehensive income (1.3) – (1.3) (5.9) 0.1 (5.8)
11. Earnings per shareBasic earnings per shareBasic earnings per share are calculated by dividing the profit attributable to equity holders by the weighted average number of outstanding shares, which can be specified as follows:
In € millions 2017 2016
Profit attributable to equity holders of WessanenProfit/(loss) after income tax 36.0 22.8
Profit/(loss) for the period attributable to equity holders of Wessanen 36.0 22.8
In thousands 2017 2016
Number of ordinary shares Issued ordinary shares 76,067 75,992 Own shares, held by the Company – (460)
Number of ordinary shares at year end 76,067 75,532
In thousands, unless stated otherwise 2017 2016
Weighted average number of ordinary shares 75,790 75,594
Earnings per share in € 0.47 0.30

112Wessanen Integrated Annual Report 2017
Sustainability ReportAbout us Financial Review,
Risk & Governance
Report of the Supervisory Board
Our marketplaceWelcome
Wessanen Integrated Annual Report 2017
Report of the Supervisory Board
Financial statements
Other information
REPORT OF THE EXCECUTIVE BOARD
Notes to the consolidated financial statements
Diluted earnings per shareIn the calculation of diluted earnings per share, the applicable profit and the weighted average number of outstanding shares are adjusted for the potential impact of delivery of share rights granted.
In thousands, unless stated otherwise 2017 2016
Weighted average number of ordinary shares (diluted) Weighted average number of ordinary shares 75,790 75,594 Effect of delivery of share rights granted 948 522
Weighted average number of ordinary shares (diluted) 76,738 76,116
Diluted earnings per share in € 0.47 0.30
12. Property, plant and equipment
In € millionsLand and buildings
Machinery and
equipment Other
Under con struction
and pre- payments Total
2016Carrying value at beginning of year 21.5 19.4 2.8 0.1 43.8 Effect of movements in foreign exchange rates (0.6) (0.6) – – (1.2)Additions 0.3 2.2 0.3 2.7 5.5 Finance leases – – – – – Acquisitions through business combinations 4.7 3.6 0.9 – 9.2 Completed construction – – – – – Reclassifications – (0.4) 0.4 – – Disposal – (0.2) – – (0.2)Depreciation (1.3) (3.6) (0.8) – (5.7)Impairment – (0.5) – 0.3 (0.2)Carrying value at year end 24.6 19.9 3.6 3.1 51.2 Accumulated depreciation and impairment losses 18.2 38.1 9.8 – 66.1
Cost at year end 42.8 58.0 13.4 3.1 117.3

113Wessanen Integrated Annual Report 2017
Sustainability ReportAbout us Financial Review,
Risk & Governance
Report of the Supervisory Board
Our marketplaceWelcome
Wessanen Integrated Annual Report 2017
Report of the Supervisory Board
Financial statements
Other information
REPORT OF THE EXCECUTIVE BOARD
Notes to the consolidated financial statements
In € millionsLand and buildings
Machinery and
equipment Other
Under con struction
and pre- payments Total
2017Carrying value at beginning of year 24.6 19.9 3.6 3.1 51.2 Effect of movements in foreign exchange rates (0.1) (0.2) – – (0.3)Additions 0.1 5.1 0.5 4.2 9.9 Finance leases – – – 5.0 5.0 Acquisitions through business combinations – – – – – Completed construction 0.1 2.5 0.1 (2.7) – Reclassifications – – – – – Disposal – – (0.1) – (0.1)Depreciation (1.4) (4.1) (0.9) – (6.4)Impairment (1.0) (0.1) – 0.2 (0.9)Carrying value at year end 22.3 23.1 3.2 9.8 58.4 Accumulated depreciation and impairment losses 20.5 38.8 10.3 – 69.6
Cost at year end 42.8 61.9 13.5 9.8 128.0
ImpairmentsIn 2017 impairments on property, plant and equipment have been recognised in the amount of €0.9, comprising an impairment of a building in the amount of €1.0 and machinery and equipment in the amount of €0.1 following the decision to relocate the distribution centre of Bonneterre et Compagnie (Rungis, France). In addition, a reversal of impairment has been recognised in the amount of €0.2 concerning a building construction project in France. In 2016 an impairment was recognised of €0.5 in respect of machinery and equipment, following the decision to downsize the Allos manufacturing plant (Drebber, Germany) and a partial reversal of impairment in the amount of €0.3 concerning the aforementioned capitalised costs for a building construction project in France.The present value of estimated future cash flows has been calculated using a pre-tax discount rate of 9.7% (2016: 9.4%) in respect of our UK business and within the range between 9.0% and 12.3% (2016: range between 8.7% and 11.5%) in respect of our other European businesses.
Finance leasesProperty, plant and equipment includes a carrying value of €7.2 (2016: €2.5) in respect of assets held under finance leases, mainly related to a building construction project in France of €5.0 (2016: €0.0), other land and buildings of €0.5 (2016: €0.6) and machinery and equipment of €1.6 (2016: €1.7).
SecurityNo restrictions on title exist and no property, plant and equipment is pledged as security for liabilities.

114Wessanen Integrated Annual Report 2017
Sustainability ReportAbout us Financial Review,
Risk & Governance
Report of the Supervisory Board
Our marketplaceWelcome
Wessanen Integrated Annual Report 2017
Report of the Supervisory Board
Financial statements
Other information
REPORT OF THE EXCECUTIVE BOARD
Notes to the consolidated financial statements
13. Intangible assets
In € millions Goodwill Brands Customer lists Software
Develop ment expenses and Other Total
2016Carrying value at beginning of year 56.4 32.7 5.4 1.6 1.4 97.5 Effect of movements in foreign exchange rates (2.0) (1.8) – – – (3.8)Additions – – – 0.2 2.2 2.4 Acquisitions through business combinations 1 90.1 18.9 – 0.1 – 109.1 Amortisation – – (0.6) (1.1) (0.2) (1.9)Carrying value at year end 144.5 49.8 4.8 0.8 3.4 203.3 Accumulated amortisation and impairment losses 91.5 8.5 1.5 13.4 0.6 115.5
Cost at year end 236.0 58.3 6.3 14.2 4.0 318.8
2017Carrying value at beginning of year 144.5 49.8 4.8 0.8 3.4 203.3 Effect of movements in foreign exchange rates (0.8) (0.7) – – – (1.5)Additions – – – – 2.1 2.1 Acquisitions through business combinations 1 (16.8) 18.2 3.9 – – 5.3 Amortisation – – (1.0) (0.3) (1.3) (2.6)Carrying value at year end 126.9 67.3 7.7 0.5 4.2 206.6 Accumulated amortisation and impairment losses 90.7 8.0 2.4 12.7 1.1 114.9
Cost at year end 217.6 75.3 10.1 13.2 5.3 321.5 1 See Note 5.
Acquisition through business combinationsIn 2016, intangible assets from acquisitions through business combinations of €109.1 consist mainly of goodwill and brands capitalised related to the acquisition of Piramide, Ineobio, Mrs Crimble’s and Biogran. In 2016 the allocation of the purchase consideration paid in respect of the Biogran acquisition could not be completed in time, due to the fact that the acquisition was only done in December 2016. Accordingly, part of the goodwill amount recognised of €62.8, has been allocated in 2017 to other identifiable intangible assets, being brands and customer lists in the amount of €18.2 and €3.9 respectively and the related deferred tax liabilities in the amount of €(5.5).

115Wessanen Integrated Annual Report 2017
Sustainability ReportAbout us Financial Review,
Risk & Governance
Report of the Supervisory Board
Our marketplaceWelcome
Wessanen Integrated Annual Report 2017
Report of the Supervisory Board
Financial statements
Other information
REPORT OF THE EXCECUTIVE BOARD
Notes to the consolidated financial statements
Impairment testing for cash-generating units containing goodwill and brandsGoodwill and brands with an indefinite life are tested for impairment annually, or more frequently if there are indications that a particular cash-generating unit might be impaired.
The following cash-generating units have significant carrying values of goodwill and brands:
In € millions 31 December 2017 31 December 2016
Goodwill Brands Total Goodwill Brands Total
Branded – Italy 18.5 8.6 27.1 18.5 8.6 27.1 Branded – France 1 21.3 18.2 39.5 21.5 18.2 39.7 Branded – UK 2 20.9 17.3 38.2 21.7 18.0 39.7 Branded – Germany 9.3 3.3 12.6 9.3 3.3 12.6 Branded – Benelux 10.7 1.7 12.4 10.7 1.7 12.4 Branded – Spain 3 46.2 18.2 64.4 62.8 – 62.8
Carrying value at year end 126.9 67.3 194.2 144.5 49.8 194.3 1 2017 change in carrying value at Branded-France relates to an adjustment of €0.2 of goodwill concerning the Ineobio acquisition in 2016.
2 2017 change in carrying values at Branded-UK relate entirely to foreign currency changes.
3 2017 change in carrying values at Branded-Spain relate entirely to the earlier mentioned completion of the purchase price allocation..
2017 annual impairment testThe recoverable amount of each cash-generating unit, used in the annual impairment tests performed in the fourth quarter, is based on its value in use. Key assumptions used in the impairment tests for the cash-generating units in the table above were sales growth rates, gross profit (margin) and the rates used for discounting the projected cash flows. These cash flow projections were determined using management’s internal forecasts that cover a period of 5 years, based on financial plans as approved by the Company’s management, after which a terminal value was calculated. For terminal value calculation, growth rates were capped at an average long term inflation rate of 1.6% (2016: 1.8%). The present value of estimated future cash flows has been calculated using a pre-tax discount rate of 9.7% (2016: 9.4%) in respect of our UK business and within the range between 9.0% and 12.3% (2016: range between 8.7% and 11.5%) in respect of our other European businesses. The pre-tax discount rate reflects the current market assessment of the time value of money and the specific risks of the cash-generating unit.
Based on the 2017 annual impairment test the recoverable amounts for all cash-generating units were estimated to be higher than the carrying amounts, and therefore no impairment losses were identified (2016: €0.0).

116Wessanen Integrated Annual Report 2017
Sustainability ReportAbout us Financial Review,
Risk & Governance
Report of the Supervisory Board
Our marketplaceWelcome
Wessanen Integrated Annual Report 2017
Report of the Supervisory Board
Financial statements
Other information
REPORT OF THE EXCECUTIVE BOARD
Notes to the consolidated financial statements
The results of the annual impairment tests of Branded-Italy, Branded-France, Branded-UK, Branded-Germany and Branded-Benelux have indicated that a reasonably possible change in key assumptions would not cause the value in use to fall to the level of the carrying value.
In 2017 we have identified and tested a new cash-generating unit, Branded-Spain, which includes the activities of our most recent acquisition Biogran. Although the integration of Biogran is on track the annual impairment test resulted in a limited headroom due to the fact that the test date is still very close to the acquisition date. As a consequence, the outcome of the test is sensitive to changes in some of the key assumptions. A 194 basis points decline in the compound sales growth rate, a 97 basis points decline in the gross profit margin or an increase of 72 basis points in the pre-tax discount rate would cause its value in use to fall to the level of its carrying value. Goodwill and brands allocated to Branded-Spain at 31 December 2017 amount to €46.2 and €18.2 respectively.
SecurityNo restrictions on title exist and no intangible assets are pledged as security for liabilities.
14. Other investmentsOther investments mainly include long term receivables of €0.2 (2016: €0.6).
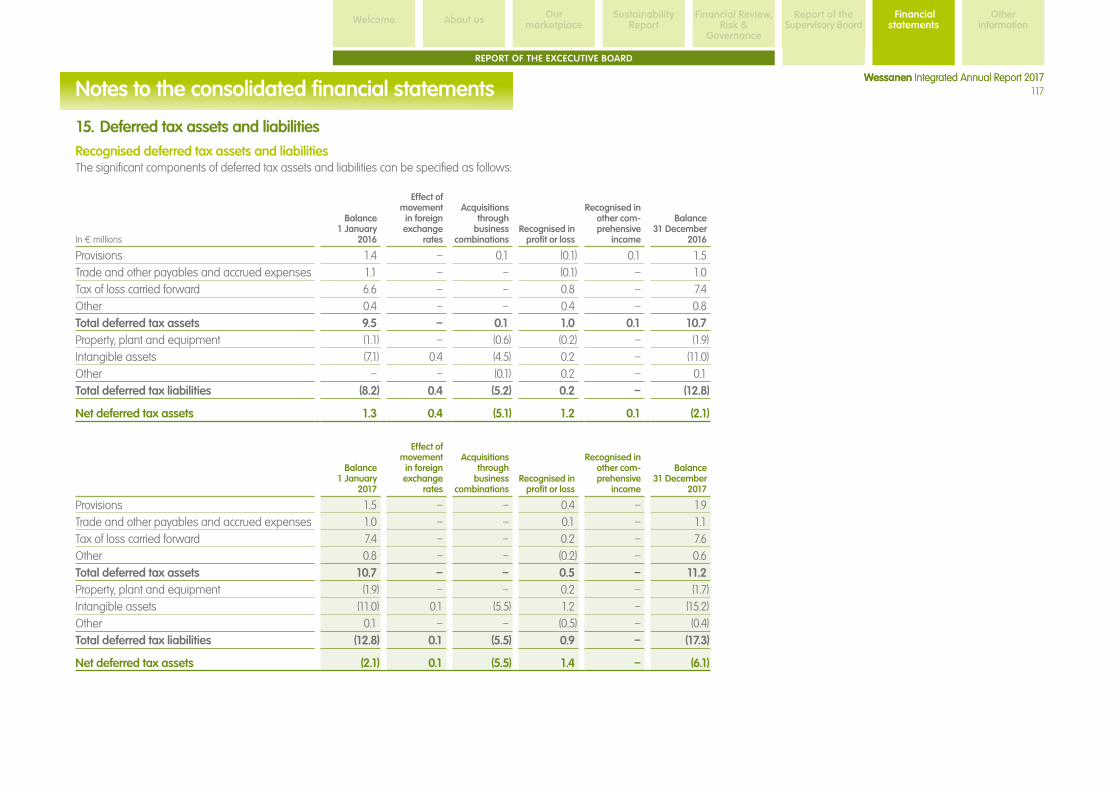
117Wessanen Integrated Annual Report 2017
Sustainability ReportAbout us Financial Review,
Risk & Governance
Report of the Supervisory Board
Our marketplaceWelcome
Wessanen Integrated Annual Report 2017
Report of the Supervisory Board
Financial statements
Other information
REPORT OF THE EXCECUTIVE BOARD
Notes to the consolidated financial statements
15. Deferred tax assets and liabilitiesRecognised deferred tax assets and liabilitiesThe significant components of deferred tax assets and liabilities can be specified as follows:
In € millions
Balance 1 January
2016
Effect of movement in foreign exchange
rates
Acquisitions through
business combinations
Recognised in profit or loss
Recognised in other com-prehensive
income
Balance 31 December
2016
Provisions 1.4 – 0.1 (0.1) 0.1 1.5 Trade and other payables and accrued expenses 1.1 – – (0.1) – 1.0 Tax of loss carried forward 6.6 – – 0.8 – 7.4 Other 0.4 – – 0.4 – 0.8 Total deferred tax assets 9.5 – 0.1 1.0 0.1 10.7 Property, plant and equipment (1.1) – (0.6) (0.2) – (1.9)Intangible assets (7.1) 0.4 (4.5) 0.2 – (11.0)Other – – (0.1) 0.2 – 0.1 Total deferred tax liabilities (8.2) 0.4 (5.2) 0.2 – (12.8)
Net deferred tax assets 1.3 0.4 (5.1) 1.2 0.1 (2.1)
Balance 1 January
2017
Effect of movement in foreign exchange
rates
Acquisitions through
business combinations
Recognised in profit or loss
Recognised in other com- prehensive
income
Balance 31 December
2017
Provisions 1.5 – – 0.4 – 1.9 Trade and other payables and accrued expenses 1.0 – – 0.1 – 1.1 Tax of loss carried forward 7.4 – – 0.2 – 7.6 Other 0.8 – – (0.2) – 0.6 Total deferred tax assets 10.7 – – 0.5 – 11.2 Property, plant and equipment (1.9) – – 0.2 – (1.7)Intangible assets (11.0) 0.1 (5.5) 1.2 – (15.2)Other 0.1 – – (0.5) – (0.4)Total deferred tax liabilities (12.8) 0.1 (5.5) 0.9 – (17.3)
Net deferred tax assets (2.1) 0.1 (5.5) 1.4 – (6.1)

118Wessanen Integrated Annual Report 2017
Sustainability ReportAbout us Financial Review,
Risk & Governance
Report of the Supervisory Board
Our marketplaceWelcome
Wessanen Integrated Annual Report 2017
Report of the Supervisory Board
Financial statements
Other information
REPORT OF THE EXCECUTIVE BOARD
Notes to the consolidated financial statementsNet deferred tax assets/(liabilities) are presented as follows:
In € millions31
December 2017
31 December
2016
Deferred tax assets presented under non-current assets 7.0 8.8 Deferred tax liabilities presented under non-current liabilities (13.1) (10.9)
Net deferred tax assets/(liabilities) (6.1) (2.1)
Tax losses carried forward/unrecognised deferred tax assetsThe tax losses carried forward per expiration date, and their recognition can be specified as follows:
In € millions 31 December 2017
Recognised Unrecognised Total
Expiration date 2020 4.6 – 4.6 Expiration date 2022 and future years 15.5 118.2 133.7
Indefinite and timing differences 8.1 11.9 20.0
Total tax losses caried forward (nominal value) 28.2 130.1 158.3
Total tax losses carried forward (tax value) 7.6 33.1 40.7
The unrecognised deferred tax assets related to tax losses carried forward decreased by €5.8 from €38.9 as at 31 December 2016 to €33.1 as at 31 December 2017. This decrease can mainly be explained by the expiration of income tax losses in the Netherlands (€18.9) and the utilisation/recognition of unrecognised income tax losses incurred in France and the Netherlands, partly offset by unrecognised income tax losses incurred in Germany.

119Wessanen Integrated Annual Report 2017
Sustainability ReportAbout us Financial Review,
Risk & Governance
Report of the Supervisory Board
Our marketplaceWelcome
Wessanen Integrated Annual Report 2017
Report of the Supervisory Board
Financial statements
Other information
REPORT OF THE EXCECUTIVE BOARD
Notes to the consolidated financial statements
16. Inventories
In € millions
31 December
2017
31 December
2016
Finished products 56.9 47.8 Semi-finished products 1.3 0.9 Raw materials and supplies 18.2 19.6 Prepayments on inventories 0.1 0.2
Total inventories 76.5 68.5
Inventories are shown net of impairment losses in the amount of €2.3 (2016: €2.0). The net write off in the amount of €2.3 (2016: €2.4) is included in the cost of raw materials and supplies.
17. Trade and other receivables and prepaymentsTrade receivables are shown net of impairment losses in the amount of €1.7 (2016: €1.8) arising from identified doubtful receivables from customers.
The Group’s exposure to credit and currency risks and impairment losses related to trade and other receivables and prepayments are disclosed in Note 24.
18. Net cash and cash equivalents
In € millions
31 December
2017
31 December
2016
Cash and cash equivalents 13.8 9.4 Bank overdrafts (8.8) (8.7)
Net cash and cash equivalents 5.0 0.7
Cash and cash equivalents are at Wessanen’s free disposal as at 31 December 2017.
In 2014 we introduced ABN AMRO Bank as our main cash management provider and created a cross border European zero balancing cash pool. Through the cash pool, all balances are concentrated on a daily basis to the bank account of Wessanen Finance B.V. Next to that ING was implemented in 2016 as cash management provider in Italy and in 2017 in Spain. The cash and cash equivalents balance at Wessanen Finance B.V. as per 31 December 2017 amounts to €1.9 (31 December 2016: €0.5).
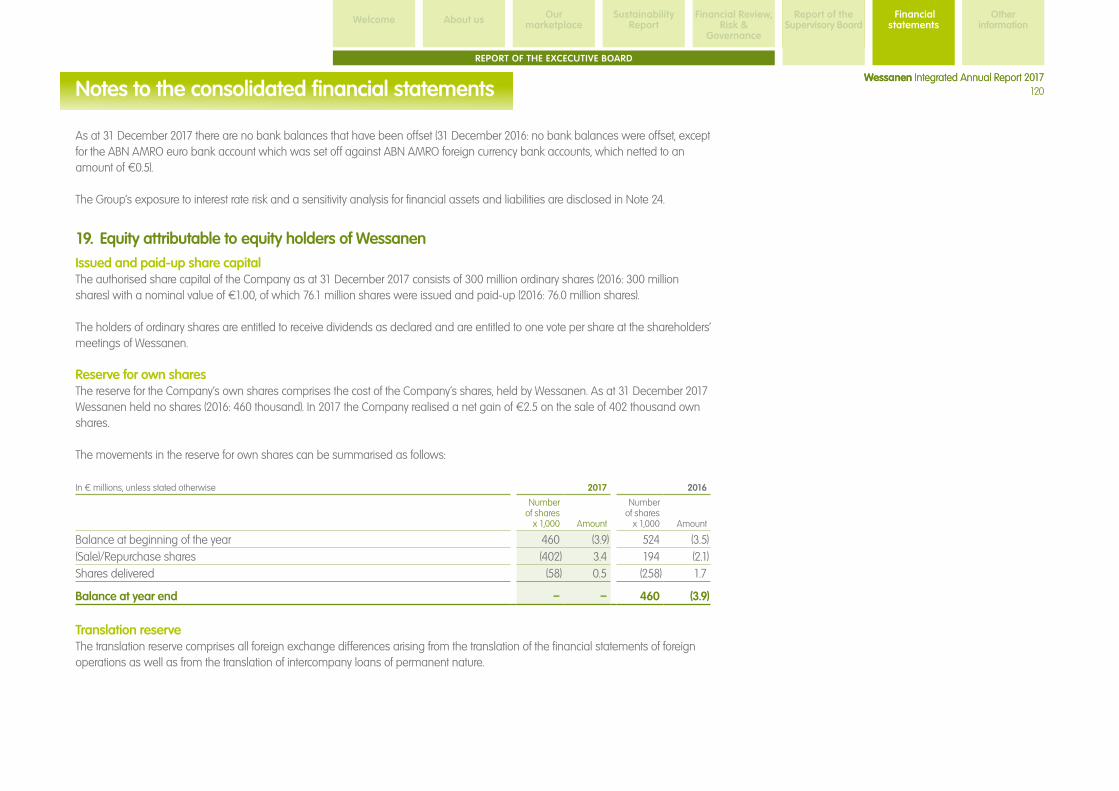
120Wessanen Integrated Annual Report 2017
Sustainability ReportAbout us Financial Review,
Risk & Governance
Report of the Supervisory Board
Our marketplaceWelcome
Wessanen Integrated Annual Report 2017
Report of the Supervisory Board
Financial statements
Other information
REPORT OF THE EXCECUTIVE BOARD
Notes to the consolidated financial statements
As at 31 December 2017 there are no bank balances that have been offset (31 December 2016: no bank balances were offset, except for the ABN AMRO euro bank account which was set off against ABN AMRO foreign currency bank accounts, which netted to an amount of €0.5).
The Group’s exposure to interest rate risk and a sensitivity analysis for financial assets and liabilities are disclosed in Note 24.
19. Equity attributable to equity holders of Wessanen Issued and paid-up share capitalThe authorised share capital of the Company as at 31 December 2017 consists of 300 million ordinary shares (2016: 300 million shares) with a nominal value of €1.00, of which 76.1 million shares were issued and paid-up (2016: 76.0 million shares).
The holders of ordinary shares are entitled to receive dividends as declared and are entitled to one vote per share at the shareholders’ meetings of Wessanen.
Reserve for own sharesThe reserve for the Company’s own shares comprises the cost of the Company’s shares, held by Wessanen. As at 31 December 2017 Wessanen held no shares (2016: 460 thousand). In 2017 the Company realised a net gain of €2.5 on the sale of 402 thousand own shares.
The movements in the reserve for own shares can be summarised as follows:
In € millions, unless stated otherwise 2017 2016
Number of shares
x 1,000 Amount
Number of shares
x 1,000 Amount
Balance at beginning of the year 460 (3.9) 524 (3.5)(Sale)/Repurchase shares (402) 3.4 194 (2.1)Shares delivered (58) 0.5 (258) 1.7
Balance at year end – – 460 (3.9)
Translation reserveThe translation reserve comprises all foreign exchange differences arising from the translation of the financial statements of foreign operations as well as from the translation of intercompany loans of permanent nature.
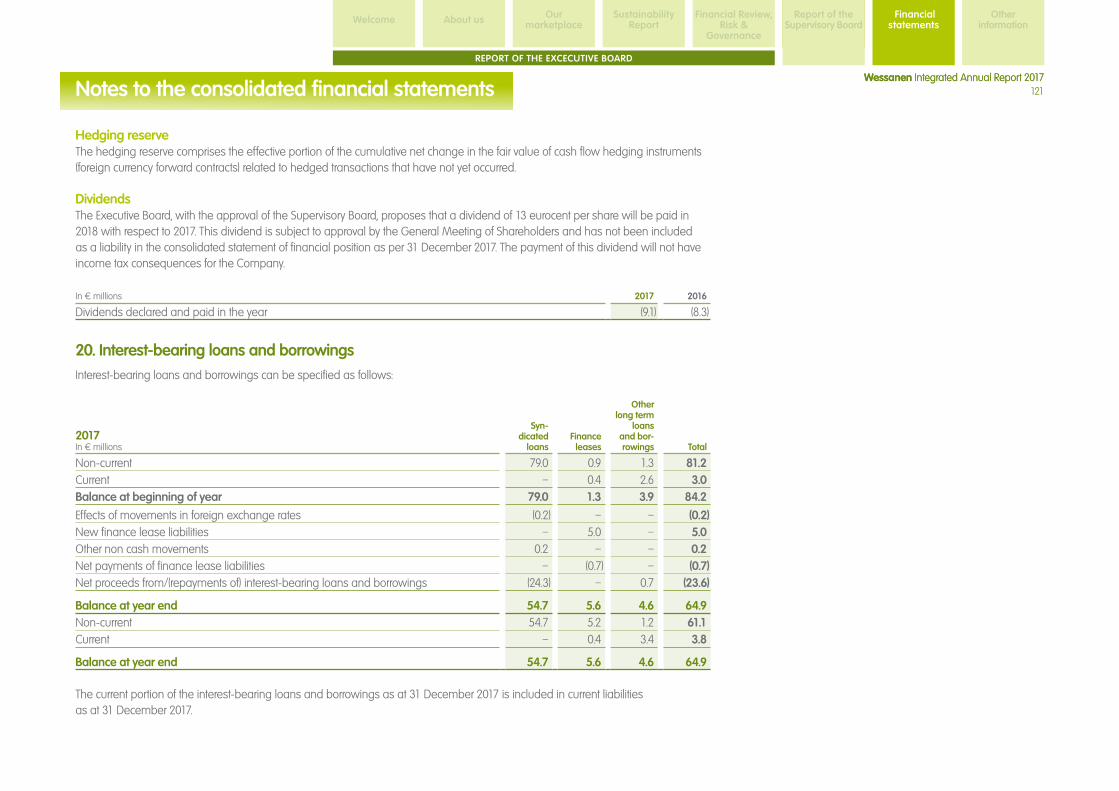
121Wessanen Integrated Annual Report 2017
Sustainability ReportAbout us Financial Review,
Risk & Governance
Report of the Supervisory Board
Our marketplaceWelcome
Wessanen Integrated Annual Report 2017
Report of the Supervisory Board
Financial statements
Other information
REPORT OF THE EXCECUTIVE BOARD
Notes to the consolidated financial statements
Hedging reserveThe hedging reserve comprises the effective portion of the cumulative net change in the fair value of cash flow hedging instruments (foreign currency forward contracts) related to hedged transactions that have not yet occurred.
DividendsThe Executive Board, with the approval of the Supervisory Board, proposes that a dividend of 13 eurocent per share will be paid in 2018 with respect to 2017. This dividend is subject to approval by the General Meeting of Shareholders and has not been included as a liability in the consolidated statement of financial position as per 31 December 2017. The payment of this dividend will not have income tax consequences for the Company.
In € millions 2017 2016
Dividends declared and paid in the year (9.1) (8.3)
20. Interest-bearing loans and borrowingsInterest-bearing loans and borrowings can be specified as follows:
2017In € millions
Syn-dicated
loansFinance leases
Other long term
loans and bor-rowings Total
Non-current 79.0 0.9 1.3 81.2 Current – 0.4 2.6 3.0 Balance at beginning of year 79.0 1.3 3.9 84.2
Effects of movements in foreign exchange rates (0.2) – – (0.2)New finance lease liabilities – 5.0 – 5.0 Other non cash movements 0.2 – – 0.2 Net payments of finance lease liabilities – (0.7) – (0.7)Net proceeds from/(repayments of) interest-bearing loans and borrowings (24.3) – 0.7 (23.6)
Balance at year end 54.7 5.6 4.6 64.9 Non-current 54.7 5.2 1.2 61.1 Current – 0.4 3.4 3.8
Balance at year end 54.7 5.6 4.6 64.9
The current portion of the interest-bearing loans and borrowings as at 31 December 2017 is included in current liabilities as at 31 December 2017.

122Wessanen Integrated Annual Report 2017
Sustainability ReportAbout us Financial Review,
Risk & Governance
Report of the Supervisory Board
Our marketplaceWelcome
Wessanen Integrated Annual Report 2017
Report of the Supervisory Board
Financial statements
Other information
REPORT OF THE EXCECUTIVE BOARD
Notes to the consolidated financial statements
Syndicated loansThe Group has an unsecured, committed €125 revolving credit facility in place, provided by ABN AMRO and ING. In April 2017, the initial termination date of the credit facility was extended for an additional period of two years, that is to 23 July 2022. The pricing grid over the relevant floating rate (EURIBOR or LIBOR) is based on the leverage ratio (Net debt to EBITDAIE of total Wessanen). The maximum aggregate amount which can be drawn under the “accordion facility” (optional increase of the credit facility) is €25.
Under its financial covenants Wessanen has to ensure that total net debt does not exceed 3.0 times consolidated EBITDAIE. A spike up to 3.5 times consolidated EBITDAIE is allowed under specific conditions for a maximum duration of two (consecutive) quarters. At 31 December 2017 our net debt level amounted to 1.0 times consolidated EBITDAIE; our net debt amounted to €59.9 (2016: €83.5). The facility has various other general and financial covenants that are customary for its type, amount and tenor. For example, Wessanen is not permitted to declare or pay a dividend exceeding 45% of its net results, excluding any non-recurring items, and there are certain restrictions in place in case of acquisitions. A violation of any of these covenants constitutes an event of default under our credit facility, which would, unless waived by our lenders, provide our lenders with the right to request for immediate repayment of the outstanding loan without the requirement of notice or any other formality.
The Group has the ability to draw loans from the syndicated credit facility with maturities ranging between 1 day and 9 months. When a loan expires, this is, ceteris paribus, refinanced with a new loan drawn from the facility. The average interest rate on drawings for 2017 was 0.7% (2016: 0.7%).
Finance leasesNon-cancellable finance leases are payable as follows:
In € millions 31 December 2017 31 December 2016
Total lease payments Interest
Carrying value
Total lease payment Interest
Carrying value
Less than 1 year 0.5 0.1 0.4 0.4 – 0.4 Between 1 and 5 years 2.0 0.3 1.7 0.6 0.1 0.5 More than 5 years 3.8 0.3 3.5 0.5 0.1 0.4
Total 6.3 0.7 5.6 1.5 0.2 1.3
Other long term loans and borrowingsOther long term loans and borrowings as per 31 December 2017 consist of reverse factoring of €3.4 (2016: €2.6) and long term loans of €1.2 (2016: €1.3).

123Wessanen Integrated Annual Report 2017
Sustainability ReportAbout us Financial Review,
Risk & Governance
Report of the Supervisory Board
Our marketplaceWelcome
Wessanen Integrated Annual Report 2017
Report of the Supervisory Board
Financial statements
Other information
REPORT OF THE EXCECUTIVE BOARD
Notes to the consolidated financial statements
21. Employee benefitsDefined benefit plansIn 2017 Wessanen and its subsidiaries made contributions to defined benefit plans in the Netherlands and France, that provide pension benefits for employees upon retirement. Wessanen pays benefits directly to employees upon retirement in Germany. These are final-pay plans, based on the employees’ years of service and compensation near retirement. The schemes in the Netherlands and France are administered by industry pension funds and life insurance companies. The schemes in Germany are administered by Wessanen.
In Italy Wessanen made contributions to a legal employee leaving entitlement. Each employee is entitled to a deferred compensation (“TFR”) which is paid upon retirement or upon leaving the company. The entitlement is accrued for an amount equal to approximately one month’s salary for each year of service and is adjusted for inflation every year. The main part of the scheme is administered by Wessanen and is qualified as a career average defined benefit scheme. In accordance with a change in Italian law in 2007, part of the scheme has been transferred since to an external pension fund and is qualified as a defined contribution scheme. Wessanen’s net liability for defined benefit obligations as at 31 December 2017 amounts to €7.3 and relates mainly to the pension plan in Germany (in the amount of €4.4) and the part of the above mentioned TFR scheme in Italy that qualifies as a defined benefit scheme (in the amount of €1.4). Both the German and Italian scheme are administered by Wessanen and are unfunded. Wessanen pays benefits directly to employees upon retirement or, in case of the TFR, upon leaving the Company. The German plan is closed to new participants and has an expected duration of 16.9 years. The TFR scheme is open to new participants and has an expected duration of 15.4 years. The weighted average duration of the total net liability for defined benefit obligations of Wessanen is 15.6 years.
The net liability for defined benefit obligations is calculated separately for each plan by calculating the amount of future benefits that employees have earned in return for their service in the current and prior periods; that benefit is discounted to determine the present value, and the fair value of any plan asset is deducted. The discount rate used is the yield on high-quality corporate bonds of a currency and maturity consistent with the currency and maturity of the post employment defined benefit obligations.
The calculations are performed by qualified actuaries using the projected unit credit method. Multi-employer plansOne of the Dutch companies is engaged in a multi-employer plan with ‘Bedrijfstakpensioenfonds Foodservice & Groothandel in Levensmiddelen’ (‘Bpf Foodservice’). This multi-employer plan is a defined benefit plan, though accounted for as if it was a defined contribution plan because it is not possible to identify Wessanen’s share of the underlying financial position and performance of the plan with sufficient reliability for accounting purposes. This is due to the fact that the plan exposes the participating entities to actuarial risks associated with the current and former employees of other entities. Surpluses or deficits for the mentioned plans are determined on the basis of the pension law ‘Pensioenwet’ and the regulatory framework ‘Financieel Toetsingskader’.

124Wessanen Integrated Annual Report 2017
Sustainability ReportAbout us Financial Review,
Risk & Governance
Report of the Supervisory Board
Our marketplaceWelcome
Wessanen Integrated Annual Report 2017
Report of the Supervisory Board
Financial statements
Other information
REPORT OF THE EXCECUTIVE BOARD
Notes to the consolidated financial statements
Both per December 2017 and 2016 Bpf Foodservice showed a deficit compared to the minimum required coverage. Following the deficit reported by Bpf Foodservice per December 2015 a recovery plan was submitted to De Nederlandsche Bank (DNB) in January 2016, who accepted the plan and considered it specific and feasible. The recovery plan requires Bpf Foodservice to achieve a coverage rate of 122.1% per December 2026. More detailed information concerning the financial position of Bpf Foodservice is publicly available on the website of the industry pension fund (www.bpffoodservice.nl). Wessanen’s level of participation in the plan compared with other participating entities is relatively low with 50 active members (total plan: approximately 15,000 members), 44 deferred members (total plan: approximately 36,000 members) and no retired members (total plan: approximately 9,000 members).
The expected contributions for this multi-employer plan in 2018 amount to €0.4.
Defined contribution plansWessanen and its subsidiaries make contributions to defined contribution plans in the Netherlands, France and the UK. The expected contributions for these plans in 2018 amount to €3.1.
Defined benefit plansThe components of the employee benefits for the years ending 31 December 2017 and 2016 respectively are shown in the following tables.
In € millions
31 December
2017
31 December
2016
Present value of obligations 7.7 7.5 Fair value of plan assets (0.4) (0.4)Net liability for defined benefit obligations 7.3 7.1 Other employee benefits 0.6 0.6
Total liability employee benefits 7.9 7.7
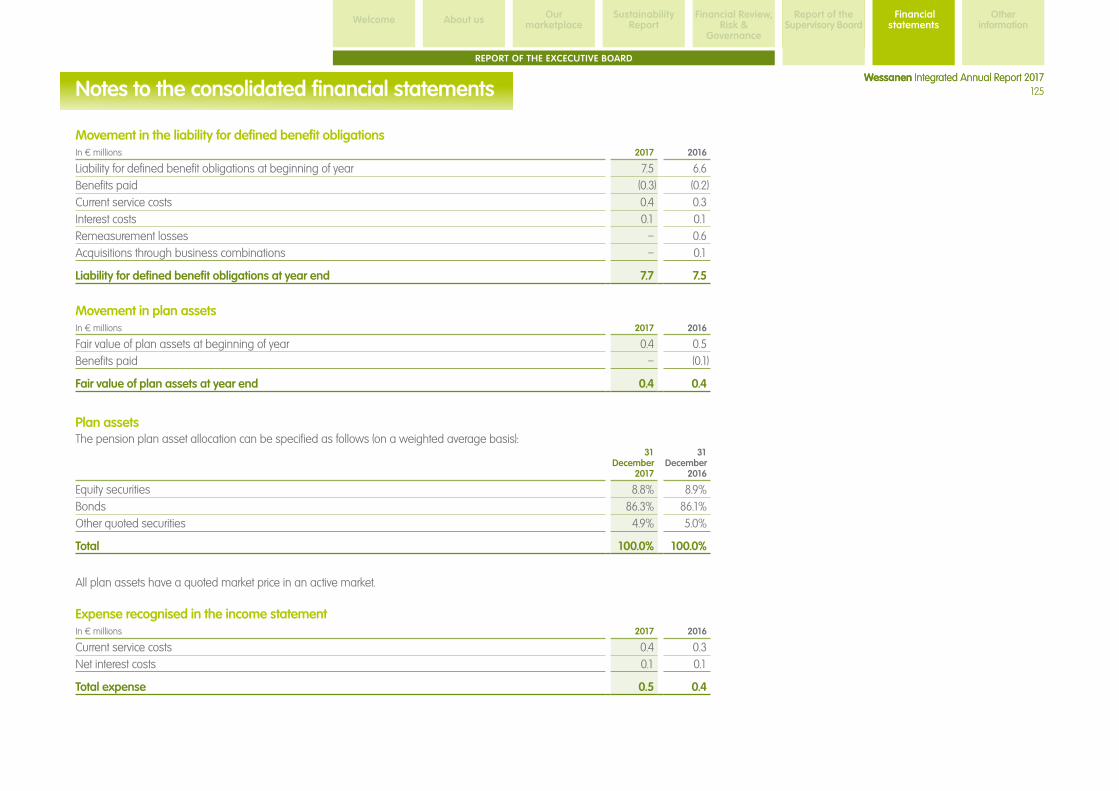
125Wessanen Integrated Annual Report 2017
Sustainability ReportAbout us Financial Review,
Risk & Governance
Report of the Supervisory Board
Our marketplaceWelcome
Wessanen Integrated Annual Report 2017
Report of the Supervisory Board
Financial statements
Other information
REPORT OF THE EXCECUTIVE BOARD
Notes to the consolidated financial statements
Movement in the liability for defined benefit obligationsIn € millions 2017 2016
Liability for defined benefit obligations at beginning of year 7.5 6.6 Benefits paid (0.3) (0.2)Current service costs 0.4 0.3 Interest costs 0.1 0.1 Remeasurement losses – 0.6 Acquisitions through business combinations – 0.1
Liability for defined benefit obligations at year end 7.7 7.5
Movement in plan assetsIn € millions 2017 2016
Fair value of plan assets at beginning of year 0.4 0.5 Benefits paid – (0.1)
Fair value of plan assets at year end 0.4 0.4
Plan assetsThe pension plan asset allocation can be specified as follows (on a weighted average basis):
31 December
2017
31 December
2016
Equity securities 8.8% 8.9%Bonds 86.3% 86.1%Other quoted securities 4.9% 5.0%
Total 100.0% 100.0%
All plan assets have a quoted market price in an active market.
Expense recognised in the income statementIn € millions 2017 2016
Current service costs 0.4 0.3 Net interest costs 0.1 0.1
Total expense 0.5 0.4
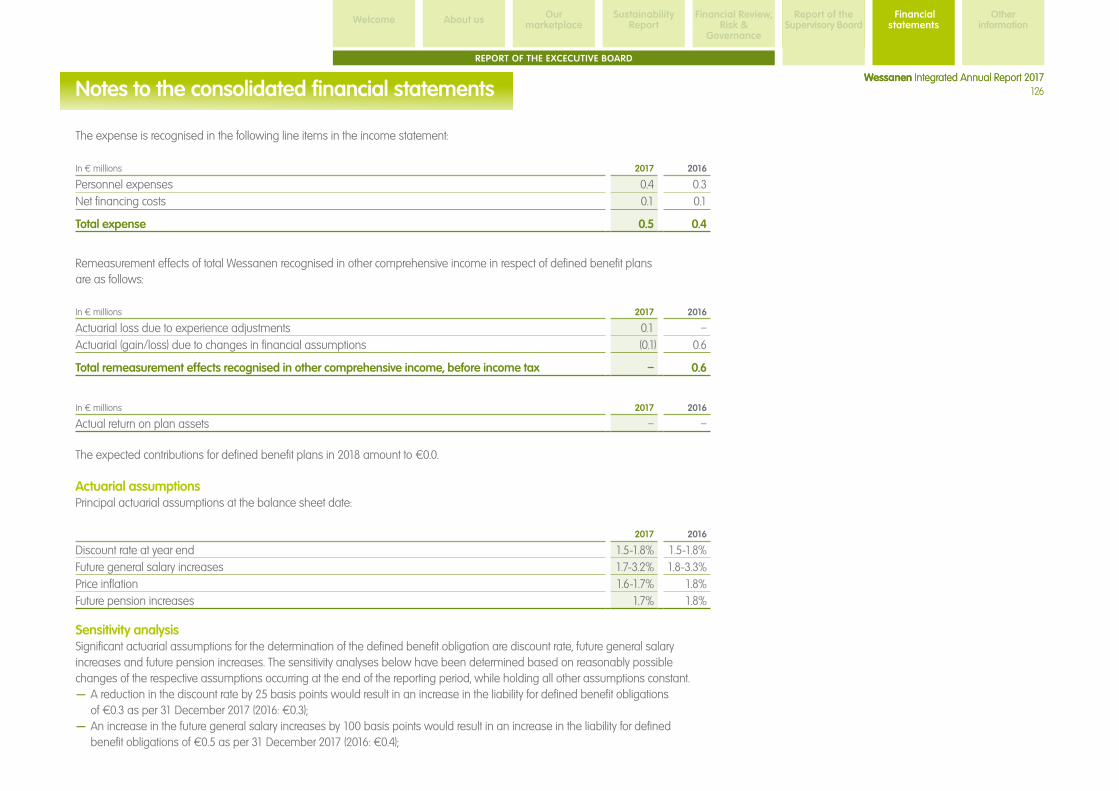
126Wessanen Integrated Annual Report 2017
Sustainability ReportAbout us Financial Review,
Risk & Governance
Report of the Supervisory Board
Our marketplaceWelcome
Wessanen Integrated Annual Report 2017
Report of the Supervisory Board
Financial statements
Other information
REPORT OF THE EXCECUTIVE BOARD
Notes to the consolidated financial statements
The expense is recognised in the following line items in the income statement:
In € millions 2017 2016
Personnel expenses 0.4 0.3 Net financing costs 0.1 0.1
Total expense 0.5 0.4
Remeasurement effects of total Wessanen recognised in other comprehensive income in respect of defined benefit plans are as follows:
In € millions 2017 2016
Actuarial loss due to experience adjustments 0.1 – Actuarial (gain/loss) due to changes in financial assumptions (0.1) 0.6
Total remeasurement effects recognised in other comprehensive income, before income tax – 0.6
In € millions 2017 2016
Actual return on plan assets – –
The expected contributions for defined benefit plans in 2018 amount to €0.0.
Actuarial assumptionsPrincipal actuarial assumptions at the balance sheet date:
2017 2016
Discount rate at year end 1.5-1.8% 1.5-1.8% Future general salary increases 1.7-3.2% 1.8-3.3% Price inflation 1.6-1.7% 1.8%Future pension increases 1.7% 1.8%
Sensitivity analysisSignificant actuarial assumptions for the determination of the defined benefit obligation are discount rate, future general salary increases and future pension increases. The sensitivity analyses below have been determined based on reasonably possible changes of the respective assumptions occurring at the end of the reporting period, while holding all other assumptions constant.
– A reduction in the discount rate by 25 basis points would result in an increase in the liability for defined benefit obligations of €0.3 as per 31 December 2017 (2016: €0.3);
– An increase in the future general salary increases by 100 basis points would result in an increase in the liability for defined benefit obligations of €0.5 as per 31 December 2017 (2016: €0.4);

127Wessanen Integrated Annual Report 2017
Sustainability ReportAbout us Financial Review,
Risk & Governance
Report of the Supervisory Board
Our marketplaceWelcome
Wessanen Integrated Annual Report 2017
Report of the Supervisory Board
Financial statements
Other information
REPORT OF THE EXCECUTIVE BOARD
Notes to the consolidated financial statements
– An increase in the future pension increases by 100 basis points would result in an increase in the liability for defined benefit obligations of €0.6 as per 31 December 2017 (2016: €0.6).
The sensitivity analysis presented above may not be representative for the actual change in the defined benefit obligation as it is unlikely that the change in assumptions would occur in isolation of one another as some of the assumptions may be correlated.
Furthermore, in presenting the above sensitivity analysis, the present value of the defined benefit obligation has been calculated using the projected unit credit method at the end of the reporting period, which is the same as that applied in calculating the defined benefit obligation liability recognised in the statement of financial position.
There was no change in the methods and assumptions used in preparing the sensitivity analysis from prior years. Assumptions regarding future mortality are based on published statistics and mortality tables.
Present value of the defined benefit obligation, fair value of plan assets and deficit as at 31 DecemberIn € millions 2017 2016 2015 2014 2013
Defined benefit obligation 7.7 7.5 6.6 10.3 4.7 Fair value of plan assets (0.4) (0.4) (0.5) (4.5) (0.6)Deficit in the plan 7.3 7.1 6.1 5.8 4.1
Experience adjustments arising on plan liabilities and plan assets as at 31 DecemberIn € millions 2017 2016 2015 2014 2013
Plan liabilities (0.1) – (0.3) 0.3 0.3Plan assets – – 0.3 0.5 –
Experience adjustments are defined as all gains/(losses) due to changes other than changes to financial and demographic assumptions.
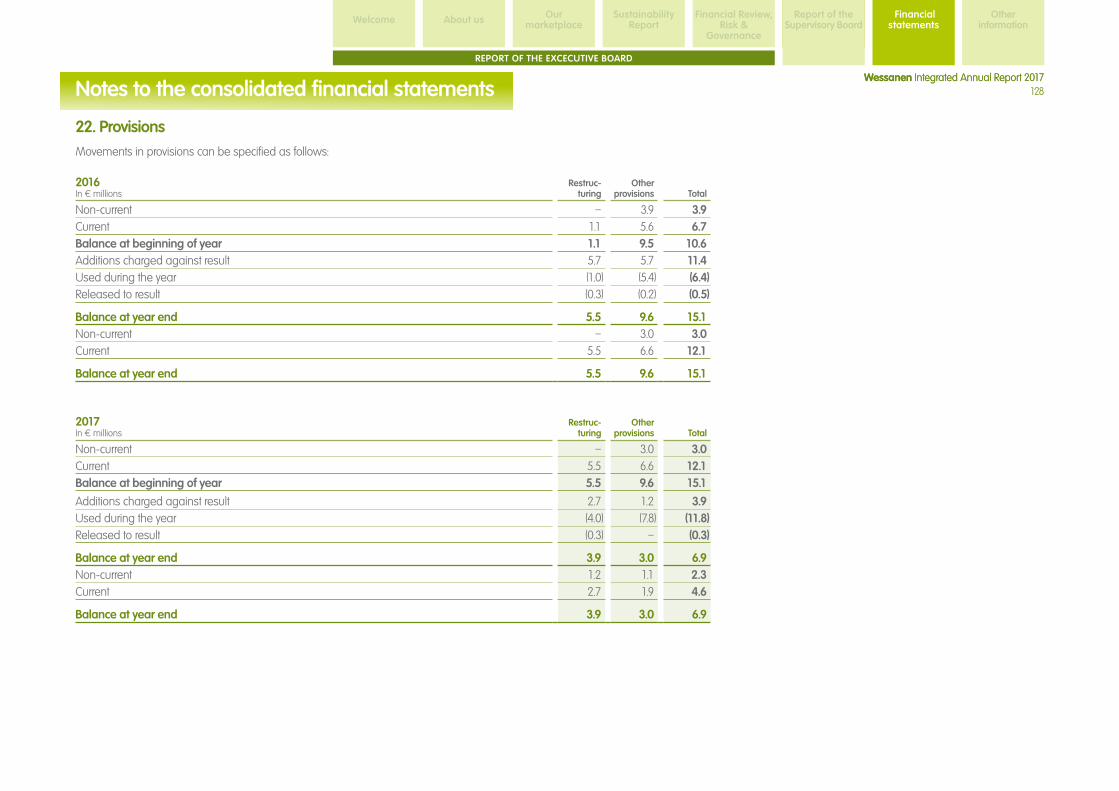
128Wessanen Integrated Annual Report 2017
Sustainability ReportAbout us Financial Review,
Risk & Governance
Report of the Supervisory Board
Our marketplaceWelcome
Wessanen Integrated Annual Report 2017
Report of the Supervisory Board
Financial statements
Other information
REPORT OF THE EXCECUTIVE BOARD
Notes to the consolidated financial statements
22. ProvisionsMovements in provisions can be specified as follows:
2016In € millions
Restruc-turing
Other provisions Total
Non-current – 3.9 3.9 Current 1.1 5.6 6.7 Balance at beginning of year 1.1 9.5 10.6 Additions charged against result 5.7 5.7 11.4 Used during the year (1.0) (5.4) (6.4)Released to result (0.3) (0.2) (0.5)
Balance at year end 5.5 9.6 15.1 Non-current – 3.0 3.0 Current 5.5 6.6 12.1
Balance at year end 5.5 9.6 15.1
2017In € millions
Restruc-turing
Other provisions Total
Non-current – 3.0 3.0 Current 5.5 6.6 12.1 Balance at beginning of year 5.5 9.6 15.1
Additions charged against result 2.7 1.2 3.9 Used during the year (4.0) (7.8) (11.8)Released to result (0.3) – (0.3)
Balance at year end 3.9 3.0 6.9 Non-current 1.2 1.1 2.3 Current 2.7 1.9 4.6
Balance at year end 3.9 3.0 6.9
129Wessanen Integrated Annual Report 2017
Sustainability ReportAbout us Financial Review,
Risk & Governance
Report of the Supervisory Board
Our marketplaceWelcome
Wessanen Integrated Annual Report 2017
Report of the Supervisory Board
Financial statements
Other information
REPORT OF THE EXCECUTIVE BOARD
Notes to the consolidated financial statements
RestructuringIn 2017, additions to the restructuring provision of €2.7, mainly include severance payments relating to the relocation of the distribution centre of Bonneterre et Compagnie (France). In 2016, additions to the restructuring provision of €5.7, mainly included severance payments relating to restructuring plans in respect of our German operations of €5.1 and the integration of Mrs Crimble’s in the UK of €0.3.
The additions to the restructuring provision include severance payments and termination benefits, and required management judgement in estimating the expected cash outflows based on detailed plans. For all restructuring provisions a detailed formal plan exists and the implementation of the plan has started or the plan has been announced before the balance sheet date.
Other provisionsOther provisions as at 31 December 2017 of €3.0 mainly comprise (1) provisions for social security costs related to equity-settled share-based payment transactions of €1.1 (2016: €7.6 related to cash-settled share-based payment transactions, and share-based payment related social security costs) and (2) contract risks of €0.8 (2016: €0.6). The amount recognised as a provision is the best estimate of the consideration required to settle the present obligation at the balance sheet date, taking into account the risks and uncertainties surrounding the obligation.
Additions in 2017 of €1.2 mainly include share-based payment and related social security expenses of €0.5. In 2017, payments of €7.8 were made against the other provisions, including share-based payment and related social security expenses of €7.0 after vesting of the Long Term Incentive Plan 2014 in June 2017.
The release from the restructuring provision of €0.3 is mainly the result of favourable settlements and revised estimates relating to various individual cases. Releases of prior year provisions are accounted for in operating result. The Company expects the provisions at year-end to be utilised mostly within the next year; the cash outflows related to the non-current part of the other provisions will mostly materialise in 2019.

130Wessanen Integrated Annual Report 2017
Sustainability ReportAbout us Financial Review,
Risk & Governance
Report of the Supervisory Board
Our marketplaceWelcome
Wessanen Integrated Annual Report 2017
Report of the Supervisory Board
Financial statements
Other information
REPORT OF THE EXCECUTIVE BOARD
Notes to the consolidated financial statements
23. Trade and non-trade payables and accrued expenses
In € millions
31 December
2017
31 December
2016
Total trade payables – third party 84.8 80.5 Customer incentives 30.8 27.2 Personnel expenses 10.9 11.9 Pensions 4.6 5.1 Social securities and other tax 6.3 5.9 Derivatives 1.2 – Other liabilities 7.7 7.7 Total non-trade payables and accrued expenses 61.5 57.8
Total trade and non-trade payables and accrued expenses 146.3 138.3
The Group’s exposure to currency and liquidity risk related to trade and other payables is disclosed in Note 24.
24. Financial instruments and risk managementThis note presents information about Wessanen’s exposure to liquidity risk, market risk (currency risk, interest rate risk and commodity risk) and credit risk, Wessanen’s objectives, policies and processes for measuring and managing risk, and Wessanen’s management of capital, as well as quantitative disclosures (before income tax) in addition to those included throughout these consolidated financial statements. The Executive Board has overall responsibility for the establishment and oversight of Wessanen’s Risk Management and Internal Control Framework. The framework is designed to enable the Executive Board to achieve its strategic objectives within a managed risk profile. The Executive Board is responsible for setting risk management policies and strategies. Senior management and operating companies conduct a risk assessment to create action plans and comply with internal control procedures. As a Committee of the Supervisory Board, the Audit Committee monitors risk management and control activities and provides the Supervisory Board with a clear overview of the entire risk management and internal control process. Any significant changes and improvements to the Risk Management and Internal Control Framework are discussed with the Audit Committee and the Supervisory Board. Wessanen does business in the UK, through its subsidiary Kallø Foods. The consequences of the UK people’s vote to leave the European Union (Brexit) are as yet not clear, but has had an impact on the Pound Sterling and its volatility. The assessment of potential accounting and financial reporting implications did not (yet) result into any specific actions other than those that are already taken in the ordinary course of business; e.g. currency risks are being mitigated in accordance with our foreign exchange policy, and where possible, through customer price negotiations.
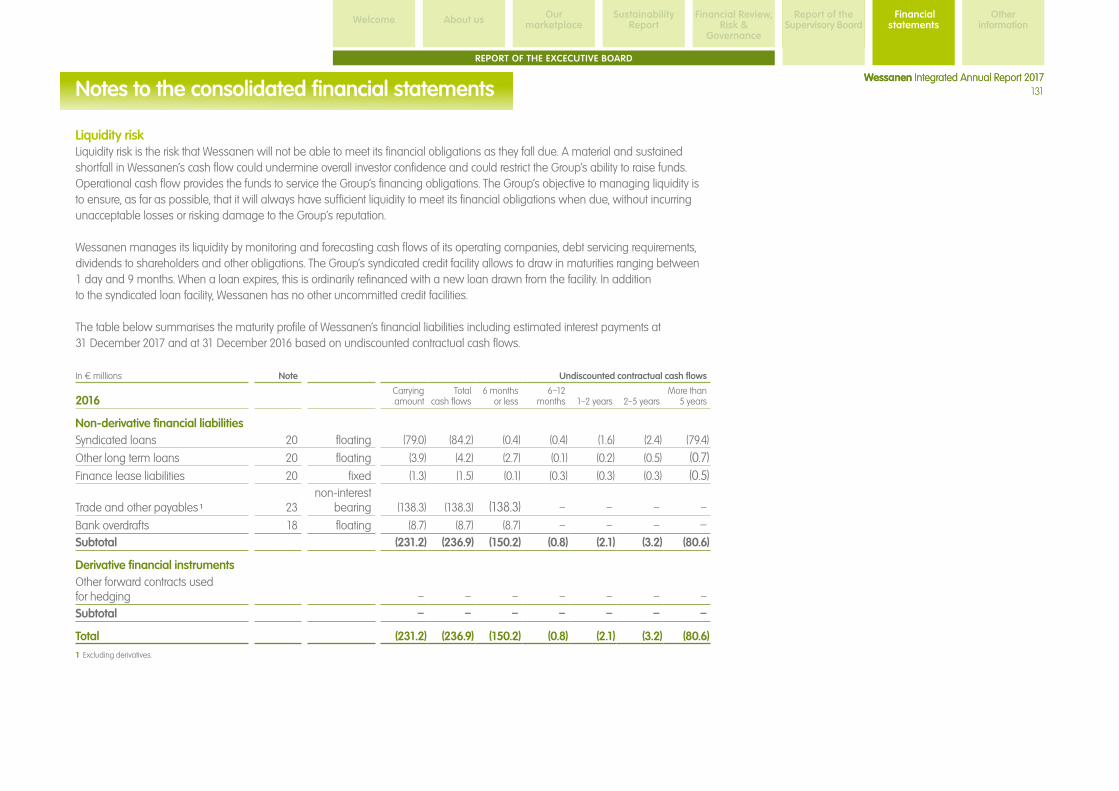
131Wessanen Integrated Annual Report 2017
Sustainability ReportAbout us Financial Review,
Risk & Governance
Report of the Supervisory Board
Our marketplaceWelcome
Wessanen Integrated Annual Report 2017
Report of the Supervisory Board
Financial statements
Other information
REPORT OF THE EXCECUTIVE BOARD
Notes to the consolidated financial statements
Liquidity riskLiquidity risk is the risk that Wessanen will not be able to meet its financial obligations as they fall due. A material and sustained shortfall in Wessanen’s cash flow could undermine overall investor confidence and could restrict the Group’s ability to raise funds. Operational cash flow provides the funds to service the Group’s financing obligations. The Group’s objective to managing liquidity is to ensure, as far as possible, that it will always have sufficient liquidity to meet its financial obligations when due, without incurring unacceptable losses or risking damage to the Group’s reputation. Wessanen manages its liquidity by monitoring and forecasting cash flows of its operating companies, debt servicing requirements, dividends to shareholders and other obligations. The Group’s syndicated credit facility allows to draw in maturities ranging between 1 day and 9 months. When a loan expires, this is ordinarily refinanced with a new loan drawn from the facility. In addition to the syndicated loan facility, Wessanen has no other uncommitted credit facilities. The table below summarises the maturity profile of Wessanen’s financial liabilities including estimated interest payments at 31 December 2017 and at 31 December 2016 based on undiscounted contractual cash flows.
In € millions Note Undiscounted contractual cash flows
2016Carrying amount
Total cash flows
6 months or less
6–12 months 1–2 years 2–5 years
More than 5 years
Non-derivative financial liabilitiesSyndicated loans 20 floating (79.0) (84.2) (0.4) (0.4) (1.6) (2.4) (79.4)
Other long term loans 20 floating (3.9) (4.2) (2.7) (0.1) (0.2) (0.5) (0.7)Finance lease liabilities 20 fixed (1.3) (1.5) (0.1) (0.3) (0.3) (0.3) (0.5)
Trade and other payables 1 23 non-interest
bearing (138.3) (138.3) (138.3) – – – –
Bank overdrafts 18 floating (8.7) (8.7) (8.7) – – – –Subtotal (231.2) (236.9) (150.2) (0.8) (2.1) (3.2) (80.6)
Derivative financial instrumentsOther forward contracts used for hedging – – – – – – –Subtotal – – – – – – –
Total (231.2) (236.9) (150.2) (0.8) (2.1) (3.2) (80.6)1 Excluding derivatives.

132Wessanen Integrated Annual Report 2017
Sustainability ReportAbout us Financial Review,
Risk & Governance
Report of the Supervisory Board
Our marketplaceWelcome
Wessanen Integrated Annual Report 2017
Report of the Supervisory Board
Financial statements
Other information
REPORT OF THE EXCECUTIVE BOARD
Notes to the consolidated financial statements
In € millions Note Undiscounted contractual cash flows
2017Carrying amount
Total cash flows
6 months or less
6–12 months 1–2 years 2–5 years
More than 5 years
Non-derivative financial liabilitiesSyndicated loans 20 floating (54.7) (56.9) (0.2) (0.2) (0.7) (55.8) – Other long term loans 20 floating (4.6) (4.8) (3.5) (0.1) (0.2) (0.5) (0.5)Finance lease liabilities 20 fixed (5.6) (6.3) (0.1) (0.4) (0.6) (1.4) (3.8)
Trade and other payables 1 23 non-interest
bearing (145.1) (145.1) (145.1) – – – – Bank overdrafts 18 floating (8.8) (8.8) (8.8) – – – – Subtotal (218.8) (221.9) (157.7) (0.7) (1.5) (57.7) (4.3)
Derivative financial instrumentsOther forward contracts used for hedging (1.2) (1.2) (1.2) – – – – Subtotal (1.2) (1.2) (1.2) – – – –
Total (220.0) (223.1) (158.9) (0.7) (1.5) (57.7) (4.3)1 Excluding derivatives.
Currency riskWessanen conducts business in foreign currencies but publishes its financial statements, and measures its performance, in Euros. These foreign currencies mainly include the Pound Sterling and US dollar. Because of the Group’s international presence, it is subject to risks from changes in foreign currency values that could affect earnings and capital. The Group has a foreign exchange policy in order to mitigate the impact of foreign currencies to functional currencies and is based on the following principles:
– Transactions arising from operational and financing activities, in currencies other than the functional currency, are hedged in order to mitigate income statement volatility. All operating companies conduct their hedging transactions internally through the centralised corporate treasury department. Wessanen provides operational funding to its operating companies in their functional currency.
– Translation results on capital invested in foreign subsidiaries are recorded as a movement in the translation reserve in equity. Capital invested in, and net income from foreign subsidiaries are not hedged to the Euro.
Further, hedging foreign exchange risk is achieved through the use of forward foreign exchange contracts and forward foreign exchange swaps. Hedge accounting is applied for transactions that exceed certain thresholds.

133Wessanen Integrated Annual Report 2017
Sustainability ReportAbout us Financial Review,
Risk & Governance
Report of the Supervisory Board
Our marketplaceWelcome
Wessanen Integrated Annual Report 2017
Report of the Supervisory Board
Financial statements
Other information
REPORT OF THE EXCECUTIVE BOARD
Notes to the consolidated financial statements
The Group’s balance sheet exposure to foreign currency risk was as follows based on notional amounts:
In € millions 31 December 2017 31 December 2016
€ US$ £ Other € US$ £ Other
Trade and other receivables 5.2 0.1 – – 0.1 0.7 – –Cash and bank overdrafts – 2.5 0.9 0.3 – 0.8 2.8 0.2 Trade payables (5.0) (1.3) – (0.1) (4.6) (0.9) – –Financial assets/(liabilities), excluding investments in subsidiaries – – (17.2) – – – (10.9) –Derivatives 2 13.9 – – – 15.4 – – –
Net exposure 14.1 1.3 (16.3) 0.2 10.9 0.6 (8.1) 0.2 1 In €.
2 Represents forward foreign exchange contracts related to future purchase commitments, as well as foreign exchange swaps.
At year end 2017 the Group designated £17 (2016: £17) of intercompany loan financing as part of its net investment in its UK operations. Foreign currency results on this intercompany loan financing of €0.7 negative (net of income tax) in 2017 (2016: €3.3 negative (net of income tax)) are recorded in the translation reserve in equity .
In 2017, currency translation differences of €(1.3) (2016: €(5.2)) relate entirely to the depreciation of the GBP.
Currency sensitivity analysisA 10% strengthening of the Euro against the Pound Sterling currency in 2017 would have had hypothetical impact on equity and net result by the amounts shown below. This analysis assumes that all other variables, in particular interest rates, remain constant.
In € millions£
2017£
2016
10% strengthening of the EuroEquity 1 (5.5) (4.5)Net result (0.5) (0.4)
1 Including impact on net result.
1 1
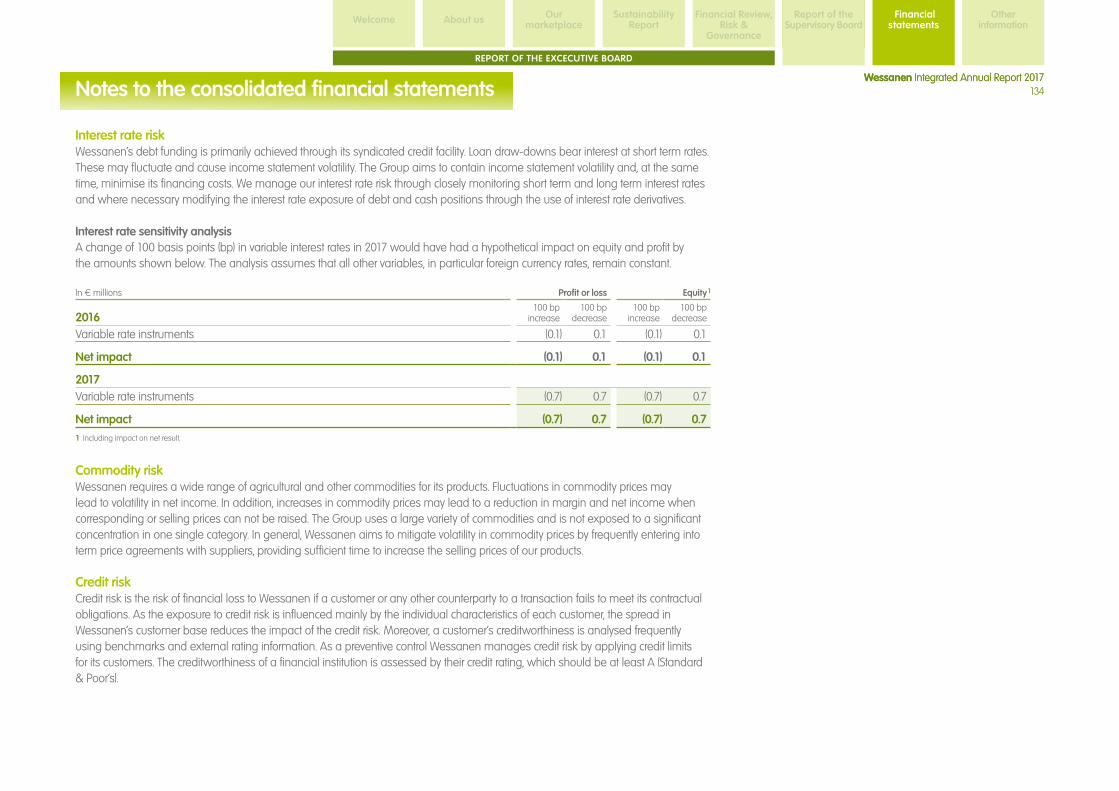
134Wessanen Integrated Annual Report 2017
Sustainability ReportAbout us Financial Review,
Risk & Governance
Report of the Supervisory Board
Our marketplaceWelcome
Wessanen Integrated Annual Report 2017
Report of the Supervisory Board
Financial statements
Other information
REPORT OF THE EXCECUTIVE BOARD
Notes to the consolidated financial statements
Interest rate riskWessanen’s debt funding is primarily achieved through its syndicated credit facility. Loan draw-downs bear interest at short term rates. These may fluctuate and cause income statement volatility. The Group aims to contain income statement volatility and, at the same time, minimise its financing costs. We manage our interest rate risk through closely monitoring short term and long term interest rates and where necessary modifying the interest rate exposure of debt and cash positions through the use of interest rate derivatives.
Interest rate sensitivity analysisA change of 100 basis points (bp) in variable interest rates in 2017 would have had a hypothetical impact on equity and profit by the amounts shown below. The analysis assumes that all other variables, in particular foreign currency rates, remain constant.
In € millions Profit or loss Equity
2016100 bp
increase100 bp
decrease100 bp
increase100 bp
decrease
Variable rate instruments (0.1) 0.1 (0.1) 0.1
Net impact (0.1) 0.1 (0.1) 0.1
2017Variable rate instruments (0.7) 0.7 (0.7) 0.7
Net impact (0.7) 0.7 (0.7) 0.71 Including impact on net result.
Commodity riskWessanen requires a wide range of agricultural and other commodities for its products. Fluctuations in commodity prices may lead to volatility in net income. In addition, increases in commodity prices may lead to a reduction in margin and net income when corresponding or selling prices can not be raised. The Group uses a large variety of commodities and is not exposed to a significant concentration in one single category. In general, Wessanen aims to mitigate volatility in commodity prices by frequently entering into term price agreements with suppliers, providing sufficient time to increase the selling prices of our products.
Credit riskCredit risk is the risk of financial loss to Wessanen if a customer or any other counterparty to a transaction fails to meet its contractual obligations. As the exposure to credit risk is influenced mainly by the individual characteristics of each customer, the spread in Wessanen’s customer base reduces the impact of the credit risk. Moreover, a customer’s creditworthiness is analysed frequently using benchmarks and external rating information. As a preventive control Wessanen manages credit risk by applying credit limits for its customers. The creditworthiness of a financial institution is assessed by their credit rating, which should be at least A (Standard & Poor’s).
1
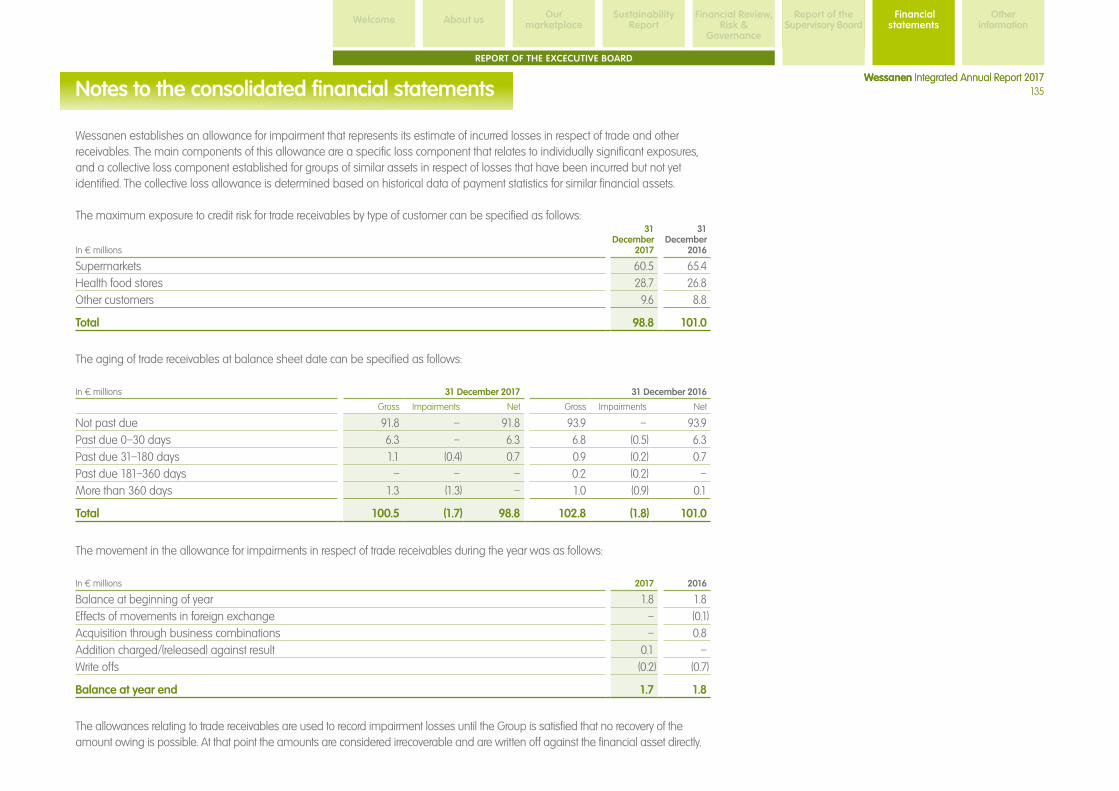
135Wessanen Integrated Annual Report 2017
Sustainability ReportAbout us Financial Review,
Risk & Governance
Report of the Supervisory Board
Our marketplaceWelcome
Wessanen Integrated Annual Report 2017
Report of the Supervisory Board
Financial statements
Other information
REPORT OF THE EXCECUTIVE BOARD
Notes to the consolidated financial statements
Wessanen establishes an allowance for impairment that represents its estimate of incurred losses in respect of trade and other receivables. The main components of this allowance are a specific loss component that relates to individually significant exposures, and a collective loss component established for groups of similar assets in respect of losses that have been incurred but not yet identified. The collective loss allowance is determined based on historical data of payment statistics for similar financial assets. The maximum exposure to credit risk for trade receivables by type of customer can be specified as follows:
In € millions
31 December
2017
31 December
2016
Supermarkets 60.5 65.4 Health food stores 28.7 26.8 Other customers 9.6 8.8
Total 98.8 101.0
The aging of trade receivables at balance sheet date can be specified as follows:
In € millions 31 December 2017 31 December 2016
Gross Impairments Net Gross Impairments Net
Not past due 91.8 – 91.8 93.9 – 93.9 Past due 0–30 days 6.3 – 6.3 6.8 (0.5) 6.3 Past due 31–180 days 1.1 (0.4) 0.7 0.9 (0.2) 0.7 Past due 181–360 days – – – 0.2 (0.2) – More than 360 days 1.3 (1.3) – 1.0 (0.9) 0.1
Total 100.5 (1.7) 98.8 102.8 (1.8) 101.0
The movement in the allowance for impairments in respect of trade receivables during the year was as follows:
In € millions 2017 2016
Balance at beginning of year 1.8 1.8 Effects of movements in foreign exchange – (0.1)Acquisition through business combinations – 0.8 Addition charged/(released) against result 0.1 – Write offs (0.2) (0.7)
Balance at year end 1.7 1.8
The allowances relating to trade receivables are used to record impairment losses until the Group is satisfied that no recovery of the amount owing is possible. At that point the amounts are considered irrecoverable and are written off against the financial asset directly.

136Wessanen Integrated Annual Report 2017
Sustainability ReportAbout us Financial Review,
Risk & Governance
Report of the Supervisory Board
Our marketplaceWelcome
Wessanen Integrated Annual Report 2017
Report of the Supervisory Board
Financial statements
Other information
REPORT OF THE EXCECUTIVE BOARD
Notes to the consolidated financial statements
Recurring fair value measurements versus carrying amountsFair values of financial assets and liabilities, together with the carrying amounts shown in the statement of financial position are as follows:
In € millions 31 December 2017 31 December 2016
Carrying amount
Fair value
Carrying amount
Fair value
Assets carried at fair valueForeign exchange swap contracts used for hedging – – 0.2 0.2
Total – – 0.2 0.2
Assets carried at amortised costOther investments 0.2 0.2 0.6 0.6 Trade receivables 98.8 98.8 101.0 101.0 Other receivables and prepayments 1 14.9 14.9 15.3 15.3 Cash and cash equivalents 13.8 13.8 9.4 9.4
Total 127.7 127.7 126.3 126.3
Liabilities carried at fair valueForward exchange contracts used for hedging 1.2 1.2 – –
Total 1.2 1.2 – –
Liabilities carried at amortised cost
Syndicated loans 54.7 54.7 79.0 79.0
Other long term loans 4.6 4.6 3.9 3.9 Finance lease liabilities 5.6 5.6 1.3 1.3 Trade payables 84.8 84.8 80.5 80.5 Non-trade payables and accrued expenses 1 60.3 60.3 57.8 57.8 Bank overdrafts 8.8 8.8 8.7 8.7
Total 218.8 218.8 231.2 231.2 1 Excluding derivatives, which are shown separately.

137Wessanen Integrated Annual Report 2017
Sustainability ReportAbout us Financial Review,
Risk & Governance
Report of the Supervisory Board
Our marketplaceWelcome
Wessanen Integrated Annual Report 2017
Report of the Supervisory Board
Financial statements
Other information
REPORT OF THE EXCECUTIVE BOARD
Notes to the consolidated financial statements
Fair value of financial assets and liabilitiesThe carrying amounts of cash and cash equivalents, trade receivables, other receivables and prepayments, trade payables and bank overdrafts approximate their fair values because of the short-term nature of these instruments. The carrying amounts of the amounts owed to credit institutions approximate their fair values, as the amounts are floating interest-bearing. The fair value of financial instruments has been determined by Wessanen using available market information and appropriate valuation methods (level 2 only). Foreign currency forward contracts are measured using quoted forward exchange rates and yield curves derived from quoted interest rates matching maturities of the contracts.
The fair value of the derivatives as at 31 December 2017 (as specified in the table in this note under paragraph ‘currency risk’) amounts to €(1.2) (2016: €0.2). These derivatives have been entered into with financial institutions. An assessment has been made of a potential credit valuation adjustment, however, has not been recorded as the adjustment is deemed to be not material. Level 2 inputs other than quoted prices that are observable for the asset or liability, either directly (i.e. as prices) or indirectly (i.e. derived from prices).
Capital managementWessanen’s financing strategy is built around the following objectives:
– Ongoing access to debt and equity markets;
– Sufficient flexibility to fund add-on acquisitions;
– Optimal weighted average cost of capital;
– Mitigating financial risks.
The capital structure of the Company balances these objectives in order to meet the Company’s strategic objectives and day-to-day needs. Our targeted net debt level is aimed to be below 2.5 times consolidated EBITDAIE of total Wessanen, but our actual net debt levels can be higher or lower depending on acquisitions and divestments, access to capital markets and the timing of cash flows. At 31 December 2017 our net debt level amounted to 1.0 times consolidated EBITDAIE (2016: 1.5). As a consequence the gearing ratio (net debt/shareholders’ equity) as at 31 December 2017 amounted to 26.3% (31 December 2016: 43.7%).

138Wessanen Integrated Annual Report 2017
Sustainability ReportAbout us Financial Review,
Risk & Governance
Report of the Supervisory Board
Our marketplaceWelcome
Wessanen Integrated Annual Report 2017
Report of the Supervisory Board
Financial statements
Other information
REPORT OF THE EXCECUTIVE BOARD
Notes to the consolidated financial statements
25. Commitments and contingenciesOperating lease commitmentsNon-cancellable operating leases are payable as follows:
In € millions
31 December
2017
31 December
2016
Less than 1 year 4.8 4.4 Between 1 and 5 years 11.3 10.2 More than 5 years 4.5 5.3
Total non-cancellable operating lease commitments 20.6 19.9
Wessanen leases a number of office, warehouse and factory facilities, machinery and installations, office equipment, computer software and hardware and vehicles under operating leases. The leases typically run between 3 and 15 years, with an option to renew after that date. Lease payments are adjusted annually to reflect market rentals. None of the leases include contingent rentals. Wessanen does, in principle, not act as a lessor. During the year ended 31 December 2017, €3.8 (2016: €3.6) was recognised as an expense in the income statement.
Capital commitmentsCommitments to purchase property, plant and equipment as at 31 December 2017 amounted to €10.5 (2016: €1.1). This includes the construction of a green office building in Saint Genis Laval (France). The gross investment value (total investment excluding proceeds from the sale of a piece of land) amounts to about €13.1. The construction is funded by a financial institution and is accounted for as a financial lease. The non-cash investment value of this project as at 31 December 2017 amounts to €5.0; the remaining balance of €8.1 is included in the reported commitments of €10.5.
Commitments to purchase intangible assets as at 31 December 2017 amounted to €0.3 (2016: €0.5).
Purchase commitmentsWessanen has purchase commitments with vendors in the ordinary course of business at market-related terms. Wessanen has letters of credit outstanding in the amount of €0.2 related to these purchase commitments.
GuaranteesWessanen has various letters of credit and guarantees outstanding to third parties amounting to US$11.7 as at 31 December 2017 (2016: US$15.0). Letters of credit amounting to US$2.2 (2016: US$2.6) are provided in favour of workers compensation insurers and are reduced as the workers compensation claims, on the divested operations ABC and Tree of Life, Inc., are settled and closed. Wessanen has also provided guarantees amounting to US$9.6 (2016: US$12.4) relating to lease obligations of Tree of Life, Inc. which are reduced when the underlying lease contracts expire during a maximum period of up to five years. Kehe Food Distributors Inc. has indemnified Wessanen for calls of third parties under such guarantees and, to the extent these claims are related to Tree

139Wessanen Integrated Annual Report 2017
Sustainability ReportAbout us Financial Review,
Risk & Governance
Report of the Supervisory Board
Our marketplaceWelcome
Wessanen Integrated Annual Report 2017
Report of the Supervisory Board
Financial statements
Other information
REPORT OF THE EXCECUTIVE BOARD
Notes to the consolidated financial statements
of Life, Inc., letters of credit. For guarantees provided, a provision has been made in the amount of €0.6 as at 31 December 2017 (2016: €0.6). Reference is made to Note 22. Bank guarantees have been issued in the amount of €0.3 (2016: €0.3).
Contingent assets and liabilitiesWessanen is subject to certain other loss contingencies arising from claims by various parties. Management believes that any reasonable possible loss related to such claims and possible litigation is properly provided for when recognition criteria are met. These estimates and associated assumptions are based on management’s best knowledge of current events and actions.
26. Related partiesWessanen has a related party relationship with its subsidiaries (see Note 29) and key management. Transactions with key management are described in Notes 7 and 8.
In 2017 no transactions were made with related parties, other than descibed above.
27. Principal auditor’s remunerationPrincipal auditor’s remuneration for audit and other services incurred can be specified as follows:
In € millions 2017 2016
Deloitte Accoun tants
B.V.
Other Deloitte
Network Total
Deloitte Accoun tants
B.V.
Other Deloitte
Network Total
Audit of annual accounts 0.2 0.3 0.5 0.2 0.3 0.5Other assurance services – – – – – –Other non-audit services – – – – – –
Total principal auditor’s remuneration 0.2 0.3 0.5 0.2 0.3 0.5

140Wessanen Integrated Annual Report 2017
Sustainability ReportAbout us Financial Review,
Risk & Governance
Report of the Supervisory Board
Our marketplaceWelcome
Wessanen Integrated Annual Report 2017
Report of the Supervisory Board
Financial statements
Other information
REPORT OF THE EXCECUTIVE BOARD
Notes to the consolidated financial statements
28. Cash flowThe following table presents a specification of changes in working capital:
In € millions 2017 2016
Inventories (8.3) (0.9)Trade receivables 1.5 0.3 Other receivables and prepayments 0.2 3.7 Trade payables 5.2 2.3 Non-trade payables and accrued expenses 2.6 (1.9)
Total changes in working capital 1.2 3.5
The following table presents a reconciliation of the change in cash and cash equivalents (net of bank overdrafts) as presented in the balance sheet to the net cash flow from operating, investing and financing activities in the period:
In € millions 2017 2016
Net cash and cash equivalents at beginning of year 1 0.7 23.2 Net cash from operating, investing and financing activities 4.3 (22.3)Effect of exchange rate differences on cash and cash equivalents 1 – (0.2)
Net cash and cash equivalents at year end1 5.0 0.7 1 Net of bank overdrafts.

141Wessanen Integrated Annual Report 2017
Sustainability ReportAbout us Financial Review,
Risk & Governance
Report of the Supervisory Board
Our marketplaceWelcome
Wessanen Integrated Annual Report 2017
Report of the Supervisory Board
Financial statements
Other information
REPORT OF THE EXCECUTIVE BOARD
Notes to the consolidated financial statements
29. List of subsidiariesThe following are Wessanen’s significant subsidiaries categorised into operating companies and holding companies:
Company name Principal activityCountry of incorporation
Ownership interest (%) 31 December 2017
Ownership interest (%) 31 December 2016
Operating companiesBjorg et Compagnie S.A.S. Marketing and Sales France 100.0 100.0 Bjorg Bonneterre et Compagnie S.A.S. Marketing and Sales France 100.0 100.0 Bonneterre et Compagnie S.A.S. Marketing and Sales France 100.0 100.0 Destination S.A.S. 1 Production/Marketing and Sales France 100.0 100.0 Allos GmbH Production Germany 100.0 100.0 CoSa Naturprodukte GmbH Marketing and Sales Germany 100.0 100.0 Allos Schwarzwald GmbH Production Germany 100.0 100.0 Allos Hof-Manufaktur GmbH Marketing and Sales Germany 100.0 100.0 Abafoods S.r.L. Production/Marketing and Sales Italy 100.0 100.0 Bio Slym S.r.L. Production/Marketing and Sales Italy 100.0 100.0 Biogran S.L. 2 Production/Marketing and Sales Spain 100.0 100.0 Wessanen Benelux B.V. Marketing and Sales the Netherlands 100.0 100.0 Kallø Foods Ltd Production/Marketing and Sales United Kingdom 100.0 100.0 Mrs Crimble’s Ltd 3 Marketing and Sales United Kingdom 100.0 100.0
Holding companiesWessanen France Holding S.A.S. Holding France 100.0 100.0 Wessanen Deutschland GmbH Holding Germany 100.0 100.0 Wessanen Italia S.r.L. Holding Italy 100.0 100.0Wessanen Espana S.L. 4 Holding Spain 100.0 – Wessanen Finance B.V. Holding the Netherlands 100.0 100.0 Wessanen Nederland Holding B.V. Holding the Netherlands 100.0 100.0 Wessanen Great Britain Holdings Ltd Holding the Netherlands 100.0 100.0
1 Destination is a wholly owned subsidiary of Ineobio which was acquired as per 1 June 2016.
2 Acquired as per 5 December 2016.
3 Acquired as per 1 July 2016. As per 1 April 2017 all assets and activities of Mrs Crimble’s Ltd have been transferred to Kallø Foods Ltd.
4 Founded as per 20 December 2017.
At 31 December 2017 and 31 December 2016 all subsidiaries of Wessanen are wholly owned and there are no significant restrictions on the Company’s or its subsidiaries’ ability to access or use the assets and settle the liabilities of the Group.

142Wessanen Integrated Annual Report 2017Wessanen Integrated Annual Report 2017
SustainabilityAbout us Financial Review, Risk &
Governance
Report of the Supervisory Board
Our marketplaceWelcome
Wessanen Integrated Annual Report 2017
Report of the Supervisory Board
Financial statements
Other information
REPORT OF THE EXCECUTIVE BOARD
Income statement of the CompanyIn € millions Notes 2017 2016
Personnel expenses 2 (2.7) (2.5)Other operating income 3 2.1 2.0 Operating result (0.6) (0.5)Net financing costs 4 (0.6) (3.3)Profit/(loss) before income tax (1.2) (3.8)Income tax 5 - 0.8 Profit/(loss) after income tax (1.2) (3.0)Income from subsidiaries, net of income tax 6 37.2 25.8
Profit/(loss) for the period 36.0 22.8
Balance sheet of the Company(before appropriation of current year’s result)
In € millions Notes
31 December
2017
31 December
2016
AssetsFinancial assets 6 218.8 534.3 Deferred tax assets 5 5.0 5.0 Total non-current assets 223.8 539.3 Total current assets 7 6.1 2.1
Total assets 229.9 541.4
Shareholders' equityShare capital 76.1 76.0 Share premium 102.8 102.9 Reserve for own shares - (3.9)Legal reserves (17.5) (16.2)Retained earnings 30.3 9.6 Profit for the period 36.0 22.8 Total shareholders' equity 8 227.7 191.2 Current liabilities 9 2.2 350.2
Total shareholders' equity and liabilities 229.9 541.4
Income statement and balance sheet of the Company

143Wessanen Integrated Annual Report 2017Wessanen Integrated Annual Report 2017
SustainabilityAbout us Financial Review, Risk &
Governance
Report of the Supervisory Board
Our marketplaceWelcome
Wessanen Integrated Annual Report 2017
Report of the Supervisory Board
Financial statements
Other information
REPORT OF THE EXCECUTIVE BOARD
1. Principles of valuation and income determination
GeneralThe Company financial statements are part of the 2017 financial statements of Wessanen.
In accordance with Section 379, Part 9, of Book 2 of the Dutch Civil Code, a list of consolidated group companies will be deposited at the Trade Register of the Amsterdam Chamber of Commerce, together with the financial statements (the Company is registered with number 33145851).
Principles for the measurement of assets and liabilities and the determination of the resultFor establishing the principles for the recognition and measurement of assets and liabilities and determination of the result for its Company financial statements, Wessanen makes use of the option provided in Section 362, Part 9, of Book 2 of the Dutch Civil Code. This means that the principles for the recognition and measurement of assets and liabilities and determination of the result (hereinafter referred to as principles for recognition and measurement) of the Company financial statements of Wessanen are the same as those applied for the consolidated financial statements (see Note 3 of the consolidated financial statements). The consolidated financial statements are prepared in accordance with International Financial Reporting Standards as adopted by the European Union.
2. Personnel expensesPersonnel expenses amount to €2.7 (2016: €2.5) and include remuneration expenses of the Executive and Supervisory Board of €2.5 (2016: €2.3). Reference is made to Note 7 of the consolidated financial statements of Wessanen.
3. Other operating incomeOther operating income includes recharged expenses to Wessanen Nederland Holding B.V. for services rendered in 2017 of €2.1 in total (2016: €2.0).
4. Net financing costsNet financing costs amount to €0.6 (2016: €3.3) and consist of interest expenses on payables to subsidiaries.
5. Income taxIn 2017 income tax amounts to €0.0 (in 2016 an income tax gain was realised of €0.8 relating to the recognition of unrecognised income tax losses in the Netherlands).
The deferred tax asset as at 31 December 2017 of €5.0 fully relate to income tax losses carried forward recognised (2016: €5.0).
6. Financial assets
In € millions 2017 2016
Balance at beginning of year 534.3 514.3 Remeasurement of post employment benefit obligations1 – (0.5)Effect of movements in foreign exchange 1 (1.3) (5.2)Cash flow hedges1 – (0.1)Dividends from subsidiaries (377.3) –Capital contributions to subsidiaries 25.9 –Income from subsidiaries 1 37.2 25.8
Balance at year end 218.8 534.3 1 Net of income tax.
Financial assets include investments in subsidiaries. In 2017 the Company received a dividend in the amount of €377.3 from Wessanen Finance B.V. and made a capital contribution to Wessanen Nederland Holding B.V. in the amount of €25.9.
7. Current assets
In € millions
31 December
2017
31 December
2016
Receivables from subsidiaries 6.0 2.1Other current assets 0.1 -
Total current assets 6.1 2.1
8. Shareholders’ equityFor a specification of shareholders’ equity, see the consolidated statement of changes in equity (page 87) and Note 19 to the consolidated financial statements. Legal reserves (translation reserve, hedging reserve and other legal reserves) are not available for distribution to the Company’s equity holders. If the translation reserve, hedging reserve or other legal reserves have a negative balance, distribution to the Company’s equity holders is restricted to the extent of the negative balance. As at 31 December 2017, the freely distributable reserves amount to €151.6 (2016: €115.2), before distribution of dividends.
9. Current liabilities
In € millions
31 December
2017
31 December
2016
Payables to subsidiaries 1.4 349.5Trade and other payables 0.8 0.7
Total current liabilities 2.2 350.2
Payables to subsidiaries decreased by €348.1 following dividend payments received from Wessanen Finance B.V. in 2017 in the amount of €377.3.
Notes to the financial statements of the Company

144Wessanen Integrated Annual Report 2017
Sustainability ReportAbout us Financial Review,
Risk & Governance
Report of the Supervisory Board
Our marketplaceWelcome
Wessanen Integrated Annual Report 2017
Report of the Supervisory Board
Financial statements
Other information
REPORT OF THE EXCECUTIVE BOARD
Notes to the financial statements of the Company
10. Commitments and contingenciesThe Company is part of the fiscal unity with its Dutch subsidiaries. Based on this, the Company is liable for the tax liability of the fiscal unity in the Netherlands as a whole.
The Company has also assumed liability for the Dutch Group companies of which the financial statements have been included in the consolidated financial statements, as provided for in Section 403, sub 1, Part 9, of Book 2 of the Dutch Civil Code. This implies that these Group companies are not required to prepare their financial statements in every respect in accordance with Part 9, of Book 2 of the Dutch Civil Code or to publish them.
11. Remuneration Executive Board and Supervisory Board
For the remuneration of the Executive Board and Supervisory Board reference is made to Note 7 to the consolidated financial statements. The average number of full-time employees in 2017 amounted to 2 (2016: 2).
12. Principal auditor’s remunerationFor the principal auditor’s remuneration reference is made to Note 27 of the consolidated financial statements.
13. Appropriation of result 2017The profit for the year 2017 attributable to the equity holders of Wessanen amounted to €36.0 (2016: €22.8). The profit has been added to the retained earnings, respectively the distributable part of shareholders’ equity.
14. Dividend proposalThe dividend policy of the Company aims at creating value in the long term. The objective of the dividend policy is to maintain a healthy financial structure and to retain sufficient earnings in order to execute Wessanen’s four pillar strategy. Wessanen aims at paying out a dividend that is stable or growing over time. Before deciding to pay out dividend, Wessanen will assess whether more value could be created by (i) investing profit in the execution of Wessanen’s strategy (such as investments in R&D, capital expenditures or acquisitions), (ii) improving Wessanen’s financial position (debt repayment), or (iii) improving the position of its shareholders (share repurchasing). Accordingly, it may be decided not to pay dividend or to pay a lower dividend in any year in the future.
In line with the dividend policy, it is proposed to the Annual General Meeting of Shareholders to pay a dividend of 13 eurocent per share. The dividend will be paid wholly in cash.
15. Subsequent eventsSubsequent to 31 December 2017 no material events occurred that require disclosure.
Amsterdam, 12 February 2018
Supervisory Board Executive BoardF. van Oers, Chairman C.P.J. Barnouin, CEO R.K. Kluiber R.J.J.B. Merckx, CFO P.E.M. Mispolet I.M.C.M. Rietjens

145Wessanen Integrated Annual Report 2017Wessanen Integrated Annual Report 2017
SustainabilityAbout us Financial Review, Risk &
Governance
Report of the Supervisory Board
Our marketplaceWelcome
Wessanen Integrated Annual Report 2017
Report of the Supervisory Board
REPORT OF THE EXCECUTIVE BOARD
Financial statements
Other information
To the Shareholders and Supervisory Board of Koninklijke Wessanen N.V.
Report on the audit of the financial statements 2017Our opinionWe have audited the accompanying financial statements 2017 as set out on pages 83 to 144 of the integrated annual report of Koninklijke Wessanen N.V. (‘the Company’) based in Amsterdam. The financial statements include the consolidated financial statements and the company financial statements.
In our opinion:
– The accompanying consolidated financial statements give a true and fair view of the financial position of Koninklijke Wessanen N.V. as at 31 December 2017, and of its results and cash flows for 2017 in accordance with International Financial Reporting Standards as adopted by the European Union (‘IFRS-EU’) and with Part 9 of Book 2 of the Dutch Civil Code.
– The accompanying company financial statements give a true and fair view of the financial position of Koninklijke Wessanen N.V. as at 31 December 2017, and of its results for 2017 in accordance with Part 9 of Book 2 of the Dutch Civil Code.
The consolidated financial statements comprise:1. The consolidated statement of financial position as at
31 December 2017.2. The following statements for 2017: the consolidated income
statement, the consolidated statements of comprehensive income, changes in equity and cash flows.
3. The notes comprising a summary of the significant accounting policies and other explanatory information.
The company financial statements comprise:1. The company balance sheet as at 31 December 2017.2. The company income statement for 2017.
3. The notes comprising a summary of the accounting policies and other explanatory information.
Basis for our opinionWe conducted our audit in accordance with Dutch law, including the Dutch Standards on Auditing. Our responsibilities under those standards are further described in the “Our Responsibilities for the audit of the financial statements” section of our report.
We are independent of Koninklijke Wessanen N.V. in accordance with the EU Regulation on specific requirements regarding statutory audit of public-interest entities, the Wet toezicht accountantsorganisaties (Wta, Audit firms supervision act), the Verordening inzake de onafhankelijkheid van accountants bij assurance-opdrachten (ViO, Code of Ethics for Professional Accountants, a regulation with respect to independence) and other relevant independence regulations in the Netherlands. Furthermore we have complied with the Verordening gedrags- en beroepsregels accountants (VGBA, Dutch Code of Ethics).
We believe that the audit evidence we have obtained is sufficient and appropriate to provide a basis for our opinion.
MaterialityBased on our professional judgment we determined materiality for the financial statements as a whole at €3.5 million. The materiality is based on a percentage of 6.5% of normalized operating result (i.e. ‘EBITE’) from continuing operations. We have also taken into account misstatements and possible misstatements that in our opinion are material for the users of the financial statements for qualitative reasons.
To address the aggregation risk of identified misstatements exceeding the materiality we have applied lower materiality levels for the audits of group entities in a range between €1.5 million to €2.7 million.
We agreed with the Supervisory Board that misstatements in excess of €100 thousand, which are identified during the audit, would be reported to them, as well as smaller misstatements that in our view must be reported on qualitative grounds.
Scope of the group auditKoninklijke Wessanen N.V. is at the head of a group of entities. The financial information of this group is included in the consolidated financial statements of Koninklijke Wessanen N.V.
Our group audit mainly focused on significant group entities (components) in terms of size and financial interest or where significant risks or other complexities were present, leading to the completion of the group audit in accordance with the following scope:
– We have performed audit procedures ourselves at Wessanen components in the Netherlands. Furthermore we performed audit procedures at group level on the areas that to a large extend are monitored centrally by Wessanen such as consolidation, disclosures, goodwill impairment analysis, financial instruments, taxation and treasury.
– Deloitte specialists were involved to assist the audit teams at group and component level, including specialists in the areas of pensions, taxation, valuation and information technology.
– We have used the work of others, part of Deloitte’s network, when auditing group entities in France, United Kingdom, Germany, Italy and Spain.
– For the remaining components not in our group scope we performed, amongst others, analytical procedures at group level to corroborate our assessment that there were no risk of material misstatements within those components.
– In the context of the Company’s consolidated financial reporting we have considered its Internal Control Framework, including the IT environment. We focused particularly on relevant controls addressing significant risks of material misstatement and relied on controls where we deemed this to be the most efficient and effective audit approach. We evaluated Wessanen’s response and mitigating actions to address any ineffective elements identified in their
Independent auditor’s report

146Wessanen Integrated Annual Report 2017
Sustainability ReportAbout us Financial Review,
Risk & Governance
Report of the Supervisory Board
Our marketplaceWelcome
Wessanen Integrated Annual Report 2017
Report of the Supervisory Board
REPORT OF THE EXCECUTIVE BOARD
Financial statements
Other information
system of internal controls as disclosed on page 57 of the integrated annual report.
The group audit team provided detailed instructions to all auditors of the significant group entities, including details about the relevant significant audit risks of material misstatement, and set out the information required to be reported to the group audit team. We developed a plan for overseeing each component audit team based on its relative significance to the company. During the year we visited all foreign Wessanen components, local audit teams, performed file reviews and joined closing meetings.
By performing the procedures mentioned above at group entities, together with additional procedures at group level, we have been able to obtain sufficient and appropriate audit evidence about the group’s financial information to provide an opinion about the consolidated financial statements.
Our key audit mattersKey audit matters are those matters that, in our professional judgment, were of most significance in our audit of the consolidated financial statements. Previously reported key audit matters are no longer included in this year’s auditor’s report since they are no longer considered significant compared to other matters we report on. We have communicated the key audit matters to the Supervisory Board. The key audit matters are not a comprehensive reflection of all matters discussed.
These matters were addressed in the context of our audit on the financial statements as a whole and in forming our opinion thereon, and we do not provide a separate opinion on these matters.
Accounting for customer incentives and reported net revenuesKey audit matter Auditing standards require us to consider a presumed fraud risk associated with the Company’s revenue recognition.
We addressed this presumed fraud risk by focusing on the estimates of recognized customer incentive allowances at year-end, which impacts net revenues recognized during the period. The accounting for customer incentives, including trade promotions and volume rebates, require management judgement to determine the timing of subsequent settlement with customers.
Our audit response and observationWe evaluated the Company’s internal controls relating to management’s process for determining their estimates of customer incentive allowances. In addition, we performed substantive testing and analytical procedures to test the accuracy and completeness of the underlying calculations of the recorded accruals as per year-end. These procedures included challenging the appropriateness of management’s assumptions, agreeing input data to underlying customer arrangements and back testing to assess the accuracy of prior period accruals retrospectively. Revenue recognition policies and the level of judgment required are adequately disclosed in the notes to the consolidated financial statements (Note 2 and 3).
Discounted cash flow projections used for annual impairment testing of goodwill and brandsKey audit matter Through acquisitions the consolidated balance sheet includes a significant amount of goodwill and brands. These assets are not amortised, but are tested for impairment at least annually. Management’s annual impairment test was significant to our audit because the assessment process is complex and a certain degree of judgment is applied. Management uses various assumptions in respect of future market and economic conditions such as revenue growth, gross margin developments, discount rates and long-term inflation.
Our audit response and observationOur audit procedures focused, amongst others, on the robustness of the projected cash flows prepared by
management. We have challenged management’s assumptions based on the approved 2017 three-year plan and consistency with historical trends in financial performance, market developments and specific business plans. We also analysed the sensitivity in the available headroom for the cash generating units (‘CGU’), evaluating whether a reasonable change in assumptions could cause the carrying amount to exceed its recoverable amount. Corporate finance experts were consulted to assist us in validating the methodologies applied by management to determine the recoverable amounts for goodwill and brands. We assessed the adequacy of the disclosure about those assumptions for the CGU Branded-Spain (Note 13) to which the outcome of the impairment test is most sensitive.
Report on the other information included in the integrated annual reportIn addition to the financial statements and our auditor’s report, the integrated annual report contains other information that consists of:
– Report of the Executive Board
– Other information as required by Part 9 Book 2 of the Dutch Civil Code
– Other information included in the integrated annual report
Based on the following procedures performed, we conclude that the other information:
– Is consistent with the financial statements and does not contain material misstatements.
– Contains the information as required by Part 9 of Book 2 of the Dutch Civil Code.
We have read the information. Based on our knowledge and understanding obtained through our audit of the financial statements or otherwise, we have considered whether the other information contains material misstatements.By performing these procedures, we comply with the requirements of Part 9 of Book 2 of the Dutch Civil Code
Independent auditor’s report

147Wessanen Integrated Annual Report 2017
Sustainability ReportAbout us Financial Review,
Risk & Governance
Report of the Supervisory Board
Our marketplaceWelcome
Wessanen Integrated Annual Report 2017
Report of the Supervisory Board
REPORT OF THE EXCECUTIVE BOARD
Financial statements
Other information
and the Dutch Standard 720. The scope of the procedures performed is substantially less than the scope those performed in our audit of the financial statements.
The Executive Board is responsible for the preparation of other information, including the Report of the Executive board in accordance with Part 9 of Book 2 of the Dutch Civil Code, and the other information as required by Part 9 of Book 2 of the Dutch Civil Code.
Report on other legal and regulatory requirementsEngagementWe were engaged by the Supervisory Board as auditor of Koninklijke Wessanen N.V. on 20 April 2017 for the audit for the year 2017 and have been the statutory auditor since the year 2010.
No prohibited non-audit servicesWe have not provided prohibited non-audit services as referred to in Article 5(1) of the EU Regulation on specific requirements regarding statutory audit of public-interest entities.
Description of responsibilities for the financial statementsResponsibilities of Executive Board and Supervisory Board for the financial statementsThe Executive Board is responsible for the preparation and fair presentation of the financial statements in accordance with IFRS-EU and Part 9 of Book 2 of the Dutch Civil Code. Furthermore, the Executive Board is responsible for such internal control as it determines is necessary to enable the preparation of financial statements that are free from material misstatement, whether due to fraud or error. As part of the preparation of the financial statements, the Executive Board is responsible for assessing the Company’s ability to continue as a going concern. Based on the financial
reporting frameworks mentioned, the Executive Board should prepare the financial statements using the going concern basis of accounting unless the Executive Board either intends to liquidate the Company or to cease operations, or has no realistic alternative but to do so.
The Executive Board should disclose events and circumstances that may cast significant doubt on the Company’s ability to continue as a going concern in the financial statements.
The Supervisory Board is responsible for overseeing the Company’s financial reporting process.
Our responsibilities for the audit of the financial statementsOur objective is to plan and perform the audit assignment in a manner that allows us to obtain sufficient and appropriate audit evidence for our opinion.
Our audit has been performed with a high, but not absolute, level of assurance, which means we may not have detected all errors and fraud during our audit. In this respect we also submit an additional report to the audit committee in accordance with Article 11 of the EU Regulation on specific requirements regarding statutory audit of public-interest entities. The information included in this additional report is consistent with our audit opinion in this auditor’s report.
Misstatements can arise from fraud or error and are considered material if, individually or in the aggregate, they could reasonably be expected to influence the economic decisions or users taken on the basis of these financial statements. The materiality affects the nature, timing and extent of our audit procedures and the evaluation of the effect of identified misstatements on our opinion.We have exercised professional judgment and have maintained professional scepticism throughout the audit, in accordance with Dutch Standards on Auditing, ethical
requirements and independence requirements. Our audit included e.g.:
– Identifying and assessing the risks of material misstatement of the financial statements, whether due to fraud or error, designing and performing audit procedures responsive to those risks, and obtaining audit evidence that is sufficient and appropriate to provide a basis for our opinion. The risk of not detecting a material misstatement resulting from fraud is higher than for one resulting from error, as fraud may involve collusion, forgery, intentional omissions, misrepresentations, or the override of internal control.
– Obtain an understanding of internal control relevant to the audit in order to design audit procedures that are appropriate in the circumstances, but not for the purpose of expressing an opinion on the effectiveness of the Company’s internal control.
– Evaluating the appropriateness of accounting policies used and the reasonableness of accounting estimates and related disclosures made by management.
– Concluding on the appropriateness of management’s use of the going concern basis of accounting, and based on the audit evidence obtained, whether a material uncertainty exists related to events or conditions that may cast significant doubt on the Company’s ability to continue as a going concern. If we conclude that a material uncertainty exists, we are required to draw attention in our auditor’s report to the related disclosures in the financial statements or, if such disclosures are inadequate, to modify our opinion. Our conclusions are based on the audit evidence obtained up to the date of our auditor’s report. However, future events or conditions may cause the Company to cease to continue as a going concern.
– Evaluating the overall presentation, structure and content of the financial statements, including the disclosures.
– Evaluating whether the financial statements represent the underlying transactions and events in a manner that achieves fair presentation.
Independent auditor’s report
148Wessanen Integrated Annual Report 2017
Sustainability ReportAbout us Financial Review,
Risk & Governance
Report of the Supervisory Board
Our marketplaceWelcome
Wessanen Integrated Annual Report 2017
Report of the Supervisory Board
REPORT OF THE EXCECUTIVE BOARD
Financial statements
Other information
Because we are ultimately responsible for the opinion, we are also responsible for directing, supervising and performing the group audit. In this respect we have determined the nature and extent of the audit procedures to be carried out for group entities. Decisive were the size and the risk profile of the group entities or operations. On this basis, we selected group entities for which an audit or analytical procedures had to be carried out on the complete set of financial information or specific items.
We communicate with the Supervisory Board regarding, among other matters, the planned scope and timing of the audit and significant audit findings, including any significant findings in internal control that we identify during our audit.
We provide the Supervisory Board with a statement that we have complied with relevant ethical requirements regarding independence, and to communicate with them all relationships and other matters that may reasonably be thought to bear on our independence, and where applicable, related safeguards.
From the matters communicated with the Supervisory Board, we determine that key audit matters: those matters that were of most significance in the audit of the financial statements. We describe these matters in our auditor’s report unless law or regulation precludes public disclosure about the matter or when, in extremely rare circumstances, not communicating the matter is in the public interest.
Amsterdam, 12 February 2018
Deloitte Accountants B.V.
R.A. Graaf
Independent auditor’s report

149Wessanen Integrated Annual Report 2017
Sustainability ReportAbout us Financial Review,
Risk & Governance
Report of the Supervisory Board
Our marketplaceWelcome
Wessanen Integrated Annual Report 2017
Report of the Supervisory Board
REPORT OF THE EXCECUTIVE BOARD
Financial statements
Other information
Independent assurance statement

150Wessanen Integrated Annual Report 2017Wessanen Integrated Annual Report 2017
SustainabilityAbout us Financial Review, Risk &
Governance
Report of the Supervisory Board
Our marketplaceWelcome
Wessanen Integrated Annual Report 2017
Report of the Supervisory Board
REPORT OF THE EXCECUTIVE BOARD
Financial statements
Other information
2017, 2016 and 2015 figures and ratios are derived from the respective 2017, 2016 and 2015 consolidated financial statements. The 2014 restated figures and ratios are derived from the 2015 consolidated financial statements, the 2013 restated figures and ratios are derived from the 2014 consolidated financial statements.
In € millions, unless stated otherwise 2017 2016 20152014
restated12013
restated
Condensed consolidated income statementContinuing operationsRevenue 625.8 570.0 523.0 430.6 407.3EBITE 53.5 41.2 34.7 23.6 19.5Operating profit 48.7 34.3 34.6 20.6 13.2Net financing costs (1.9) (1.8) (2.3) (1.6) (1.8)Profit before income tax 46.8 32.5 32.3 19.0 11.4Income tax (10.8) (9.7) (4.5) (7.6) (10.0)Profit from continuing operations 36.0 22.8 27.8 11.4 1.4Profit/(loss) from discontinued operations, net of income tax – – 9.5 33.9 (1.5)Profit/(loss) for the period, attributable to equity holders 36.0 22.8 37.3 45.3 (0.1)
Condensed consolidated statement of financial positionNon-current assets 272.2 263.9 150.5 91.4 118.0Current assets 204.8 194.8 192.6 204.3 219.7Total assets 477.0 458.7 343.1 295.7 337.7Equity 227.7 191.2 183.4 154.2 105.4Non-current liabilities 84.4 102.8 19.1 12.4 72.5Current liabilities 164.9 164.7 140.6 129.1 159.8Total equity and liabilities 477.0 458.7 343.1 295.7 337.71 2014 ‘Revenue’ and ‘Other operating expenses’ have been restated for a reclassification of €(2.9) from ‘Other operating expenses’ to ‘Revenue’ (see Note 2 of the 2015 consolidated financial statements).
Financial summary 2013–2017

151Wessanen Integrated Annual Report 2017
Sustainability ReportAbout us Financial Review,
Risk & Governance
Report of the Supervisory Board
Our marketplaceWelcome
Wessanen Integrated Annual Report 2017
Report of the Supervisory Board
REPORT OF THE EXCECUTIVE BOARD
Financial statements
Other information
In € millions, unless stated otherwise 2017 2016 20152014
restated22013
restated
Condensed consolidated statement of cash flowsOperating result 48.7 34.3 34.6 20.6 13.2Depreciation and amortisation 9.0 7.6 8.0 6.4 6.3Impairments 0.9 0.2 0.7 – 2.3Provisions created 4.1 11.0 5.1 5.2 3.5Other non-cash and non-operating items 5.0 1.2 0.5 0.7 0.7Changes in working capital 1.2 3.5 (6.2) 3.9 3.0Payments from provisions (11.8) (6.4) (3.2) (4.9) (7.3)Changes in employee benefits (0.3) (0.2) (0.3) – (1.2)Cash generated from operations 56.8 51.2 39.2 31.9 20.5Interest paid (1.2) (0.8) (0.9) (1.4) (1.7)Income tax paid (13.5) (12.4) (12.0) (6.8) (4.5)Operating cash flow from continuing operations 42.1 38.0 26.3 23.7 14.3Operating cash flow from discontinued operations – – (3.4) 8.5 4.6Net cash from operating activities 42.1 38.0 22.9 32.2 18.9Net cash from investing activities (11.6) (121.0) (9.3) 48.9 (9.7)Net cash from financing activities (26.2) 60.7 (18.3) (68.7) (3.4)
Net cash flow 4.3 (22.3) (4.7) 12.4 5.8
RatiosEBITE as % of revenue1 8.5% 7.2% 6.6% 5.5% 4.8%Operating profit as % of revenue1 7.8% 6.0% 6.6% 4.8% 3.2%Net profit as % of revenue 5.8% 4.0% 7.1% 10.5% 0.0%Return on average capital employed (ROCE)1 15.8% 15.7% 19.7% 17.0% 10.3%Net debt as % of total equity 26.3% 43.7% (9.5)% (17.7)% 48.1%Leverage ratio 1.0 1.5 (0.4) (0.7) 1.6Capital expenditure as % of revenue1 2.0% 1.3% 1.5% 1.1% 1.0%
1 Continuing operations only.
2 2014 ‘Revenue’ and ‘Other operating expenses’ have been restated for a reclassification of €(2.9) from ‘Other operating expenses’ to ‘Revenue’ (see Note 2 of the 2015 consolidated financial statements).
Financial summary 2013–2017
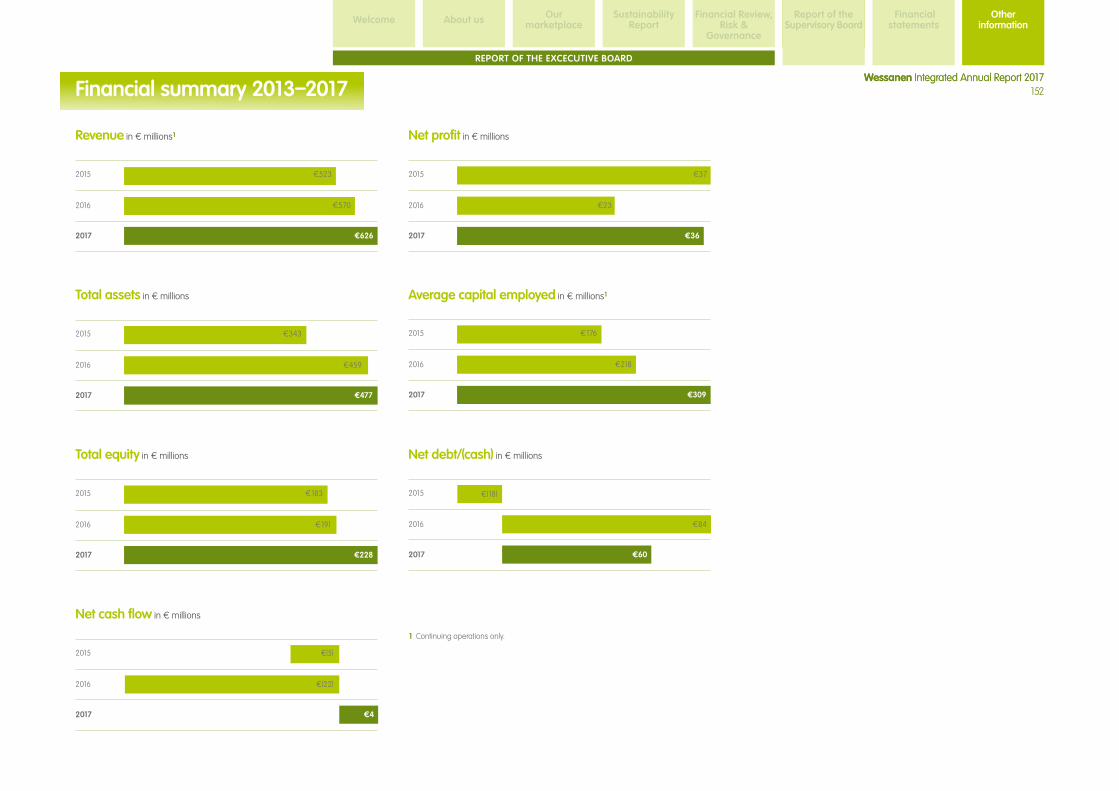
152Wessanen Integrated Annual Report 2017
Sustainability ReportAbout us Financial Review,
Risk & Governance
Report of the Supervisory Board
Our marketplaceWelcome
Wessanen Integrated Annual Report 2017
Report of the Supervisory Board
REPORT OF THE EXCECUTIVE BOARD
Financial statements
Other information
Revenue in € millions1
2016 €570
2015 €523
2017 €626
Total assets in € millions
2016 €459
2015 €343
2017 €477
Total equity in € millions
2016 €191
2015 €183
2017 €228
Net cash flow in € millions
2016 €(22)
2015 €(5)
2017 €4
Net profit in € millions
2016 €23
2015 €37
2017 €36
Average capital employed in € millions1
2016 €218
2015 €176
2017 €309
Net debt/(cash) in € millions
2016 €84
2015
2017 €60
€(18)
1 Continuing operations only.
Financial summary 2013–2017

153Wessanen Integrated Annual Report 2017Wessanen Integrated Annual Report 2017
SustainabilityAbout us Financial Review, Risk &
Governance
Report of the Supervisory Board
Our marketplaceWelcome
Wessanen Integrated Annual Report 2017
Report of the Supervisory Board
REPORT OF THE EXCECUTIVE BOARD
1. Euronext
2. Cboe CXE
3. Turquoise
4. Cboe BXE
5. Equiduct
6. Other
Source: Fidessa Group PLC
72
12
9
4
2
1
1
2
3
4 5
6
Financial statements
Other information
At Wessanen, we are engaged in active dialogue with our shareholders and other stakeholders. Our actions are focused on ensuring clear, timely and simultaneous provision of information to all shareholders.
Investment propositionWessanen is a leading company in the European market for healthy and sustainable food. Our focus is on organic, vegetarian, fair trade and natural ingredients as these are healthier and more sustainable.
Operating mainly in the Benelux, France, Germany, Italy, UK and Spain, we manage and develop well-known local brands such as Allos, Alter Eco, Bjorg, Bonneterre, Clipper, Destination, el Granero, Gayelord Hauser, Isola Bio, Kallø, Mrs Crimble’s, Tartex, Whole Earth and Zonnatura.
DisclosureAll results announcements and press releases are published, in principle, before market opening of Euronext Amsterdam. All results announcements are accompanied by a conference call and/or meeting for the professional investment community. A simultaneous audio webcast will be freely accessible for all of those interested via our corporate website. All presentations made to groups of investors are published at the same time on our website.
Our Disclosure Policy is available on our website.
Prevention of misuse of insider informationWessanen considers the prevention of misuse of insider information essential in the relationship with all stakeholders. The Company has in place an Insider Trading Policy applicable to management. The Company Code prohibits insider trading.
Investor relationsAt Wessanen, we are engaged in an active dialogue with our (potential) shareholders. During the year both members of the Executive Board had regular contact with investors and analysts. The Company attended broker conferences and hosted roadshows during the year to meet institutional investors in Europe and the United States. In 2018, the Company will continue to attend investor conferences and host roadshows as an integral part of its investor relations policy.
Capital structure and distribution of sharesThe capital structure consists of one class of stocks, i.e. voting shares with a nominal value of €1.00 per share. All shares outstanding have equal rights and can be traded freely without any restriction. Since these are mainly in bearer form, our analysis of the ownership of Wessanen shares by type of investor and by country of origin is based on data provided by depository banks per February 2018.
Major shareholdersIn accordance with the Act on the Disclosure of Influence over Listed Companies (1991) the Company believes it had the following major shareholders as at 31 December 2017:
Delta Partners, LLC 15-20%Mr C. Jobson 5-10%Invesco Limited 3-5%Groupama 3-5%
Coverage by brokers and banksDuring 2017, eight brokers covered Wessanen, all based in the Benelux, except one. Research has been published from time to time, although it has been mainly around the publication of quarterly reporting or a news event. In addition, Wessanen has been included in sector and country reports or when addressing specific themes, such as raw material/input cost movements.
Development of the share price in €
Year High Low Year end
Average daily
volume traded
2017 17.27 12.28 17.18 192,9842016 13.37 6.97 13.31 192,0442015 10.21 5.04 9.35 204,9002014 5.54 2.84 5.25 220,7002013 3.19 2.07 2.84 163,300
Market capitalisation in € millions
Year High Low Year end
Net debt/(cash)
year end
Enterprise value
year end
2017 1,314 928 1,307 60 1,3672016 1,010 526 1,005 84 1,0892015 771 380 706 (18) 6882014 421 216 399 (27) 3722013 242 157 216 51 267
Volume traded per exchange 2017 in %
Shareholder information
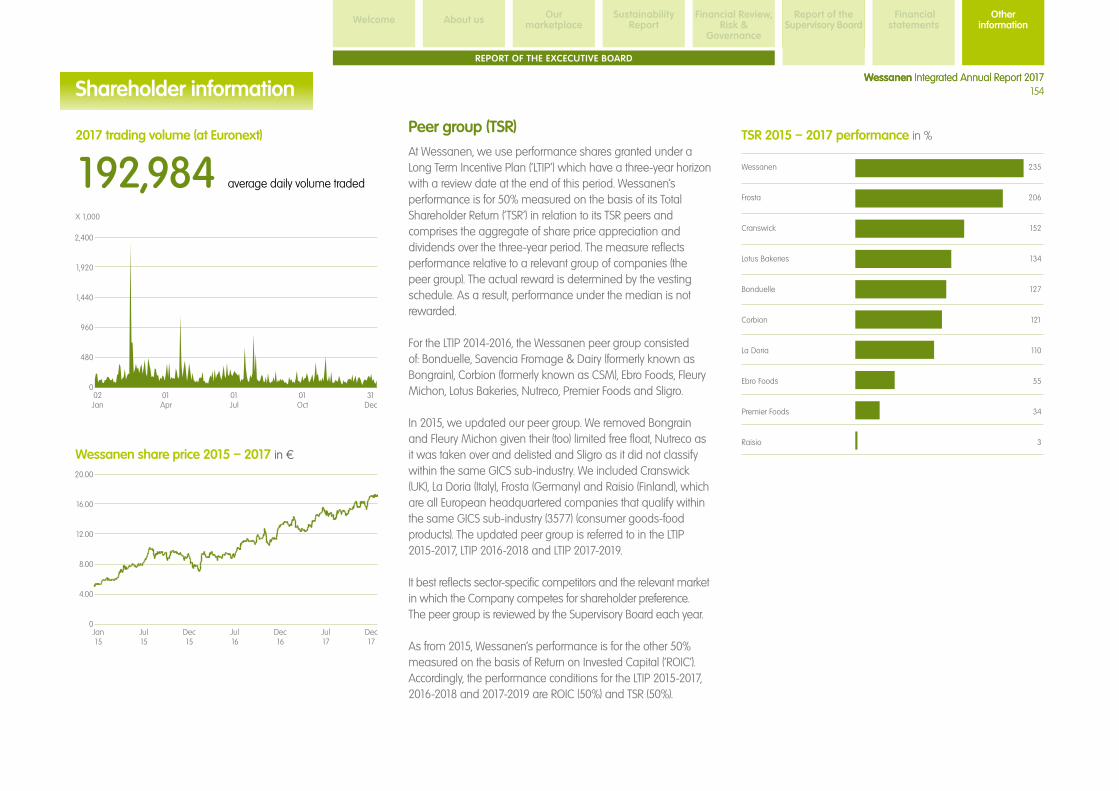
154Wessanen Integrated Annual Report 2017
Sustainability ReportAbout us Financial Review,
Risk & Governance
Report of the Supervisory Board
Our marketplaceWelcome
Wessanen Integrated Annual Report 2017
Report of the Supervisory Board
REPORT OF THE EXCECUTIVE BOARD
Jan15
Dec17
Dec16
Dec15
Jul15
Jul16
Jul17
20.00
16.00
12.00
8.00
4.00
0
Wessanen
Frosta
Cranswick
Lotus Bakeries
Bonduelle
Corbion
La Doria
Ebro Foods
Premier Foods
Raisio
235
206
152
134
127
121
110
55
34
3
Financial statements
Other information
2017 trading volume (at Euronext)
192,984 average daily volume traded
X 1,000
02Jan
31Dec
01Oct
01Jul
01Apr
2,400
1,920
1,440
960
480
0
Wessanen share price 2015 – 2017 in €
Peer group (TSR)At Wessanen, we use performance shares granted under a Long Term Incentive Plan (‘LTIP’) which have a three-year horizon with a review date at the end of this period. Wessanen’s performance is for 50% measured on the basis of its Total Shareholder Return (‘TSR’) in relation to its TSR peers and comprises the aggregate of share price appreciation and dividends over the three-year period. The measure reflects performance relative to a relevant group of companies (the peer group). The actual reward is determined by the vesting schedule. As a result, performance under the median is not rewarded.
For the LTIP 2014-2016, the Wessanen peer group consisted of: Bonduelle, Savencia Fromage & Dairy (formerly known as Bongrain), Corbion (formerly known as CSM), Ebro Foods, Fleury Michon, Lotus Bakeries, Nutreco, Premier Foods and Sligro.
In 2015, we updated our peer group. We removed Bongrain and Fleury Michon given their (too) limited free float, Nutreco as it was taken over and delisted and Sligro as it did not classify within the same GICS sub-industry. We included Cranswick (UK), La Doria (Italy), Frosta (Germany) and Raisio (Finland), which are all European headquartered companies that qualify within the same GICS sub-industry (3577) (consumer goods-food products). The updated peer group is referred to in the LTIP 2015-2017, LTIP 2016-2018 and LTIP 2017-2019.
It best reflects sector-specific competitors and the relevant market in which the Company competes for shareholder preference. The peer group is reviewed by the Supervisory Board each year.
As from 2015, Wessanen’s performance is for the other 50% measured on the basis of Return on Invested Capital (‘ROIC’). Accordingly, the performance conditions for the LTIP 2015-2017, 2016-2018 and 2017-2019 are ROIC (50%) and TSR (50%).
TSR 2015 – 2017 performance in %
Shareholder information

155Wessanen Integrated Annual Report 2017
Sustainability ReportAbout us Financial Review,
Risk & Governance
Report of the Supervisory Board
Our marketplaceWelcome
Wessanen Integrated Annual Report 2017
Report of the Supervisory Board
REPORT OF THE EXCECUTIVE BOARD
Financial statements
Other information
Key figures (as reported in respective years)In € millions 2017 2016 2015
Revenue 625.8 570.0 523.0EBITE 53.5 41.2 34.7Operating profit 48.7 34.3 34.6Profit for the period 36.0 22.8 37.3Cash generated from operations 56.8 51.2 39.2Average capital employed 309.0 218.4 175.8Total equity 227.7 191.2 183.4Net debt/(cash) 59.9 83.5 (17.5)
Key ratios (as reported in respective years)2017 2016 2015
Leverage ratio 1.0 1.5 (0.4)Return on average capital employed 15.8% 15.7% 19.7%1
Dividend yield 0.8% 0.9% 1.2%Enterprise value to revenue 2.18 1.91 1.32
1 Continuing operations only.
Per share data (as reported in respective years) In € 2017 2016 2015
Revenue 8.23 7.55 6.93EBITE 0.70 0.55 0.46Operating result 0.64 0.45 0.46
Net profit 0.47 0.30 0.49Dividend 0.13 0.12 0.11Total equity 2.99 2.53 2.43
Net debt/(cash) 0.79 1.11 (0.23)
Cash flow per share (as reported in respective years)In € 2017 2016 2015
Cash generated from operations 0.75 0.68 0.52Net cash from operating activities 0.55 0.50 0.30Net cash from investing activities (0.15) (1.60) (0.12)Net cash from financing activities (0.34) 0.80 (0.24)Net cash flow 0.06 (0.30) (0.06)
Dividend policyThe dividend policy of the Company aims at creating value in the long term. The objective of the dividend policy is to maintain a healthy financial structure and to retain sufficient earnings in order to execute Wessanen’s four pillar strategy. Wessanen aims at paying out a dividend that is stable or growing over time. Before deciding to pay out dividend, Wessanen will assess whether more value could be created by (i) investing profit in the execution of Wessanen’s strategy (such as investments in R&D, capital expenditures or acquisitions), (ii) improving Wessanen’s financial position (debt repayment), or (iii) improving the position of its shareholders (share repurchasing). Accordingly, it may be decided not to pay dividend or to pay a lower dividend in any year in the future. No interim dividends will be paid.
The proposed dividend for a financial year must be approved by the AGM, which is usually held in April of the following financial year. Dividend proposals shall be made by the Executive Board with approval from the Supervisory Board and should be in line with the dividend policy.
Dividend payments are only allowed to the extent that the shareholders’ equity is in excess of the sum of the paid-up capital and any reserves required under Dutch law.
2017 dividend proposalIn line with the dividend policy, it is proposed to the Annual General Meeting of Shareholders to pay a dividend of 13 eurocent per share. The dividend will be paid wholly in cash.
Dividend timetable201815 March Record date12 April Annual General Meeting of Shareholders16 April Ex-dividend date17 April Dividend record date19 April Payment date
Key dates201812 April Annual General Meeting of Shareholders20 April Q1 trading update20 July Q2 and semi-annual report19 October Q3 trading update
For analysts, investors (institutional and private), SRI specialists and mediaRonald Merckx Chief Financial OfficerPhone: +31 20 3122 126email: [email protected]
Shareholder information

156Wessanen Integrated Annual Report 2017Wessanen Integrated Annual Report 2017
SustainabilityAbout us Financial Review, Risk &
Governance
Report of the Supervisory Board
Our marketplaceWelcome
Wessanen Integrated Annual Report 2017
Report of the Supervisory Board
REPORT OF THE EXCECUTIVE BOARD
Financial statements
Other information
Acronyms
BRC – British Retail ConsortiumCSR – Corporate Social ResponsibilityGFSI – The Global Food Safety Initiative ILO – International Labour OfficeIFOAM – International Federation of Organic Agriculture MovementsIFS – International Food StandardISO – International Organisation for StandardisationKPI – Key Performance IndicatorNGO – Non-Governmental OrganisationPTO – Purchased turnoverR&D – Research and DevelopmentPQB – Product Quality BookletSQD – Supplier Quality DeclarationWHO – World Health Organisation
Definitions
B Corp – B Corp is to business what Fair Trade certification is to coffee or USDA Organic certification is to milk. B Corps are for-profit companies certified by the nonprofit B Lab to meet rigorous standards of social and environmental performance, accountability, and transparency.
Biodiversity – Biodiversity (contraction of biological diversity) is the variety of life on Earth. It refers to the wide variety of ecosystems and living organisms: species of plants, animals and micro-organisms.
Climate change – A change in global or regional climate patterns, in particular a change apparent from the mid to late 20th century onwards and attributed largely to the increased levels of atmospheric carbon dioxide produced by the use of fossil fuels.
Fair Trade – Fair Trade products are certified by a third party to standards for the development of disadvantaged producers and workers. These standards are set by the international body Fair Trade Labelling Organisations International (www.fairtrade.net).
Flexitarian – Flexitarian refers to a plant-based diet with the occasional inclusion of fish, meat or poultry products.
Full-time equivalents (FTEs) – FTEs is the total number of hours worked by the headcount divided by the local number of contract hours.
Genetically Modified Organisms (GMO or GM) – GMO are organisms with manipulated genes to introduce new, or alter existing, characteristics, or produce a new protein or enzyme.
Global Reporting Initiative (GRI) – The GRI is a multi-stakeholder process and independent institution whose mission is to develop and disseminate globally-applicable sustainability reporting guidelines for voluntary use by organisations that report on the economic, environmental and social dimensions of their business. The GRI incorporates participation of business, accountancy, investment, environmental, human rights and research and labour organisations from around the world.
Natural products – Natural products do not contain artificial additives (e.g. preservatives and artificial colouring) and natural products have been processed as little as possible. Under this definition, there is a degree of overlap between organic and natural products.
Organic products – Organic products are grown without synthetic pesticides, insecticides, herbicides, fungicides, hormones, fertilisers or other synthetic or toxic substances. Also, no artificial additives have been added. (Regulation EU 834/2007; EU889/2008 and EU 1235/2008).
The Roundtable on Sustainable Palm Oil (RSPO) – The RSPO is a global, multi-stakeholder initiative on sustainable palm oil products. Members of RSPO and participants in its activities come from many different backgrounds, including plantation companies, manufacturers and retailers of palm oil products, environmental and social NGOs and from many countries that produce or use palm oil products.
Scrapping – discarded or remove from service wasted material, especially metal suitable for reprocessing. Scrapping can bring monetary value.
Vegan – Veganism is a way of living which excludes all animal products, including eggs, dairy, beeswax and honey.
Vegetarian – Vegetarian refers to products without meat or meat by-products (such as meatstock and gelatine). Products may contain animal products such as eggs and dairy.
Waste – Waste is unwanted or unusable material, substances or by-product. Waste occur at different levels in our supply chain from the farm to the consumer home. In a circular economy, waste is considered as a future resource, so nothing will be lost and everything is to be transformed.
Glossary (acronyms and definitions)

157Wessanen Integrated Annual Report 2017
•••Wessanen Integrated Annual Report 2017
SustainabilityAbout us Financial Review, Risk &
Governance
Report of the Supervisory Board
Our marketplaceWelcome
Wessanen Integrated Annual Report 2017
Report of the Supervisory Board
Financial statements
Other information
REPORT OF THE EXCECUTIVE BOARD
www.wessanen.comFor more information visit us on
Join us on Facebook and on Twitter @facebook/wessanen @wessanen_250
Cautionary statement regarding forward-looking statementsThis Integrated Annual Report may contain forward-looking statements. These are defined as statements not being historical facts. Forward-looking statements include (but are not limited to) statements expressing or implying Wessanen’s beliefs, expectations, intentions, forecasts, estimates or predictions (and the underlying assumptions). Forward-looking statements necessarily involve uncertainties and risks. The actual results or situations may therefore differ materially from those expressed or implied in any forward-looking statements. Those differences may be caused by various factors, including but not limited to, macro-economic developments, regulator and legal changes, market developments, competitive behaviour, currency developments, the ability to retain key employees, and unexpected changes in the operational environment. Additional factors that could cause actual results or situations to differ materially include, but are not limited to, those disclosed under ‘risk factors’. Any forward-looking statements in this Integrated Annual Report are based on information available to the management on 12 February 2018. Wessanen assumes no obligations to publicly update or revise any forward-looking statements in this Integrated Annual Report whether as a result of new information, future events or otherwise, other than as required by law or regulation.
Concept, realisation and printingC&F Report
Photography C&F Report
100% ecological ink

Hoogoorddreef 5Atlas Arena - Asia Building
1101 BA Amsterdam ZuidoostThe Netherlands
www.wessanen.com