connected teaching of statistics
DESCRIPTION
CONNECTED TEACHING OF STATISTICS. Institute for Statistics and Econometrics Economics Department Humboldt University of Berlin Spandauer Straße 1 10178 Berlin Germany. COMPUTER-ASSISTED STATISTICS TEACHING TOOL: MOTIVATION. - PowerPoint PPT PresentationTRANSCRIPT

Institute for Statistics and Econometrics
Economics Department
Humboldt University of Berlin
Spandauer Straße 1
10178 Berlin
Germany
CONNECTED TEACHING OF STATISTICS
COMPUTER-ASSISTED STATISTICS TEACHING TOOL:
MOTIVATION
• For students, Learning basic concepts of statistics through trial and error
• For the teacher, allowing the students to work at their own pace
• Bringing current technology into classroom instruction• Interactive learning

• Accessible from any java-equipped web server
JAVA INTERFACE
VISUALIZING DATA
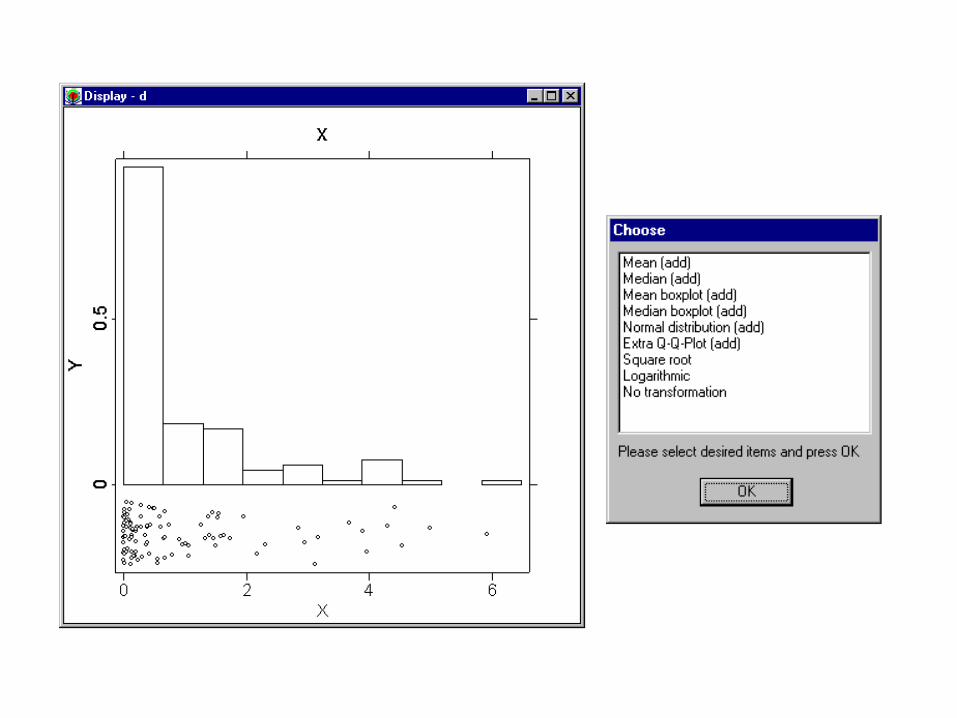
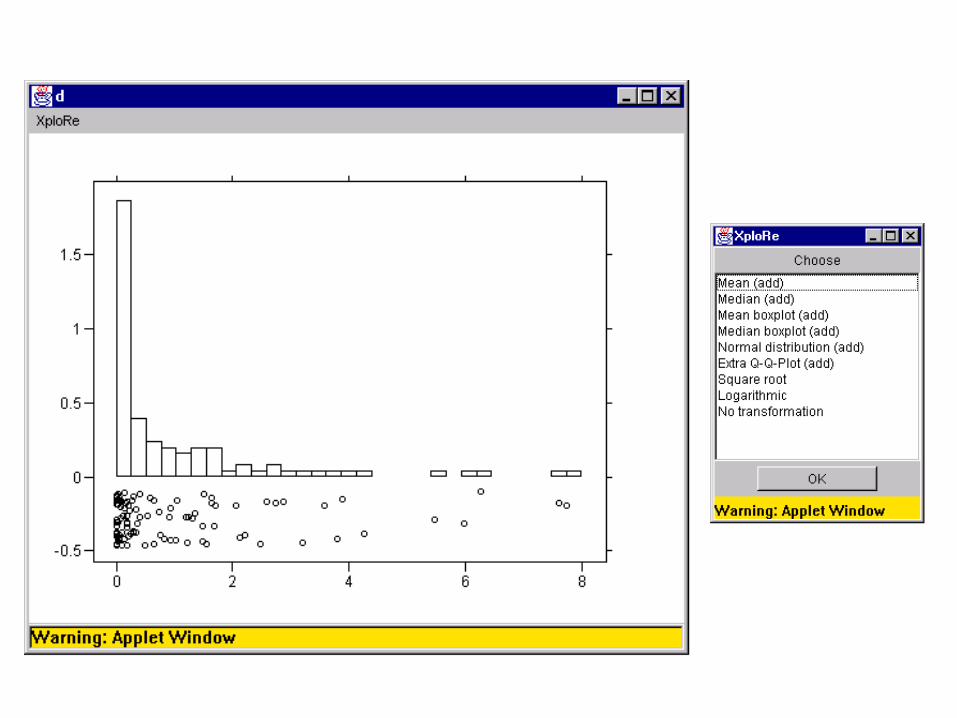
• Illustrates a variety of visual display techniques for one-dimensional data
• Student is presented a histogram and scatterplot of the data, can choose a variety of additional representations/transformations of the data
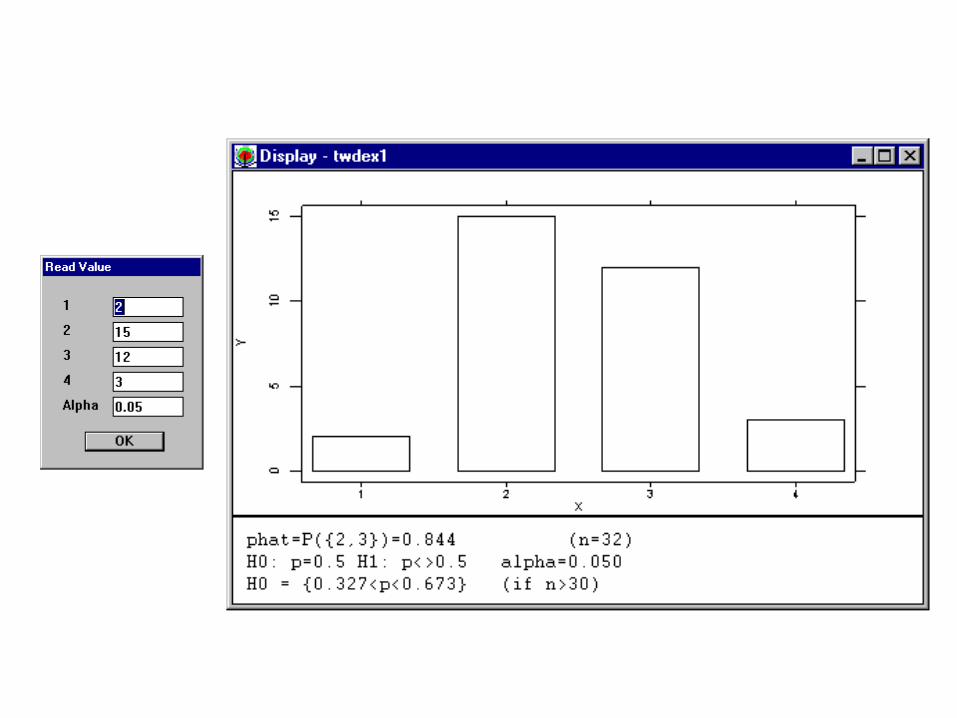
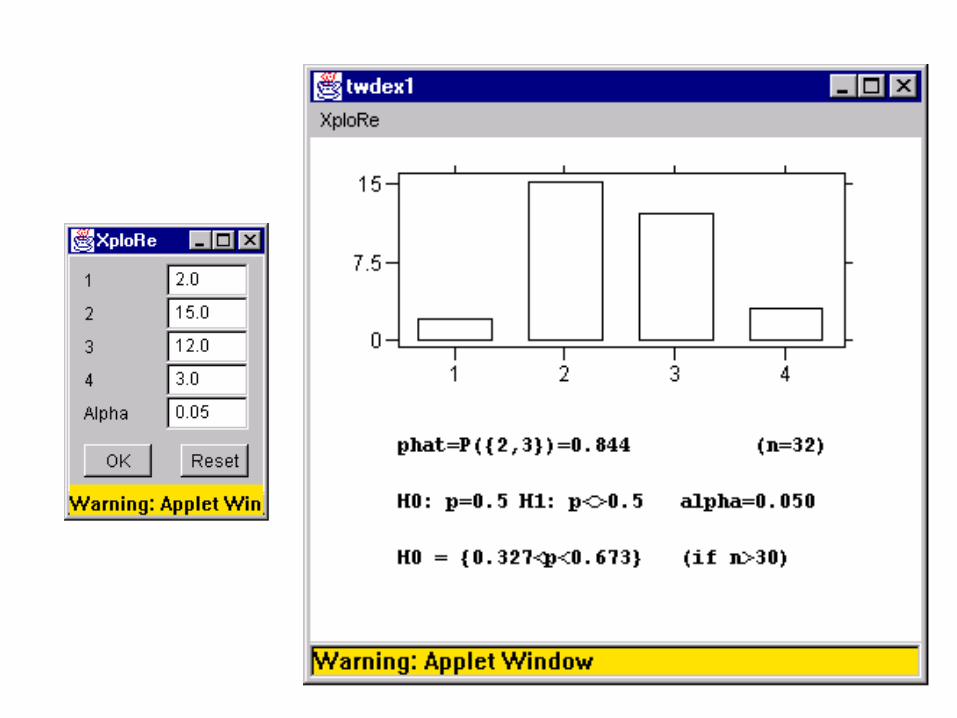
RANDOM SAMPLING
• Illustrates that “arbitrary human choice” is different from proper random sampling
• Student designates his/her own distribution, then sees a histogram of it, along with a hypothesis test that the data is (uniformly) randomly distributed
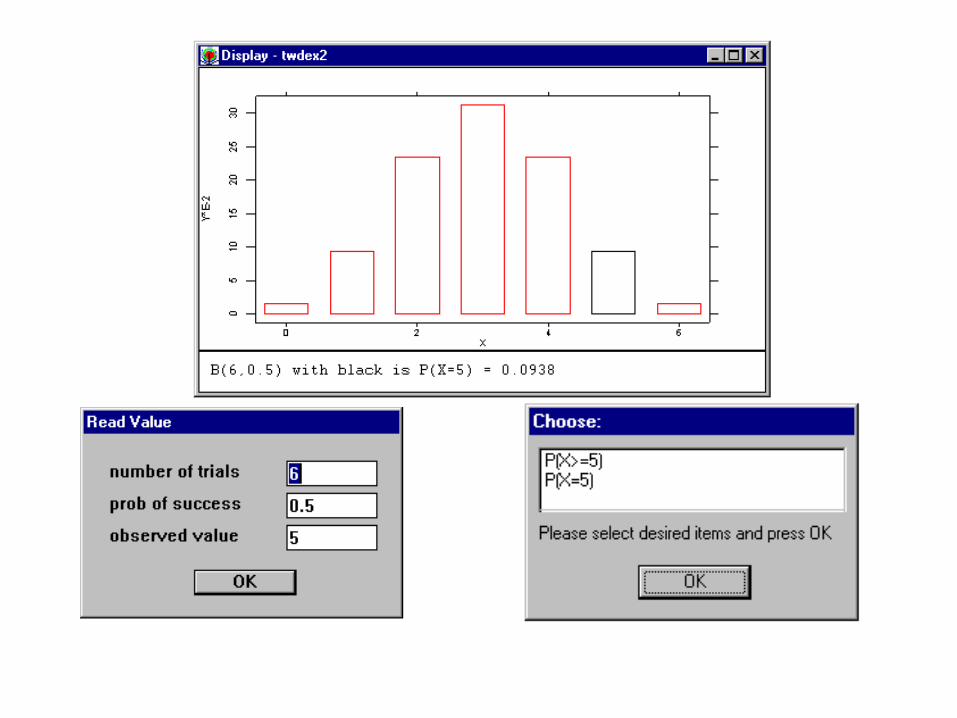
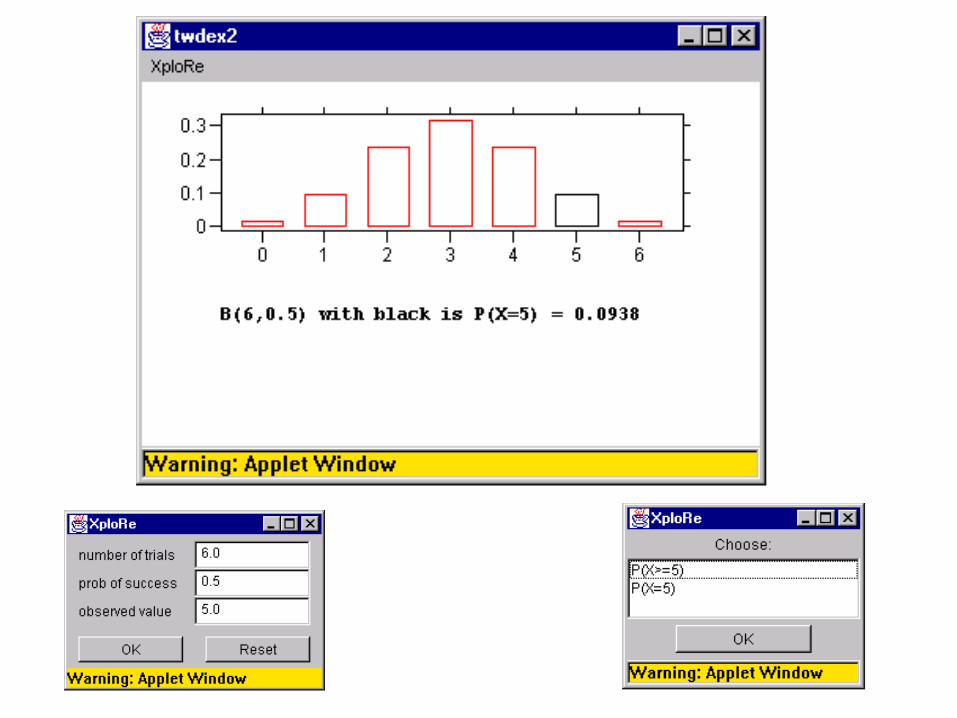
THE p-VALUE IN HYPOTHESIS TESTING
• Illustrates the concept of the p-value• For a sample from the binomial probability
distribution, testing H0: p = p0 vs. H1: p > p0
• Why do we use P(X x) rather than P(X = x)?
• Student can experiment with the data to see the advantages of using P(X x) over P(X = x)
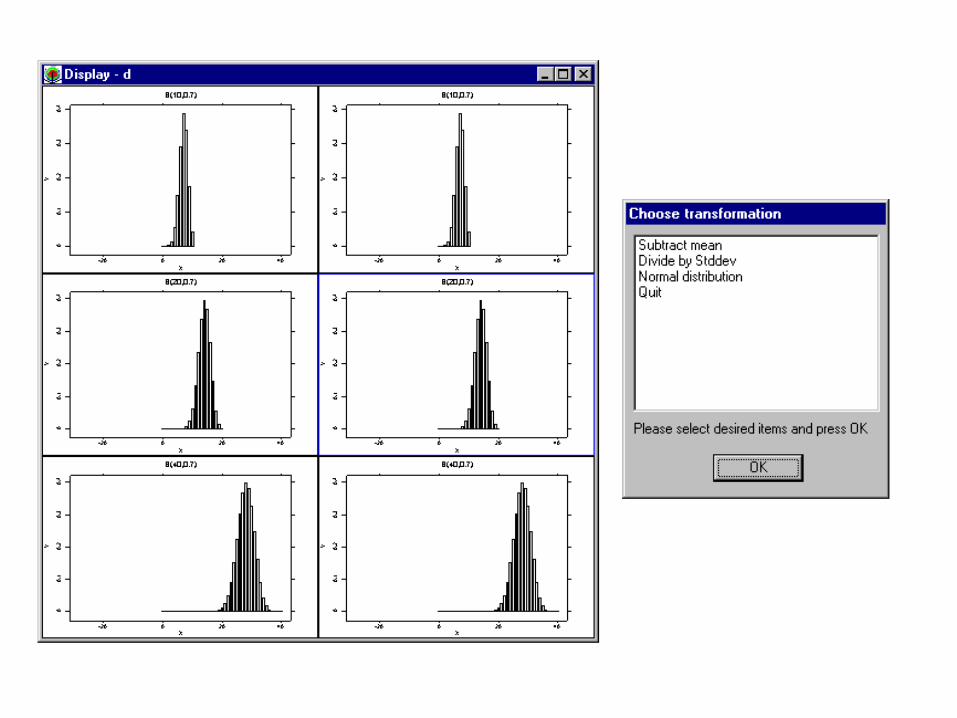
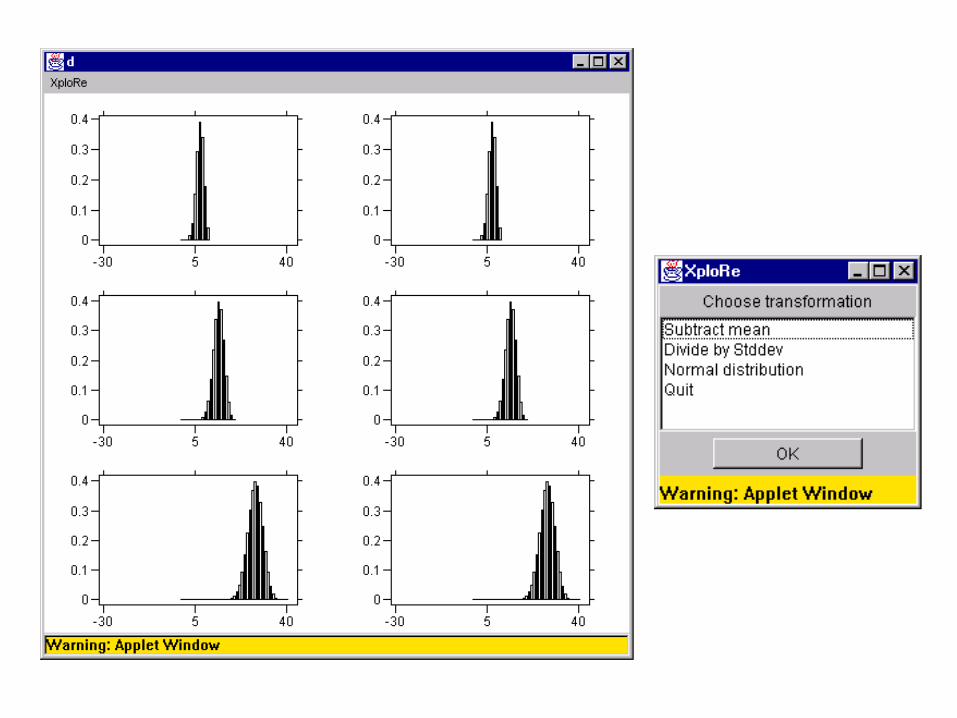
• Illustrates that the normal distribution provides a good approximation to the binomial distribution for large n
• Student can experiment to see that under the right transformations, the binomial distribution is more and more similar to the standard normal distribution as n approaches infinity
APPROXIMATING THE BINOMIAL BY THE NORMAL DISTRIBUTION
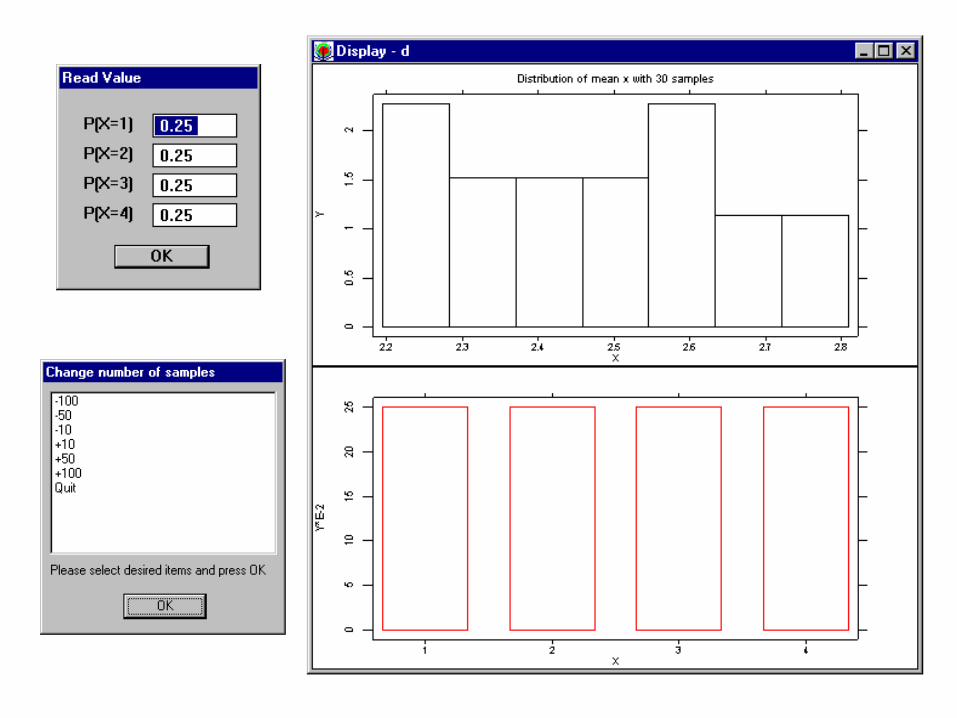
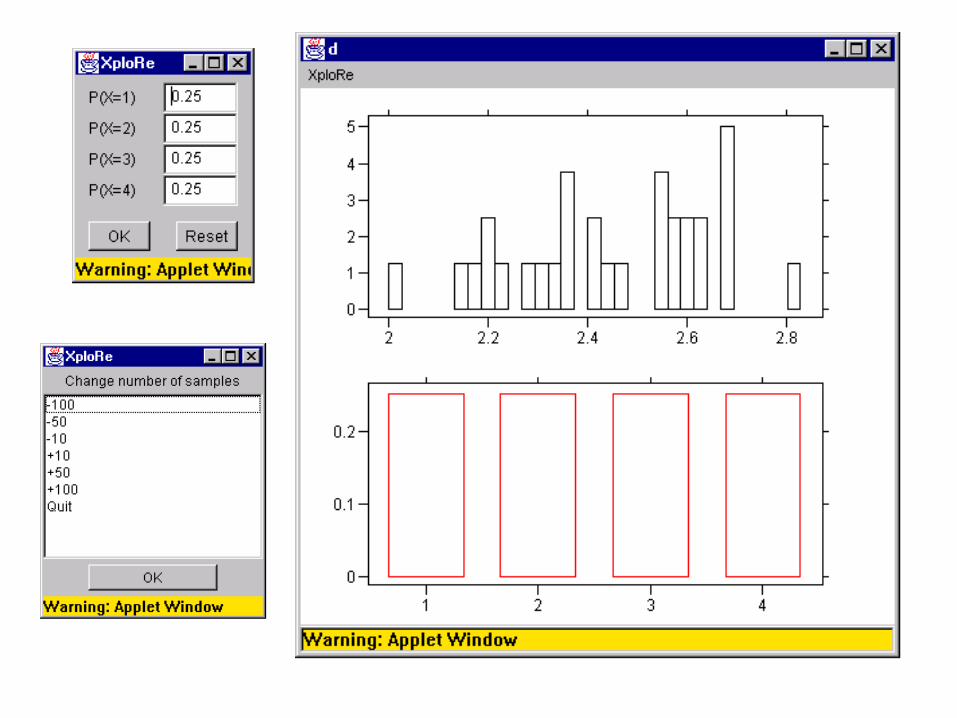
THE CENTRAL LIMIT THEOREM
• Illustrates the Central Limit Theorem
• The student defines a distribution, then sees a histogram of the means from a simulation of 30 samples
• Can then increase or decrease the number of samples to see that the histogram approximates the normal distribution for a large number of samples
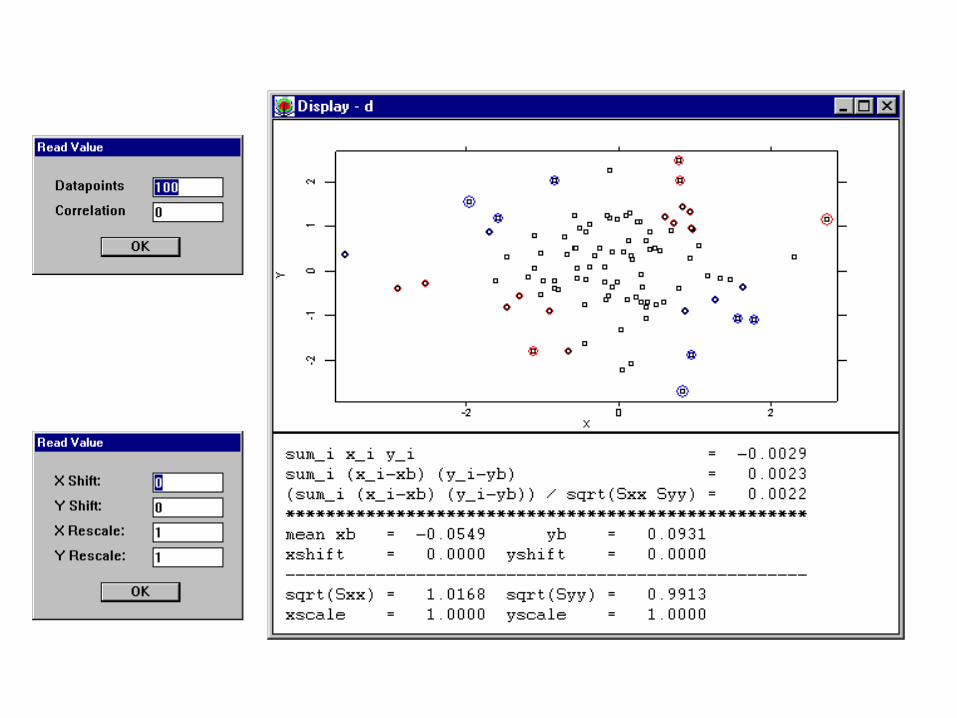
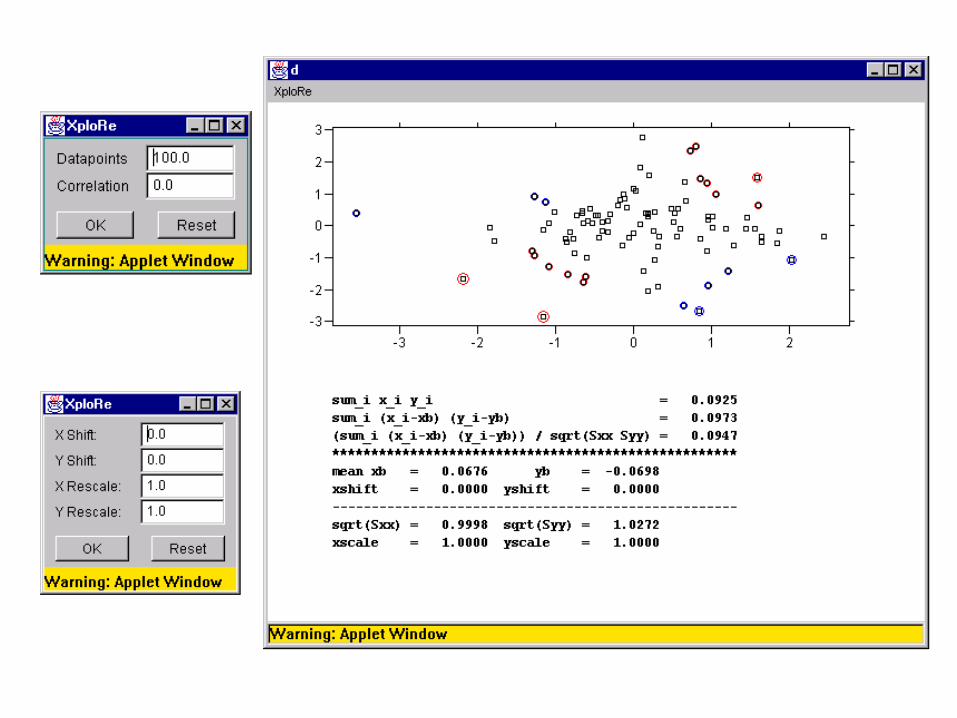
THE PEARSON CORRELATION COEFFICIENT
• Illustrates how dependence is reflected in the formulas for the estimated Pearson correlation coefficient , and why it’s necessary to normalize the data
• Student sets some specifications, then sees a scatterplot of simulated data
• Presented with three formulas for estimating the correlation coefficient
• Transforms the data, sees the effects these have on the three formulas -- why one formula is better than the others
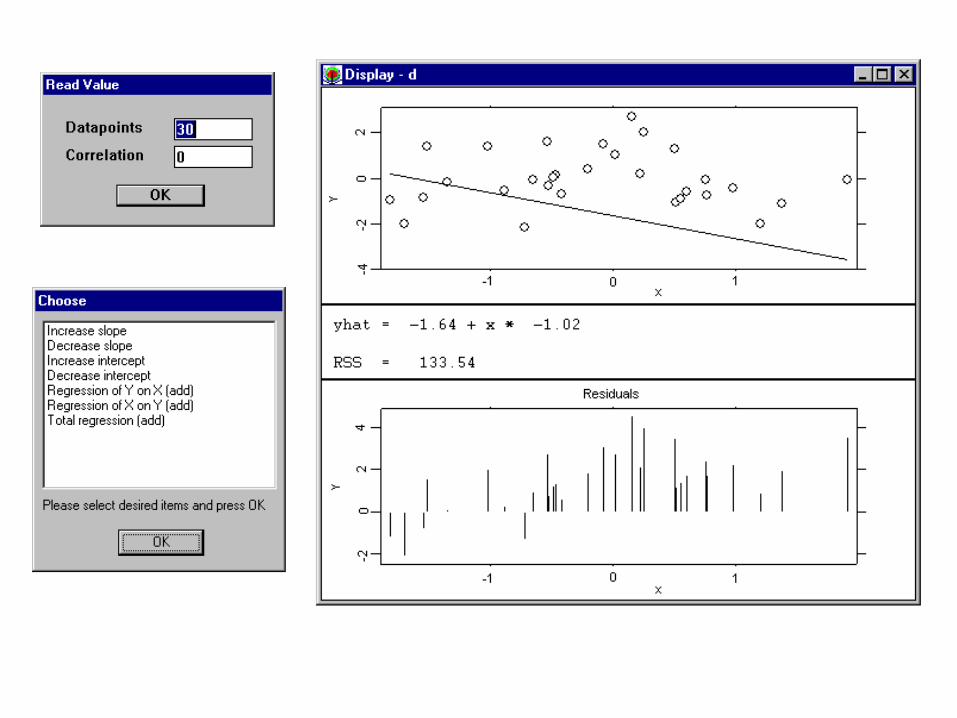
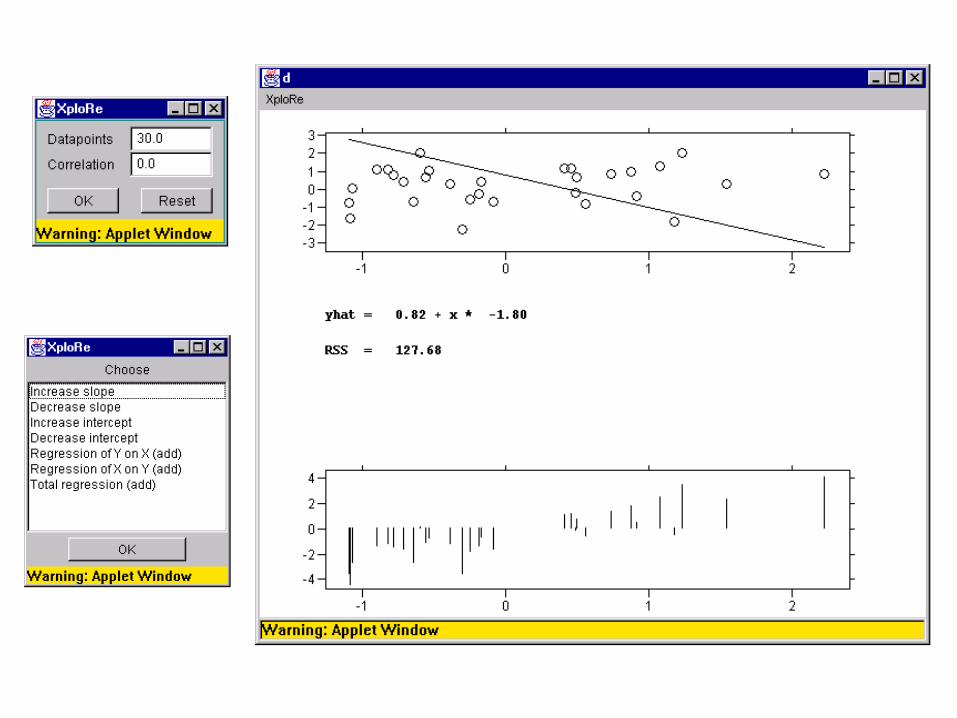
LINEAR REGRESSION
• Illustrates the concept of linear regression
• Student sees a scatterplot and a line on one graph, and a graph of the residuals on another
• Tries to minimize the residual sum of squares by modifying the parameters of the line