confidential corporate development update finance off-site june 10, 2011
TRANSCRIPT
CONFIDENTIAL
Corporate Development Update
Finance Off-site
June 10, 2011
Discussion Topics
• Corporate Development
– M&A Strategy
– Recent Activity
– Current Activity
• Margin Analysis
page 2
CONFIDENTIAL
Why sell anything?
Corporate Development
Why sell anything?
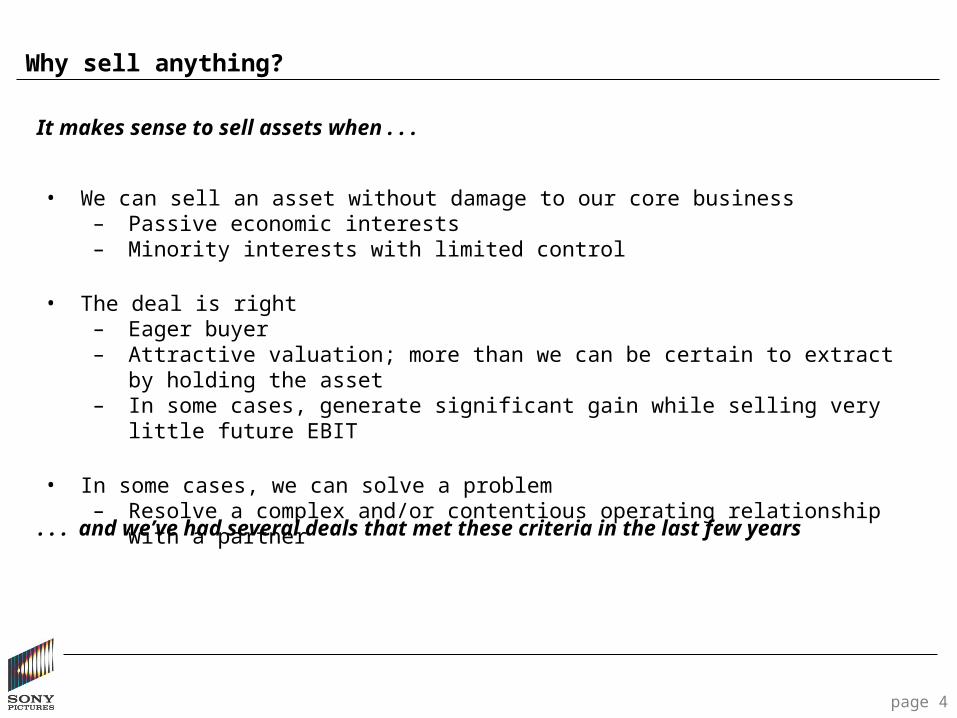
It makes sense to sell assets when . . .
page 4
• We can sell an asset without damage to our core business– Passive economic interests– Minority interests with limited control
• The deal is right– Eager buyer– Attractive valuation; more than we can be certain to extract by holding the asset– In some cases, generate significant gain while selling very little future EBIT
• In some cases, we can solve a problem– Resolve a complex and/or contentious operating relationship with a partner
. . . and we’ve had several deals that met these criteria in the last few years
CONFIDENTIAL
Added pressures – the bad news
Corporate Development
Challenging market trends
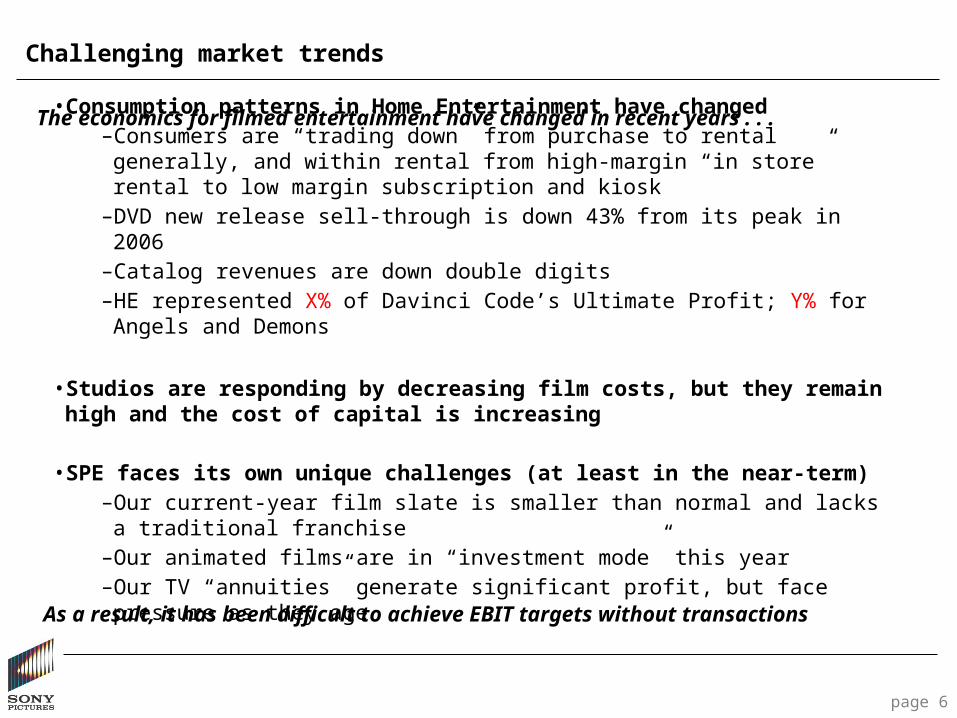
• Consumption patterns in Home Entertainment have changed–Consumers are “trading down” from purchase to rental generally, and within rental
from high-margin “in store” rental to low margin subscription and kiosk–DVD new release sell-through is down 43% from its peak in 2006–Catalog revenues are down double digits–HE represented X% of Davinci Code’s Ultimate Profit; Y% for Angels and Demons
• Studios are responding by decreasing film costs, but they remain high and the cost of capital is increasing
• SPE faces its own unique challenges (at least in the near-term)–Our current-year film slate is smaller than normal and lacks a traditional franchise–Our animated films are in “investment mode” this year–Our TV “annuities” generate significant profit, but face pressure as they age
page 6
The economics for filmed entertainment have changed in recent years . . .
As a result, it has been difficult to achieve EBIT targets without transactions
CONFIDENTIAL
Growth drivers – the good news
Corporate Development
Growth Drivers
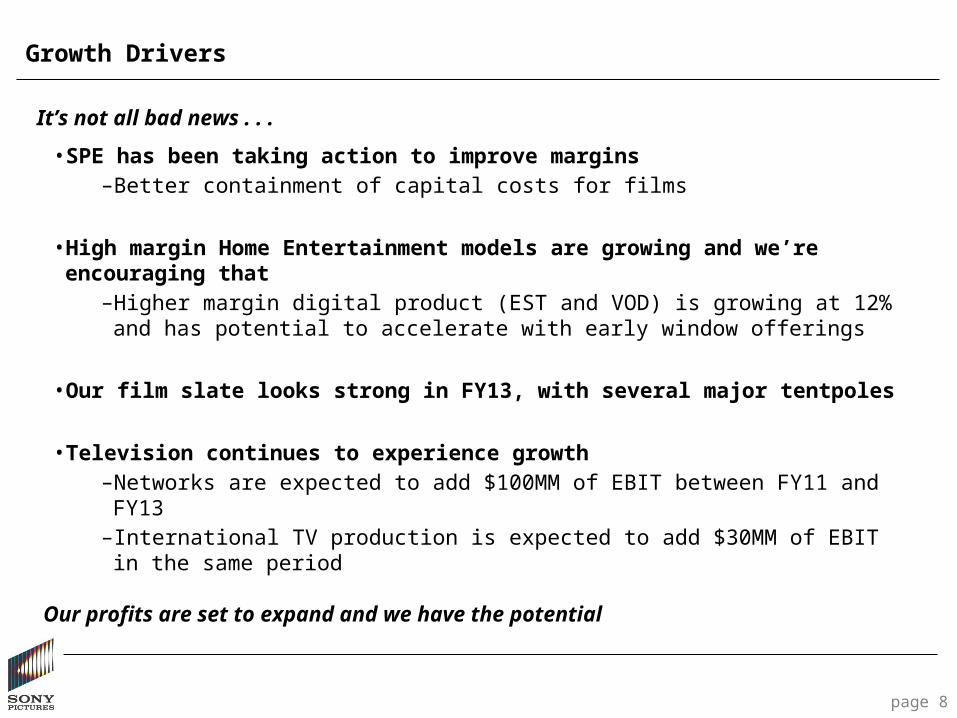
• SPE has been taking action to improve margins–Better containment of capital costs for films
• High margin Home Entertainment models are growing and we’re encouraging that–Higher margin digital product (EST and VOD) is growing at 12% and has potential to
accelerate with early window offerings
• Our film slate looks strong in FY13, with several major tentpoles
• Television continues to experience growth–Networks are expected to add $100MM of EBIT between FY11 and FY13–International TV production is expected to add $30MM of EBIT in the same period
page 8
It’s not all bad news . . .
Our profits are set to expand and we have the potential
CONFIDENTIAL
The net effect – “so what’s it all mean?”
Corporate Development
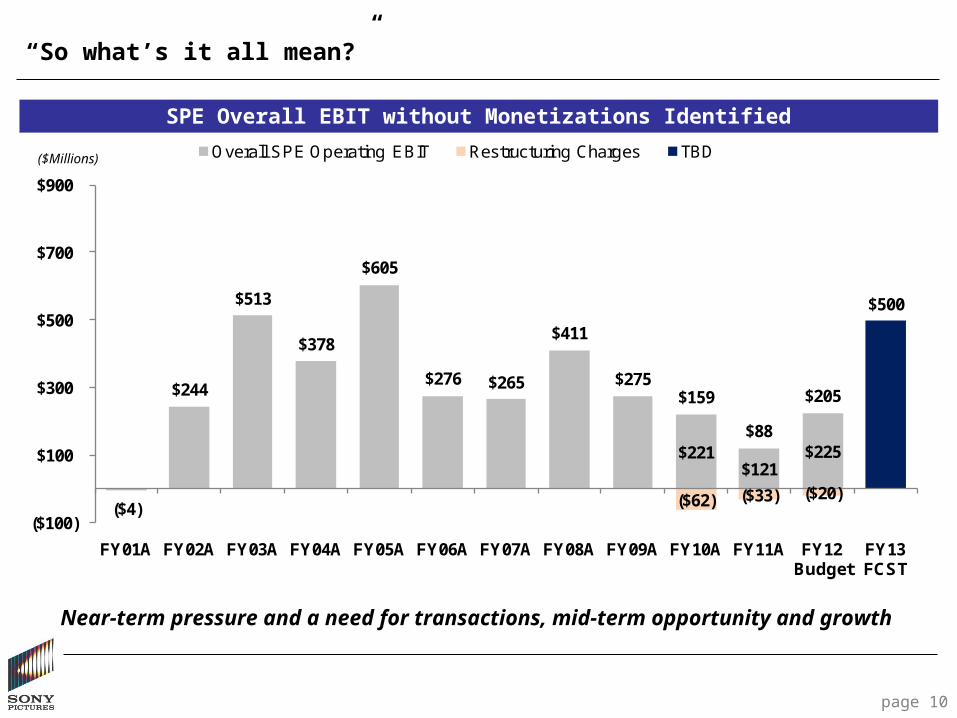
$221 $121
$225
($62) ($33) ($20)
$500
($4)
$244
$513
$378
$605
$276 $265
$411
$275 $159
$88
$205
($100)
$100
$300
$500
$700
$900
FY01A FY02A FY03A FY04A FY05A FY06A FY07A FY08A FY09A FY10A FY11A FY12 Budget
FY13 FCST
Overall SPE Operating EBIT Restructuring Charges TBD
SPE Overall EBIT without Monetizations Identified
page 10
($Millions)
“So what’s it all mean?”
Near-term pressure and a need for transactions, mid-term opportunity and growth
CONFIDENTIAL
We got it done
Corporate Development
($4)
$244
$513 $378
$605
$276 $265 $411
$275 $221 $121
$225 $285
$7
$516
$57
$50
$7 $52
$187
$70 $330
$375 $160
($62) ($33) ($20)
$281 $251
$1,029
$435
$655
$283 $317
$598
$345
$489 $463
$365
$500
($100)
$100
$300
$500
$700
$900
$1,100
FY01A FY02A FY03A FY04A FY05A FY06A FY07A FY08A FY09A FY10A FY11A FY12 Budget
FY13 FCST
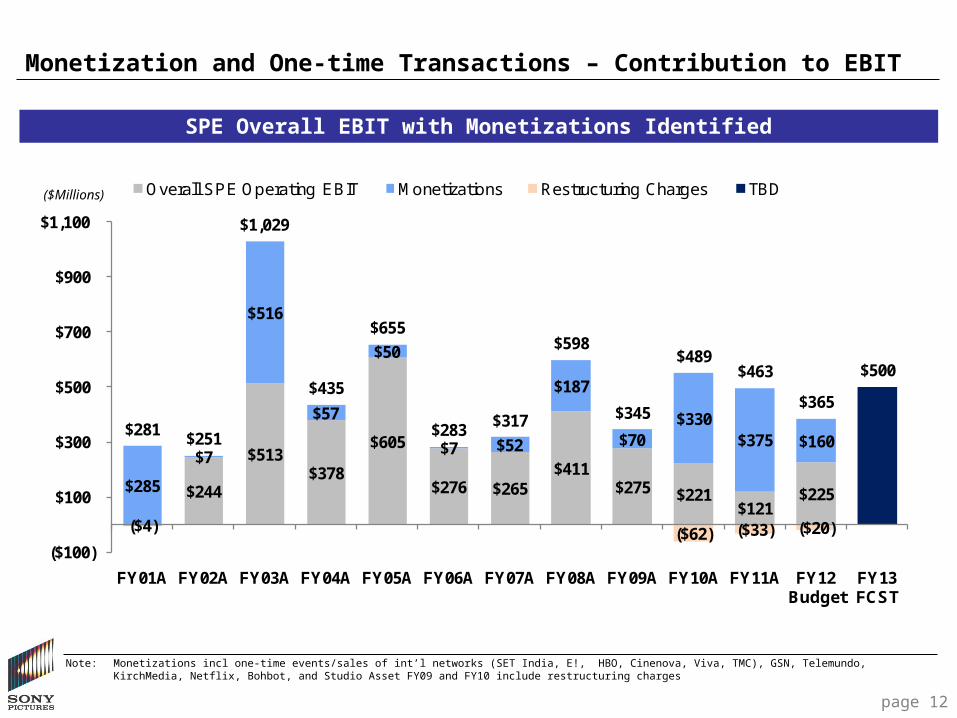
Overall SPE Operating EBIT Monetizations Restructuring Charges TBD
Note: Monetizations incl one-time events/sales of int’l networks (SET India, E!, HBO, Cinenova, Viva, TMC), GSN, Telemundo, KirchMedia, Netflix, Bohbot, and Studio Asset FY09 and FY10 include restructuring charges
SPE Overall EBIT with Monetizations Identified
page 12
($Millions)
Monetization and One-time Transactions – Contribution to EBIT
CONFIDENTIAL
Recent Activity
Corporate Development
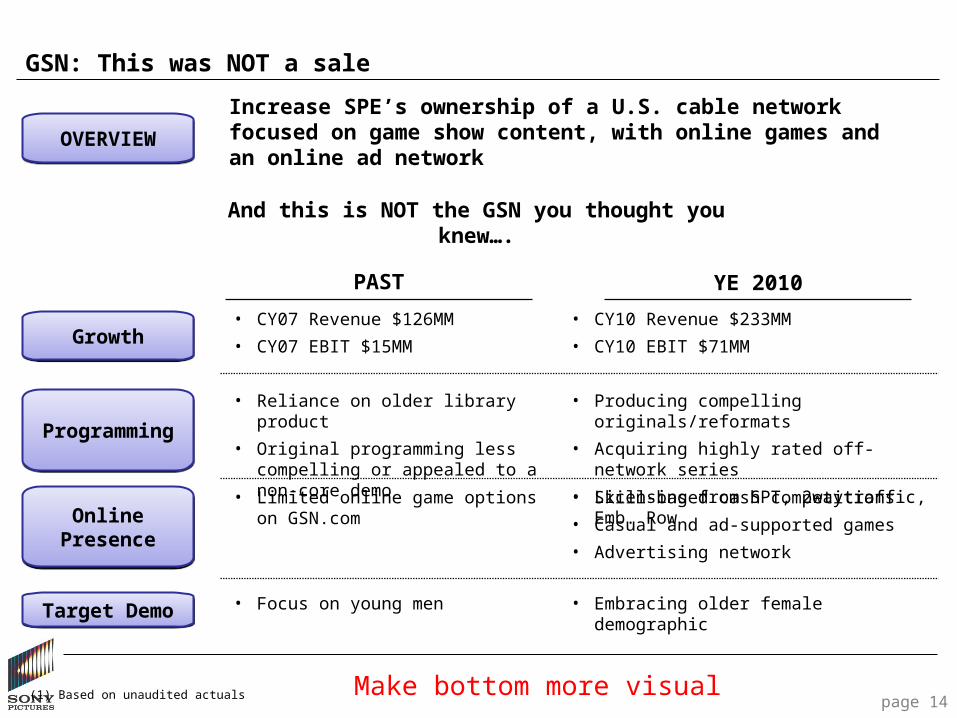
GSN: This was NOT a sale
Increase SPE’s ownership of a U.S. cable network focused on game show content, with online games and an online ad network
Target DemoTarget Demo
Online Presence
Online Presence
ProgrammingProgramming
GrowthGrowth• CY10 Revenue $233MM
• CY10 EBIT $71MM
PAST YE 2010
• CY07 Revenue $126MM
• CY07 EBIT $15MM
• Producing compelling originals/reformats
• Acquiring highly rated off-network series
• Licensing from SPT, 2waytraffic, Emb. Row
• Reliance on older library product
• Original programming less compelling or appealed to a non-core demo
• Skill-based cash competitions
• Casual and ad-supported games
• Advertising network
• Limited online game options on GSN.com
• Embracing older female demographic• Focus on young men
(1) Based on unaudited actuals
OVERVIEWOVERVIEW
And this is NOT the GSN you thought you knew….
Make bottom more visualpage 14
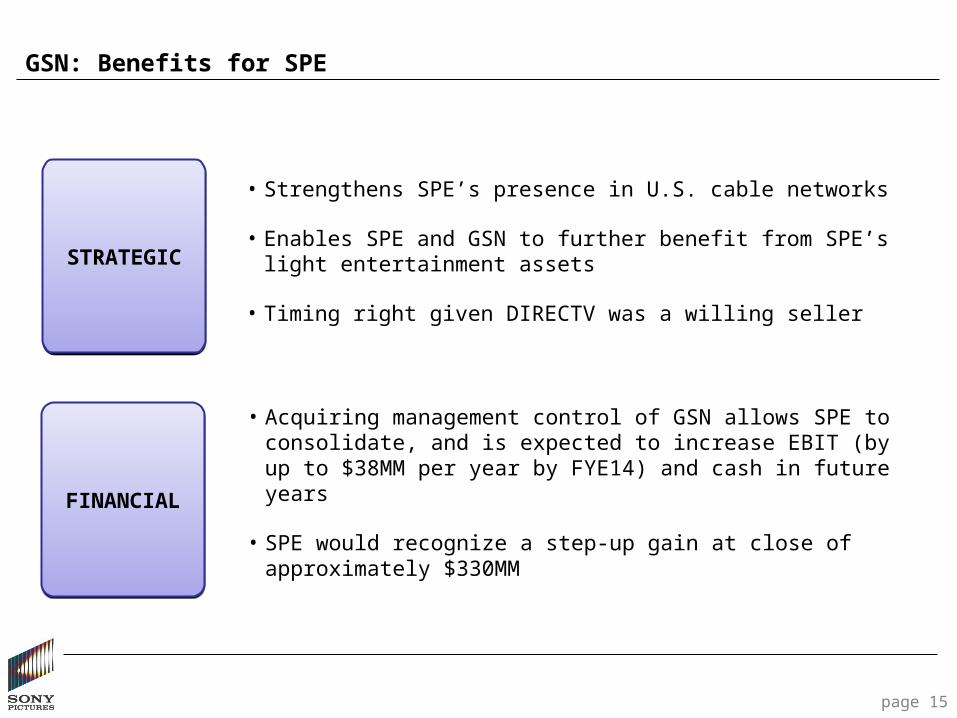
GSN: Benefits for SPE
• Strengthens SPE’s presence in U.S. cable networks
• Enables SPE and GSN to further benefit from SPE’s light entertainment assets
• Timing right given DIRECTV was a willing seller
• Acquiring management control of GSN allows SPE to consolidate, and is expected to increase EBIT (by up to $38MM per year by FYE14) and cash in future years
• SPE would recognize a step-up gain at close of approximately $330MM
page 15
STRATEGICSTRATEGIC
FINANCIALFINANCIAL
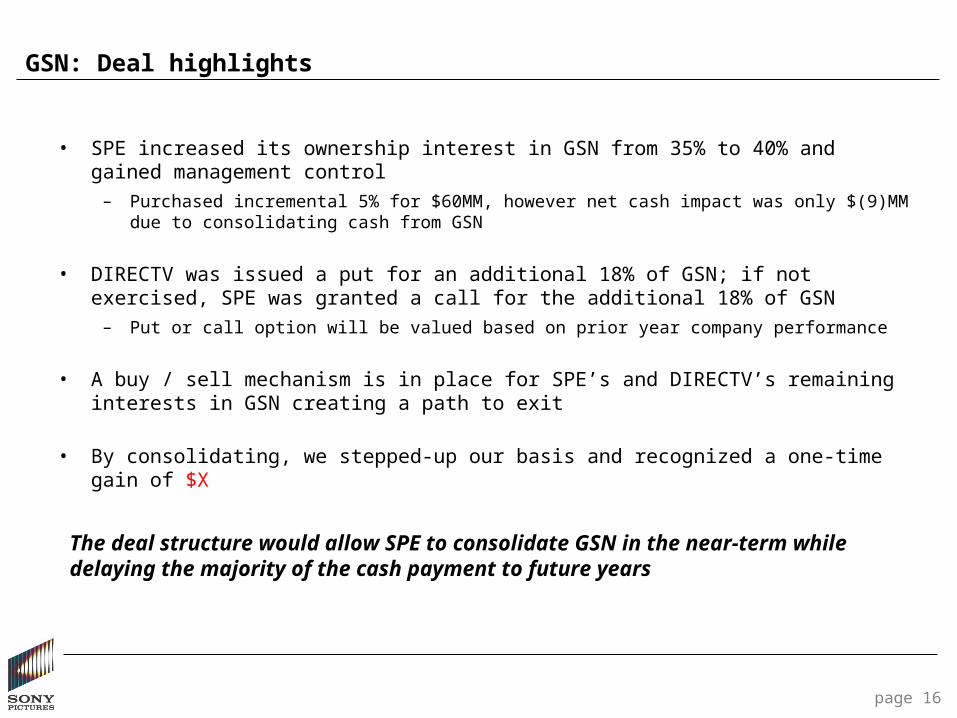
GSN: Deal highlights
• SPE increased its ownership interest in GSN from 35% to 40% and gained management control
– Purchased incremental 5% for $60MM, however net cash impact was only $(9)MM due to consolidating cash from GSN
• DIRECTV was issued a put for an additional 18% of GSN; if not exercised, SPE was granted a call for the additional 18% of GSN
– Put or call option will be valued based on prior year company performance
• A buy / sell mechanism is in place for SPE’s and DIRECTV’s remaining interests in GSN creating a path to exit
• By consolidating, we stepped-up our basis and recognized a one-time gain of $X
page 16
The deal structure would allow SPE to consolidate GSN in the near-term while delaying the majority of the cash payment to future years
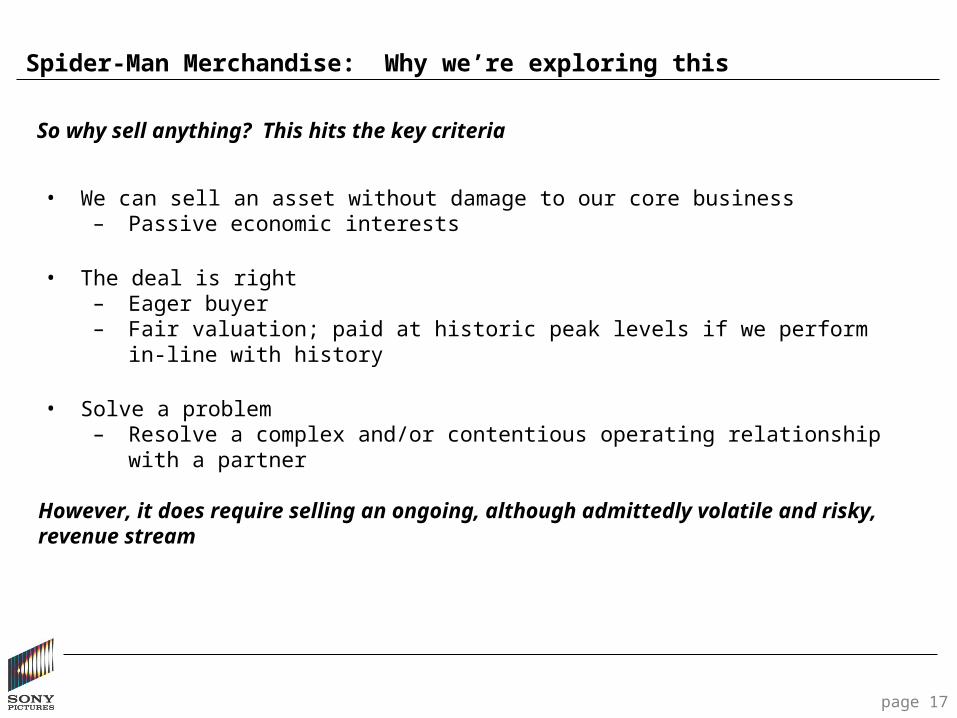
Spider-Man Merchandise: Why we’re exploring this
So why sell anything? This hits the key criteria
page 17
However, it does require selling an ongoing, although admittedly volatile and risky, revenue stream
• We can sell an asset without damage to our core business– Passive economic interests
• The deal is right– Eager buyer– Fair valuation; paid at historic peak levels if we perform in-line with history
• Solve a problem– Resolve a complex and/or contentious operating relationship with a partner
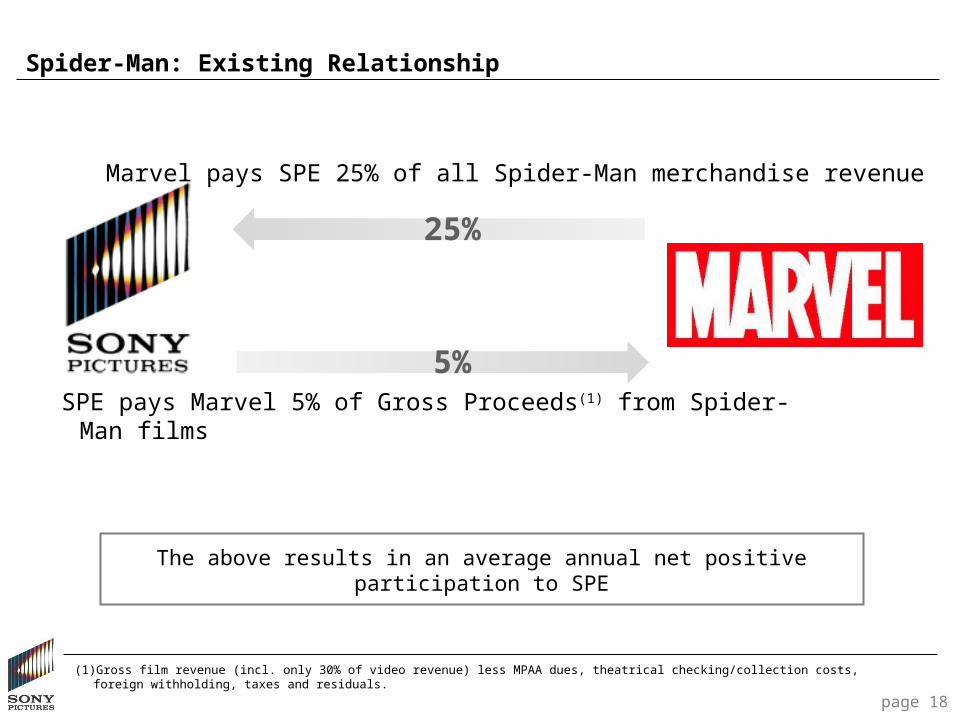
Spider-Man: Existing Relationship
25%
5%
Marvel pays SPE 25% of all Spider-Man merchandise revenue
SPE pays Marvel 5% of Gross Proceeds(1) from Spider-Man films
The above results in an average annual net positive participation to SPE
(1) Gross film revenue (incl. only 30% of video revenue) less MPAA dues, theatrical checking/collection costs, foreign withholding, taxes and residuals.
page 18
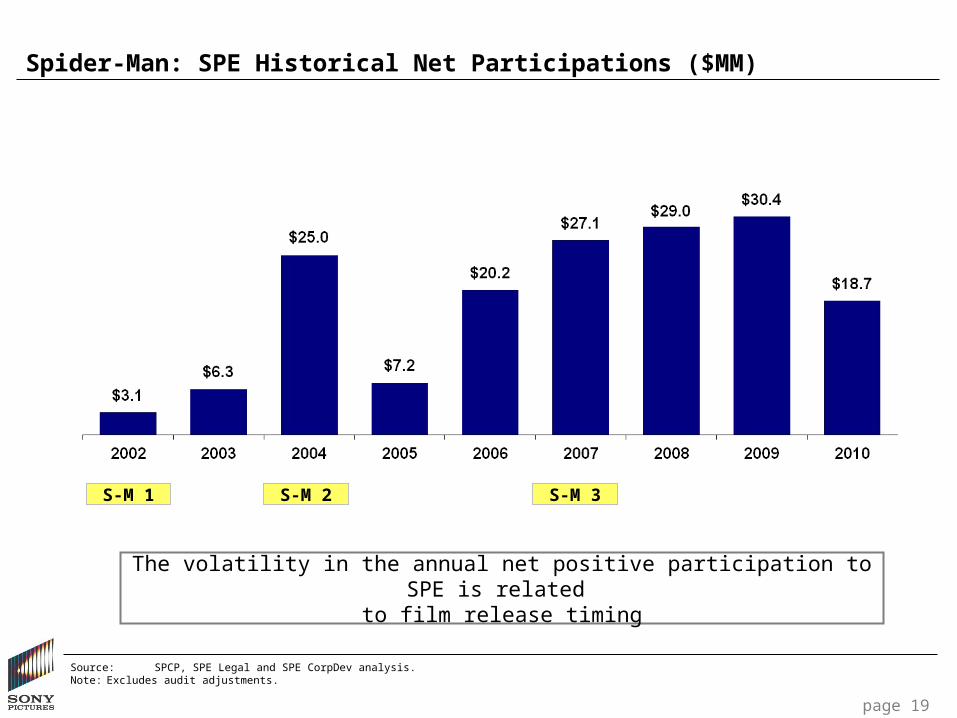
Spider-Man: SPE Historical Net Participations ($MM)
page 19
Source: SPCP, SPE Legal and SPE CorpDev analysis.Note: Excludes audit adjustments.
The volatility in the annual net positive participation to SPE is related to film release timing
S-M 1 S-M 2 S-M 3
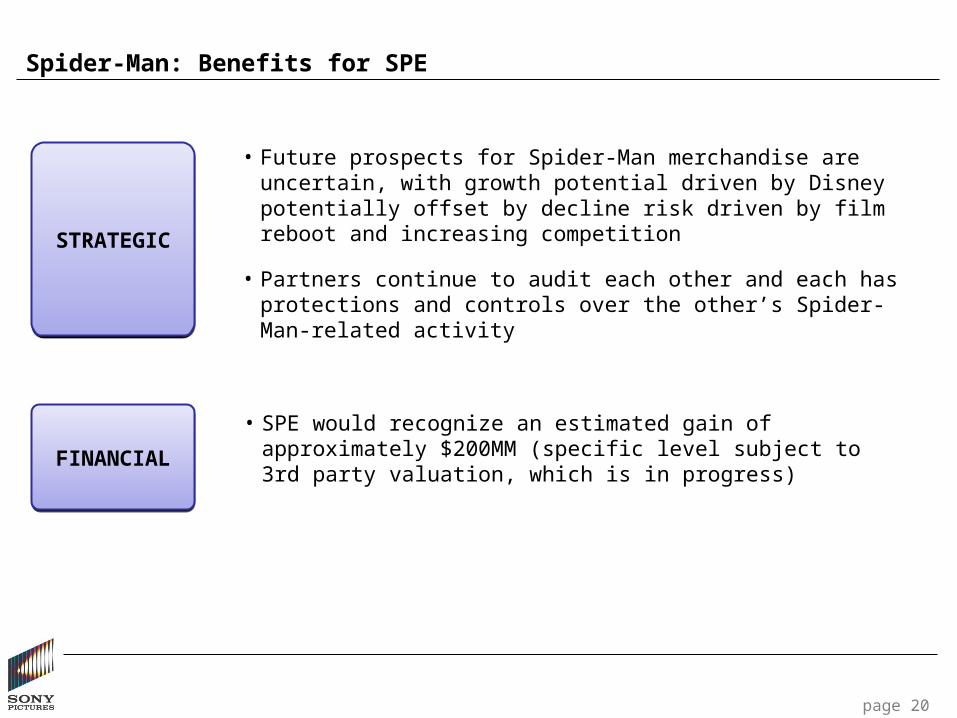
Spider-Man: Benefits for SPE
page 20
• SPE would recognize an estimated gain of approximately $200MM (specific level subject to 3rd party valuation, which is in progress)
• Future prospects for Spider-Man merchandise are uncertain, with growth potential driven by Disney potentially offset by decline risk driven by film reboot and increasing competition
• Partners continue to audit each other and each has protections and controls over the other’s Spider-Man-related activity
STRATEGICSTRATEGIC
FINANCIALFINANCIAL
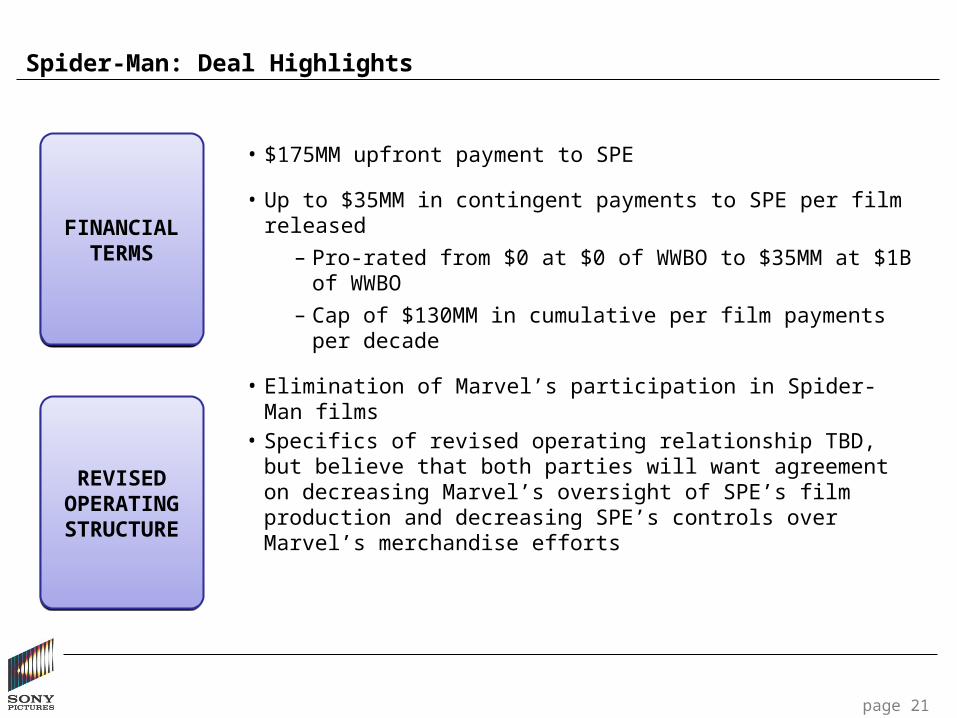
Spider-Man: Deal Highlights
page 21
• $175MM upfront payment to SPE
• Up to $35MM in contingent payments to SPE per film released
– Pro-rated from $0 at $0 of WWBO to $35MM at $1B of WWBO
– Cap of $130MM in cumulative per film payments per decade
• Elimination of Marvel’s participation in Spider-Man films
• Specifics of revised operating relationship TBD, but believe that both parties will want agreement on decreasing Marvel’s oversight of SPE’s film production and decreasing SPE’s controls over Marvel’s merchandise efforts
FINANCIAL TERMS
FINANCIAL TERMS
REVISED OPERATING STRUCTURE
REVISED OPERATING STRUCTURE
CONFIDENTIAL
The cost of sales is rising
Corporate Development
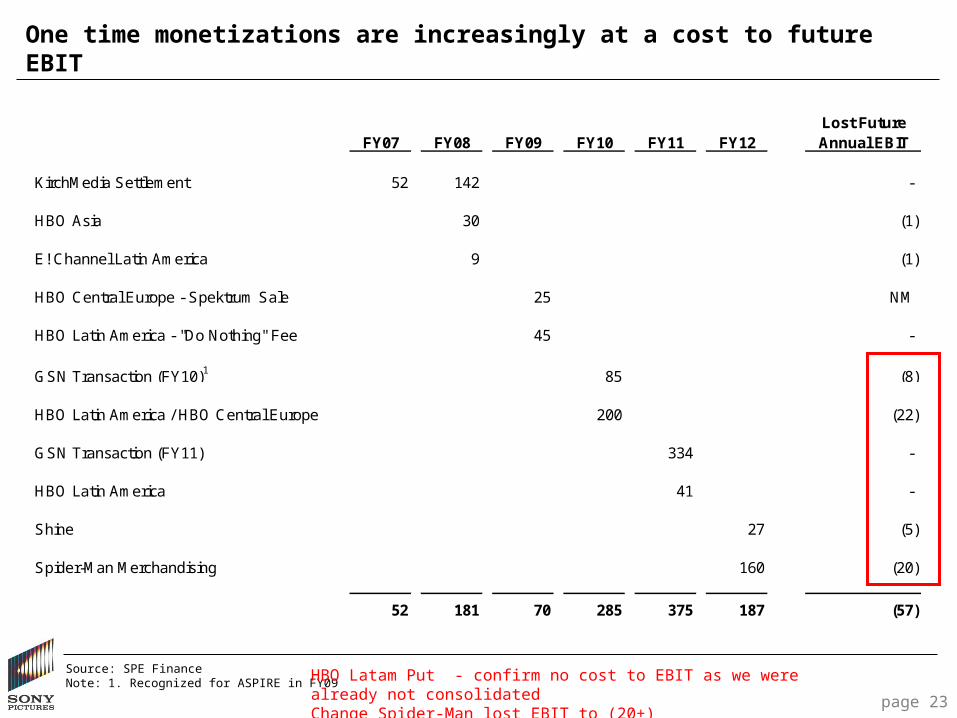
Lost FutureFY07 FY08 FY09 FY10 FY11 FY12 Annual EBIT
KirchMedia Settlement 52 142 -
HBO Asia 30 (1)
E! Channel Latin America 9 (1)
HBO Central Europe - Spektrum Sale 25 NM
HBO Latin America - "Do Nothing" Fee 45 -
GSN Transaction (FY10)1 85 (8)
HBO Latin America / HBO Central Europe 200 (22)
GSN Transaction (FY11) 334 -
HBO Latin America 41 -
Shine 27 (5)
Spider-Man Merchandising 160 (20)
52 181 70 285 375 187 (57)
One time monetizations are increasingly at a cost to future EBIT
Source: SPE FinanceNote: 1. Recognized for ASPIRE in FY09 HBO Latam Put - confirm no cost to EBIT as we were already not consolidated
Change Spider-Man lost EBIT to (20+)page 23
CONFIDENTIAL
So what’s your strategy?
Corporate Development
M&A Strategy
page 25
• We completed monetizations when:
– The right deal was on the table (right value, right counter-party, limited long-term EBIT impact, attractive near-term impact)
– Our business faced significant economic pressures
• We are likely to complete another transaction this year as the right deal is available and we face continued pressures
• As our business begins to expand, the emphasis is shifting to acquisitions that:
– Expand in the highest margin, fastest growing segments of our business
– Diversify our revenue and profit streams
– “Buy EBIT,” using transactions to supplement steady-state earnings rather than create one-time gains
• Several acquisition categories and specific opportunities are being explored now
Acquisition Potential in Key Areas
page 26
TELEVISION PRODUCTIONTELEVISION
PRODUCTION
TELEVISION NETWORKSTELEVISION NETWORKS
FILM PRODUCTION
FILM PRODUCTION
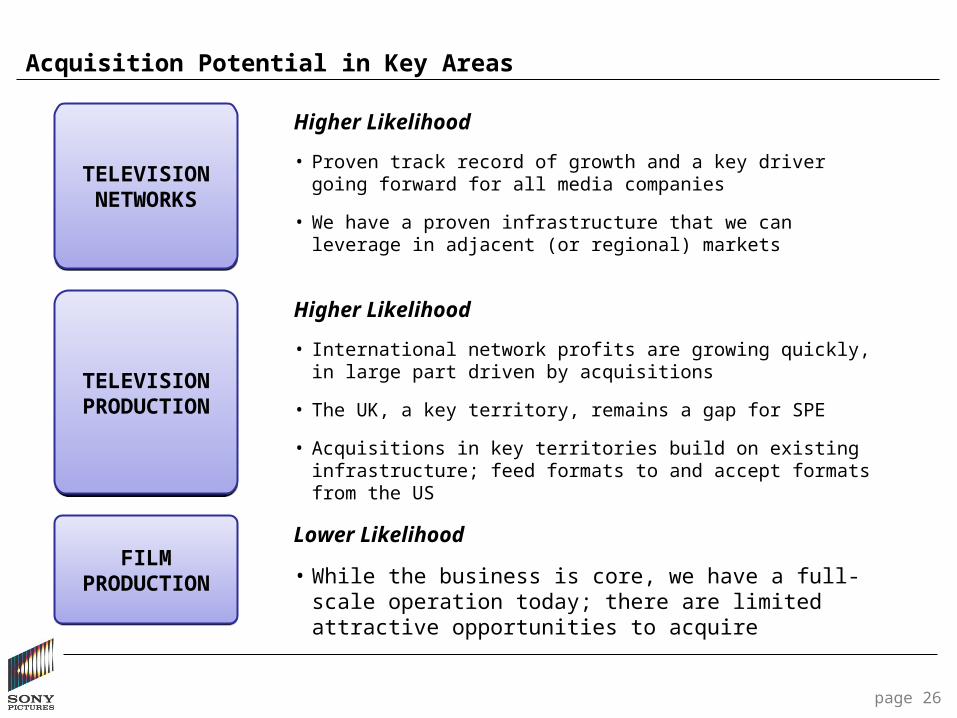
Higher Likelihood
• International network profits are growing quickly, in large part driven by acquisitions
• The UK, a key territory, remains a gap for SPE
• Acquisitions in key territories build on existing infrastructure; feed formats to and accept formats from the US
Higher Likelihood
• Proven track record of growth and a key driver going forward for all media companies
• We have a proven infrastructure that we can leverage in adjacent (or regional) markets
Lower Likelihood
• While the business is core, we have a full-scale operation today; there are limited attractive opportunities to acquire
India ETV: A bouquet of six regional channels across multiple languages
page 27
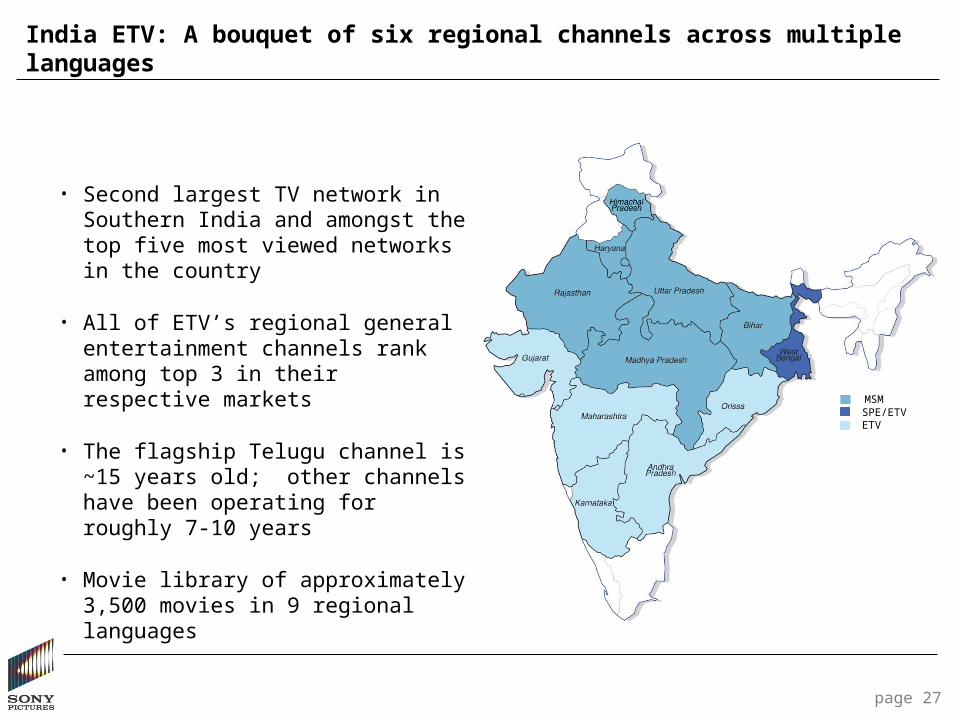
• Second largest TV network in Southern India and amongst the top five most viewed networks in the country
• All of ETV’s regional general entertainment channels rank among top 3 in their respective markets
• The flagship Telugu channel is ~15 years old; other channels have been operating for roughly 7-10 years
• Movie library of approximately 3,500 movies in 9 regional languages
MSMSPE/ETVETV
India ETV: Why buy
page 28
GROWTHGROWTH
DIVERSIFICA-TION
DIVERSIFICA-TION
EFFICIENCIESEFFICIENCIES
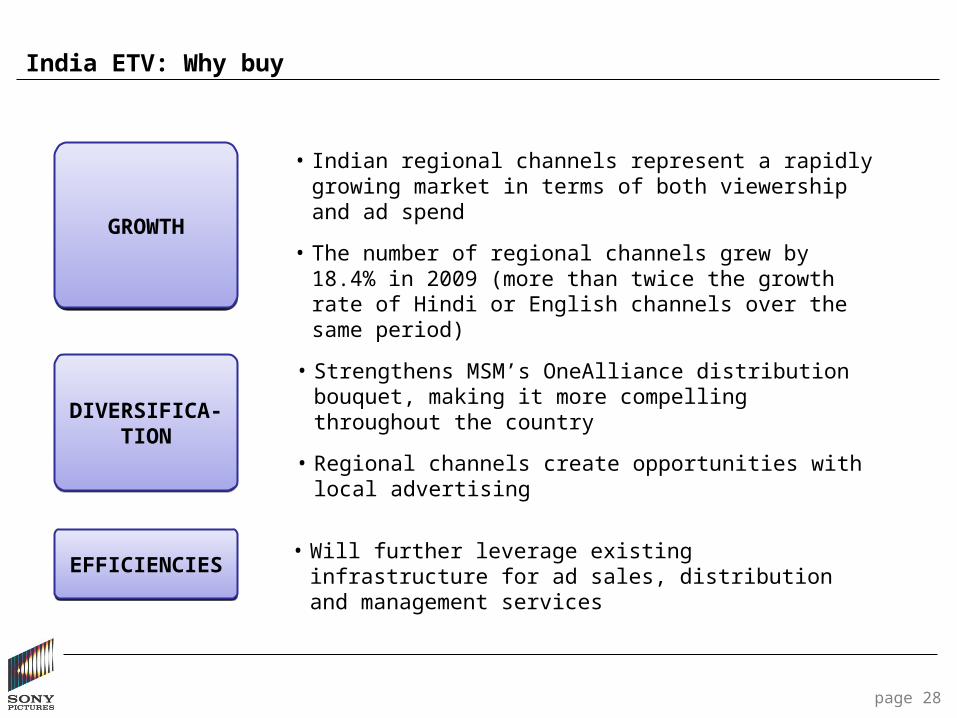
• Indian regional channels represent a rapidly growing market in terms of both viewership and ad spend
• The number of regional channels grew by 18.4% in 2009 (more than twice the growth rate of Hindi or English channels over the same period)
• Strengthens MSM’s OneAlliance distribution bouquet, making it more compelling throughout the country
• Regional channels create opportunities with local advertising
• Will further leverage existing infrastructure for ad sales, distribution and management services
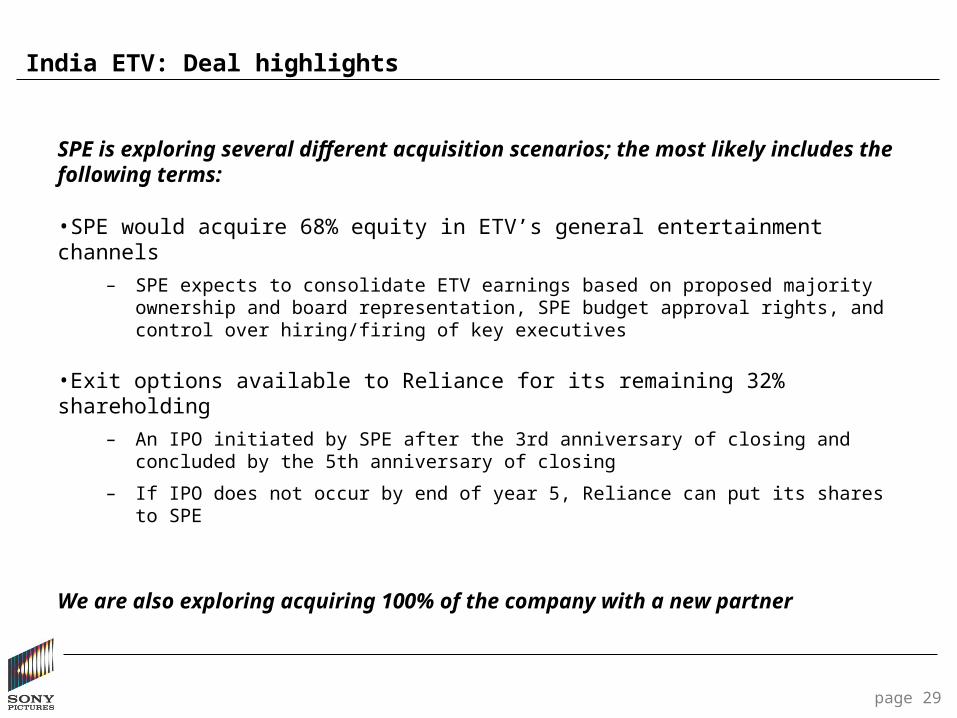
India ETV: Deal highlights
SPE is exploring several different acquisition scenarios; the most likely includes the following terms:
•SPE would acquire 68% equity in ETV’s general entertainment channels
– SPE expects to consolidate ETV earnings based on proposed majority ownership and board representation, SPE budget approval rights, and control over hiring/firing of key executives
•Exit options available to Reliance for its remaining 32% shareholding
– An IPO initiated by SPE after the 3rd anniversary of closing and concluded by the 5th anniversary of closing
– If IPO does not occur by end of year 5, Reliance can put its shares to SPE
We are also exploring acquiring 100% of the company with a new partner
page 29
CONFIDENTIAL
Margin Analysis
"Work with business units to drive profits and investments by product margin”
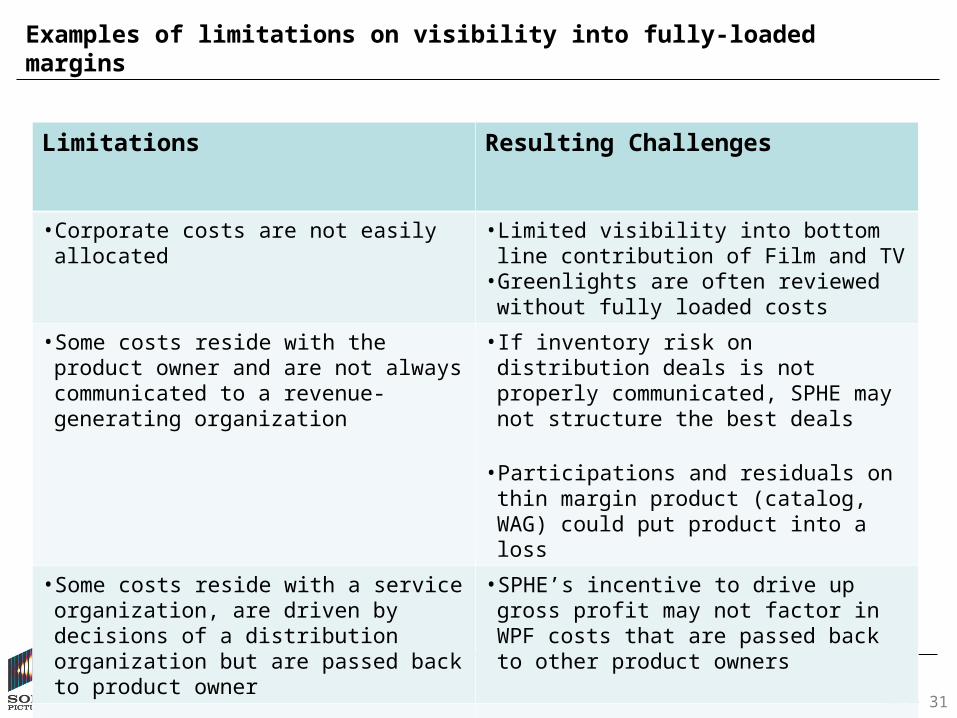
Examples of limitations on visibility into fully-loaded margins
page 31
Limitations Resulting Challenges
• Corporate costs are not easily allocated • Limited visibility into bottom line contribution of Film and TV
• Greenlights are often reviewed without fully loaded costs
• Some costs reside with the product owner and are not always communicated to a revenue-generating organization
• If inventory risk on distribution deals is not properly communicated, SPHE may not structure the best deals
• Participations and residuals on thin margin product (catalog, WAG) could put product into a loss
• Some costs reside with a service organization, are driven by decisions of a distribution organization but are passed back to product owner
• SPHE’s incentive to drive up gross profit may not factor in WPF costs that are passed back to other product owners
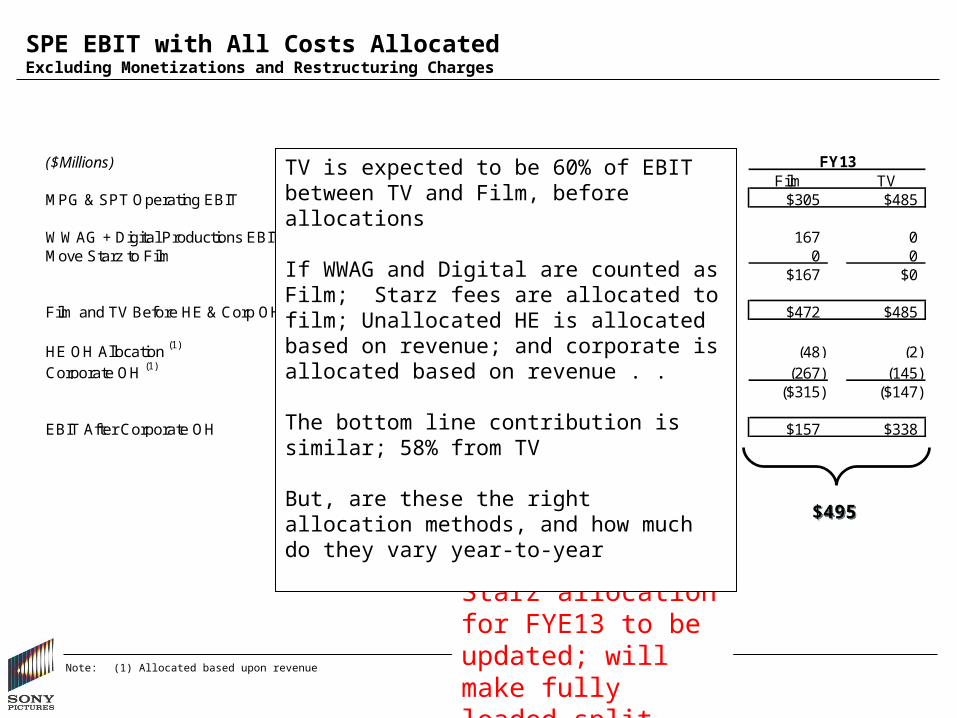
SPE EBIT with All Costs AllocatedExcluding Monetizations and Restructuring Charges
Note: (1) Allocated based upon revenue
$121$121
($Millions) FY11 FY12 FY13Film TV Film TV Film TV
MPG & SPT Operating EBIT $101 $402 $281 $416 $305 $485
WWAG + Digital Productions EBIT 116 0 (11) 0 167 0Move Starz to Film 50 (50) 49 (49) 0 0
$166 ($50) $38 ($49) $167 $0
Film and TV Before HE & Corp OH $267 $352 $319 $367 $472 $485
HE OH Allocation (1) (52) (4) (51) (2) (48) (2)Corporate OH (1) (291) (151) (243) (165) (267) (145)
($343) ($155) ($294) ($167) ($315) ($147)
EBIT After Corporate OH ($76) $197 $25 $200 $157 $338
$225$225 $495$495
Starz allocation for FYE13 to be updated; will make fully loaded split about 58/42
TV is expected to be 60% of EBIT between TV and Film, before allocations If WWAG and Digital are counted as Film; Starz fees are allocated to film; Unallocated HE is allocated based on revenue; and corporate is allocated based on revenue . . The bottom line contribution is similar; 58% from TV But, are these the right allocation methods, and how much do they vary year-to-year
Decisions Impacted by Full Understanding of Margins
• Allocation of investment capital between Film and TV
• Home Entertainment sales strategy and cost management
– Managing distribution titles to account for inventory risk where appropriate
– Rationalizing lower margin SKUs that may be profitable before participations, residuals, and WPF, but generate losses once fully loaded
– Better evaluate the profitability of scan-based trading
• Reviewing greenlights on a fully-loaded basis to ensure each slate will cover the associated overhead
page 33
Action Items
• Determine what items we want to look at on a fully loaded basis
• Catalog types of decisions that would be impacted
• For hard costs not owned by sales organizations, identify communications (formal, informal, systems-based) that better relay necessary cost information
• For allocated costs, determine appropriate methods of allocating costs
• Agree on these allocations with key stake holders
• Factor fully-burdened profits into key decisions
page 34

CONFIDENTIAL
Q&A