conducting experimental trials gary palmer. scientific method formulation of hypothesis planning...
TRANSCRIPT
Conducting Conducting Experimental TrialsExperimental Trials
Gary PalmerGary Palmer
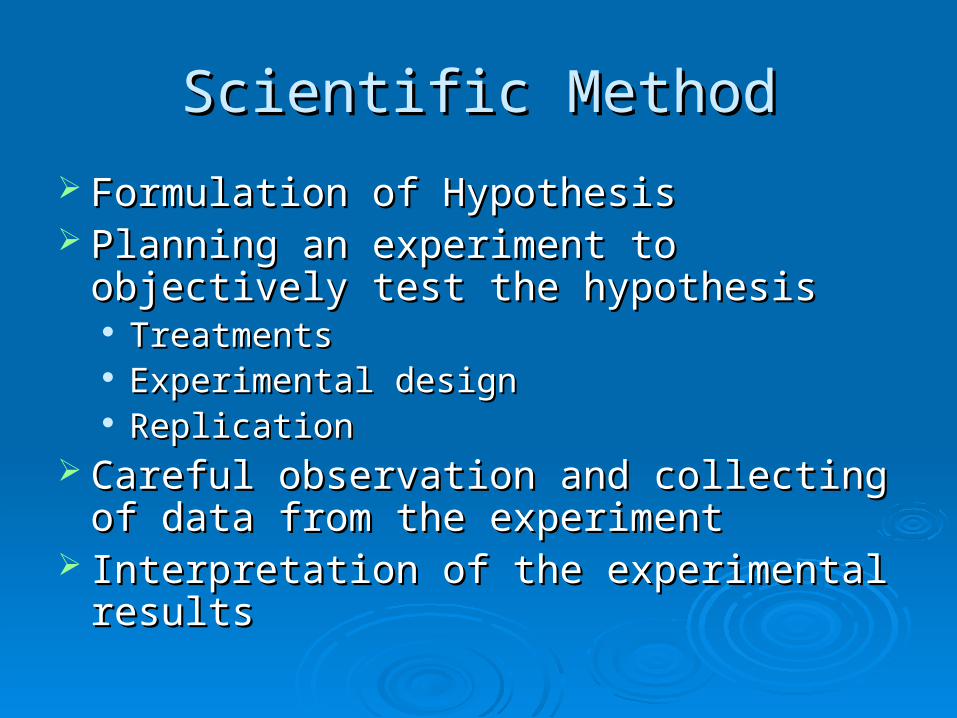
Scientific MethodScientific Method
Formulation of HypothesisFormulation of Hypothesis Planning an experiment to objectively test Planning an experiment to objectively test
the hypothesisthe hypothesis TreatmentsTreatments Experimental designExperimental design ReplicationReplication
Careful observation and collecting of data Careful observation and collecting of data from the experimentfrom the experiment
Interpretation of the experimental resultsInterpretation of the experimental results
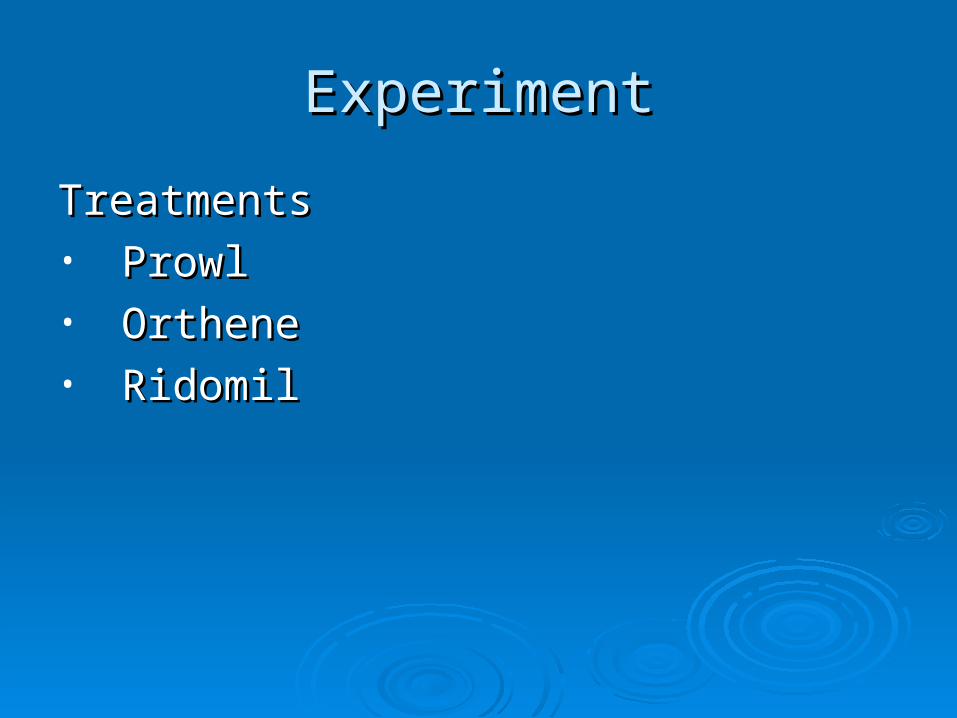
ExperimentExperiment
TreatmentsTreatments• ProwlProwl• OrtheneOrthene• RidomilRidomil
ExperimentExperiment
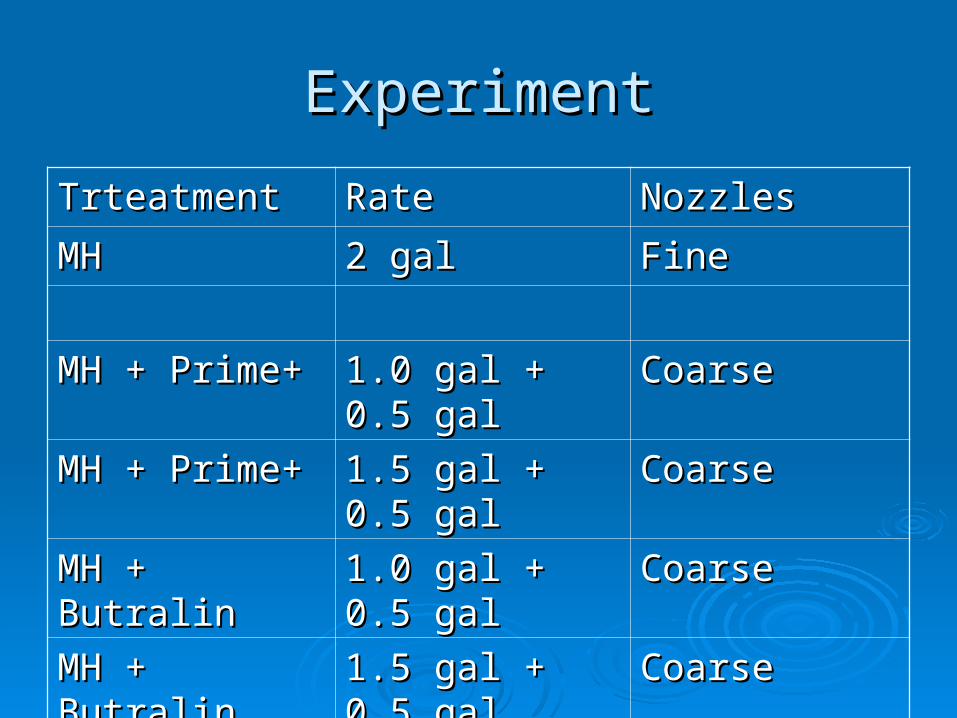
TrteatmentTrteatment RateRate NozzlesNozzles
MH MH 2 gal2 gal FineFine
MH + Prime+MH + Prime+ 1.0 gal + 0.5 gal1.0 gal + 0.5 gal CoarseCoarse
MH + Prime+MH + Prime+ 1.5 gal + 0.5 gal1.5 gal + 0.5 gal CoarseCoarse
MH + ButralinMH + Butralin 1.0 gal + 0.5 gal1.0 gal + 0.5 gal CoarseCoarse
MH + ButralinMH + Butralin 1.5 gal + 0.5 gal1.5 gal + 0.5 gal CoarseCoarse
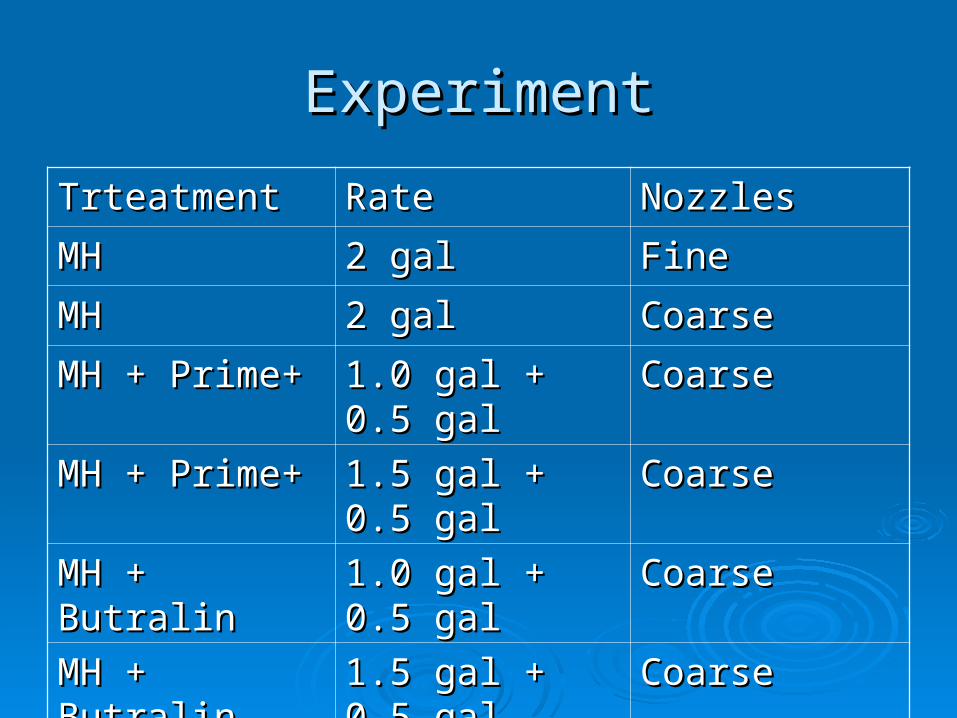
ExperimentExperiment
TrteatmentTrteatment RateRate NozzlesNozzles
MH MH 2 gal2 gal FineFine
MHMH 2 gal2 gal CoarseCoarse
MH + Prime+MH + Prime+ 1.0 gal + 0.5 gal1.0 gal + 0.5 gal CoarseCoarse
MH + Prime+MH + Prime+ 1.5 gal + 0.5 gal1.5 gal + 0.5 gal CoarseCoarse
MH + ButralinMH + Butralin 1.0 gal + 0.5 gal1.0 gal + 0.5 gal CoarseCoarse
MH + ButralinMH + Butralin 1.5 gal + 0.5 gal1.5 gal + 0.5 gal CoarseCoarse
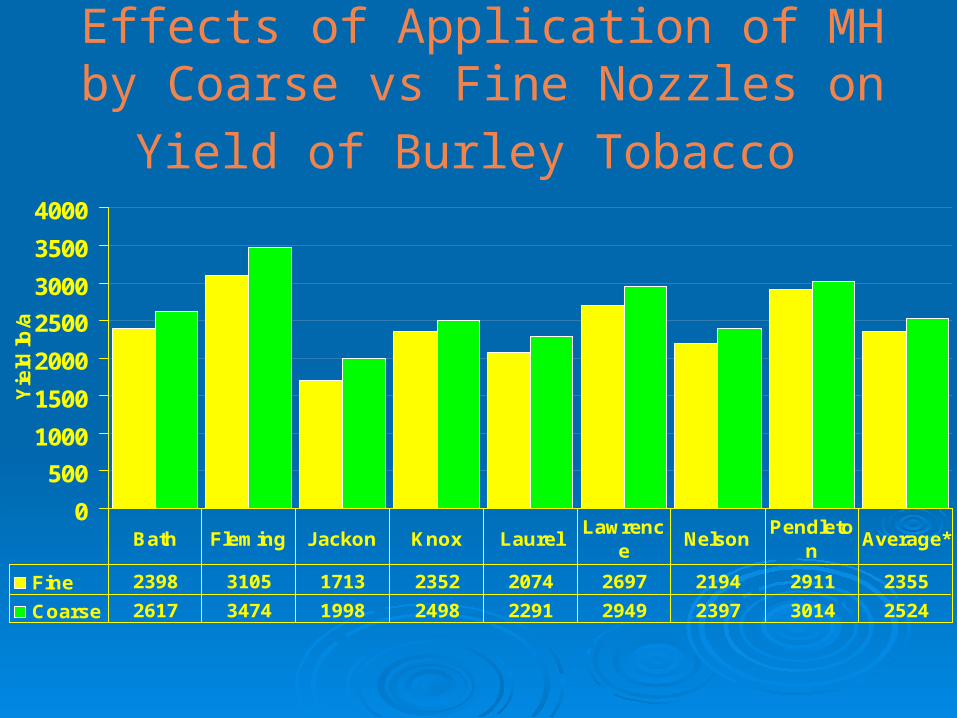
Effects of Application of MH by Coarse vs
Fine Nozzles on Yield of Burley Tobacco
0
500
1000
1500
2000
2500
3000
3500
4000
Yie
ld lb
/a
Fine 2398 3105 1713 2352 2074 2697 2194 2911 2355
Coarse 2617 3474 1998 2498 2291 2949 2397 3014 2524
Bath Fleming Jackon Knox LaurelLawrenc
eNelson
Pendleton
Average*
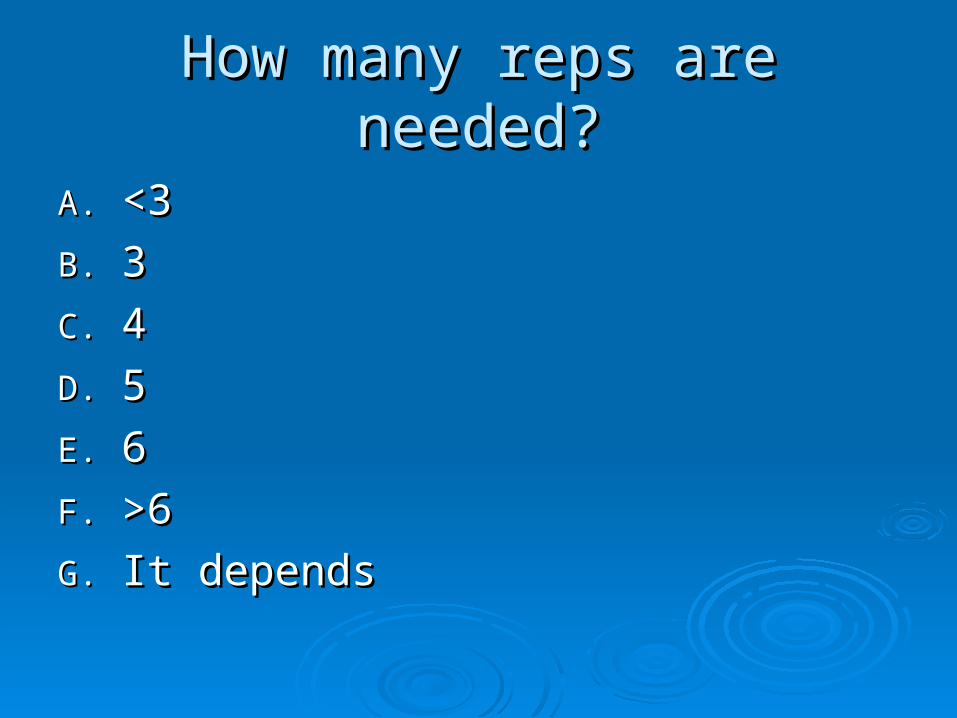
How many reps are needed?How many reps are needed?
A.A. <3<3
B.B. 33
C.C. 44
D.D. 55
E.E. 66
F.F. >6>6
G.G. It dependsIt depends
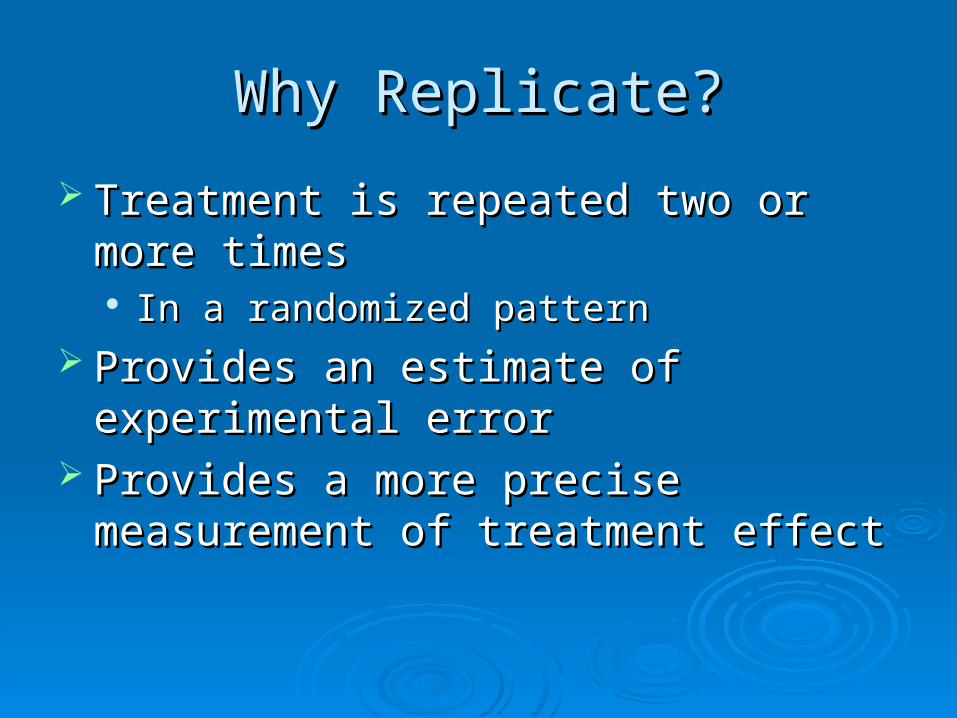
Why Replicate?Why Replicate?
Treatment is repeated two or more timesTreatment is repeated two or more times In a randomized patternIn a randomized pattern
Provides an estimate of experimental errorProvides an estimate of experimental error Provides a more precise measurement of Provides a more precise measurement of
treatment effecttreatment effect
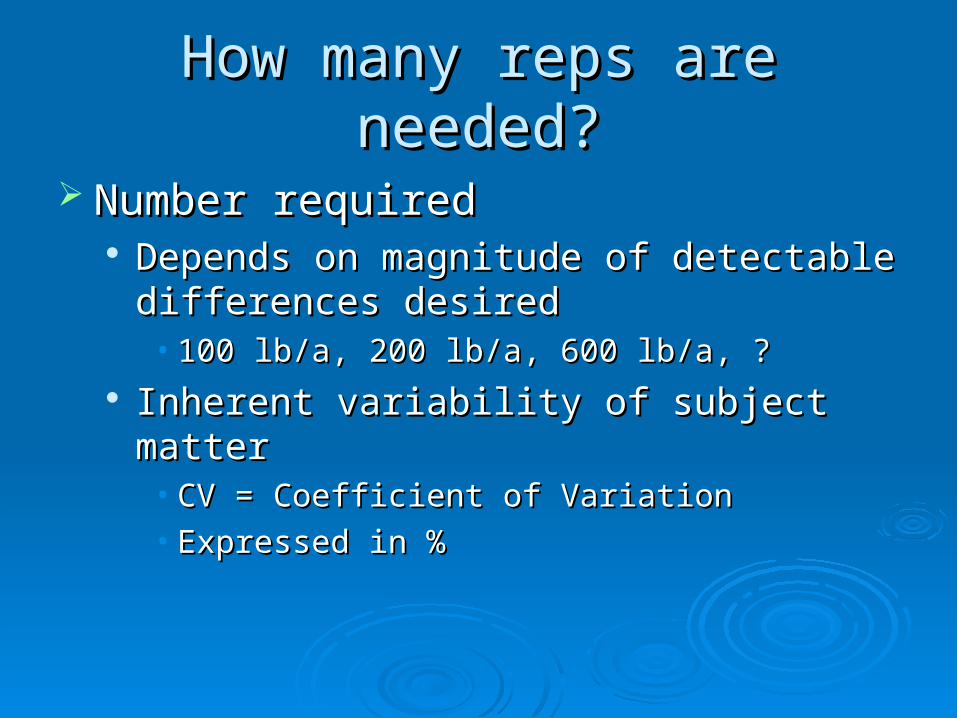
How many reps are needed?How many reps are needed?
Number requiredNumber required Depends on magnitude of detectable Depends on magnitude of detectable
differences desireddifferences desired• 100 lb/a, 200 lb/a, 600 lb/a, ?100 lb/a, 200 lb/a, 600 lb/a, ?
Inherent variability of subject matterInherent variability of subject matter• CV = Coefficient of VariationCV = Coefficient of Variation• Expressed in %Expressed in %
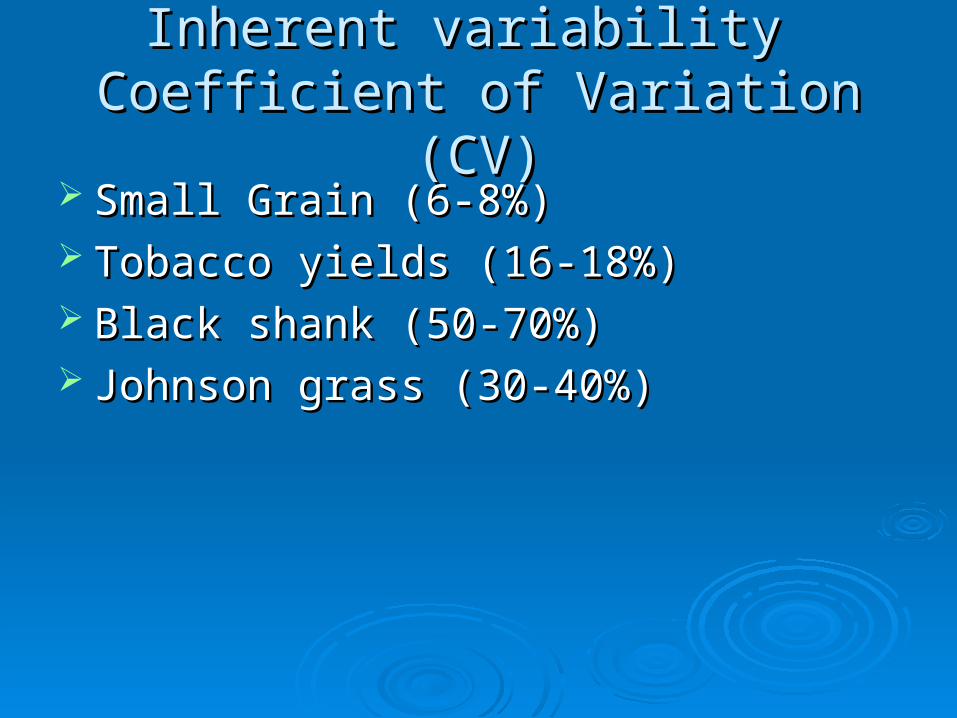
Inherent variability Inherent variability Coefficient of Variation (CV)Coefficient of Variation (CV)
Small Grain (6-8%)Small Grain (6-8%) Tobacco yields (16-18%)Tobacco yields (16-18%) Black shank (50-70%)Black shank (50-70%) Johnson grass (30-40%)Johnson grass (30-40%)
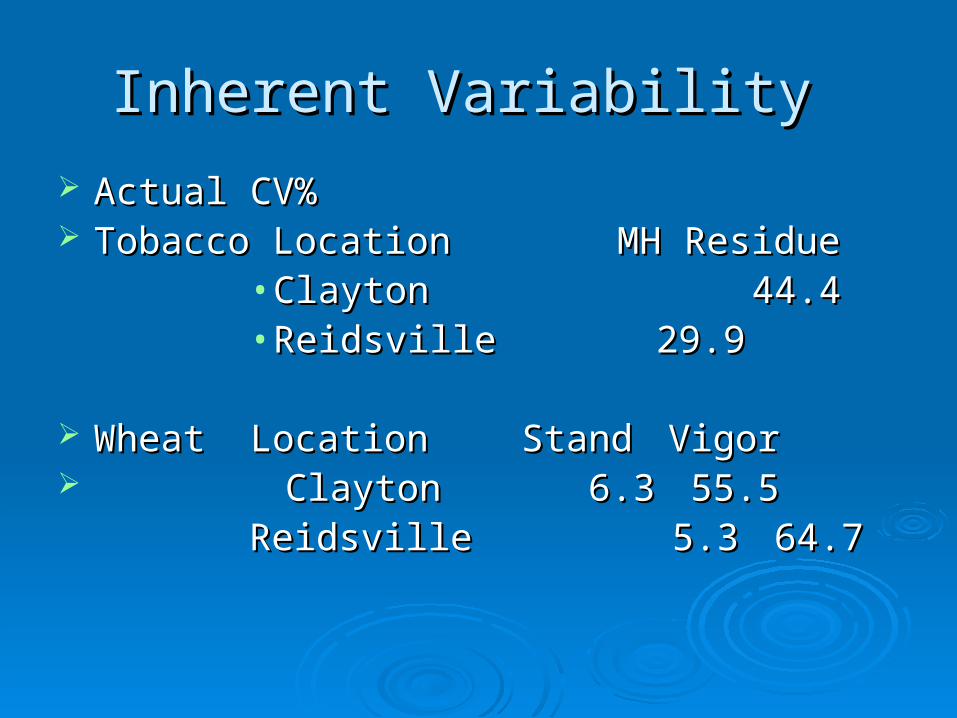
Inherent Variability Inherent Variability
Actual CV%Actual CV% Tobacco Location Tobacco Location MH Residue MH Residue
• ClaytonClayton 44.444.4• ReidsvilleReidsville 29.929.9
Wheat LocationWheat Location Stand Stand VigorVigor ClaytonClayton 6.3 6.3 55.5 55.5
ReidsvilleReidsville 5.3 5.3 64.7 64.7
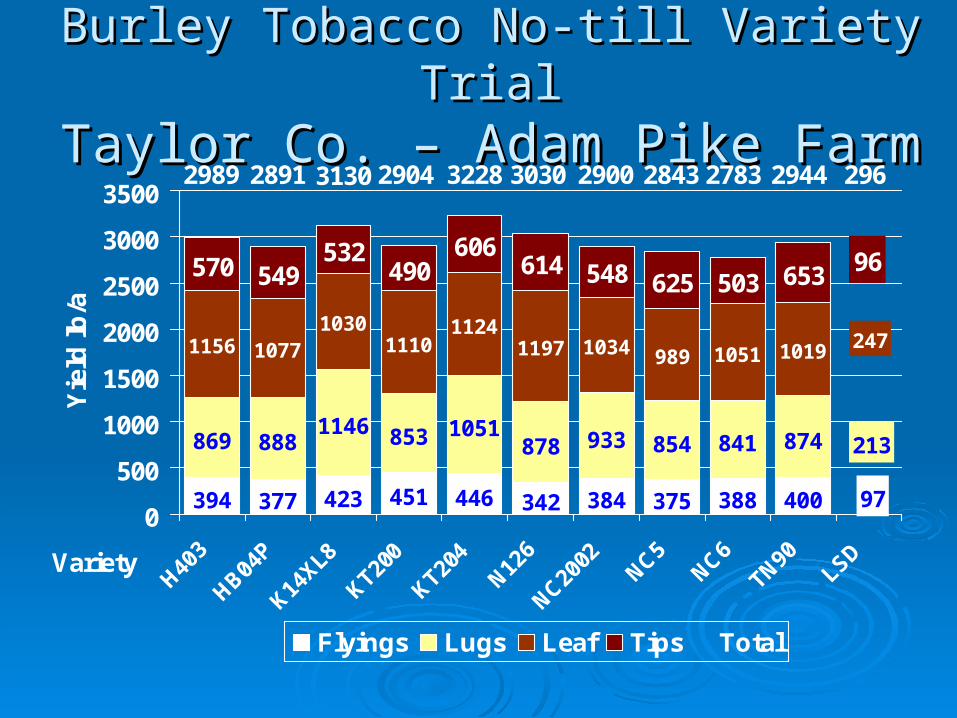
Burley Tobacco No-till Variety TrialBurley Tobacco No-till Variety TrialTaylor Co. – Adam Pike FarmTaylor Co. – Adam Pike Farm
394 377 423 451 446 342 384 375 388 400
869 8881146 853 1051
878 933 854 841 874
1156 10771030
11101124
1197 1034 989 1051 1019
570 549532
490606
614625 503 653
97
213
247
548 96
2944278328432900303032282904313028912989 296
0
500
1000
1500
2000
2500
3000
3500
Variety
Yie
ld l
b/a
Flyings Lugs Leaf Tips Total
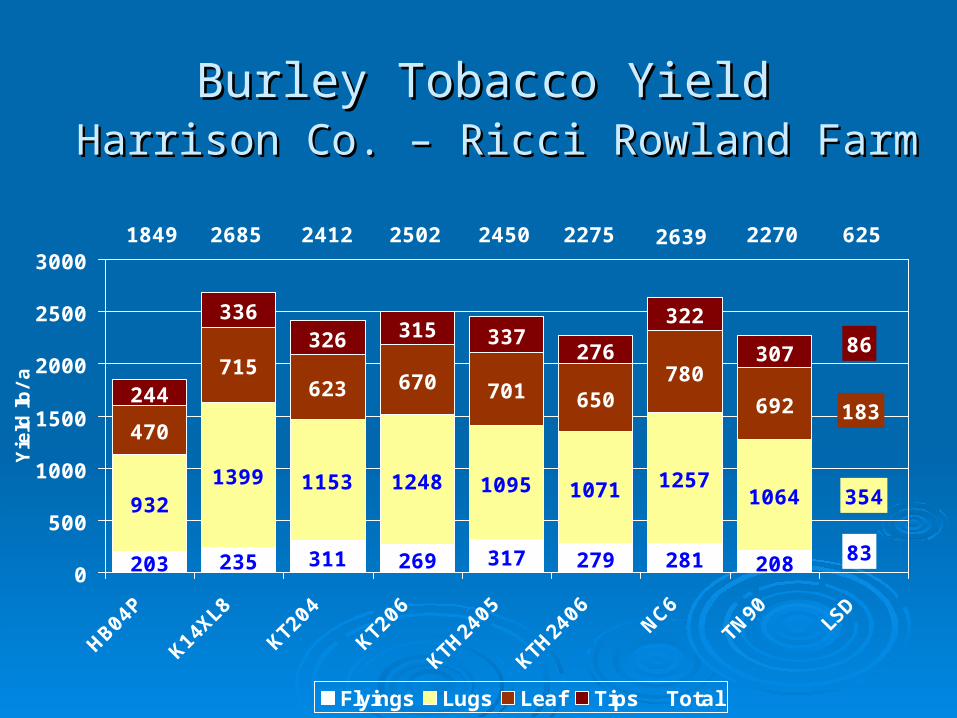
Burley Tobacco YieldBurley Tobacco Yield Harrison Co. – Ricci Rowland FarmHarrison Co. – Ricci Rowland Farm
203 235 311 269 317 279 281 208
9321399 1153 1248 1095 1071 1257
1064
470
715623 670 701 650
780
692
83
354
183244
336326 315 337
276
322
307 86
1849 2685 2412 2502 2450 2275 2639 2270 625
0
500
1000
1500
2000
2500
3000
Yie
ld lb/a
Flyings Lugs Leaf Tips Total
How can we increase precision?How can we increase precision?
The precision of an experiment can always The precision of an experiment can always be increased by additional replicationsbe increased by additional replications
Degree of improvement falls off rapidly as Degree of improvement falls off rapidly as replication increasereplication increase Example: To double the precision with which Example: To double the precision with which
two means can be separated in a trail with two means can be separated in a trail with four replications, reps would have to increase four replications, reps would have to increase to 16. to 16.
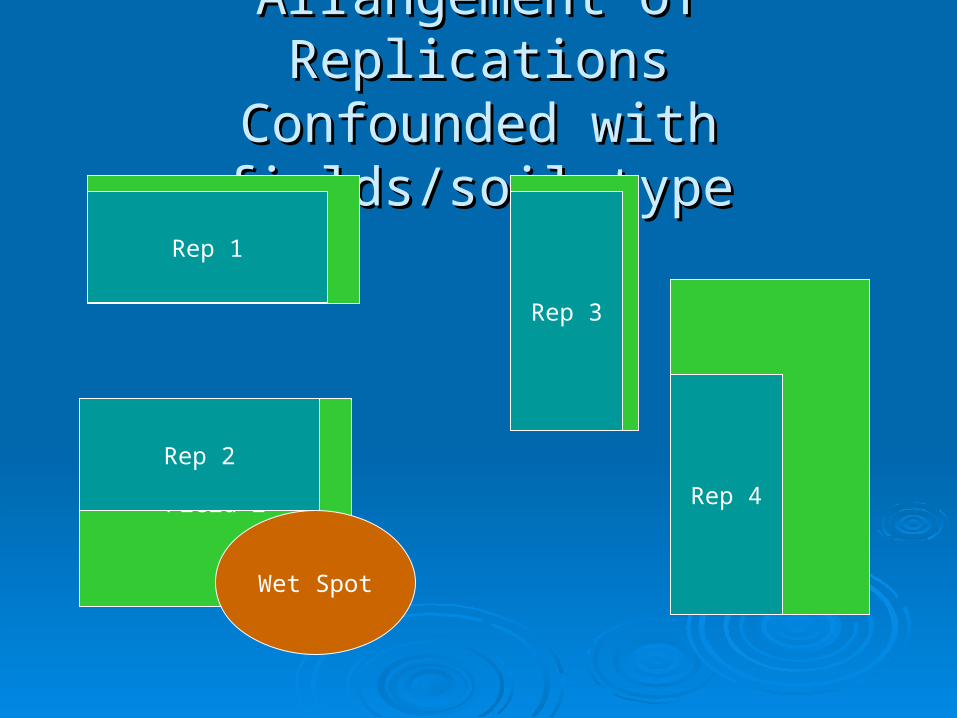
Arrangement of ReplicationsArrangement of ReplicationsConfounded with fields/soil typeConfounded with fields/soil type
Field 1
Field 3
Field 2
Wet Spot
Rep 1
Rep 3
Rep 2
Rep 4
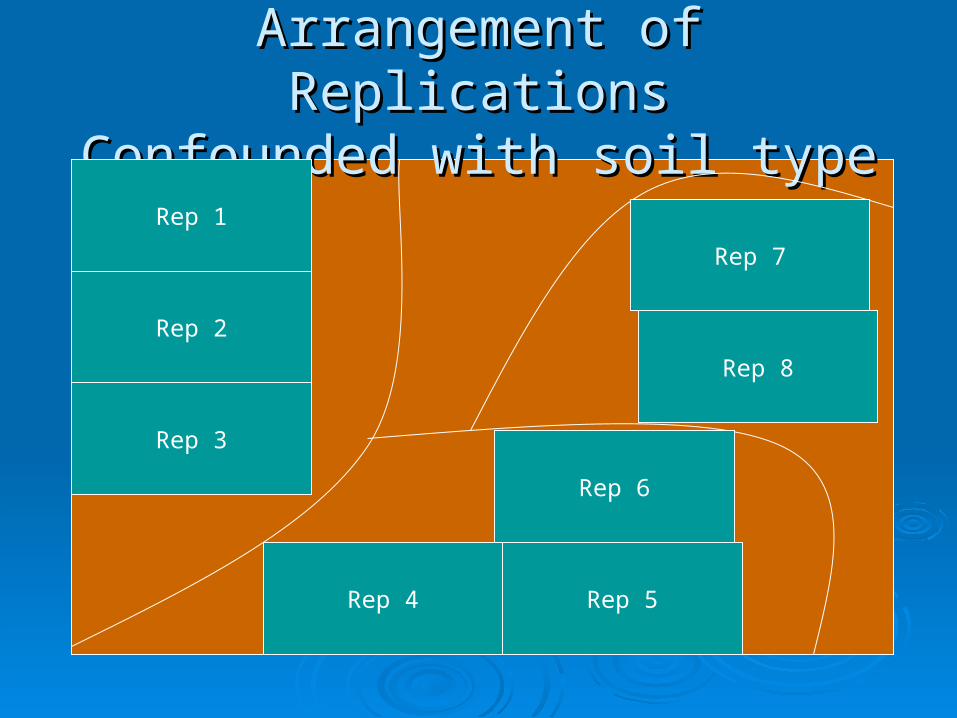
Arrangement of ReplicationsArrangement of ReplicationsConfounded with soil typeConfounded with soil type
Rep 1
Rep 2
Rep 3
Rep 4 Rep 5
Rep 6
Rep 7
Rep 8
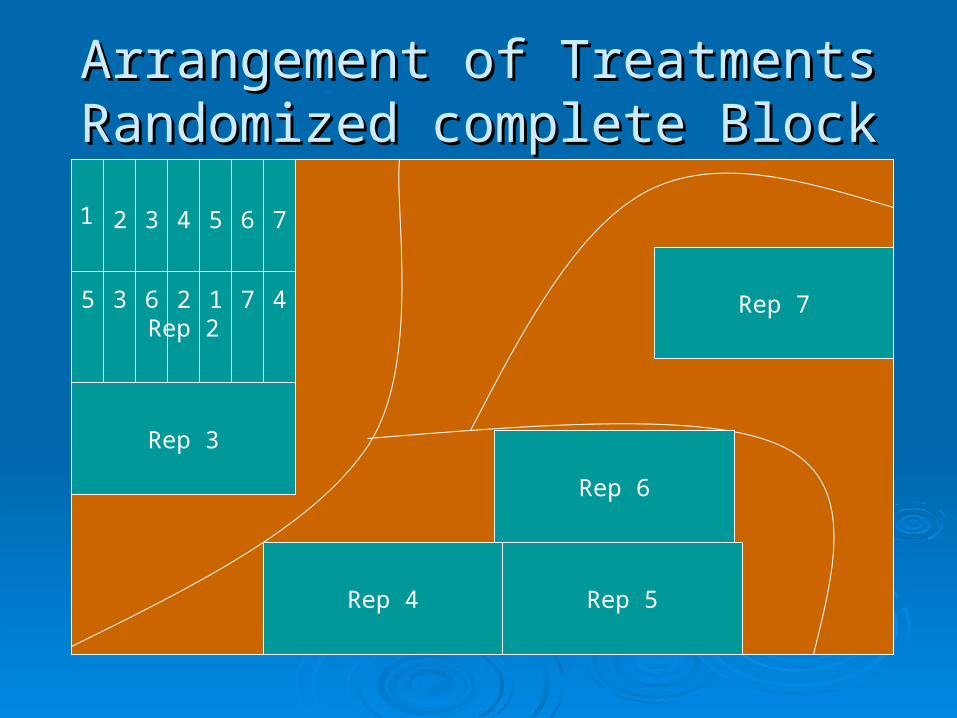
Arrangement of TreatmentsArrangement of TreatmentsRandomized complete BlockRandomized complete Block
Rep 2
Rep 3
Rep 4 Rep 5
Rep 6
Rep 7
1 2 3 4 5 6 7
2 45 13 76
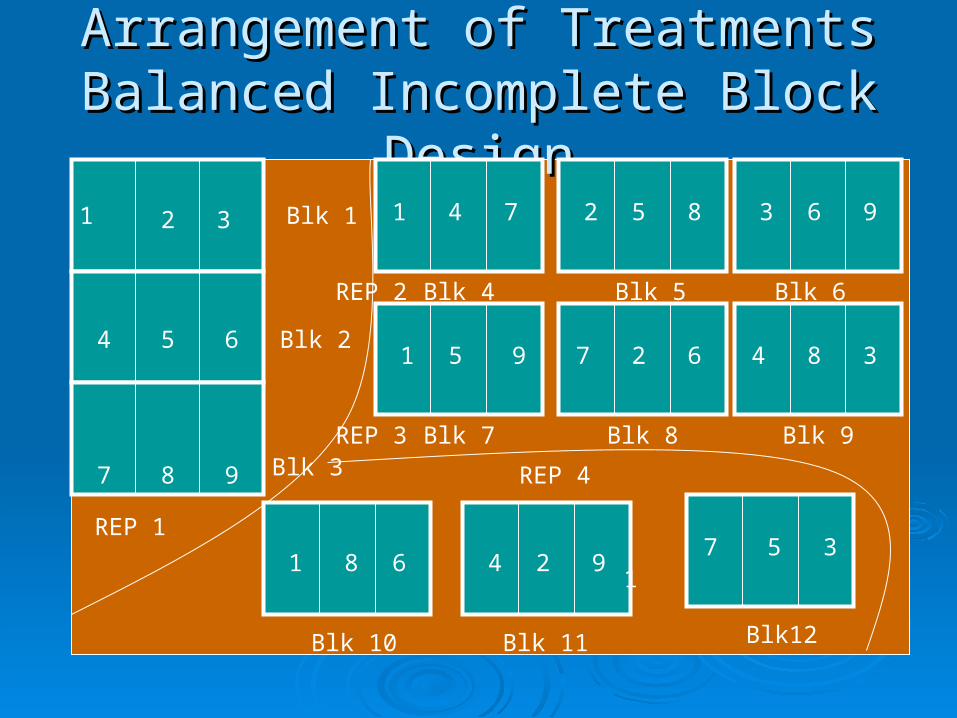
Arrangement of TreatmentsArrangement of TreatmentsBalanced Incomplete Block DesignBalanced Incomplete Block Design
1 2 3
4 5 6
1
14
82
5
5
1
Blk 1
Blk 2
7 8 9 Blk 3
4 7 3 6
Blk 6Blk 5Blk 4
9
9
Blk 11Blk 10
Blk 8Blk 7
Blk12
Blk 9
7
7
2
2
3
3
6
6
4
5REP 1
8
REP 2
REP 3
1 8 9
REP 4
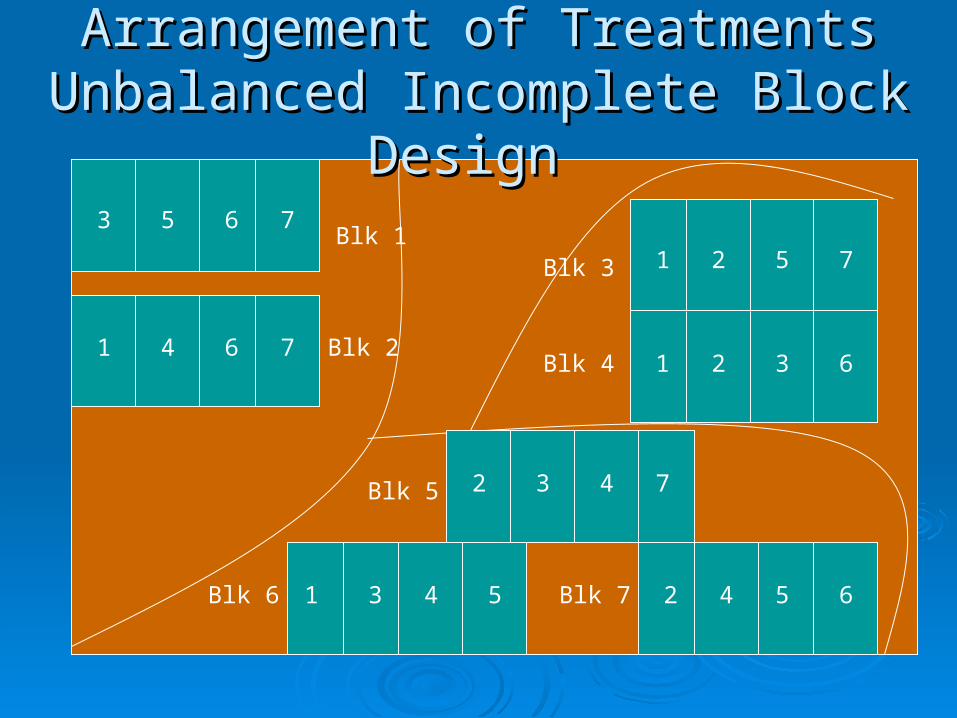
Arrangement of TreatmentsArrangement of TreatmentsUnbalanced Incomplete Block Design Unbalanced Incomplete Block Design
3 5 6 7
5 7
2
1 74
4
6
1
1
2
2
7
1 3 6
3
3 4 5 2 4 5 6Blk 6
Blk 2
Blk 3
Blk 4
Blk 5
Blk 1
Blk 7
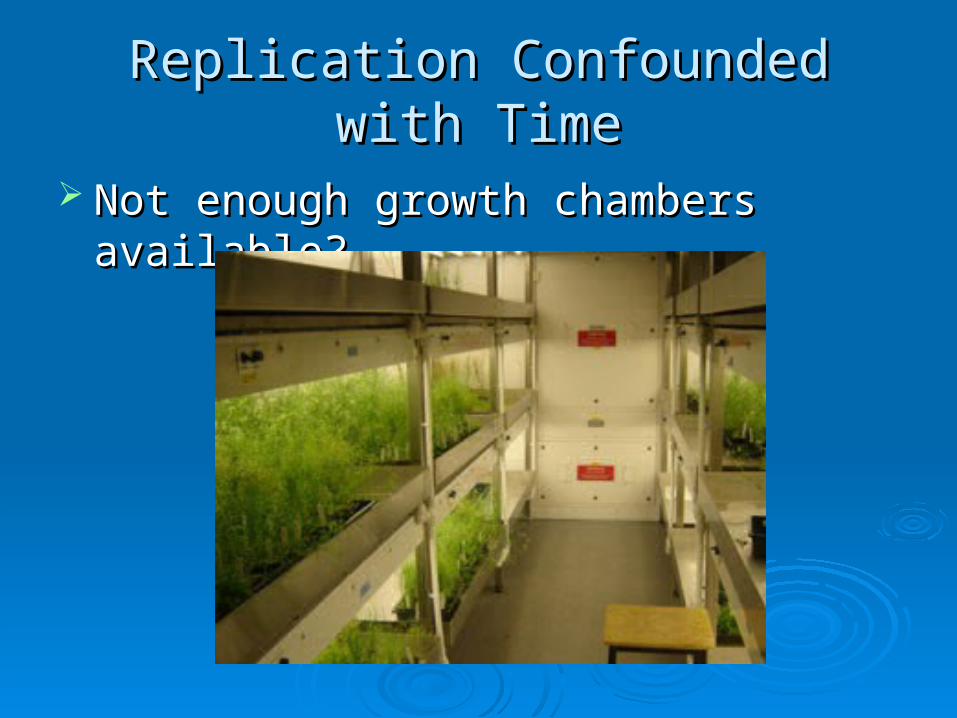
Replication Confounded with TimeReplication Confounded with Time
Not enough growth chambers available?Not enough growth chambers available?
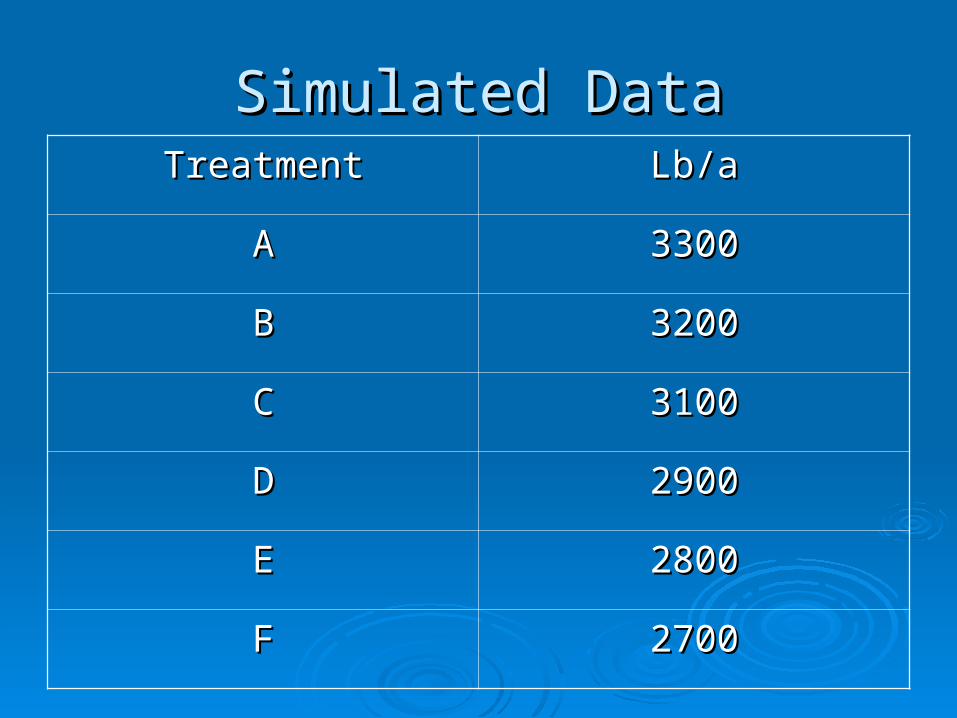
Simulated DataSimulated DataTreatmentTreatment Lb/aLb/a
AA 33003300
BB 32003200
CC 31003100
DD 29002900
EE 28002800
FF 27002700
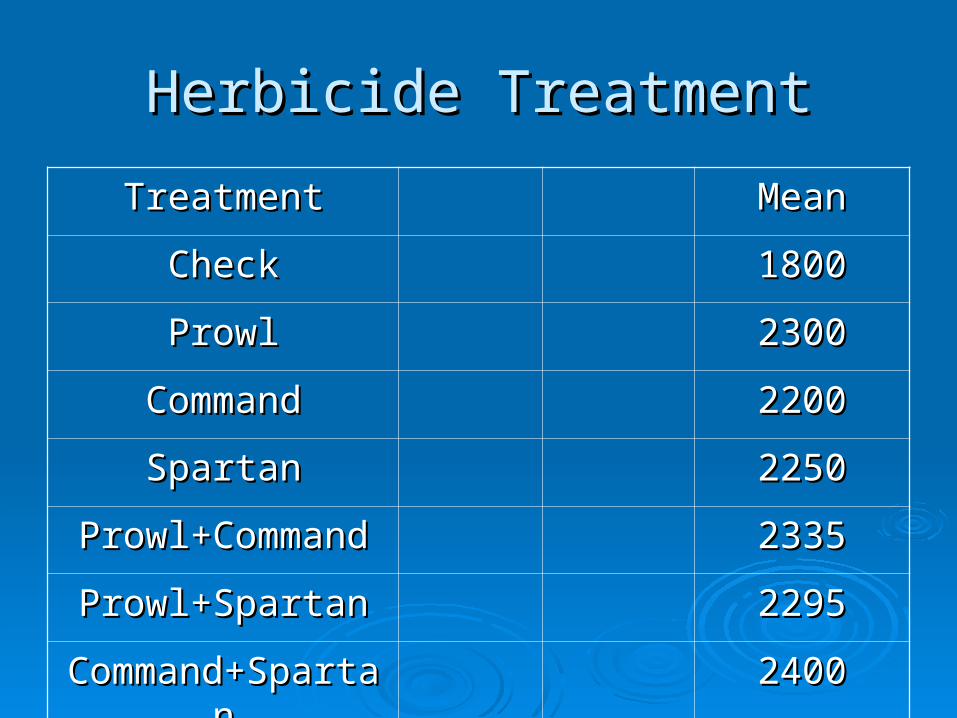
Herbicide TreatmentHerbicide Treatment
TreatmentTreatment MeanMean
CheckCheck 18001800
ProwlProwl 23002300
CommandCommand 22002200
SpartanSpartan 22502250
Prowl+CommandProwl+Command 23352335
Prowl+SpartanProwl+Spartan 22952295
Command+SpartanCommand+Spartan 24002400
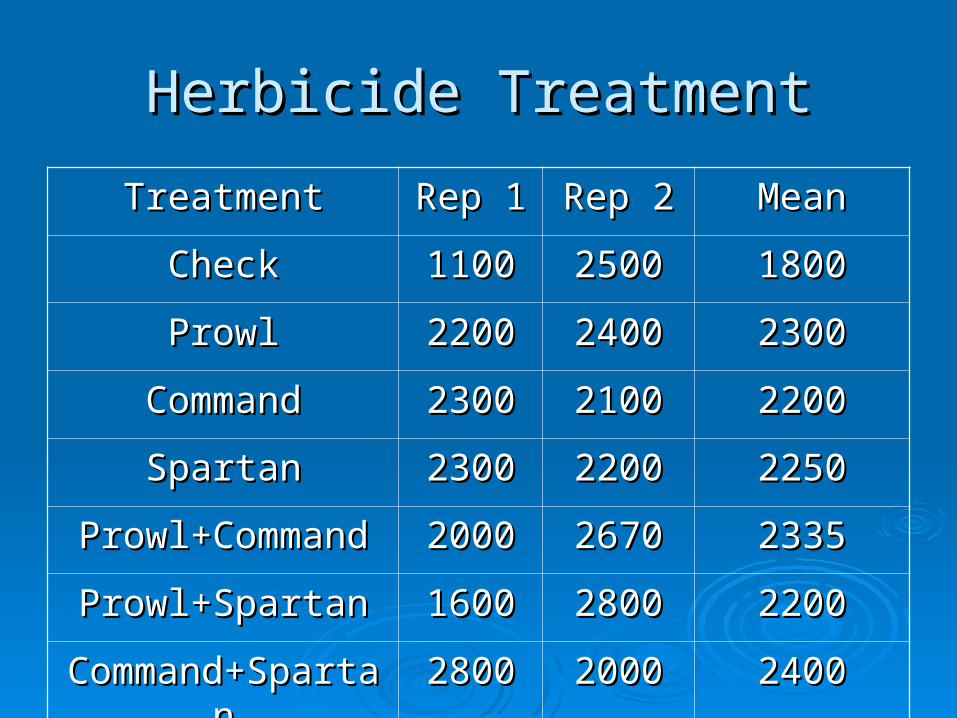
Herbicide TreatmentHerbicide Treatment
TreatmentTreatment Rep 1Rep 1 Rep 2Rep 2 MeanMean
CheckCheck 11001100 25002500 18001800
ProwlProwl 22002200 24002400 23002300
CommandCommand 23002300 21002100 22002200
SpartanSpartan 23002300 22002200 22502250
Prowl+CommandProwl+Command 20002000 26702670 23352335
Prowl+SpartanProwl+Spartan 16001600 28002800 22002200
Command+SpartanCommand+Spartan 28002800 20002000 24002400
The Completely Randomized Design
The CRD is the simplest of all designs. Replications of treatments are assigned
completely at random to independent experimental subjects.
Adjacent subjects could potentially have the same treatment.
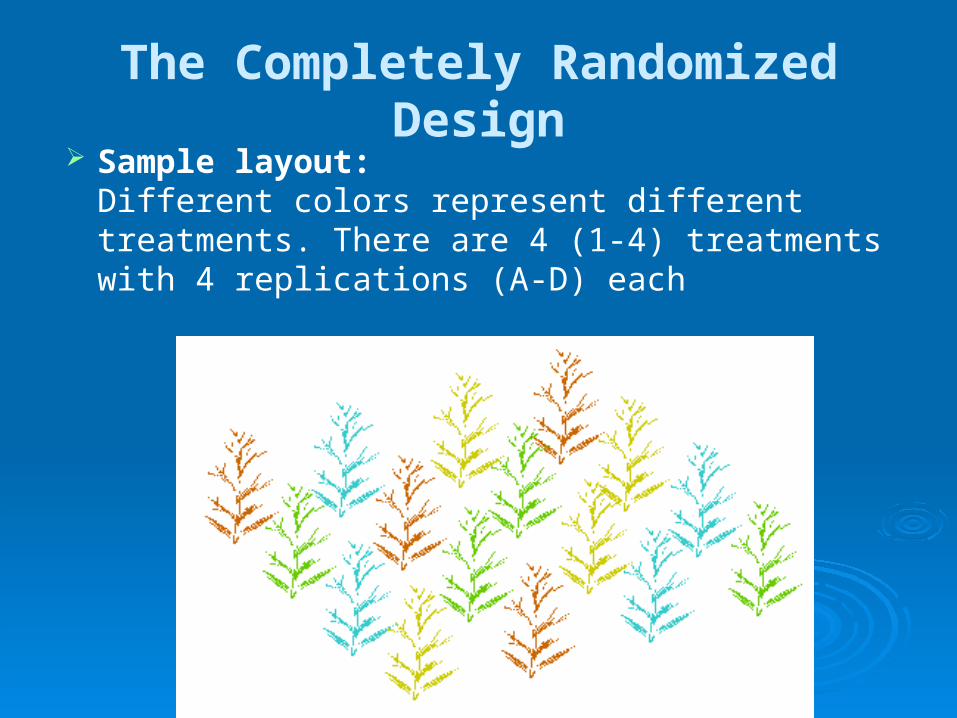
The Completely Randomized Design Sample layout:
Different colors represent different treatments. There are 4 (1-4) treatments with 4 replications (A-D) each
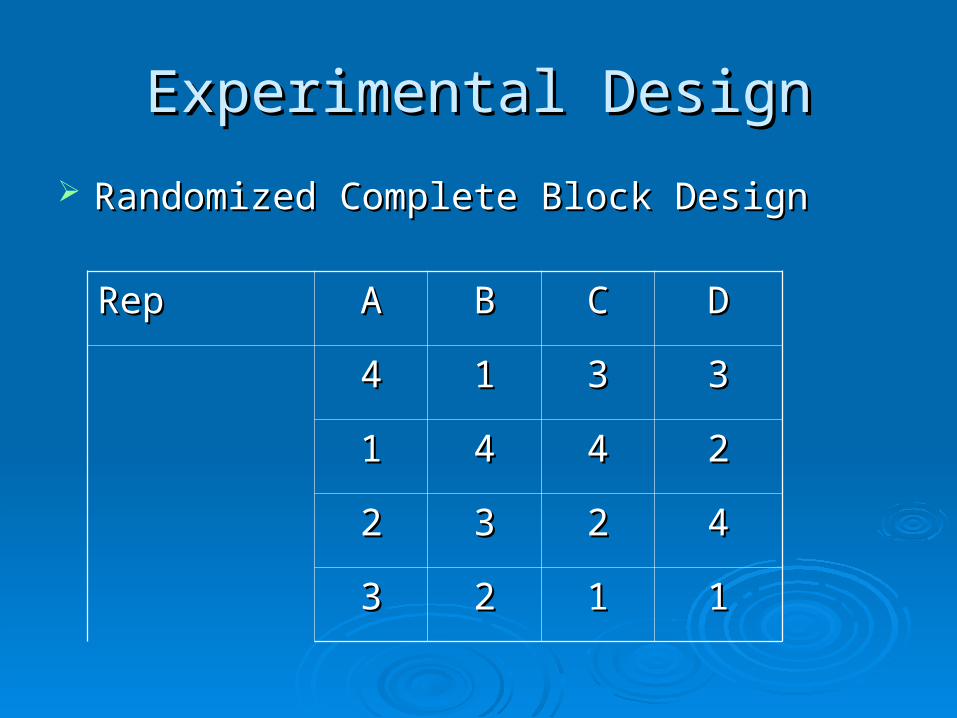
Experimental DesignExperimental Design
Randomized Complete Block DesignRandomized Complete Block Design
RepRep AA BB CC DD
44 11 33 33
11 44 44 22
22 33 22 44
33 22 11 11
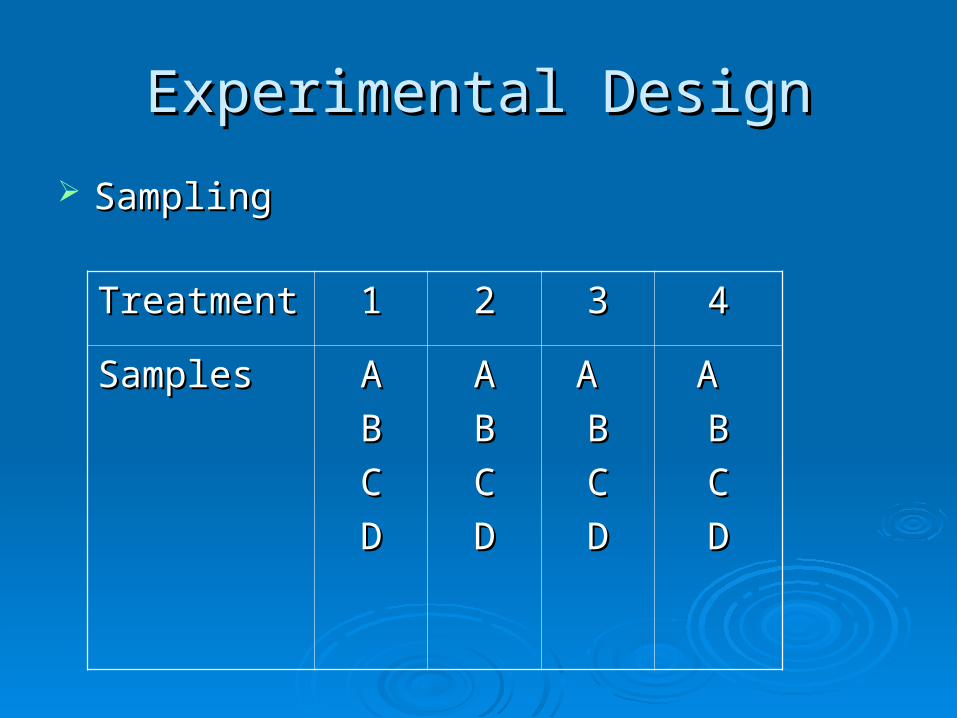
Experimental DesignExperimental Design
SamplingSampling
TreatmentTreatment 11 22 33 44
SamplesSamples AA
BB
CC
DD
AA
BB
CC
DD
A A
BB
CC
DD
A A
BB
CC
DD
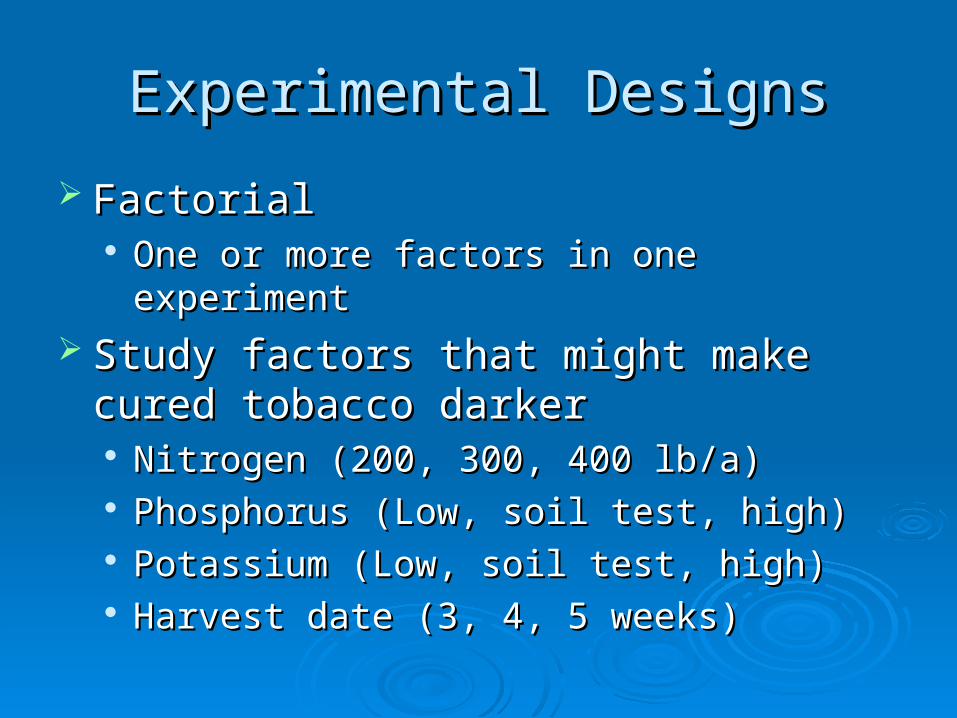
Experimental DesignsExperimental Designs
FactorialFactorial One or more factors in one experimentOne or more factors in one experiment
Study factors that might make cured Study factors that might make cured tobacco darkertobacco darker Nitrogen (200, 300, 400 lb/a)Nitrogen (200, 300, 400 lb/a) Phosphorus (Low, soil test, high)Phosphorus (Low, soil test, high) Potassium (Low, soil test, high)Potassium (Low, soil test, high) Harvest date (3, 4, 5 weeks)Harvest date (3, 4, 5 weeks)
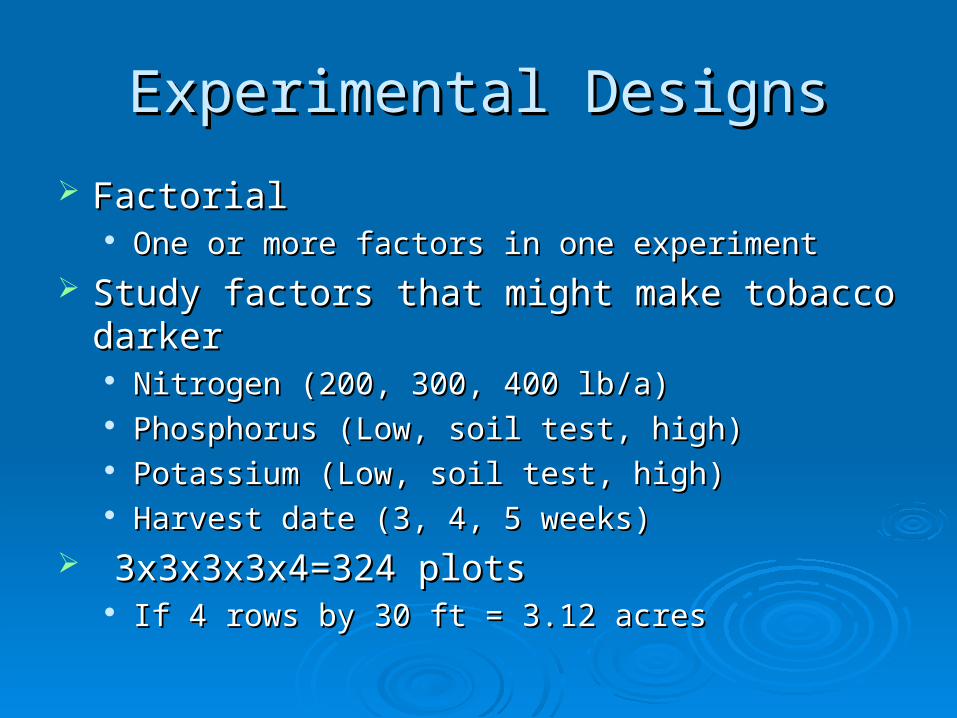
Experimental DesignsExperimental Designs
FactorialFactorial One or more factors in one experimentOne or more factors in one experiment
Study factors that might make tobacco darkerStudy factors that might make tobacco darker Nitrogen (200, 300, 400 lb/a)Nitrogen (200, 300, 400 lb/a) Phosphorus (Low, soil test, high)Phosphorus (Low, soil test, high) Potassium (Low, soil test, high)Potassium (Low, soil test, high) Harvest date (3, 4, 5 weeks)Harvest date (3, 4, 5 weeks)
3x3x3x3x4=324 plots 3x3x3x3x4=324 plots If 4 rows by 30 ft = 3.12 acresIf 4 rows by 30 ft = 3.12 acres
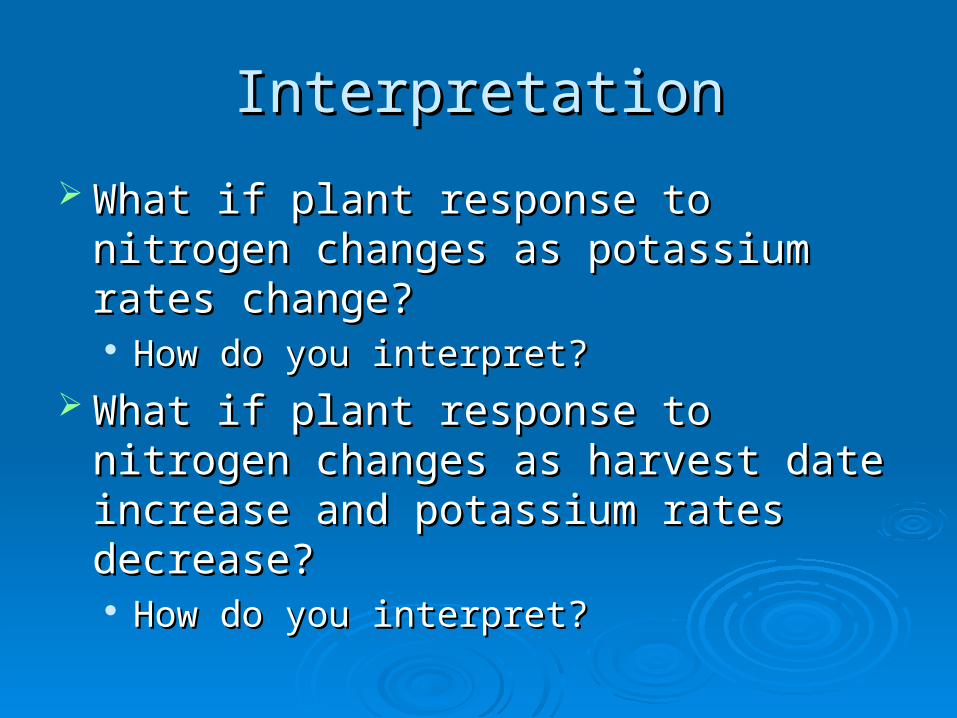
InterpretationInterpretation
What if plant response to nitrogen What if plant response to nitrogen changes as potassium rates change?changes as potassium rates change? How do you interpret?How do you interpret?
What if plant response to nitrogen What if plant response to nitrogen changes as harvest date increase and changes as harvest date increase and potassium rates decrease?potassium rates decrease? How do you interpret?How do you interpret?
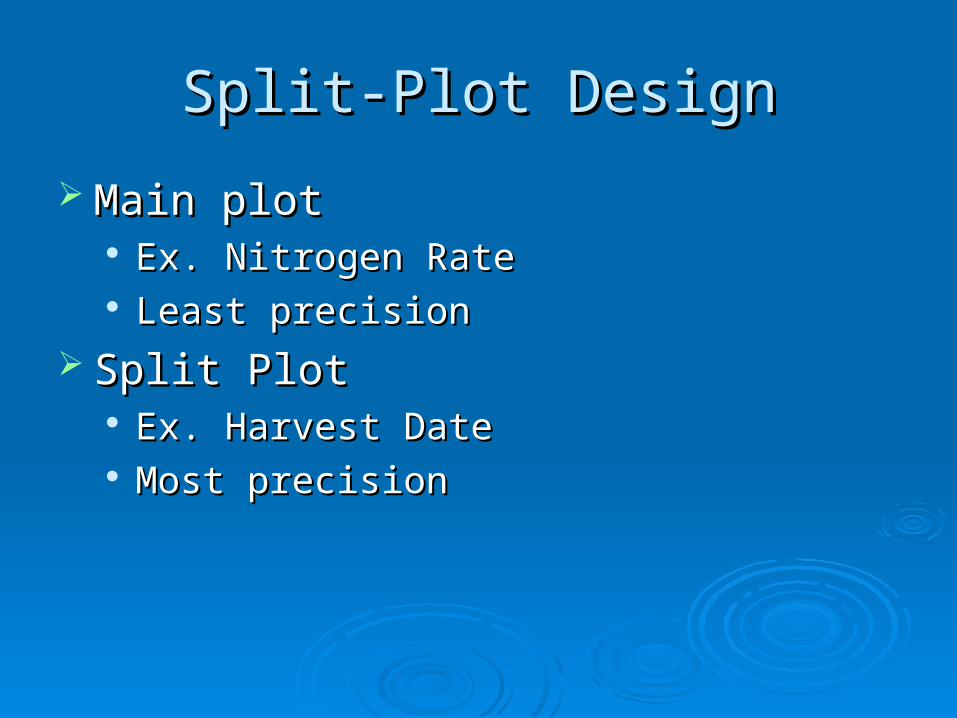
Split-Plot DesignSplit-Plot Design
Main plotMain plot Ex. Nitrogen RateEx. Nitrogen Rate Least precisionLeast precision
Split PlotSplit Plot Ex. Harvest DateEx. Harvest Date Most precisionMost precision
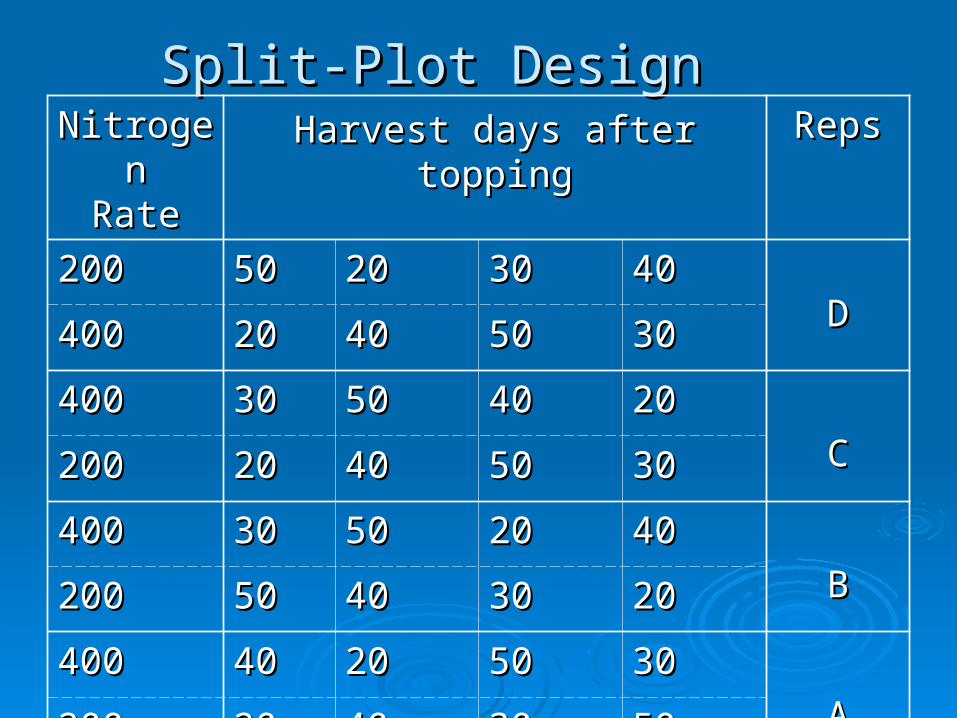
Split-Plot DesignSplit-Plot DesignNitrogenNitrogen
RateRateHarvest days after toppingHarvest days after topping RepsReps
200200 5050 2020 3030 4040 DD
400400 2020 4040 5050 3030
400400 3030 5050 4040 2020
CC200200 2020 4040 5050 3030
400400 3030 5050 2020 4040
BB200200 5050 4040 3030 2020
400400 4040 2020 5050 3030
AA200200 2020 4040 3030 5050
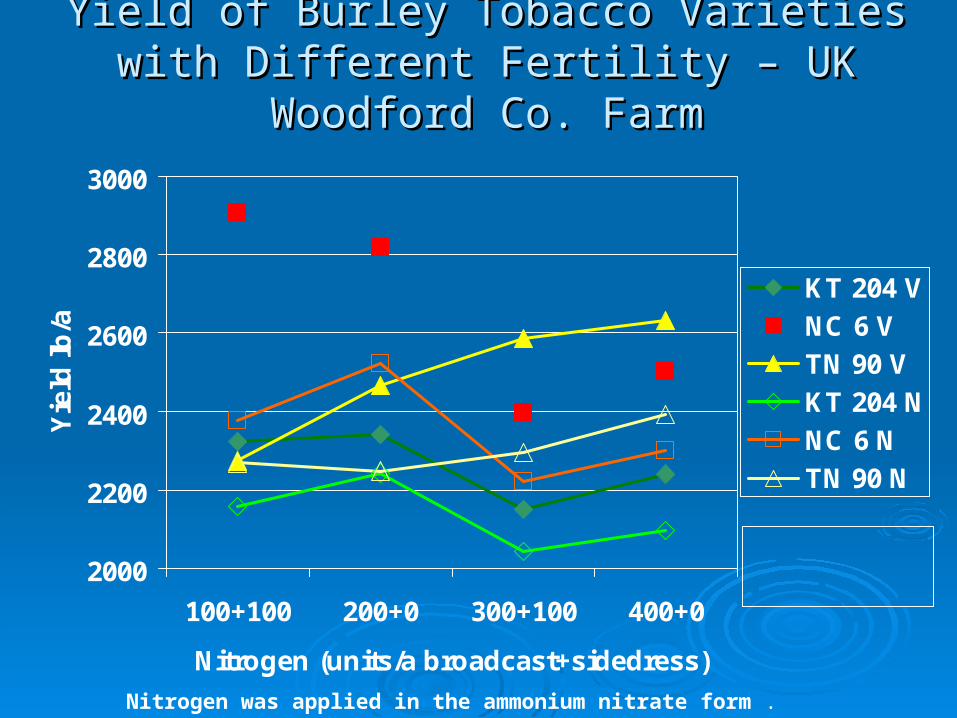
Yield of Burley Tobacco Varieties with Yield of Burley Tobacco Varieties with Different Fertility – UK Woodford Co. FarmDifferent Fertility – UK Woodford Co. Farm
2000
2200
2400
2600
2800
3000
100+100 200+0 300+100 400+0
Nitrogen (units/a broadcast+sidedress)
Yie
ld l
b/a
KT 204 V
NC 6 V
TN 90 V
KT 204 N
NC 6 N
TN 90 N
V = VentedN = Nonvented
Nitrogen was applied in the ammonium nitrate form .
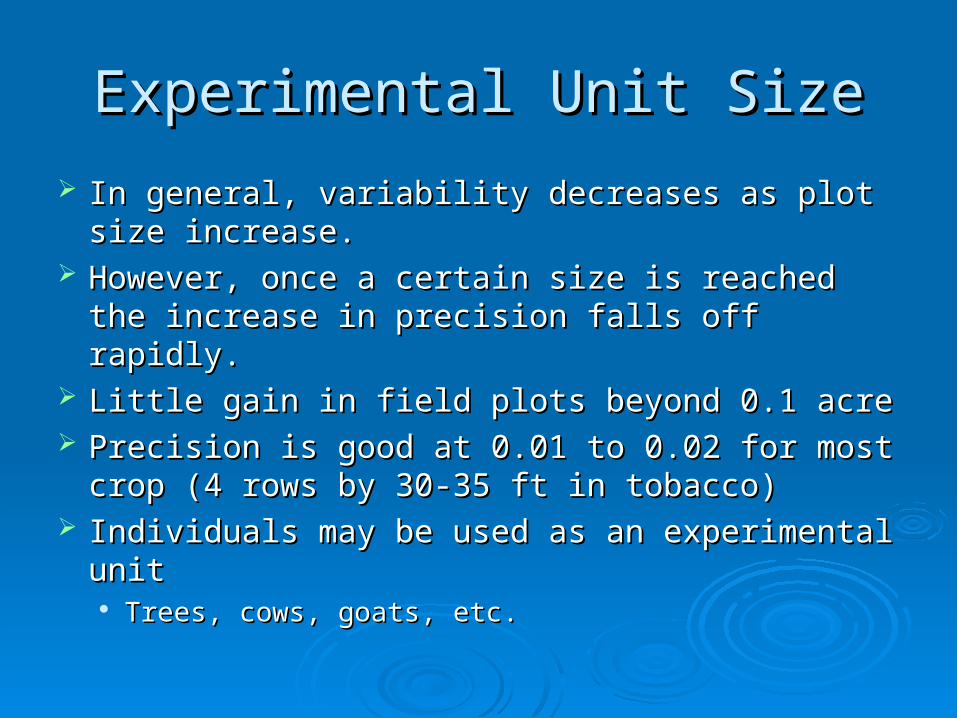
Experimental Unit SizeExperimental Unit Size
In general, variability decreases as plot size In general, variability decreases as plot size increase.increase.
However, once a certain size is reached the However, once a certain size is reached the increase in precision falls off rapidly.increase in precision falls off rapidly.
Little gain in field plots beyond 0.1 acreLittle gain in field plots beyond 0.1 acre Precision is good at 0.01 to 0.02 for most crop (4 Precision is good at 0.01 to 0.02 for most crop (4
rows by 30-35 ft in tobacco)rows by 30-35 ft in tobacco) Individuals may be used as an experimental unitIndividuals may be used as an experimental unit
Trees, cows, goats, etc.Trees, cows, goats, etc.
Experimental Unit SizeExperimental Unit Size
CovarianceCovariance Removing variability of some independent Removing variability of some independent
variablevariable• Difference in beginning weight of cows in testDifference in beginning weight of cows in test• Differences in plant standsDifferences in plant stands