the scientific method formulation of an h ypothesis p lanning an experiment to objectively test the...
TRANSCRIPT
The Scientific Method
Formulation of an H ypothesis
P lanning an experiment to objectively test the hypothesis
Careful observation and collection of D ata from the experiment
I nterpretation of the experimental results
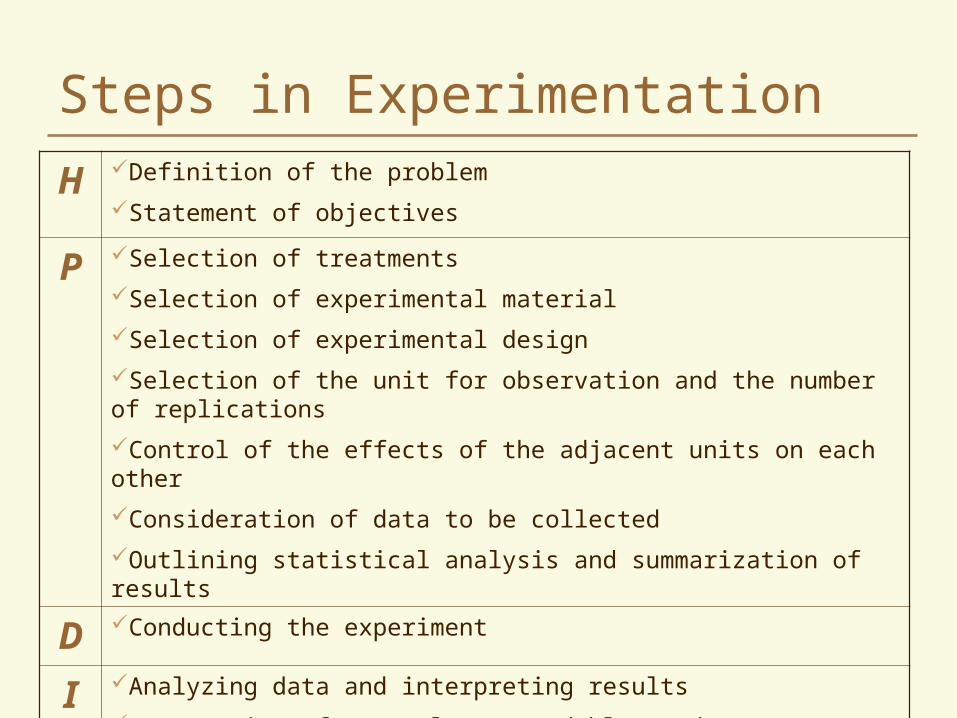
Steps in Experimentation
H Definition of the problem
Statement of objectives
P Selection of treatments
Selection of experimental material
Selection of experimental design
Selection of the unit for observation and the number of replications
Control of the effects of the adjacent units on each other
Consideration of data to be collected
Outlining statistical analysis and summarization of results
D Conducting the experiment
I Analyzing data and interpreting results
Preparation of a complete, readable, and correct report
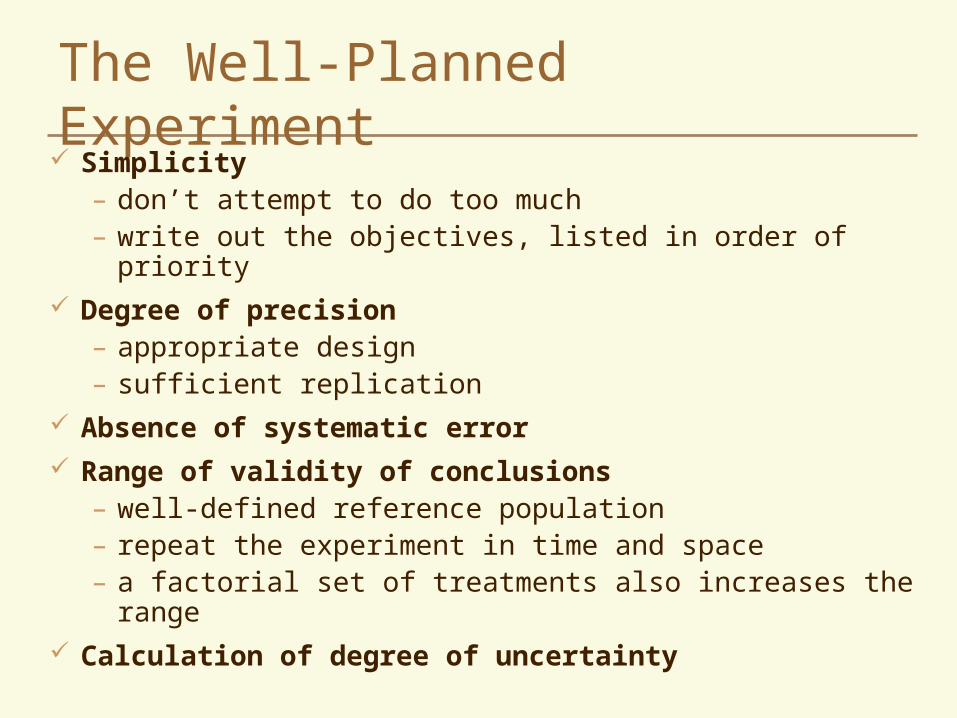
The Well-Planned Experiment Simplicity
– don’t attempt to do too much– write out the objectives, listed in order of priority
Degree of precision– appropriate design– sufficient replication
Absence of systematic error
Range of validity of conclusions– well-defined reference population– repeat the experiment in time and space– a factorial set of treatments also increases the range
Calculation of degree of uncertainty
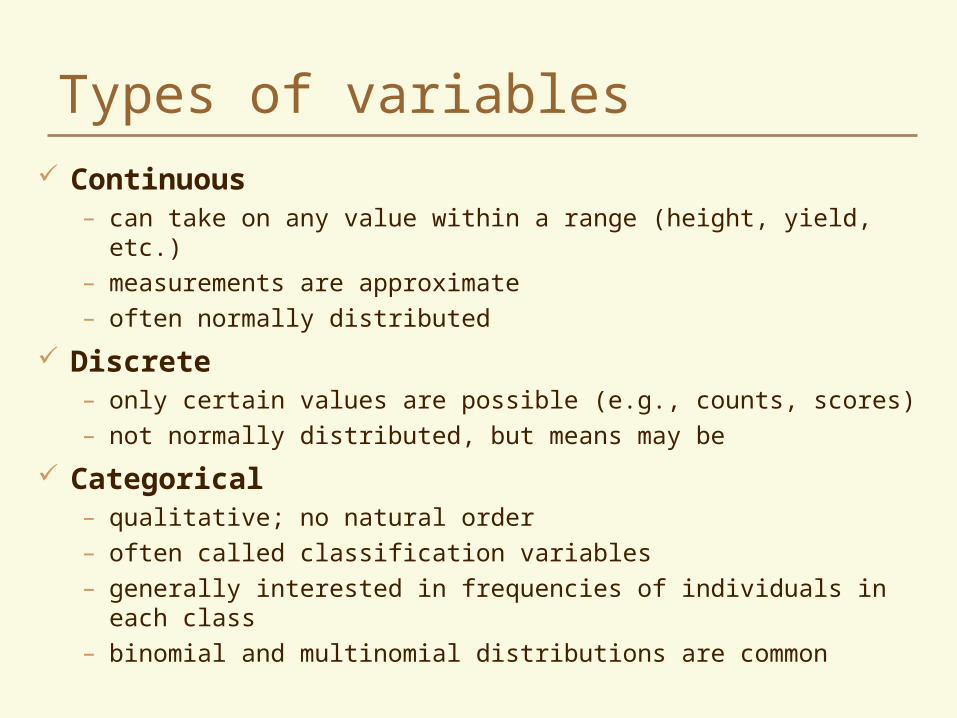
Types of variables Continuous
– can take on any value within a range (height, yield, etc.)– measurements are approximate– often normally distributed
Discrete– only certain values are possible (e.g., counts, scores)– not normally distributed, but means may be
Categorical– qualitative; no natural order– often called classification variables– generally interested in frequencies of individuals in each class– binomial and multinomial distributions are common
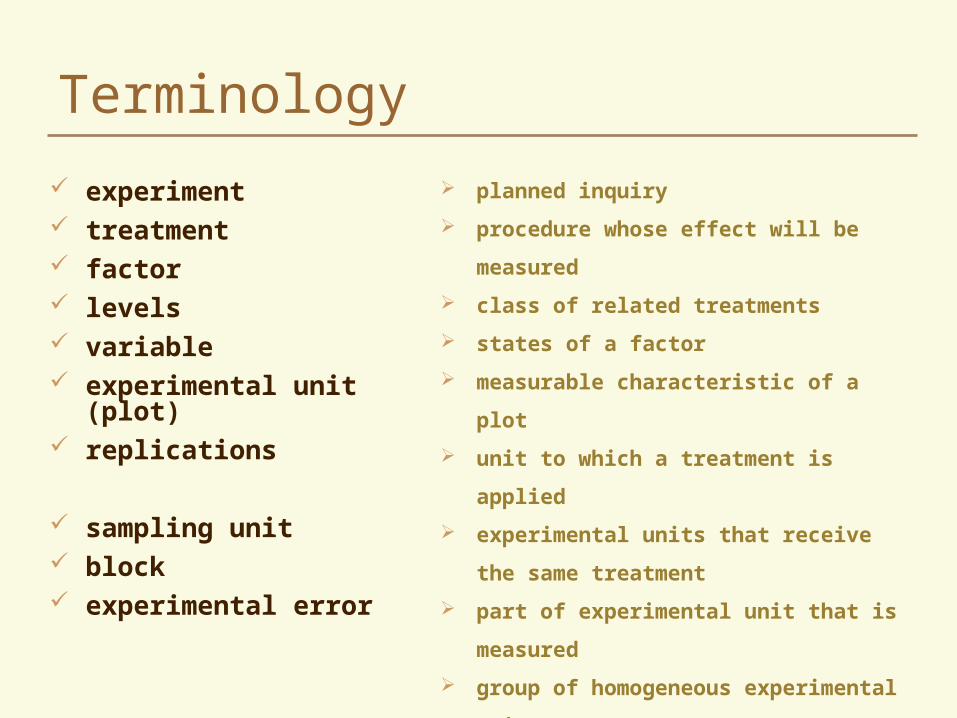
Terminology
experiment treatment factor levels variable experimental unit (plot) replications
sampling unit block experimental error
planned inquiry
procedure whose effect will be measured
class of related treatments
states of a factor
measurable characteristic of a plot
unit to which a treatment is applied
experimental units that receive the same
treatment
part of experimental unit that is measured
group of homogeneous experimental units
variation among experimental units that
are treated alike
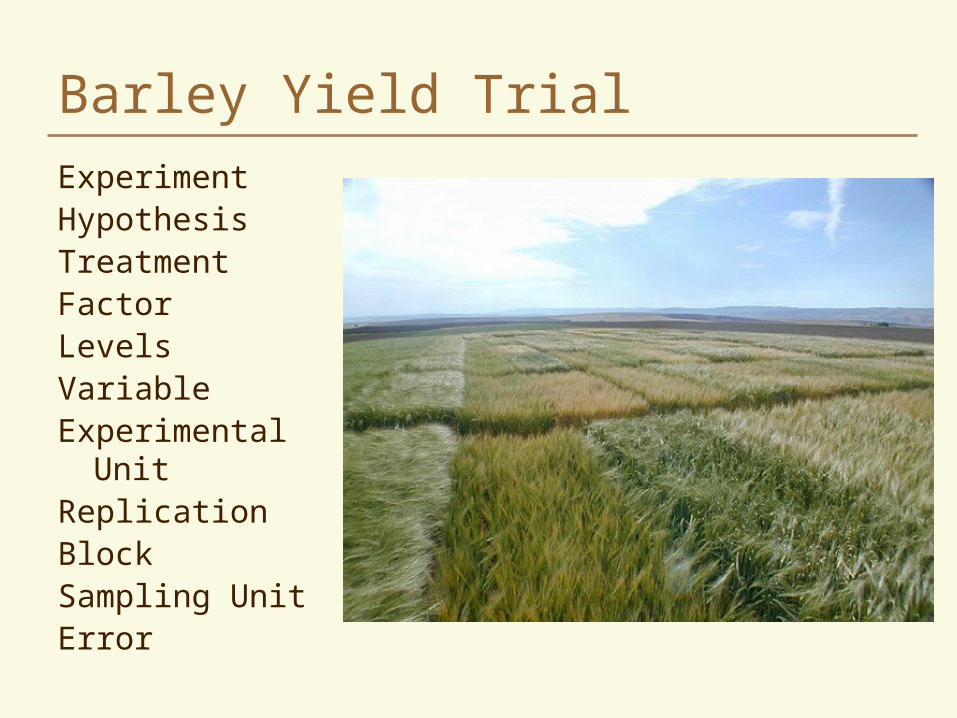
Barley Yield Trial
ExperimentHypothesisTreatmentFactorLevelsVariableExperimental UnitReplicationBlockSampling UnitError
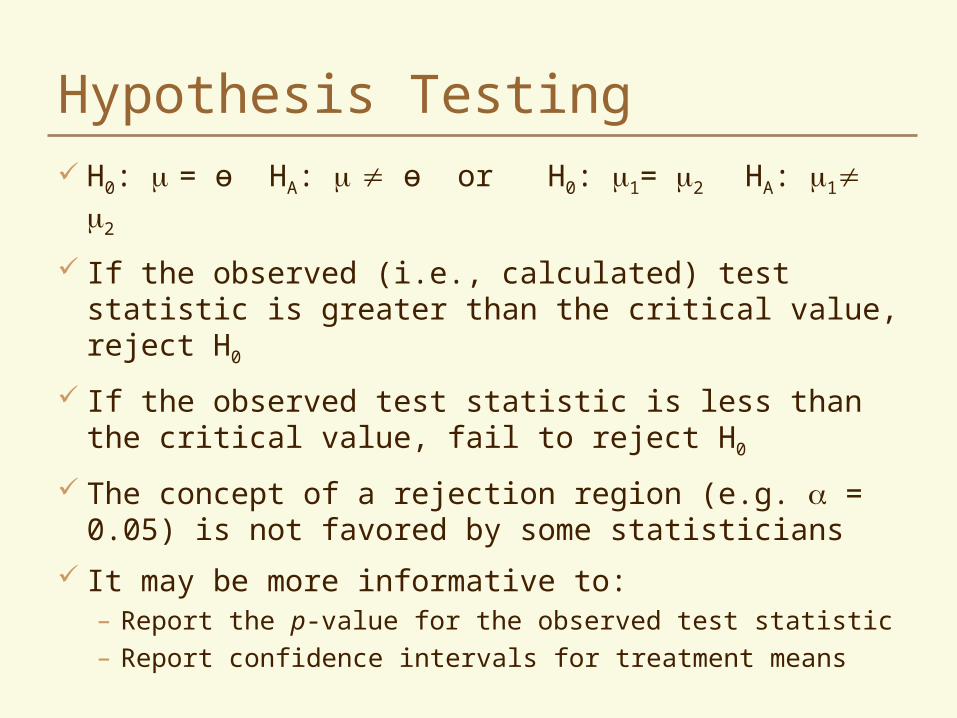
Hypothesis Testing
H0: = ɵ HA: ɵ or H0: 1= 2 HA: 1 2
If the observed (i.e., calculated) test statistic is greater than the critical value, reject H0
If the observed test statistic is less than the critical value, fail to reject H0
The concept of a rejection region (e.g. = 0.05) is not favored by some statisticians
It may be more informative to:– Report the p-value for the observed test statistic– Report confidence intervals for treatment means
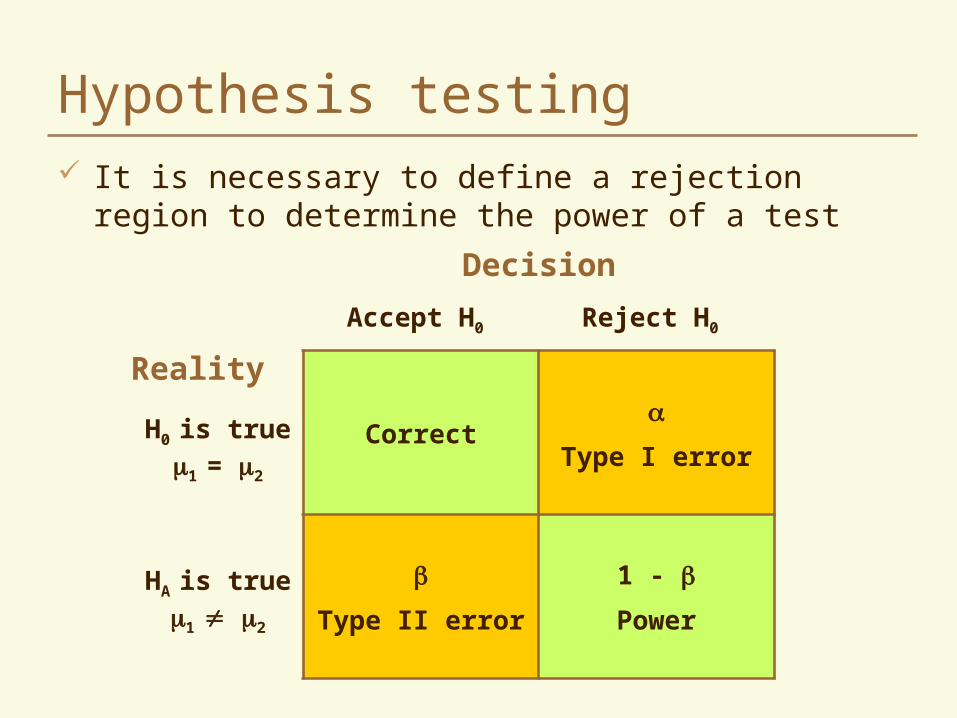
Hypothesis testing It is necessary to define a rejection region to determine
the power of a test
Correct
Type I error
Type II error
1 -
Power
Decision
Accept H0 Reject H0
Reality
H0 is true1 = 2
HA is true1 2
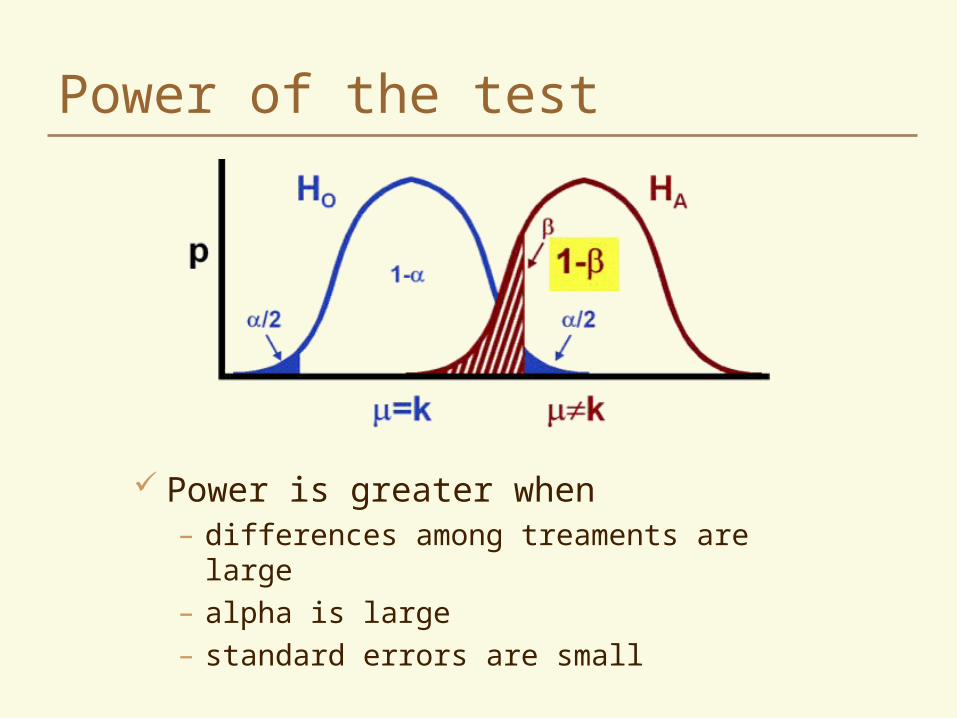
Power of the test
Power is greater when– differences among treaments are large– alpha is large– standard errors are small
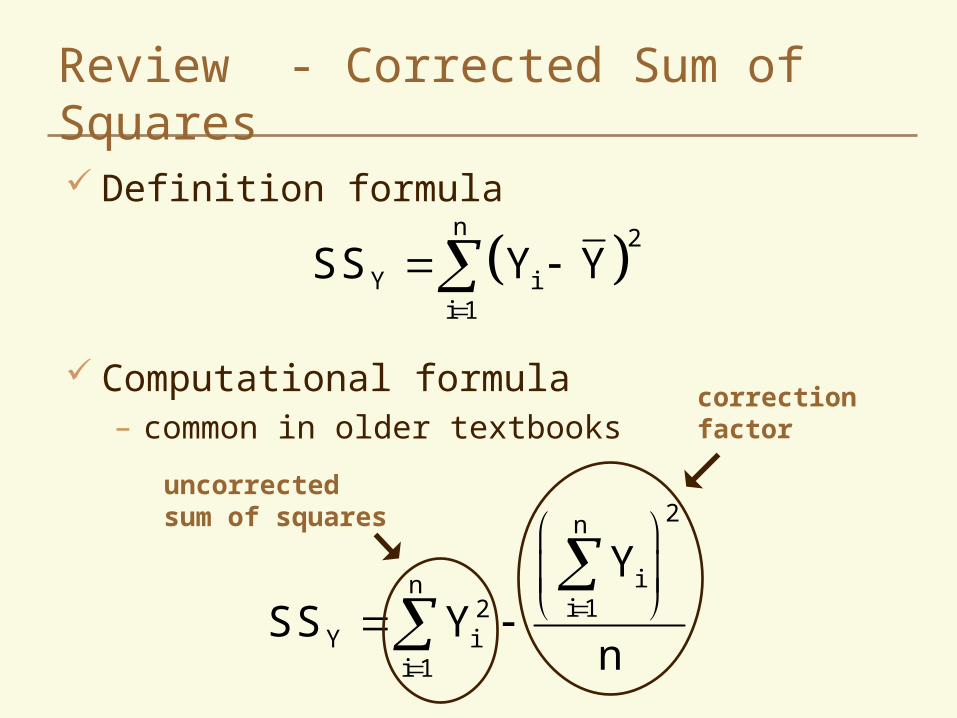
Review - Corrected Sum of Squares
Definition formula
Computational formula– common in older textbooks
n 2
Y ii 1
SS Y Y
2n
ini 12
Y ii 1
Y
SS Yn
correctionfactor
uncorrectedsum of squares
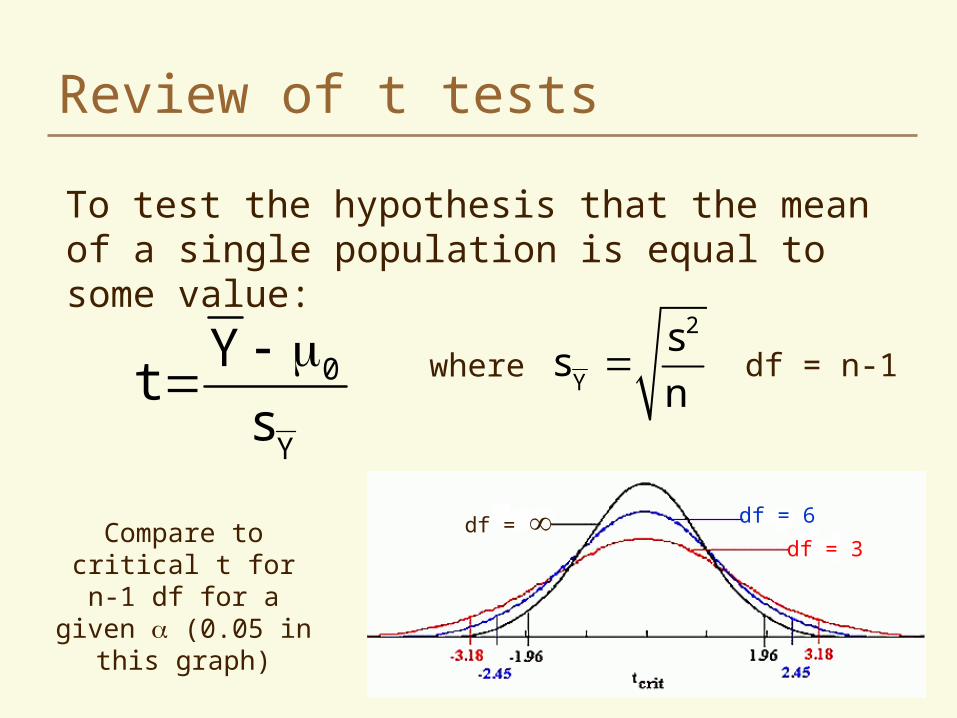
Review of t tests
To test the hypothesis that the mean of a single population is equal to some value:
0
Y
Yt
s
2
Y
ss
nwhere df = n-1
df = 6
df = 3df = Compare to critical t
for n-1 df for a given (0.05 in this graph)
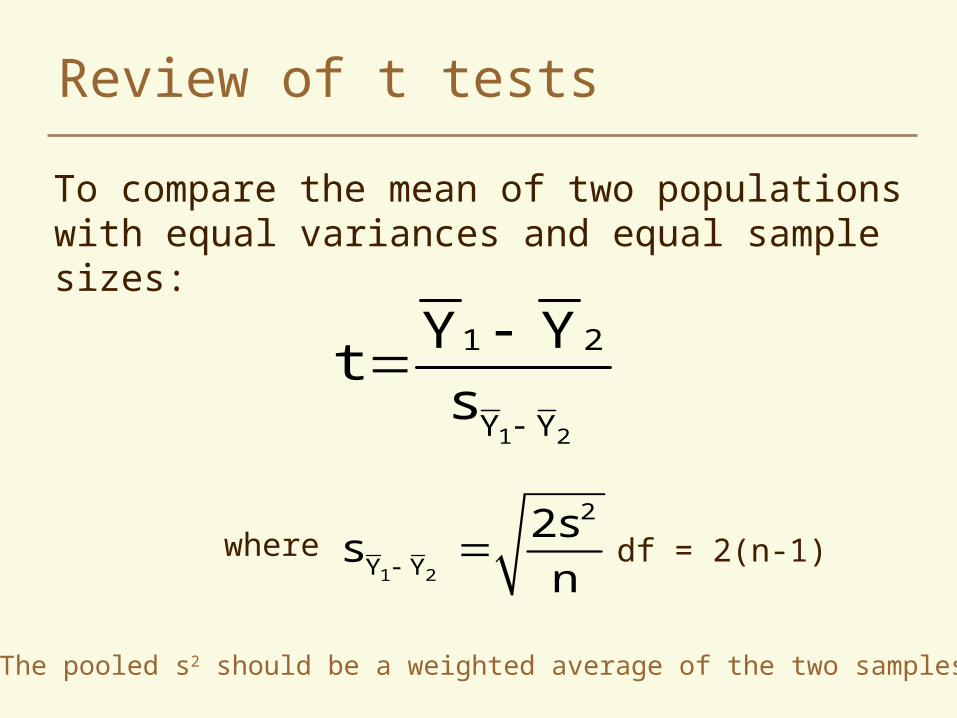
Review of t tests
To compare the mean of two populations with equal variances and equal sample sizes:
where
1 2
1 2
Y Y
Y Yt
s
1 2
2
Y Y
2ss
n df = 2(n-1)
The pooled s2 should be a weighted average of the two samples
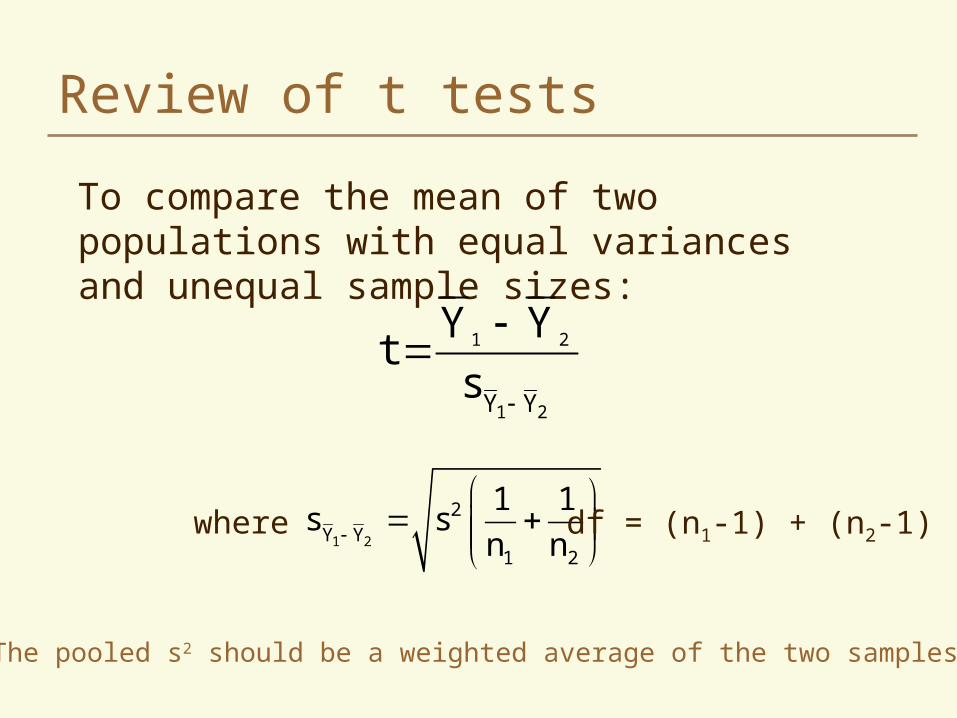
Review of t tests
To compare the mean of two populations with equal variances and unequal sample sizes:
where
1 2
1 2Y Y
Y Yt
s
1 2
2Y Y
1 2
1 1s s
n n
df = (n1-1) + (n2-1)
The pooled s2 should be a weighted average of the two samples
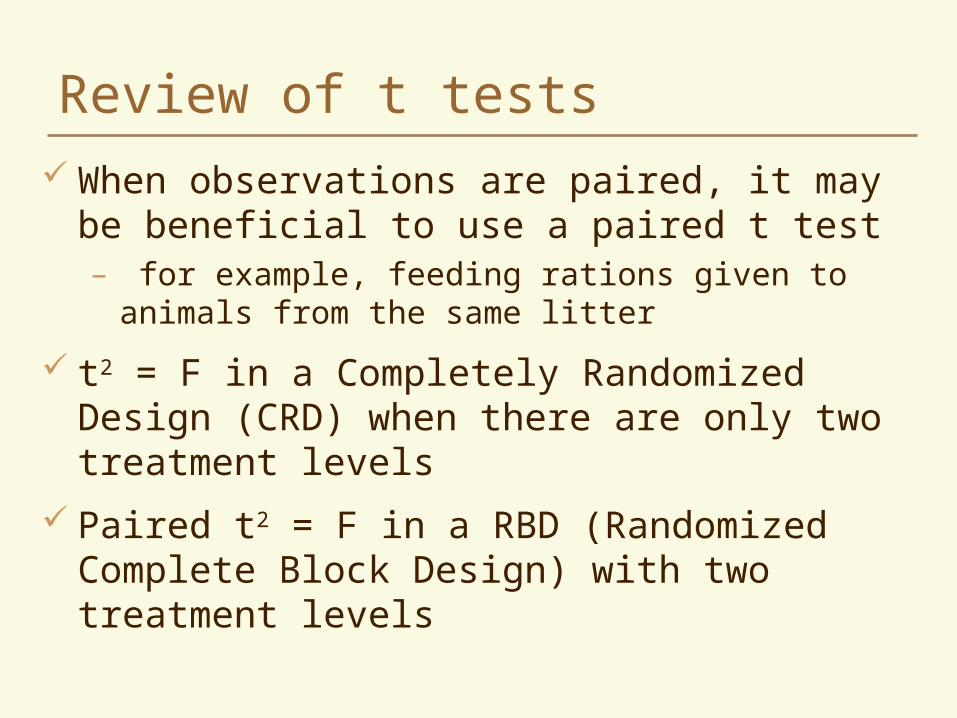
Review of t tests When observations are paired, it may be beneficial
to use a paired t test– for example, feeding rations given to animals from the
same litter
t2 = F in a Completely Randomized Design (CRD) when there are only two treatment levels
Paired t2 = F in a RBD (Randomized Complete Block Design) with two treatment levels
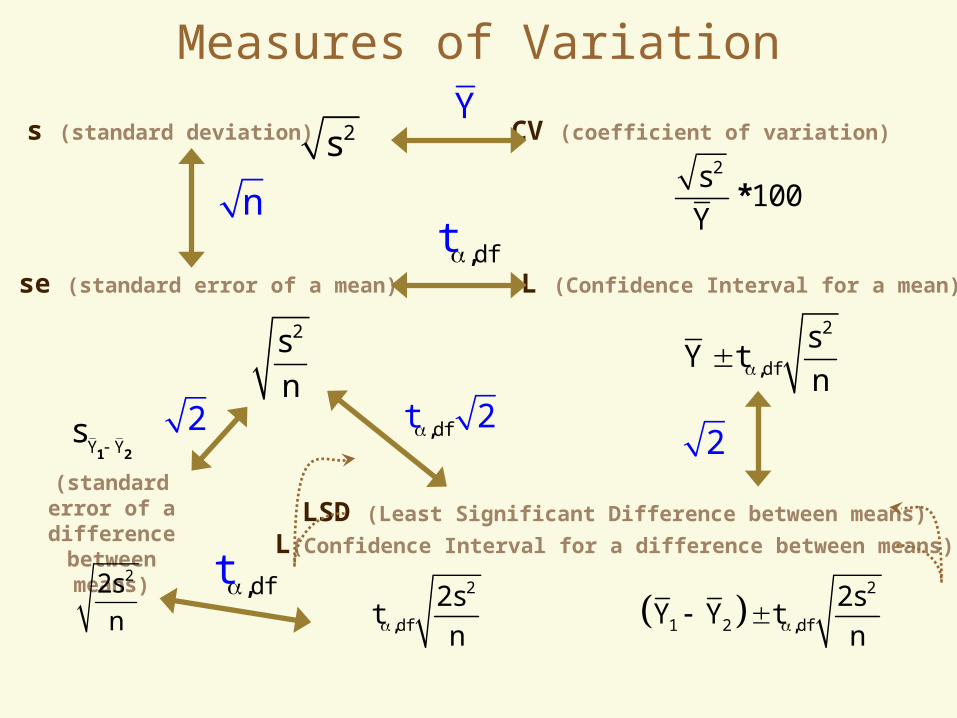
Measures of Variation
2s
n
2s100
Y*
2
df
sY t
n ,
s (standard deviation) CV (coefficient of variation)
se (standard error of a mean)
LSD (Least Significant Difference between means)
L(Confidence Interval for a difference between means)
L (Confidence Interval for a mean)
2s
2
df
2st
n,
n
Y
dft,
dft 2, 2
2
1 2 df
2sY Y t
n ,
(standard error of a difference
between means)
Y Ys 1 2
22s
n
2
dft,