concept paper n° 5 - europa
TRANSCRIPT

Concept Paper N° 5Tools and Methods Series
Implications for EC Programming
January 2017
International Cooperation and Development
ISSN 1830-8201
Indicatorsto measureSocial ProtectionPerformance

European CommissionDirectorate-General for Development and CooperationDEVCO Unit B3 (Migration, Employment, Inequalities) Rue de la Loi 41B-1049 [email protected]

Indicators to measure social protection performance Implications for EC programming
Directorate-General for International Cooperation and Development
European Commission
January 2017
Concept Paper N° 5
T o o l s a n d M e t h o d s S e r i e s
2 INDICATORS TO MEASURE SOCIAL PROTECTION PERFORMANCE: IMPLICATIONS FOR EC PROGRAMMING
Europe Direct is a service to help you find answers to your questions about the European Union.
Freephone number*: 00 800 6 7 8 9 10 11
(*) Certain mobile telephone contractors do not allow access to 00 800 numbers or these calls may be billed.
Print ISBN 978-92-79-64610-2 doi: 10.2841/606804 MN-BC-16-001-EN-C
PDF ISBN 978-92-79-64611-9 doi: 10.2841/158380 MN-BC-16-001-EN-N
More information on the European Union is available on the Internet (http://europa.eu).
Luxembourg: Publications Office of the European Union, 2017
© European Union, 2017Reproduction is authorised provided the source is acknowledged.
Printed in LuxembourgPRINTED ON ELEMENTAL CHLORINE-FREE BLEACHED PAPER (ECF)

3ACKNOWLEDGEMENTS
ACKNOWLEDGEMENTSThis document has been prepared by Anna McCord, Rebecca Holmes and Luke Harman in the frame of an EC service contract executed by the Overseas Development Institute (ODI).
Conceptual guidance and review has been provided by Juergen Hohmann and Alicia Martin-Diaz (Unit B3 of DG DEVCO, European Commission) and further comments were given by Dorota Panczyk, Mehdi Hussain, Michael John Ellis and Katarina Jaksik from other EC services, as well as by Nicholas Freeland. Armando Barrientos peer-reviewed the paper and provided valuable suggestions.
Tom Slaymaker (UNICEF), Jeronim Capaldo (ILO), Neil Jackson and Matthew Greenslade (DFID) acted as additional key informants.
Finally, special thanks to Roo Griffiths for editing, Linda Ellis for proofreading, Fiona Lamont and Calvin Laing for project support, and Carlos Corao for graphic design.
The European Commission has granted ODI the authorization to re-publish this document as an ODI-branded working paper.


5TABLE OF CONTENTS
TABLE OF CONTENTSACKNOWLEDGEMENTS 3TABLE OF CONTENTS 5EXECUTIVE SUMMARY 6
Key findings 6
Policy implications 7
ACRONYMS 91. Introduction and objectives 132. Conceptual overview and analytical framework 15
2.1. Social protection: Concepts and definitions 15
2.2. What is performance measurement and why is it important? 16
2.3. Analytical framework 23
3. Sustainable Development Goals overview 25
3.1. Overview of SDGs process 25
3.2. Overview of SDG indicators directly relating to social protection 27
3.3. Discussion of the indicators 32
3.4. Overview of other SDG indictors relevant to social protection 33
3.5. Discussion of SDG indicators as they relate to social protection 37
3.6. Appraisal of the SDGs using the analytical framework 38
3.7. Assessment of indicator comparability 41
4. Overview of key indicators currently in use by major development agencies 43
4.1. Overview of social protection indicators used by key institutions 44
4.2. Indicators measuring social protection in MICs/LICs 54
4.3. Analysis of social protection indicators 58
5. Conclusions 636. Guidance for the EC in indicator selection 67
6.1. The EU Development Cooperation Results Framework and the SDGs 67
6.2. Improving the EU RF in relation to social protection 69
6.3. Recommendations for the programme level 70
6.4. Recommendations for EC Indicator Programming 75
6.5. Conclusion 77
REFERENCES 79DATASETS 83

6 INDICATORS TO MEASURE SOCIAL PROTECTION PERFORMANCE: IMPLICATIONS FOR EC PROGRAMMING
EXECUTIVE SUMMARYThis paper provides a critical overview of social protection indicators in the Sustainable Development Goal (SDG) context to support the European Commission’s (EC’s) decision-making on social protection indicators and to support decisions on how the EC can contribute to the global indicator discourse within its own institutional mandate and institutional prio-rities. It is not prescriptive in terms of the indicators that should be adopted, but rather, given the complexity and diver-sity of the factors that drive indicator choice, it provides an overview of the current process and development of social protection indicators as they relate to the SDGs, and discusses a range of indicators adopted by the main actors wor-king on social protection.
This paper has three main objectives:
― to provide a critical overview and commentary on the development of SDG indicators and how they relate to social protection,
― to provide an overview of key social protection indicators used by multilateral and bilateral agencies to assess current coverage and gaps in measuring social protection at an international level and,
― to provide guidance on developing social protection indicators for use in EC programming, enhancing harmoni-sation between EC and SDG indicators, and promoting consistency/compatibility with indicators currently in use among key multi- and bilateral agencies.
First the paper provides a conceptual overview of social protection and performance management, discussing the key steps in the development of indicators. It then presents an analytical framework to appraise social protection indicators, which is applied in the subsequent sections of the paper to analyse the SDG indicators relating to social protection and other agencies’ social protection indicators and databases, providing a critical perspective on the SDG indicators. Next the paper sets out the key challenges underlying the development of a coherent, harmonised and comparable set of social protection indicators at the global level, and in the final section it provides guidance for the future development of social protection indicators for EC programming.
Key findings
Overall, we find that existing indicators in the social protection sector provide a fair, but not fully adequate, overview of provision and performance of social protection. Across agencies working in the social protection sector, indicators are characterised by data gaps, methodological challenges and conceptual inconsistencies. Combining insights from across agencies would allow the indicators to inform many aspects of our understanding of social protection outcomes and impacts, but no single indicator framework currently forms a consistent or complete response to the question of social protection performance.
In particular, our findings point to three main challenges in the current social protection indicator discourse.
First, the types of indicators currently used focus heavily on measuring quantity at the input and output level. This is at the expense of results-oriented indicators which would capture social protection outcomes and impacts, and mea-sure the quality of social protection. This finding applies to the social protection SDG indicators as well as to the ma-jority of agencies’ social protection indicators in low income countries. While the focus on inputs and outputs, such as expenditure on social protection, benefit levels, and number of beneficiaries reached is important, without comprehen-sively measuring outcomes and impacts there remains an incomplete picture of the effects of social protection at the national and international level. Moreover, additional challenges in obtaining a comprehensive picture of social protec-tion performance include geographical and time gaps, with significant imbalances in geography and periodicity of data collection across social protection indicators.
The second key challenge relates to the availability of data in the quest for comprehensive social protection indicators. Whilst the choices of indicators are as much political as they are technical, there are challenging data limitations which affect the types of indicators chosen, and this partly explains the imbalance of indicators towards quantitative inputs and outputs. The review of agencies’ databases in section 4 clearly demonstrates the differences in data availability between high and low income countries and the extent to which data limitations hinder the selection of appropriate so-cial protection indicators in low income countries.

7EXECUTIVE SUMMARY
Third, there is limited comparability and compatibility in terms of the social protection indicators used by different agen-cies. This means agencies are not able to use each other’s data, at a country level or internationally for the analysis of performance, resulting in duplication and inefficiencies. Whilst there have been substantial efforts to collaborate, coor-dinate and share data across high income country databases – there has been less progress in low and middle income countries. Despite initiatives such the Asian Development Bank (ADB)’s Social Protection Index, and ongoing work on the World Banks’ ASPIRE database and the instruments developed by the Inter-Agency Social Protection Assessment (ISPA) Initiative, there is a long way to go before the harmonisation of agencies’ social protection indicators in low income countries becomes a reality, and the agreement of social protection indicators relating to the Sustainable Development Goals will not play a major role in resolving this situation. The challenges are both political and technical: they include the different definitions and concepts used across different agencies; the different methodologies and data collection tools used; the variation of scope and level of disaggregation of data across institutions; and the willingness to share data and harmonise data and methodologies.
Policy implications
The paper provides some general recommendations to the social protection community on harmonising and coordina-ting indicator processes, and provides more detailed recommendations to the EC in the development and selection of social protection indicators at the policy and programming level.
The creation of a core set of common indicators across agencies, which enables the different datasets and methodologies to be linked, is a key priority. This would require addressing discrepancies in definitions and approaches, such as variation in definitions of social protection and selection of datasets, and varying views on the role of data generated nationally and institutionally. However, a shared definition of core data to be collected would ensure comparability and allow for the use of data by various organisations, as well as the creation of bridges between different classifications. This would be a first step towards coordination and harmonisation between organisations on social protection statistics. Key areas where core classifications are required have been identified as expenditure, financing, coverage, benefit level and impact.
Building on existing initiatives will be important here. The diagnostic instruments developed as part of the ISPA initiative represented one possible approach to address this challenge, which would have improved interagency harmonisation if adopted systematically by agencies and governments, but there is not yet agreement on the harmonisation of agency activities, nor a methodology for integration. If adopted systematically by agencies and governments a harmonised ap-proach would facilitate closer collaboration at the country level; contribute to a ‘division of labour’ among agencies with agencies complementing shared core data with additional data gathered according to their institutional mandates, ra-ther than the duplication which characterises the current situation; and provide a baseline standard in the area of social protection statistics to be applied by organisations and in countries.
Policy and programming implications for the EC
The paper suggests there is potential for refreshing the social protection indicators in the EU Results Framework, to align them with recent institutional and political developments to improve the adequacy of the indicators. A revised set of indicators could be more aligned to the SDGs as an organising framework, as well as to World Bank and ILO initia-tives in order to promote harmonisation – with the caveat of the technical challenges that the SDG indicators face in not conforming fully to RACER criteria(1) , the gaps in measuring social protection coverage, and therefore the need for additional indicators.
However, with these caveats in mind, the EU could play an important role in supporting the SDG process, to adopt indica-tors that are consistent where the SDG indicators are considered adequate for EU monitoring purposes, and in attemp-ting to build on, rather than duplicate, existing indicators, where they are not. In this capacity, the EU can play a role in supporting the process of data and indicator coordination, through collaborative engagement with other agencies, and in promoting shared, rather than institution-specific, core indicators – to the extent that this is institutionally feasible.
In developing indicators, the EU also has a potential role in ensuring key development challenges are not overlooked, to complement the indicators of the SDGs, and promote the prioritisation of outcome indicators. For example, it could ensure equality/redistribution is adequately captured, as well as international and domestic financing. Similarly, the EU can support and model the adoption of process and systems development monitoring, and the critical arena of social protection quality, which is notably missing from the SDGs and other institutions’ indicators. A set of nine recommen-dations highlighting potential opportunities for the EC to contribute to the improvement of international social protec-tion indicators through its own practice and through an extended Results Framework are set out. These relate to the use
(1) RACER = Relevant, Acceptable, Credible, Easy and Robust.

8 INDICATORS TO MEASURE SOCIAL PROTECTION PERFORMANCE: IMPLICATIONS FOR EC PROGRAMMING
of the proposed SDG indicators, the development of complementary indicators, contributing to the development of an agreed social protection taxonomy, strengthening indicators in areas which are currently underdeveloped, giving consi-deration to the quality of provision and systems development, attention to poverty reduction and equality impacts, and promoting the compatibility of indicator frameworks, cross agency harmonisation and the production of requisite data.
At the programme level, it is not appropriate to be prescriptive regarding the specific indicators that should be adopted because these will vary by programme and context and should complement and support national data and indicator development processes. However, we outline the key elements to consider in relation to the process of indicator deve-lopment and selection, and the requirements (relating to quality, outcomes and process monitoring) for selecting appro-priate indicators which will monitor social protection programme performance effectively and also contribute to broader development objectives. These considerations are summarised in a decision-tree in Section 6 to facilitate the process of indicator selection at programme level.

9ACRONYMS
ACRONYMS
ADB Asian Development Bank
AROP People at risk of poverty after social transfers
AROPE People at risk of poverty or social exclusion
ASPIRE Atlas of Social Protection: Indicators of Resilience and Equity
CAUTAL Classification of Time-Use Activities for Latin America and the Caribbean
CODI Core Diagnostic Instrument
CREAM Clear, Relevant, Economic, Adequate and Monitorable
CRIS Common RELEX Information System
DAC Development Assistance Committee of the OECD
DFID Department for International Development
DG Directorate-General
DG-DEVCO Directorate-General for International Cooperation and Development
EAMR External Assistance Management Report
EBIA Escala Brasileira de Insegurança Alimentar
EC European Commission
ECHO DG for European Civil Protection and Humanitarian Aid Operations
ECLAC Economic Commission for Latin America and the Caribbean
ECOSOC United Nations Economic and Social Council
ELCSA Escala Latinoamericana y Caribeña de Seguridad Alimentaria
EMSA Estrategia Mesoamericana de Sustentabilidad Ambiental
ESSPROS European System of Integrated Social Protection Statistics
EU European Union
EU RF EU International Cooperation and Development Results Framework
FAO Food and Agricultural Organization of the United Nations
FIES Food Insecurity Experience Scale
GDP Gross Domestic Product
GNI Gross National Income
HDI Human Development Index
HETUS Harmonised European Time Use Survey
HFSSM Household Food Security Survey Module
HIC High-Income Country
HLG High-Level Group for post-2015 monitoring
IAEG-SDG Inter-Agency and Expert Group on Sustainable Development Goal Indicators
ICATUS International Classification of Activities for Time Use Statistics (ILO)
ICR Implementation Completion and Results report
ICRC International Committee of the Red Cross
ICSU International Council for Science
IEG Independent Evaluation Group
IISD International Institute for Sustainable Development
ILO International Labour Organization
IMF International Monetary Fund

10 INDICATORS TO MEASURE SOCIAL PROTECTION PERFORMANCE: IMPLICATIONS FOR EC PROGRAMMING
IOM International Organization for Migration
IPC International Policy Centre for Inclusive Growth
ISG Indicators Sub-Group of the Social Protection Committee
ISPA Inter Agency Social Protection Assessments
ISSA International Social Security Association
KPI Key Performance Indicator
LIC Low-Income Country
M&E Monitoring and Evaluation
MDG Millennium Development Goal
MIC Middle Income Country
MIS Management Information System
MLA Multilateral Agency
MPI Multidimensional Poverty Index
NGO Non-Governmental Organisation
OECD Organisation for Economic Co-operation and Development
PAD Project Appraisal Document
PCM Project Cycle Management
PPP Purchasing Power Parity
RACER Relevant, Acceptable, Credible, Easy and Robust
RF Results Framework
SDG Sustainable Development Goal
SDI Sustainable Development Index
SILC Statistics on Income and Living Conditions
SMART Specific, Measurable, Achievable, Realistic and Time-limited
SMD Severe Material Deprivation
SNA System of National Accounts
SOCR Social Benefit Recipients database
SOCX Social Expenditure Database
SPC Social Protection Committee
SPF Social Protection Floor
SPFI Social Protection Floor Initiative
SPI Social Protection Index
SPIAC-B Social Protection Inter-Agency Cooperation Board
SPL Social Protection and Labour
SPPM Social Protection Performance Monitor
SSED Social Security Expenditure Database
SSI Social Security Inquiry database
SSN Social Safety Net
TA Technical Assistance
TAPS Technical and Administrative Provisions
UHC Universal Health Coverage
UK United Kingdom
UN United Nations
UNDESA UN Department of Economic and Social Affairs

11ACRONYMS
UNEP UN Environment Programme
UNESCO UN Educational, Scientific and Cultural Organization
UN-Habitat UN Human Settlements Programme
UNHCR UN Refugee Agency
UNICEF UN Children’s Fund
UNRISD UN Research Institute for Social Development
UNSD UN Statistics Division
US United States
VET Vocational Education and Training
VLWI Very low work intensity
WFP World Food Programme
WHO World Health Organization
WTO World Trade Organization


13INTRODUCTION AND OBJECTIVES
1. Introduction and objectivesIn recent years, social protection has become an important policy tool to tackle poverty and reduce vulnerability among the poor in low-income countries (LICs). This is also reflected in recent international commitments to social protection, through, for example, the Social Protection Floor Initiative (SPFI) and the inclusion of social protection in the Sustainable Development Goals (SDGs). Numerous international and national actors are involved in financing, designing and delivering social protection programmes, developing social protection systems and extending social protection coverage. However, there remain key challenges in measuring progress in social protection towards meeting its objectives.
This paper discusses these challenges in the context of the SDGs and European Commission (EC) programming. It has three main objectives:
― to provide a critical overview and commentary on the development of SDG indicators and how they relate to social protection,
― to provide an overview of key social protection indicators used by multilateral and bilateral agencies to assess current coverage and gaps in measuring social protection at an international level and,
― to provide guidance on developing social protection indicators for use in EC programming, enhancing harmoni-sation between EC and SDG indicators and promoting consistency/compatibility with indicators currently in use among key multi- and bilateral agencies.
This paper aims to provide insight into social protection indicators in the SDG context in order to support EC decision-making on indicator selection and to inform choices relating to the EC’s contribution to the global indicator discourse in line with its institutional mandate and priorities. It is important to note that this paper is not prescriptive in terms of the indicators that should be adopted. Rather, given the complexity and diversity of the factors that drive indicator choice, it should be seen as a resource on the current process and development of social protection indicators as they relate to the SDGs, and as providing oversight of a range of indicators adopted by the main actors working on social protection. The paper makes the distinction between national-/system-level indicators and programme-level indicators and pres-ents a set of tools to critically appraise indicator development in the context of EC country programming and broader global development goals. These include the European Union (EU) commitment to supporting the development of natio-nally owned social protection policies and systems and ongoing inter-agency collaborative work on the analysis of social protection systems under the Inter Agency Social Protection Assessments (ISPA) initiative.
The paper is organised as follows. Section 2 provides a conceptual overview of social protection and performance ma-nagement, discussing the important steps in the development of indicators. It then presents an analytical framework to appraise social protection indicators, which it applies in the subsequent sections of the paper when analysing SDG indi-cators and other social protection indicators and databases.
Section 3 presents an overview of the process of developing SDG indicators, focusing first on indicators of direct rele-vance to social protection and then on those of indirect relevance. The section next appraises the selected indicators using the analytical framework discussed in Section 2.
Section 4 goes on to provide an overview of key institutions’ indicators and indicator databases. The overview is structu-red around indicators that measure social protection relating to high-income countries (HICs) and databases that mea-sure social protection relating to both HICs and LICs as well as those focusing solely on LICs. We then discuss and ap-praise the range of social protection indicators in use.
Section 5 concludes the overview and analysis by bringing together the key findings relating to the SDG indicators and existing indicators used by key agencies. We highlight the key challenges and gaps that remain in developing a coherent, harmonised and comparable set of social protection indicators at the global level.
Finally, Section 6 discusses key implications for the EC in terms of harmonising the indicators to the SDGs, and provides guidance for the future development of social protection indicators for EC programming.


15CONCEPTUAL OVERVIEW AND ANALYTICAL FRAMEWORK
2. Conceptual overview and analytical frameworkAs part of the aid effectiveness agenda to align international aid with government policies and utilise national systems, aid agencies have begun to push forward a results-oriented performance agenda. This requires a reorientation of focus on the results of international aid, rather than on the measurement of inputs (e.g. budget allocations and financial in-vestment) (Gassmann, 2010). In recent years, the EC, like many other international institutions, has adopted a stronger performance measurement approach to link its disbursements to the achievements of results (EC, 2015b). In 2015, for example, a Staff Working Document presented the EU International Cooperation and Development Results Framework (EU RF), which was developed to strengthen the capacity of the Directorate-General for International Cooperation and Development (DG-DEVCO) to monitor and report results by enhancing accountability, transparency and the visibility of EU aid (EC, 2015b: 2).
In this section, we first discuss concepts and definitions of social protection, noting the variations of concepts and tools used across different actors, and the recent move towards social protection systems. Second, we look at the conceptual issues underlying performance measurement and results frameworks, and specifically the process of developing appro-priate indicators to measure results. Finally, we present an analytical framework which we apply in later sections of the paper to analyse the appropriateness of indicators related to social protection currently being used by various agencies.
2.1. Social protection: Concepts and definitions
Over the past two decades there has been an expansion of social protection instruments and coverage, as well as an in-crease in actors involved in designing, implementing and funding social protection. Different actors bring different pers-pectives and policy priorities to the social protection sector. A country’s choice of social protection policy framework reflects its social, economic and policy context as well as being shaped by the views and decisions of political and civil society champions (EC, 2015a). Differing conceptual frameworks and definitions of social protection have been developed, depending on institutional priorities and historical trajectories, and all influence the design and implementation systems of social protection. These include, for example, the World Bank’s Social Risk Management framework, transformative social protection (Devereux and Sabates-Wheeler, 2004) and the International Labour Organization’s (ILO’s) life cycle approach. Increasingly, the objectives of social protection are based on a human rights approach, aiming to mitigate vulnerabilities as they occur across the life cycle, and contribute to pro-poor and inclusive economic growth through buil-ding human capital capacities and supporting engagement in productive activities, including labour market participation.
For the purposes of this paper, we draw on the EC’s broad definition of social protection as a ‘broad range of public, and sometimes private, instruments to tackle the challenges of poverty, vulnerability and social exclusion’ (EC, 2015a). A broad definition of social protection can include social assistance, social insurance, social services and, in some cases, labour market policies. The instruments on which this paper focuses fall largely under three of these categories: social assistance (cash transfers, public works programmes, etc.), social insurance and labour market programmes. Importantly, the interaction between these types of instruments has also recently been given more attention, as the development of social protection systems has become more prominent in recent policy debates, especially in middle-income countries (MICs) with higher institutional and resource capacities. The EC (2015a) describes a social protection system as ‘a policy and legislative framework for social protection, including the budget framework, together with the set of specific social protection programmes and their corresponding implementation mechanisms’. Developing social protection systems is based on the desire to maximise the impacts of social protection programmes by integrating them into a comprehen-sive system of policies and programmes and embedding social protection within a larger developmental framework to reduce poverty, strengthen economic growth and support social development (ibid).
However, while there is a range of social protection instruments at hand, delivered by government, donors and non-governmental organisations (NGOs), there are still some areas of contestation among key actors in the field. Some of these areas relate to addressing inequality and redistribution, universal versus residual (targeted) approaches, risk and resilience and the concept of graduation, as well as institutional priorities and design preferences (EC, 2015a). This has an important effect on the provision of social protection, which may result in uncoordinated support for alternative so-cial protection interventions rather than complementary ones (McCord, 2013). As we discuss later in the paper, this al-so has an impact in terms of differing approaches to measuring the impacts of social protection, and what constitutes a successful programme or system.

16 INDICATORS TO MEASURE SOCIAL PROTECTION PERFORMANCE: IMPLICATIONS FOR EC PROGRAMMING
In recent years, a number of international agreements have been providing a framework for social protection to address this challenge. These include the SPFI, as a guiding principle towards the universal provision of protection against risks throughout the life cycle; the social protection goals in the SDGs, which include implementing nationally appropriate so-cial protection systems and measures for all, including floors, and by 2030 achieving substantial coverage of the poor and the vulnerable; and the establishment in 2012 of the Social Protection Inter-agency Cooperation Board (SPIAC-B), co-chaired by ILO and the World Bank to convene key international institutions and bilateral development partners to better coordinate policy and programming that support the improvement of nationally owned social protection systems (EC, 2015a). However, greater donor harmonisation is still an urgent priority in order to strengthen the development of systematic provision and increase the coherence of programming (ibid).
2.2. What is performance measurement and why is it important?
Performance measurement is a key tool to assess how well a programme or policy achieves its objectives, and iden-tifying the appropriate indicators is critical for this to be achieved effectively. Performance measurement has three main functions: i) to make the most of limited resources; ii) to increase accountability and transparency (e.g. making parliaments, civil society and the general public aware of results); and iii) to improve decision-making by providing rele-vant information to inform internal management decisions for ensuring effectiveness of development aid (Delorme and Chatelain, 2011) (also see Box 1 for the importance of performance management in the context of EU budget support).
Tilbury (2004: 226, cited in Gassmann, 2010: 3) refers to the definition of performance measurement by Carter et al. (1992) as a tool that:
[…] monitors at a programme level the cost and quality of services and outcomes for clients in order to account for public expen-ditures … [it] is a tool for controlling and managing resources. It is guided by concerns about public expenditure planning, ma-nagerial competence and accountability and transparency in the complex spending process (Tilbury 2004: 228). It requires the definition of objectives (or outcomes) for policies and programmes and the use of quantitative data to monitor the effectiveness and efficiency of the policy instruments used to achieve the objectives. Performance measurement provides regular and sys-tematic information whether a program, policy or development strategy is implemented as planned, is achieving its objectives and whether and how it can be improved. It reinforces accountability and transparency through the production of relevant, re-liable and timely information and its broad dissemination.
Targets and indicators are set to meet objectives. A target can be defined as ‘a specific, measurable and time-bound outcome (result) that directly contributes to achievement of a goal’ (Suter, 2014). An indicator can be defined as ‘a me-tric used to measure progress towards a target; generally based on available or established data’ (ibid).

17CONCEPTUAL OVERVIEW AND ANALYTICAL FRAMEWORK
Box 1: Benefits of performance management
In the context of budget support, the EC argues that a focus on results is important for a number of reasons:
― Results matter. Traditional policy-based conditionality has frequently not looked at what is happening to potential beneficiaries and target groups. Linking budget support to what is happening in terms of results shifts the policy dialogue and encourages both donors and beneficiary countries to look at the actual results of their actions, thus taking their commitments on aid effectiveness seriously. Furthermore, this focus on results is consistent with agreed policy, including the internationally agreed Millennium Development Goals (MDGs). Focusing on results also avoids payment of budget support against what can easily become symbolic acts, such as passing legislation or completing a study, that do not necessarily reflect the genuine intentions of partner countries.
― Encourage ‘evidence-based’ policy-making. The focus on results when providing budget support is expected to encourage donors and beneficiary countries to analyse carefully the consequences of any given policy on the outcomes. In some cases, it can be expected to lead to an enhanced policy dialogue focusing on outcomes rather than means.
― Protect political space of beneficiary countries. Using results-/outcome-based indicators instead of policy conditions protects the policy space of the government to make what it considers are the right policy decisions to meet a particular objective. Country context varies a great deal and it is perhaps advisable, even when giving advice during policy dialogue, to refrain from being prescrip-tive in terms of policy conditions.
― Promote domestic accountability. Using results-/outcome-oriented indicators has the potential to encourage greater transparency by ministries, cabinet, parliament and the public in general over the use of public funds.
― Stimulate demand for high-quality data and data that supports evidence-based decision-making. One of the potential strengths of the focus on results is that it helps identify potential weaknesses in national statistical systems in terms of the quality of statistical information. Naturally, the identification of these weaknesses should lead to corrective measures to improve the quality of statistical information.
Source: DEVCO (2012: 47); EC Guidelines (2009: 20-21), cited in Gassmann (2010: 3)
2.2.1. Why is performance measurement important for social protection?
The policy and programming cycle of social protection usually takes place across different levels of a country’s institu-tional structure, and various actors including government and non-state actors are usually involved in implementation. Social protection policies are usually designed at the central government level but implemented at a local level through implementing agents (Gassmann, 2010). The variety of structures through which social protection operates can make it difficult to monitor. Moreover, because market forces are less important in social service delivery – as competition, which is one way to correct for price and quality of services, is absent – regular performance management is the only tool to monitor a programme to signal any changes needed to improve programme effectiveness and efficiency (ibid). Developing the correct indicators with which to monitor social protection policies to build effective policy and program-ming is therefore essential (IEG, 2011).
2.2.2. Limitations of performance measurement
Despite the advantages of performance measurement in focusing on results and accountability, there are also chal-lenges and limitations to using this tool. A key limitation is that not all aspects of performance can be easily measured – for instance processes and outcomes that are qualitative rather than quantitative in nature. Developing indicators to

18 INDICATORS TO MEASURE SOCIAL PROTECTION PERFORMANCE: IMPLICATIONS FOR EC PROGRAMMING
adequately capture these dimensions can be time-consuming and costly and require specific data. Another key limita-tion is data availability, especially in low-income contexts, where data collection capacity is lower, availability is patchy and institutions are not well coordinated to share existing data. This is particularly problematic when developing natio-nal and international indicators for comparability, as we discuss below. Moreover, developing quality indicators – those that adhere to quality control criteria, for example by measuring what they say they will measure – requires significant investment in technical expertise, data and political buy-in.
2.2.3. How does performance measurement work?
Results-oriented indicator model
Measuring performance requires the identification and use of indicators to measure progress towards a policy or pro-gramme objective and targets. Social protection targets are likely to be diverse and subject to institutional and political influences as much as they are based on technical processes. For example, targets will depend on how an institution in-tervenes in the social protection sector, what institutional targets must be met and whether the objective of the inter-vention is to contribute to building a social protection system or providing programme benefits. These targets in turn will influence the development of indicators to measure progress towards the target and programme/policy objective.
An indicator is defined by its function (what it measures), the means of obtaining it (methodology and necessary data), its quality (the extent to which it can be interpreted and monitored over time) and the limits on its use (what it does not measure or measures poorly) (Delorme and Chatelain, 2011: 8). The EC (and other development partners) encourages the use of a results(2) -/outcome-oriented approach, for example in the EU RF, which uses the ‘input-(process)-output-outcome-impact’ indicator model (EC, 2015b). While this approach creates clear categories of indicators, the distinc-tions between them can be subjective, and possible overlaps can occur. We outline the conceptual framework under-lying the EC approach below.
Input indicators: Input indicators measure the financial, human, material, administrative and regulatory resources nee-ded to implement a policy/programme (Delorme and Chatelain, 2011: 8; DEVCO, 2012). Those for the assessment of a social protection scheme’s technical or administrative efficiency relate mainly to human and other resources used to provide benefits and services (e.g. administrative costs, personnel) (Gassmann, 2010). Resources used to finance so-cial protection are input indicators used to assess allocative efficiency (ibid). As we discuss in Section 4, the majority of input indicators used by international donors in the social protection sector focus on measuring the allocation of finan-cial resources to social protection as a sign of political commitment. Typical input indicators are government spending on social protection as a percentage of gross domestic product (GDP) or government spending on social protection as a percentage of total public expenditure.
Process indicators: These refer to the activities that turn inputs into outputs. They might include legislation drafted, trai-ning conducted etc. (EC, 2015b).
Output indicators: These measure the immediate and concrete consequences of the resources used and measures taken (DEVCO, 2012). In the social protection sector, this refers to the quantitative capacity of the system and its quality, which are under the control of the agency that produces them (Gassmann, 2010). For example, as Section 4 discusses, out-put measurements in the social protection sector tend to focus primarily on the number of beneficiaries receiving social protection, or in the case of public works, the number of people employed, or the total number of days of work created.
Outcome indicators: Outcome indicators measure the direct effects on beneficiaries (Delorme and Chatelain, 2011: 8; DEVCO, 2012). As we find in Section 4, in the social protection sector, outcome indicators mainly focus on programme coverage, targeting effectiveness or the adequacy of benefits (the value in relation to a poverty line).
Impact indicators: Impact indicators measure the consequences of the outcomes and the achievements towards the ove-rall policy objective (DEVCO, 2012), such as level of poverty reduction, improved living standards and overall well-being of the poor and vulnerable (Gassmann, 2010). These are the ultimate goals of social protection policies. As Section 4 discusses, examples of impact indicators include reductions in the poverty gap and headcount, Gini inequality and le-vels of food insecurity.
Figure 1 gives an illustrative guide to indicators in each of these input, output, outcome and impact categories. It groups the indicators into overarching groups: intermediate indicators, which measure the process that transforms inputs into direct outputs (Cichon et al., 2004, cited in Gassmann, 2010); and final indicators, which assess outcomes and impacts (i.e. the economic or social changes resulting from a given programme) (Gassmann, 2010).
(2) The term ‘results’ corresponds to the results chain from outputs to outcomes and impacts (EC, 2015b).

19CONCEPTUAL OVERVIEW AND ANALYTICAL FRAMEWORK
It is important to note that, while the responsible agency can directly control inputs and outputs, outcomes and impacts can only be influenced and not controlled. Achieving measurable impacts takes time, as they are the result of several factors, many of which are outside the control of policy-makers (EC, 2009: 20, cited in Gassmann, 2010). For example, conditional cash transfers to improve human capital development and reduce intergenerational poverty may increase children’s access to schools, but other factors will also determine how much a child learns at school and the impact on poverty reduction. As discussed later, donors have tended to concentrate on measuring inputs and outputs, which is ea-sier given the availability of data on resources invested and the direct consequences of their intervention. However, in-sufficient attention to outcomes and impacts – including the quality of social protection for the end user – is problematic as longer-term poverty reduction objectives are ultimately linked to the rationale for investment in social protection (IEG, 2011). Monitoring these achievements is necessary for the success of social protection policy and programming (ibid).
Developing quality indicators
Selecting appropriate indicators to measure results is important. It requires sound formulation of policies and the objec-tives the indicators are attempting to measure, and conceptual thinking around the performance-related model (Delorme and Chatelain, 2011: 8). A number of principles underlie the development of indicators. DEVCO (2016) and EC (2012a) set out a series of issues for consideration:
Logical chain: An analysis of the relationships and linkage between the policy objective, targets and potential indi-cators is the starting point in developing appropriate indicators, and this should be based on an analysis of the logical chain that refers to linking long-term policy objectives to targets, inputs and ultimately outcomes (see also Delorme and Chatelain, 2011). Box 2 presents the logical chain components of the EU RF.
Targets should be set in a balanced way and avoid being overambitious or excessively prudent. Targets can be disaggre-gated, for example by gender, disability or geography, which may be particularly relevant to monitor the inclusiveness of programmes and where there are major disparities in the provision of key services by gender or region or through other forms of exclusion.
Figure 1: EC results-oriented framework
Source: EC (2015b)
Input Process /activity
Output Outcome Impact
Increased funding for education (funding in Euro)
Example of education sector result chain (indicator)
Improved strategic planning (education strategy finalised)
More schools and qualified teachers (number of schools built and teachers trained)
More children attending school (number of girls & boys enrolled / completing school)
Increased literacy (literacy rate, male/female)
Results

20 INDICATORS TO MEASURE SOCIAL PROTECTION PERFORMANCE: IMPLICATIONS FOR EC PROGRAMMING
Coverage: It is considered important when choosing appropriate indicators to maintain a manageable number of indi-cators to ensure the agency can effectively collect data of adequate quality. DEVCO (2016) recommends that the num-ber generally should not exceed eight (per financial disbursement tranche in budget support operations), and could in some cases be far fewer in order to avoid a loss of policy focus.
Types of indicators: As discussed above, there are different indicator types. Indicators can be stand-alone, compara-tive (benchmarking), aggregate or composite indicators.
― Individual stand-alone indicators are useful in that they can present part of the picture on programme perfor-mance. In social protection, these may include, for example, number of beneficiaries reached or average per capita transfer. However, performance cannot always be assessed by looking only at the value of the indicator, and many performance indicators need benchmarks to assess the indicators’ meaning (Cichon et al., 2004).
― Benchmarks (comparisons) can be used to interpret the meaning of an indicator. Cichon et al. (2004: 442) present four types of benchmarks:
● Objective-based benchmarks: The objectives stipulated in the law (or budget support programme) serve as a central guideline (e.g. a guaranteed minimum income level).
Box 2: Social protection indicators in the EU RF
The EU RF is a tool used to measure results achieved against strategic development objectives. It is an articulation of the different levels of results expected from the implementation of a strategy, and reflects the policy priorities of EU international cooperation and development assistance as set out in the Agenda for Change. It covers 12 areas and sectors and is associated with 16 out of 17 SDGs corresponding with EU policy priorities.The EU RF is structured around 3 levels:
Level 1: Development progress in EU partner countries
Level 2: EU contributions to development progress in EU partner countries
Level 3: DEVCO organisational performance
In the context of a logical chain analysis, it refers to analysing the long-term development impacts (e.g. results identified at Level 1 in the EU RF) and how these link to outcomes and/or outputs (Level 2) in or-der to demonstrate how the interventions contribute to sustainable progress at the higher level. It is un-derstood that the link between these two levels is complex, and it is difficult to measure the degree to which the changes at Level 1 are directly attributable to those identified at Level 2.
With reference to social protection, the EU RF presents employment and social protection indicators as the following:
Level 1: indicators (long-term development impacts):
― proportion of employed people living below $1.25 (purchasing power parity, PPP) per day
― share of older persons receiving pensions
Level 2: indicators (outcomes):
― number of people who have benefited from vocational education and training (VET)/skills develop-ment and other active labour market programmes with EU support
Source: EC (2015b)

21CONCEPTUAL OVERVIEW AND ANALYTICAL FRAMEWORK
● Time-based benchmarks: The performance is compared with achievements in the past (e.g. administrative cost ratio).
● Comparative national benchmarks: Comparing the performance of one scheme to that of a similar scheme (e.g. leakage of social cash benefit versus leakage of food subsidy scheme).
● Comparative international benchmarks: Comparing the performance of a scheme to that of a similar scheme in another country (e.g. generosity of universal child benefits).
While comparative benchmarks are important, national and international benchmarks need to be treated with caution as they can be problematic (an issue well highlighted in the SDG section below). Indeed, many other factors influence the per-formance of a social protection programme, such as the social and economic development in a country (Gassmann, 2010).
The different approaches used within performance measurement mean indicators may not be directly comparable at any level (e.g. not only at an international level but also across organisations and within countries at a national level). For example, the EU RF provides a snapshot of key results at a corporate level and captures results that can be aggre-gated. However, it is not well suited to reflecting qualitative results, and thus is seen as a complementary tool to re-porting results at individual project and programme level and country level through evaluations and case studies (EC, 2015b). Indicators also may not be comparable because of differences in the actual indicators chosen and differences in the statistics used for the calculation of the indicator, which may vary considerably between countries(3) (Bonnet and Tessier, 2013; Gassmann, 2010).
― Aggregate indicators bring together different sources of data at a national level to create a dataset or aggregate indicator. To allow for aggregation, DEVCO (2016) suggests that indicators should be – as much as possible – quantitative in nature. Methodological specifications are also required, and an indicator should be accompanied by descriptions of what should and should not be included during calculations for aggregation across projects, programmes, countries or regions. Within the social protection sector, one of the main challenges is varying interpretations of the definition of social protection. One country may report high coverage of social protection but include, for example, the distribution of mosquito nets, tertiary education bursaries, or food subsidies in that definition, which would not be included in another country’s definition.
― Composite indicators comprise individual indicators and weights that commonly represent the relative importance of each indicator (Nardo et al., 2005). Examples of composite indicators include the well-established Human Development Index (HDI), the Multidimensional Index of Poverty (MPI) (Alkire and Foster, 2011) and the recently developed multidimensional index, which measures the ‘comprehensiveness’ of social protection systems in Latin America (Ocampo and Gomez-Arteaga, 2016). There are advantages and disadvantages to using composite indicators. The pros include that composite indicators can summarise complex or multidimensional issues and provide the big picture; this can facilitate decision-making and ranking countries on complex issues (EC, n.d.)(4). However, the flip side of this is that composite indicators may be based on subjective decisions on the weighting of sub-indicators; send misleading, non-robust policy messages if they are poorly constructed or inadequately understood and interpreted; and present simplistic or misleading conclusions regarding progress (ibid; Meth, for-thcoming). Therefore, they need to be developed and interpreted with caution.
Attention to measuring quality: In addition to measuring quantity (the number of beneficiaries covered, funds trans-ferred, workshops held, pieces of legislation passed etc.), indicators can capture the quality of provision, although the latter is more difficult to measure. This could relate to the quality of implementation (e.g. the timeliness of budget trans-fers to the implementing agency, the regularity of cash transfer delivery, adherence to a particular policy), the quality of the object/service provided (e.g. the gross value of the transfer, the net value after the opportunity cost of accessing the transfer is taken into account, the comprehensiveness of a policy or legislation), or the outcomes it engenders, such as changes in institutional mandates or performance, or the impact of the transfer on the depth of poverty. In this way, quality appraisal can refer to both the quality of provision and the quality of implementation. Proxy indicators can be used to give an indication of quality to complement objectively quantifiable measures. Indeed, there is growing consen-sus that measures should include both quantitative and qualitative indicators (Stiglitz et al., 2009); however, as is dis-cussed in the sections below, currently most social protection measurement relies on quantitative indicators.
There is a need to capture a range of information from indicators, such as processes and implementation, but often only a single indicator is used (such as number of people receiving social protection, or expenditure on social protection). This is the result of issues of cost and technical feasibility as well as political acceptability. There are implications in terms of the potential for selected indicators to capture performance adequately.
(3) For example, collection of social protection data in terms of systems, or project/programme indicators.(4) https://composite-indicators.jrc.ec.europa.eu/?q=content/what-are-pros-and-cons-composite-indicators
22 INDICATORS TO MEASURE SOCIAL PROTECTION PERFORMANCE: IMPLICATIONS FOR EC PROGRAMMING
Indicators can shape the focus of politicians, civil servants and implementing agencies and their choice of priorities, and therefore selecting indicators appropriately is important, lest it create perverse incentives that may not be consistent with broader programme objectives. In the case of public works programmes, one potential indicator is the number of jobs created. However, this can result in a focus on the number of jobs rather than the number of people employed, the duration of their employment or the quality of work undertaken, with adverse consequences in terms of social protec-tion outcomes. A focus on outcome and impact indicators can often result in the omission of indicators that measure progress against the quality of social protection provision.
Quality of the indicator: Taking the above into consideration, a number of different criteria have been adopted to assess the indicator quality. Eurostat indicator guidance focuses on logic, relevance, the possibility of setting a target, frequency of data collection, appropriateness and possibility of estimating precision (DEVCO, 2012: 137). EU guidelines suggest that indicators be RACER: Relevant, Acceptable, Credible, Easy and Robust (DEVCO, 2012) (see Box 3 for details). Other examples are SMART indicators, which are Specific, Measurable, Achievable, Realistic and Time-limited. CREAM criteria refer to indicators that are Clear, Relevant, Economic, Adequate and Monitorable. In addition, the Indicators Sub-Group (ISG) of the Social Protection Committee of the EU (SPC) suggests that indicators be guided by the following mi-nimum set of methodological criteria (EC, 2012b). An indicator should:
― capture the essence of the problem and have a clear and accepted normative interpretation,
― be robust and statistically validated,
― provide a sufficient level of cross-country comparability (as is practical with the use of internationally applied definitions and data collection standards),
― be built on available underlying data, and be timely and susceptible to revision, and
― be responsive to policy interventions but not subject to manipulation.
Data sources: There are numerous different data sources used to inform social protection indicators. These include, for example, national account data, national household surveys, and programme-level monitoring and evaluation (M&E). Qualitative data can also be used to provide contextual information on policies and programmes.
In order to assess results and effects, information about the starting point (the ‘baseline information’ for a reference point in time) is necessary. EC (2012a) recommends that, where possible, data produced by national statistics authorities be used. However, if national data are unavailable, data may be specifically collected through the project and programme monito-ring mechanisms. Here, there may be an opportunity to make use of methodological work already carried out by other do-nors and by partner countries (EC, 2012a). However, while the need for common indicators has been identified (Bonnet and Tessier, 2013) and attempted in some regions (e.g. by the Asian Development Bank (ADB)), a set of comparable indicators and collaborative sharing of methodological work across agencies have not yet been defined (personal communication, ILO).

23CONCEPTUAL OVERVIEW AND ANALYTICAL FRAMEWORK
Figure 2: Key stages in appraising social protection indicators
Source: Authors
Box 3: RACER indicators
RACER indicators are Relevant, Acceptable, Credible, Easy and Robust.
Relevant: The indicator should have a strong correlation with the objective that the programme/policy aims to achieve.
Acceptable: The indicator must be easily understood and should be accepted by all stakeholders.
Credible: The indicators must be accessible to non-experts, unambiguous and easy to interpret.
Easy: It should be possible to collect the data with available resources, based on the principle of ‘proportionate analysis’ (appropriate scope and depth).
Robust: The indicators should be sensitive enough to monitor changes; therefore it is important to select them according to the time lag between the action and the expected change that points to current progress towards long-term or future improvements. It is therefore important not to rely on i) old data; ii) indicators that, having been developed to compare countries or situations, are not suitable for monitoring changes; iii) variables influenced by long-term impacts; iv) variables that are deeply affected by uncontrolled short-term changes hiding the expected long-term changes.
Source: DEVCO (2016: 115)
2.3. Analytical framework
Drawing on the above conceptual discussion and key considerations in relation to developing, selecting and reviewing indicators, we identify five key stages presented in the framework below (Figure 2) to guide our analysis and appraisal of existing social protection indicators and our discussion on developing appropriate indicators in Section 6.
Definition of social protection
Identification of objectives, targets and indicators
Choice of type of indicators and data sources
Appraisal of indicator performance
Assessments of indicator comparability

24 INDICATORS TO MEASURE SOCIAL PROTECTION PERFORMANCE: IMPLICATIONS FOR EC PROGRAMMING
2.3.1. Definition of social protection
The definition of the social protection intervention to be appraised is the starting point. While social protection can be broadly understood as public (and sometimes private) instruments to tackle the challenges of poverty, vulnerability and social exclusion, the types of programmes included vary considerably between actors; different institutions have varying conceptual definitions of social protection, which can extend to include interventions beyond basic social transfers and insurance, such as labour market policies or the provision of basic services.
The definition of social protection adopted will influence how the objectives of social protection policies and programmes are decided, and consequently how targets are set and indicators are selected.
2.3.2. Identification of objectives and targets
The second stage in appraising the appropriateness of social protection indicators is to assess the relationships between the programme or policy objectives, targets and indicators. This refers to the logical chain analysis discussed above, and requires an analysis of the logic behind setting indicators and how they relate to programme or policy outcomes and impacts. Indicators are used for a variety of purposes, to measure different types of objectives. For example, indicators may measure objectives of social protection programmes to reduce poverty and vulnerability at the household level; others may measure progress in building social protection systems, which would entail more process-oriented outcomes (e.g. building capacity and setting up regulatory frameworks and implementation systems such as registration systems).
2.3.3. Choice of type of indicators and data sources
The type of indicators chosen depends on the objectives and targets set, as discussed above. Appraising existing social protection indicators looks at what types of indicators are predominantly used (e.g. input, process, output, outcome, im-pact, as well as stand-alone, comparative, aggregate), and whether these indicators collect information on an appro-priate range of social protection outcomes and impacts. It also looks at whether indicators are reporting on systems development or impact indicators on poverty and inequality, and whether indicators capture the quality of social pro-tection provision, not just the quantity (e.g. coverage, benefit levels). In addition, it observes whether indicators capture disaggregated information on gender, disability, geography, etc. Importantly, here we also consider the politics of how indicators are chosen, not just the technical processes in selecting indicators, and whether chosen indicators have any adverse effects, such as creating perverse monitoring incentives.
Turning to data, we are interested to know what data sources are used to inform the indicators – for example, are they national statistics authorities, programme monitoring or other agency datasets? Moreover, is there evidence of collabo-rative data utilisation and common indicators?
2.3.4. Appraisal of indicator performance
Going beyond assessing the type of indicators used to measure social protection, it is important to assess the quality of the indicator – that is, is it methodologically sound? How adequately does it capture the intended impact? How is the indicator defined? How is it phrased? Do the indicators comply with SMART and RACER criteria, for example? Are they relevant, acceptable, credible, easy and robust?
2.3.5. Assessment of indicator comparability
Given the importance of social protection at a global level and the advances of social protection at national level through social protection floors and the SDGs, this last stage highlights the assessment of indicator comparability. Can indicators provide a sufficient level of cross-country comparability? Can indicators be aggregated across projects and programmes?

25SUSTAINABLE DEVELOPMENT GOALS OVERVIEW
3. Sustainable development goals overview
3.1. Overview of SDGs process
The 2030 Agenda for Sustainable Development, encompassing 17 SDG Goals and 169 targets, was adopted at the United Nations General Assembly in September 2015, and will govern development priorities for the coming 15 years. Having agreed the goals and targets, the next step was the development of an associated set of global indicators. The 2030 Agenda states that this global indicator framework should be simple yet robust and that it will be comple-mented by indicators at the regional and national levels which will be developed by Member States.
To this end, the UN Statistical Commission created the Inter-Agency and Expert Group on Sustainable Development Goal Indicators (IAEG-SDG) at its 46th session to develop an indicator framework for global-level monitoring of the goals and targets of the 2030 Agenda. The process for indicator identification was primarily technical, compared with the political nature of the goal identification process, and involved multiple inputs, including an open consulta-tion process with a range of stakeholders, including observers to the IAEG-SDG (regional and international agencies and countries that were not members of the IAEG-SDG), NGOs and experts from academia and the private sector. The global indicator framework, presented in Annex IV of the IAEG-SDGs report to the UNSC at its 47th session in March 2016, was agreed by the UN Statistical Commission as a practical starting point, subject to future technical refinement (UNStats, 2016b)(5). It comprises 230 discrete global indicators. The UNSC recognised that the develop-ment of a robust, high-quality indicator framework was a process that would need to continue over time.
Given the continuing discussion around the indicator framework noted above, the 230 indicators are not yet defini-tive, but rather a working set of indicators that will be subject to further discussion in terms of methodology, data and also acceptability to member states prior to discussion at the 48th session of the UNSC to take place in March 2017. Each indicator has been allocated a possible ‘custodian’ agency (or agencies) which would be responsible for compiling the data at the global level and for global reporting. The IAEG secretariat and custodian agencies have appraised each indicator to assess its adequacy and readiness for use on the basis of criteria relating to conceptual clarity, methodology and data, and allocated each to one of three tiers accordingly, prior to presentation of the indi-cator framework to the Statistical Commission in March (Box 4).
The custodian agency for each indicator, and other interested/involved agencies identified, have been charged with working further with the IAEG-SDG to finalise those indicators classified as Tier II and Tier III and to ensure that a ro-bust and high-quality indicator framework, acceptable to member states, is developed (IISD, 2016a). To achieve this, the IAEG-SDG will establish a work-plan for the establishment of adequate methodologies for Tier III indicators in consultation with specialised agencies and relevant experts, review data availability and develop a plan for increasing data coverage. In addition, it will explore new data sources and data collection technologies, including through par-tnerships with civil society, private sector and academia, and it will regularly review methodologies for indicators, de-velop guidance on data disaggregation and continue discussion on interlinkages across goals and targets and on the use of multipurpose indicators. Furthermore, it is tasked with further developing and formalising the process for SDG reporting over the coming year, including developing a global reporting mechanism for SDG performance, identifying
(5) It is the indicators as set out in that document, dated 24 March 2016, that this section discusses.
Box 4: Criteria for the SDG indicator tier system
Tier I: indicators are conceptually clear, with an established methodology and standards agreed and used consistently across agencies, and they use data that are regularly produced at country level.
Tier II: indicators are conceptually clear and also have an established methodology and standards, but data are not regularly produced at national level.
Tier III: indicators do not have an established methodology and standards, although these may be un-der development.
Source: UNStats (2016a)

26 INDICATORS TO MEASURE SOCIAL PROTECTION PERFORMANCE: IMPLICATIONS FOR EC PROGRAMMING
entities responsible for compiling data for global reporting on individual indicators, and establishing procedures for the methodological review of indicators, including approval mechanisms of needed revisions (UNStats, 2016b)(6).
The IAEG-SDG is also mandated to identify data gaps as well as related priorities for capacity-building and data de-velopment in relation to the indicators. Work has begun in terms of identifying and supporting processes to compile and analyse data in support of the indicators and to come up with baseline estimates of the global position, and that of individual countries where data are available. The IAEG-SDG will agree a format for the compilation and dis-semination of metadata on global indicators in order to promote consistent implementation at national, subnatio-nal, regional and global levels. This metadata will encompass a full description of the indicator definitions, under-lying concepts, methods of data collection, data sources and other relevant information that will facilitate the use and interpretation of the indicators.
The process of development of the SDG indicators outlined above differed significantly from the MDG indicator selec-tion process, which was largely led by central development agencies, who also played key roles in gathering, aggre-gation and analysis of data. The SDG process is differently conceptualised, recognising the concern at national level with the multilateral agency-led (MLA) MDG indicator process; the SDG process is led by member states and it is an-ticipated that data collection will be a nationally led, rather than a MLA-led, endeavour. Thus the role of the interna-tional agencies will differ significantly from their role in the MDGs. Discussion is ongoing regarding how their exper-tise might most constructively be used to support national endeavours, while shifting the balance toward member states’ roles. Notwithstanding these sensitivities in the conceptualisation of the SDGs, there are persistent member state concerns that the process should be driven by nationally and regionally defined indicators rather than by glo-bally defined indicators, which may be problematic in terms of both their relevance to national development priori-ties and national-level data availability (Muchhala, 2016).
In an attempt to contribute to resolving the challenge of data availability, a High-level Group for Partnership, Coordination and Capacity-Building for Post-2015 Monitoring (HLG) was created by the UNSC in March 2015 to ad-dress strategic aspects of implementing a global indicator framework for the SDGs. The HLG, which also reports to the UN Statistical Commission, was mandated to develop a ‘Global action plan for the modernisation and streng-thening of statistical systems for sustainable development data’ and to organise a biennial World Data Forum (UN HLG, 2016), the first of which is to be held in Cape Town in 2017, in support of SDG monitoring and the development of quality data on key indicators at national level (IISD, 2016b). The process of developing appropriate data for SDG indicators is also supported by the UN-led Global Partnership for Sustainable Development Data, which is promoting the production of quality data at national level through an open, multi-stakeholder network. In this, governments, national statistic offices, development partners and the private sector work together to identify and address data gaps. The intent is to create a global partnership for sustainable development data that will support the SDG moni-toring process both nationally and globally (UN Data Revolution Group, 2014; UN Global Partnership for Sustainable Development Data, 2016).
It is planned to establish a set of SDG baselines in 2017, compiling databases drawing initially on what is already available, which will necessarily mean multiple gaps at national level. Given the voluntary nature of the SDGs, each country will select which targets it will work to, with a greater focus on social protection where it is already iden-tified as a national priority. Individual countries may adapt and apply targets differently during the process of ‘do-mestication’, also adapting the indicators to ensure relevance to the national context and national data availability. Therefore, it is unlikely that countries will adopt the whole indicator framework; rather, they will select those that are most relevant in terms of domestic political preferences. At the UN Statistics Commission meeting, member states reiterated the importance of national ownership, noting that the 2030 Agenda defines targets as aspirational and global and that the process should accommodate national diversity, with the global indicator framework taking na-tional processes as the foundation for reviews at the regional and global levels (Muchhala, 2016). However, this en-tails a significant trade-off in terms of global progress monitoring; the more targets and indicators are domestica-ted at a national level, the harder regional and global monitoring and reporting will become.
There is as yet no fixed date for reporting, or agreed frequency of reporting at national level, with the working concept being to build on existing reporting schedules, such as five-year plans, biennial reporting against national develop-ment goals, etc. Data produced for these processes can be used for upward SDG reporting for aggregation to pro-duce annual estimates per year.
(6) http://unstats.un.org/sdgs/files/meetings/iaeg-sdgs-meeting-03/3rd-IAEG-SDGs-presentation-UNSD--UN47SC-Outcome.pdf

27SUSTAINABLE DEVELOPMENT GOALS OVERVIEW
Work to harmonise and standardise definitions is the responsibility of the UN Statistics Commission, although the IAEG-SDG will continue to exist, with sub-groups working on specific issues and inter-agency expert groups esta-blished around sectoral issues. While it is not anticipated to have groups for each of the 169 targets, the process is organic and some specialised groups are emerging. These may be led by member states, international agencies or stakeholder groups.
The following sections discuss in turn the indicators relating to social protection directly and then indirectly, drawing on UNStats (2016a).
3.2. Overview of SDG indicators directly relating to social protection
Social protection was not explicitly articulated as one of the MDGs but was widely identified during the MDG period with Goal 1, on the eradication of extreme poverty and hunger, as well as contributing – through increased house-hold income, some transferred directly to women – to the realisation of the other six goals. Similarly, social protection is not a goal itself within the SDGs, but it is explicitly presented as a key instrument to deliver on 4 of the 17 SDGs agreed in 2015. In addition to contributing directly to reduction of poverty and inequality, social protection may also be expected to have a series of indirect impacts by releasing capital constraints at household level, which has been found to contribute to the realisation of a range of health, nutrition, education and employment outcomes (Bastagli et al., 2016). In this way, social protection may be instrumental in the realisation of many of the SDGs, given the interlinkages between increased income and household and community-level developmental outcomes (Lay and Prediger, 2016). The four goals that mention social protection, either in the associated target or in the indicators, are:
Goal 1: End poverty in all its forms everywhere.
Goal 5: Achieve gender equality and empower all women and girls.
Goal 8: Promote sustained, inclusive and sustainable economic growth, full and productive employment and de-cent work for all.
Goal 10: Reduce inequality within and among countries.
In this way, social protection is directly identified with poverty reduction, gender equality and women’s empower-ment, inclusive growth and reduced inequality. Table 1 sets out in full the text of the SDGs that mention social pro-tection in their targets or indicators, along with category of indicator, tier and custodian and interested agencies for each. The narrative below then discusses each indicator.

28 INDICATORS TO MEASURE SOCIAL PROTECTION PERFORMANCE: IMPLICATIONS FOR EC PROGRAMMING
SDG Target Indicator Type of indicator
Tier proposed by custodian agency (revised by secretariat)
Proposed custodian agency (other involved agencies)
Goal 1: End poverty in all its forms everywhere
Target 1.a: Ensure significant mobilization of resources from a variety of sources, including through enhanced development cooperation, in order to provide adequate and predictable means for developing countries, in particular least developed countries, to implement programmes and policies to end poverty in all its dimensions
1.a.1Proportion of resources allocated by the government directly to poverty reduction programmes
Input (share of government spending)
Not available World Bank (provisional)
1.a.2Proportion of total government spending on essential services (education, health and social protection)
Input (share of government spending)
Tier III: need to establish reporting mechanism (Tier I)
World Bank (provisional) (ILO, WHO, UNESCO)
Target 1.3: Implement nationally appropriate social protection systems and measures for all, including floors, and by 2030 achieve substantial coverage of the poor and the vulnerable
1.3Proportion of population covered by social protection floors/systems, by sex, distinguishing children, unemployed persons, older persons, persons with disabilities, pregnant women, newborns, work injury victims and the poor and the vulnerable
Outcome(coverage of SPFs/social protection systems), disaggregated by group
Tier I (II) ILO (World Bank)
Goal 5: Achieve gender equality and empower all women and girls
Target 5.4: Recognize and value unpaid care and domestic work through the provision of public services,infrastructure and social protection policies and the promotion of shared responsibility within the household and the family as nationally appropriate
5.4.1Proportion of time spent on unpaid domestic and care work
No social protection-related indicator
Tier II (II) UN Women (UNSD)
Goal 8: Promote sustained, inclusive and sustainable economic growth, full and productive employment and decent work for all
Target 8.b: By 2020, develop and operationalize a globalstrategy for youth employment and implement the ILO Global Jobs Pact
8.b.1Total government spending in social protection and employment programmes as a proportion of the national budgets and GDP
Input (share of government spending and GDP)
Tier III (III) ILO (World Bank)
Table 1: Provisional global SDG indicators pertaining to social protection (March 2016)

29SUSTAINABLE DEVELOPMENT GOALS OVERVIEW
Each of the four SDGs mentioning social protection are discussed below, outlining the target and the proposed indi-cator, the tier proposed by the ‘custodian’ agency and the tier proposed by the IAEG-SDG Secretariat, together with a brief discussion of each indicator. These are then discussed more generally in the section drawing on the analyti-cal framework set out above.
Of the four goals/targets in which social protection is directly mentioned, one, Goal 5, relating to gender equality, does not use a social protection-related indicator. The remaining four targets have five social protection-related in-dicators, and of these only two were proposed by the custodian agencies as Tier I (1.3 and 10); two were felt by the Secretariat to have Tier I status (1.a and 10).
Goal 1: End poverty in all its forms everywhere
The targets for this goal are the provision of adequate funding, both nationally and through development cooperation, for programmes and policies to end poverty, and the implementation of social protection in order to provide subs-tantial coverage for the poor and vulnerable. Social protection is identified as a key contributor to poverty reduction. The first target, 1.a, is concerned with allocation of sufficient resources to fund programmes to end poverty. It does not make specific mention of social protection. Meanwhile, 1.3 is directly concerned with social protection provision.
Target 1.a requires adequate national and international financing for the implementation of programmes and po-licies to end poverty in all its dimensions. Two indicators are associated with this target, both relating to financial inputs; the first relates to the share of national resources directed to poverty reduction programmes overall, which implicitly includes social protection provision; the second, also an input indicator, explicitly mentions the share of to-tal government spending on essential services:
1.a.1 Proportion of resources allocated by the government directly to poverty reduction programmes
1.a.2 Proportion of total government spending on essential services (education, health and social protection).
Here, while the target does not directly mention social protection, the indicator identifies social protection spending as indicative of programmes that are essential to end poverty along with health and education.
Indicator 1.a.2, the proportion of total government spending on essential services, provisionally has the World Bank as its custodian agency, with ILO, the World Health Organization (WHO) and the UN Educational, Scientific and Cultural Organization (UNESCO) also implicated, with particular reference to the social protection, health and education spen-ding components, respectively. The custodian agency suggested that this was a Tier III indicator, but the IAEG-SDG Secretariat considered it Tier I, given the indicator has an established methodology based on agreed international standards, with the indicator being based on established national budget information and information from educa-tion (UNESCO) and social protection (ILO). These indicators are derived from national budget statistics and sectoral statistics, with data available for all countries. The only remaining component is the establishment of a system for the compilation of the social protection data.
Target 1.3 directly links social protection provision with the goal of poverty reduction, with the target being the im-plementation of nationally appropriate ‘social protection systems and measures for all, including floors’ and the at-tainment of ‘substantial coverage of the poor and the vulnerable’ by 2030. The indicator for this target is:
1.3 Proportion of population covered by social protection floors/systems, by sex, distinguishing children, unem-ployed persons, older persons, persons with disabilities, pregnant women, newborns, work injury victims and the poor and the vulnerable.
Goal 10: Reduce inequality within and among countries
Target 10.4: Adopt policies, especially fiscal, wage and social protection policies, and progressively achieve greater equality
10.4Labour share of GDP, comprising wages and social protection transfers
Outcome (labour share of GDP – to include social protection contribution)
Tier I (I) ILO (IMF)
Source: IAEG-SDG (2016)

30 INDICATORS TO MEASURE SOCIAL PROTECTION PERFORMANCE: IMPLICATIONS FOR EC PROGRAMMING
While there are two dimensions to nationally appropriate provision, coverage and adequacy (Ortiz et al., 2014), the SDG indicator focuses exclusively on coverage, being an outcome indicator relating to coverage in terms of the pro-portion of the population covered by social protection floors/systems disaggregated by socioeconomic or demogra-phic group (sex, children, unemployed persons, older persons, persons with disabilities, pregnant women, newborns, work injury victims and the poor and the vulnerable). This is an indicator many donors use, which is readily calculable based on national data, although it requires definitional agreements on what constitutes social protection as well as how coverage is conceptualised and measured (legal coverage versus beneficiary numbers at any one point in time).
ILO is the custodian agency, with the World Bank also associated. ILO proposed the indicator be Tier I, but this was revised to Tier II by the Secretariat, given that, while there is an established methodology for appraising coverage used by ILO, there are a range of international standards and approaches using different definitions of the concepts of both coverage and social protection. For example, ILO definitions are based on its World Social Protection Inquiry and on Recommendation 202 on Social Protection Floors. Thus it proposes that the indicator be based on the num-ber of persons with access to social protection coverage over the life cycle, including the main areas of social pro-tection (but excluding health in this context, as this is dealt with elsewhere in the SDGs) in line with Convention 102 and Recommendation 202.
However, some organisations measuring indicators relating to social protection use different approaches, as there are no accepted guidelines or standardised methods of data collection on coverage, and no set of basic principles on how to measure coverage. For example, a distinction can be made between legal (or statutory) coverage (taking into account the provisions required by law) on the one hand, as measured by ILO, and effective coverage on the other. The World Bank’s Atlas of Social Protection: Indicators of Resilience and Equity (ASPIRE) database’s coverage indi-cators adopt the effective coverage definition, extrapolating the total number of direct and indirect beneficiaries ac-tually receiving and benefiting from social protection provision at any one time, from respondent data from natio-nally representative household survey data, as a proportion of the target group. ASPIRE calculates coverage within the total population and also disaggregated by income quintile and by urban/rural status. Thus, the ASPIRE indica-tors do not include those who are protected by law, or those who have benefits guaranteed but are not necessarily receiving them at the time the survey is administered – for example people contributing to old age pensions who will be entitled to the benefits on reaching retirement. Hence, coverage rates as recorded using ASPIRE indicators differ significantly from ILO estimates.
Another complicating factor is that data availability for the social protection component of the indicator vary by type of benefit: ILO has data on child grants from 109 countries, compared with 79 for unemployment, 171 for disability, 175 for old age, 139 for pregnant women and 172 for work injury victims (IAEG-SDG, 2016).
This is the critical indicator in terms of the social protection sector, as it is focused exclusively on social protection rather than on bundles of policy interventions, is disaggregated by user group, including the ‘poor and vulnerable’, and attempts to appraise performance in relation to the fundamental challenge of implementing nationally appro-priate social protection systems and measures for all, in line with the SPF. As it is articulated, this indicator is impli-citly linked with the SPF monitoring framework already mandated by the International Labour Conference, a mem-ber states-led process, supported by ILO, which may potentially adopt some form of SPFI (Bierbaum et al., 2016). Therefore, there is a need to consider an approach consistent with the SPF monitoring process that is acceptable to both member states and the main development agencies involved in the sector. This must accommodate the fact that some countries and agencies conceptualise social protection as a stand-alone goal and others as a means to achieving larger goals, such as employment and decent work, poverty reduction or equality. It will also enable sys-tematic analysis to ensure international comparability (Deacon and St Clair, 2015).
Currently, the level of conceptual and definitional diversity across institutions has led the IAEG-SDG Secretariat to consider it a Tier II indicator requiring further development.
Goal 5: Achieve gender equality and empower all women and girls
Target 5.4 recognises the role of social protection policies in addressing gender quality and women’s empowerment:
Recognize and value unpaid care and domestic work through the provision of public services, infrastructure and social protection policies and the promotion of shared responsibility within the household and the family as na-tionally appropriate.

31SUSTAINABLE DEVELOPMENT GOALS OVERVIEW
However, there is no associated social protection-related indicator, with the indicator adopted making no reference to social protection provision, but rather focusing on the proportion of time spent on unpaid work:
5.4.1 Proportion of time spent on unpaid domestic and care work.
The custodian of this indicator is UN Women, and it is proposed and agreed to be a Tier II indicator, lacking an agreed and tested methodology and agreed international standards, with different classifications of activities used by different country groupings. For example, it is mainly developing countries in Africa and Asia that use the trial International Classification of Activities for Time Use Statistics (ICATUS); much of Europe and Transition countries use the Harmonised European Time Use Survey; most of Latin America and the Caribbean use the Classification of Time-use Activities for Latin America and the Caribbean (CAUTAL); and New Zealand and the US use national clas-sifications. The UN Statistics Division (UNSD) is currently working on an updated version of ICATUS to be presented to the UN Statistical Commission in 2017 as the basis for the indicator.
UN Women and UNSD have compiled data relating to time spent in paid and unpaid work by sex from 75 countries, but the survey is not nationally representative in all countries. Alternative data sources for this indicator include dia-ry-based methods and living-standard surveys. Challenges associated with collecting data include high non-res-ponse rates, diversity across age groups, different reference periods and seasonal variations in labour usage. As the indicator does not include the role of social protection, the contribution of social protection will not be examined in reporting on this target.
Goal 8: Promote sustained, inclusive and sustainable economic growth, full and productive employment and decent work for all
Goal 8 relates to the nature of growth and labour markets, and Target 8.b calls for the implementation of the 2009 Global Jobs Pact (ILO, 2009). This makes 8.b a nested goal with multiple implicit targets, as the Global Jobs Pact includes a commitment to the furtherance of a range of policies. These include those relating to the extension of social protection provision, such as the Decent Work Agenda, whose four pillars (social protection, alongside em-ployment creation, rights at work and social dialogue) were incorporated into the 2030 Agenda. In addition to social protection, these include employment generation, promoting labour standards, social dialogue and ‘fair globalisation’.
The associated SDG indicator is:
8.b.1 Total government spending in social protection and employment programmes as a proportion of national budgets and GDP.
This indicator is limited to input appraisal; it attempts to monitor progress on social protection and employment pro-grammes by calculating total spending on social protection and employment interventions, rather than tracking pro-gress against any of the multiple dimensions of the Global Jobs Pact or Decent Work Agenda.
The custodian agency for this indicator is the ILO, with the World Bank also interested, and the tier rating for this indi-cator is III. The calculation of expenditure as a percentage of GDP and national budget as per the System of National Accounts (SNA) may be based on an internationally agreed standard set of recommendations on how to compile measures of economic activity, which is well established and therefore not problematic. However, there is no metho-dology for the indicator, nor an agreed international standard in terms of standard definitions of social protection and employment programmes, and work is ongoing on this indicator.
This indicates the need for a taxonomy of what should be included as social protection and employment programme components. Currently, both concepts are included in national accounting at the country levels but without consis-tency of definition, rendering comparative analysis problematic (see, for example, Hagen-Zanker and McCord, 2013). While total spend on these two components is not currently computed consistently, the raw components are usual-ly available at country level.
The indicator is weak in terms of its links to monitoring associated components of the Global Jobs Pact and the range of indicators set out in the ILO supported framework of Decent Work Indicators (2008) or the ILO Decent Work Indicators (2012).
Goal 10: Reduce inequality within and among countries
Target 10.4 is concerned with the progressive achievement of equality through a range of policies, highlighting fiscal,

32 INDICATORS TO MEASURE SOCIAL PROTECTION PERFORMANCE: IMPLICATIONS FOR EC PROGRAMMING
wage and social protection policies. The indicator selected is the labour share of GDP, comprising wages together with social protection transfers. This is the only indicator where the Secretariat and the custodian agencies are both agreed on its Tier I status, and data are readily available from national accounts:
10.4 Labour share of GDP, comprising wages and social protection transfers.
This outcome indicator is somewhat problematic as the labour share is susceptible to drivers beside wage and pro-gressive social protection provision, which relate to a range of external economic considerations, and is not neces-sarily linked to progressive policy interventions to promote equity. Therefore, this indicator needs to be considered in relation to GDP trends, rather than as a stand-alone figure (see ILO, 2012). In terms of social protection in developing contexts, the social protection contribution to the labour share may be marginal and not necessarily well calibrated with increased equality. Evidence from Latin America indicates that labour market incomes are far more important than social protection in shaping overall distributional change (Lustig et al., 2014, cited in Lay and Prediger, 2016).
The ILO is the custodian agency, with the International Monetary Fund (IMF) also interested, and the indicator has Tier I status, as there is an agreed methodology, although it has not been tested, and an agreed international stan-dard. Data for global and regional monitoring are in the SNA for 200 countries and have been extracted into data-bases developed by ILO (2014) and IMF (2014) (cited in UNStats, 2016a).
The focus on wages in Indicator 10.4 underplays the importance of the fiscal context in driving equality (e.g. reducing inequalities by minimising illicit financial outflows, corruption, tax avoidance and evasion) and avoids ‘confronting the income and wealth differences which are formative of other dimensions of inequality’ (ICSU, 2015). Thus, alternative indicator options with the potential to quantify reduction in wealth or income inequality inequalities, for example the ratio of the share of income of the richest and poorest 10% of nations (Palma ratio) as set out in the Decent Work Indicators Framework (ILO, 2012), may have been better, more closely linked to the spirit of the goal (ICSU, 2015).
3.3. Discussion of the indicators
Overall, social protection is mentioned in none of the SDGs but is mentioned explicitly in three of the targets and im-plicitly in one (nested within the Global Jobs Pact). As noted in the previous section, these are i) addressing poverty reduction, ii) achieving gender equality, iii) promoting inclusive growth (implicit) and iv) reducing inequality. Of these four targets, three adopt social protection within their associated indicators (poverty, inclusive growth and inequali-ty). Two of the four indicators proposed for these three targets are input indicators relating to fiscal allocations. Two appraise outcomes, one in the form of coverage, rather than the quality of outcome of provision, and one in terms of the labour share, where social protection is bundled with wage transfers as a measure of policy developments to promote equality. The one indicator that refers exclusively to social protection takes the form of an outcome indi-cator (1.3 relating to coverage), while the input indicators that include social protection bundle it with other key ser-vices (poverty reduction programmes, health and education and employment policies) as a percentage of total go-vernment expenditure or GDP. This is consistent with the conceptualisation of social protection as one cross-cutting instrument rather than a sector, or a goal in its own right. However, a common definition has not yet been identified either for social protection or for the related concept of coverage. Therefore, the associated measurement of social protection spending also remains to be resolved as part of the finalisation of the indicator definitions, methodolo-gies and datasets. This is because different agencies define the terms adopted in the indicators differently, or pro-pose differing methodologies.
Until these problems are resolved, there remains a likelihood of discrepancies in national data provided by different agencies. Attempts to aggregate findings are likely to be further complicated by the proposed ‘domestication’ of the SDGs – and, implicitly, the associated indicators – under which governments will be free to prioritise and redefine the SDGs at national level in line with domestic preferences and priorities.
Many of the social protection-specific targets relate to activities or processes, without specified end points. Thus, they are not readily amenable to an assessment of whether they are achieved, or what progress is being made towards them. This reflects the fact that the associated goals have neither qualitative nor quantitative endpoints (ICSU, 2015).
There are two notable omissions in the indicators relating to social protection. One concerns institutional progress towards the building of national social protection systems (in terms of development of legislation, policies, etc.). The other concerns the quality of provision (e.g. adequacy of transfer level, frequency of payment, duration of provision, outcome in terms of poverty reduction).

33SUSTAINABLE DEVELOPMENT GOALS OVERVIEW
In terms of systems development, although the SPF is mentioned and the need to realise systems of provision is articulated in Goal 1.3, reflecting the current donor priority given to social protection systems development (World Bank, 2012), there is no measurement of progress in the operationalisation of ILO Recommendation 202 on Social Protection Floors, the Global Jobs Pact or the Decent Work Agenda. Nor is there mention of the development of so-cial protection systems of provision more generally, and there is little linkage to the indicators proposed for tracking legislative or institutional progress, for example the legal indicators developed for the Decent Work Agenda to stand alongside the statistical indicators (ILO, 2012) or the indicator linked to the adoption of social protection strategies proposed by Ortiz et al. (2014).
The second omission is that there are no indicators for the quality of social protection provision: the focus is exclu-sively on quantity, in terms of coverage, rather than the value of the transfer at household level. This latter could be measured in various dimensions, with indicators based on design data (relating to transfer value and duration) extractable from programme design documentation or modelled on the basis of national survey data, or on imple-mentation data (frequency, reliability), also derived from national household surveys. Transfer value indicators could be calculated on the basis of established methodologies, such as transfer value as a percentage of per capita gross national income (GNI) or GDP.
This absence of quality and impact data indicators is problematic. The focus on coverage risks promoting incentives to focus on aggregate coverage at national level, in preference to quality and impact, to the detriment of perfor-mance. In addition, the absence of institutional or legislative indicators means that issues such as institutional com-mitment to social protection, sustainability and entitlement to provision cannot be readily appraised. The ILO focus on legislation is included in the draft indicator on social protection coverage (1.3), in relation to legal entitlement, but is problematic as a stand-alone measure without linkage to the measurement of actual coverage rates. As a result, the Secretariat identified it as a Tier III indicator requiring further discussion and development.
The focus on labour share, spending and coverage as the key indicators reflecting the contribution of social protec-tion to the SDGs is somewhat inadequate for appraising progress towards the goals and targets to which it is in-tended to contribute. It will need to be complemented in other monitoring systems, with particular reference to the quality of provision, to prevent a skewing of attention away from actual impact on welfare. Social protection is also part of a somewhat inadequate indicator relating to equality, which would benefit from being complemented by in-dicators to appraise progress in this area. These could use social protection data in combination with fiscal data to directly assess state efforts at redistribution (e.g. fiscal incidence analysis taking into account the net effect of both taxation and redistribution through social protection (see Bastagli, 2015).
3.4. Overview of other SDG indictors relevant to social protection
The above sections (3.2. and 3.3.) focused on the indicators in which social protection is directly implicated, but a number of other indicators – relating to poverty, food security, health and education targets – are also relevant to the most commonly anticipated outcomes of social protection provision. These therefore need to be measured in some way. The most directly relevant of these targets and their associated indicators are set out below, and their broader relevance for social protection discussed.
The key SDGs that are indirectly linked to social protection are:
Goal 1: End poverty in all its forms everywhere.
Goal 2: End hunger, achieve food security and improved nutrition and promote sustainable agriculture.
Goal 3: Ensure healthy lives and promote well-being for all at all ages.
Goal 8: Promote sustained, inclusive and sustainable economic growth, full and productive employment and de-cent work for all.
Goal 10: Reduce inequality within and among countries.
Goal 11: Make cities and human settlements inclusive, safe, resilient and sustainable.
Goal 17: Strengthen the means of implementation and revitalize the global partnership for sustainable development.

34 INDICATORS TO MEASURE SOCIAL PROTECTION PERFORMANCE: IMPLICATIONS FOR EC PROGRAMMING
We discuss the relevant indicators associated with the targets for these goals in turn below.
Ending poverty (Goal 1):
This goal has two targets relating to poverty reduction. The first is eradicating extreme poverty for all people eve-rywhere by 2030, currently measured as people living on less than $1.25 a day. The second is reducing, at least by half, the proportion of men, women and children of all ages living in poverty in all its dimensions according to na-tional definitions by 2030, with the second target adopting nationally determined indicators and a broader concep-tion of poverty.
The indicator for the first is a Tier I indicator:
1.1.1 Proportion of population living below the international poverty line, by sex, age, employment status and geo-graphical location (urban/rural).
There is a well-established methodology for this indicator, which has been tested and is an agreed international stan-dard. This was first used in 1990, and was used to monitor MDG Target 1.1, based on monetary welfare data (either income or consumption) collected from household surveys, rendered comparable between countries and over time through the calculation of PPP exchange rates and a common poverty line to create global poverty estimates. The World Bank, which reported on this indicator under the MDGs, is the custodian agency. The indicator includes both poverty and decent work elements by adding employment status into the required disaggregation, in this way also capturing the issue of the working poor, based on an ILO definition of employment status.
There are two indicators for the second target:
1.2.1 Proportion of population living below the national poverty line, by sex and age
1.2.2 Proportion of men, women and children of all ages living in poverty in all its dimensions according to natio-nal definition.
Both have national governments as the custodian agency, as national-level statistics and poverty definitions are central to this indicator, with UNICEF and the World Bank as supporting agencies. The first is a Tier I indicator, being based on established methodologies. The second, which attempts to take a more complex and multidimensional perspective, is a Tier II indicator, as methodologies and data remain to be confirmed.
Hunger, nutrition and food security (Goal 2):
The target associated with Goal 2 is ending hunger and ensuring access by all people – in particular the poor and people in vulnerable situations, including infants – to safe, nutritious and sufficient food all year round by 2030, and adopts as an indicator:
2.1.2 Prevalence of moderate or severe food insecurity in the population, based on the Food Insecurity Experience Scale (FIES).
FIES is an established methodology that has been tested and agreed as the international standard for assessing food security. It has been widely used by the Food and Agricultural Organization (FAO) and can be used to derive a global reference scale of food insecurity severity to calibrate measures obtained with FIES or a range of compatible sur-vey instruments(7) in any country in the world, rendering estimated prevalence rates comparable. This is an agreed Tier I indicator, and FAO, the custodian agency, will provide technical assistance (TA) and methodological support for the inclusion of FIES in suitable national surveys, as well as methods for the analysis of FIES data and the use of a dedicated open source software developed by FAO. Data are available for over 140 countries from 2010 onwards.
Health (Goal 3):
Target 3b of the health goal relates to access to medicines, and is to ‘Support the research and development of vaccines and medicines for the communicable and non-communicable diseases that primarily affect developing countries, provide access to affordable essential medicines and vaccines … and, in particular, provide access to me-dicines for all’. The associated indicator is:
(7) Such as the Escala Brasileira de Insegurança Alimentar (EBIA), Escala Latinoamericana y Caribeña d Seguridad Alimentaria (ELCSA), Estrategia Mesoamericana de Sustentabilidad Ambiental (EMSA) and the Household Food Security Survey Module (HRSSM).

35SUSTAINABLE DEVELOPMENT GOALS OVERVIEW
3.b.1 Proportion of the population with access to affordable medicines and vaccines on a sustainable basis.
WHO is the custodian of this indicator, but there is not yet detailed information on the tier or methodology.
Target 3.8 relates to universal health coverage (UHC) and is to ‘Achieve universal health coverage, including financial risk protection, access to quality essential health-care services and access to safe, effective, quality and affordable essential medicines and vaccines for all’. There are two dimensions to UHC service provision – coverage and affor-dability – and two indicators capture these.
Coverage is addressed by the indicator:
3.8.1 Coverage of essential health services (defined as the average coverage of essential services based on tra-cer interventions that include reproductive, maternal, newborn and child health, infectious diseases, non-commu-nicable diseases and service capacity and access, among the general and the most disadvantaged population).
This is a composite indicator based on multiple health coverage indicators relating to the provision of specific ser-vices. WHO is the custodian agency, and, although a methodology has been proposed, this has not yet been tested, and there is no internationally agreed measure of UHC, in terms of which elements should be included in the com-posite. Therefore, it is a Tier II indicator.
Affordability is addressed by an indicator that attempts to measure financial risk protection, ensuring people are pro-tected against the financial consequences of paying for health services:
3.8.2 Number of people covered by health insurance or a public health system per 1,000 population.
However, there is no methodology for assessing this indicator, as WHO does not agree it is a valid measure of finan-cial risk protection. Although people may be legally covered by health insurance, they may not be able to access ser-vices without making substantial payments, and the quality and content of both health insurance and public health provision vary significantly across countries, with greatly differing implications for financial risk protection outcomes. WHO has submitted an alternative indicator to the IAEG-SDG to address this challenge; this is currently under consi-deration: ‘Proportion of the population not financially protected against the costs of health services’.
A comprehensive review of the impacts of health insurance in developing countries found that, while health insurance improves access and use, it does not have a conclusive impact on health status (Giedion et al., 2013, cited in Lay and Prediger, 2016). This indicates that the selected indicator may be a poor proxy for improved health outcomes, with other factors, such as quality of health service provision, being a key determinant of outcomes.
Growth, employment and decent work (Goal 8):
Two targets under Goal 8 cover quality and quantity of employment. Target 8.5 relates to the employment dimen-sion of the goal and covers the attainment of full and productive employment and decent work for all women and men, including for young people and persons with disabilities, and equal pay for work of equal value. This is closely linked to the objectives of the Global Jobs Pact and the Decent Work Agenda, and ILO is the custodian agency for the associated indicator:
8.5.1 Average hourly earnings of female and male employees, by occupation, age and persons with disabilities.
There is an established and tested methodology for assessing hourly earnings of female and male employees, based on an agreed international standard. This entails recalculating data used to calculate the gender wage gap to es-timate disaggregated hourly earnings based on a series of assumptions. However, data are available for only 66 countries, and the indicator includes only paid employees, thereby excluding own account workers and many wor-king informally. Thus it captures only a limited segment of the labour force and is a somewhat inadequate indicator of decent work, relative to the range of alternative indicators ILO has set out. On this basis, the Secretariat revised the proposed Tier I status to Tier II, indicating that further discussion is required.
Quantity of employment, measured on the basis of unemployment, is more easily captured, on the basis of the indicator:
8.5.2 Unemployment rate, by sex, age and persons with disabilities.
36 INDICATORS TO MEASURE SOCIAL PROTECTION PERFORMANCE: IMPLICATIONS FOR EC PROGRAMMING
There is an established and tested methodology for assessing unemployment based on an agreed international standard. Data are widely available – both actual data provided by countries and estimates carried out by ILO year-ly – although data enabling disaggregation by disability are not common. This is a Tier I indicator, with ILO as the custodian agency.
A number of key challenges are associated with these indicators. For example, there is growing consensus that GDP is not an adequate measure of overall economic performance, and particularly not of issues relating to poverty and inequality, given the evident disassociation between them. Hence, there is a need to consider how to capture inclu-sive growth and income inequality rather than continuing to focus on GDP, and also to recognise that GDP growth can be at the expense of human capital and equality and to capture a multidimensional indicator to account for this.
The indicator also excludes many in the informal economy, and neither the goal nor the associated targets and indi-cators reflect this. Therefore, proxy indicators for progress within the informal economy are required. Similarly, there is a need to capture a measure of inclusive and sustainable wealth. One potential way to achieve this is the pro-posed Sustainable Development Index (SDI), designed to integrate economic, social and environmental sustainability together with the principles of universality, integration and transformation for all developed and developing nations (Chuluun, 2011, 2012), which would enable growth to be adjusted by inequality, thereby including inclusive growth(8).
Inequality (Goal 10):
Target 10.2 of the inequality goal aims by 2030 to empower and promote the social, economic and political inclu-sion of all, irrespective of age, sex, disability, race, ethnicity, origin, religion or economic or other status. The associa-ted indicator, with the World Bank as the custodian agency, is:
10.2.1 Proportion of people living below 50 per cent of median income, by age, sex and persons with disabilities.
While the indicator is conceptually clear and the methodology can be developed, there is not yet an agreed and tested methodology and as a result this is a Tier III indicator. Work is ongoing on the development of an internatio-nal standard using the same household income or consumption data used at national level to produce official esti-mates of income poverty.
The key challenge related to this indicator is the rejection of more conventional income inequality measures such as the Gini or the Palma ratio (Wilkinson and Rogers, 2015). The goal has neither qualitative nor quantitative endpoints, and the terminology ‘reducing inequalities’ is not clear in terms of which inequalities are to be addressed (wealth, income, etc.), thereby potentially enabling the goal to be monitored and even met without confronting core income and wealth differences that drive other dimensions of inequality (Muñoz and Chuluun, 2015). The addition of mea-surable targets would potentially enhance this target and make appraisal of progress easier.
Cities and settlements (Goal 11):
Target 11.1 is to ensure, by 2030, access for all to adequate, safe and affordable housing and basic services, and to upgrade slums. The associated indicator is:
11.1.1 Proportion of urban population living in slums, informal settlements or inadequate housing
An established, agreed and tested methodology exists to assess this indicator, which was previously used in the MDGs(9) and has been estimated for the past 15 years as part of MDG reporting. Data are available for all develo-ping countries, on approximately 400 cities, and thus this is a Tier I indicator. The UN Human Settlements Programme (UN-Habitat) is the custodian agency and currently provides technical support at national level on the estimation of this indicator.
Although quantifiable using existing data and metrics, this target has been criticised as being ambitious and essen-tially aspirational rather than attainable (Hsu et al., 2015). This raises questions as to the status, role and function of the SDGs.
(8) The SDI would include an economic index component related to inclusive economic growth, using a methodology of GNI per capita and income inequality; a social index component defined by expected life expectancy at birth as in the HDI; and an environmental index component defined by carbon footprint (CO2/capita) (Muñoz and Chuluun, 2015).
(9) Target 4: Achieve significant improvement in lives of at least 100 million slum dwellers by 2020.

37SUSTAINABLE DEVELOPMENT GOALS OVERVIEW
Sustainable development (Goal 17):
Two targets under Goal 17 relate indirectly to social protection, one concerning resource mobilisation (‘Strengthen domestic resource mobilization, including through international support to developing countries, to improve domes-tic capacity for tax and other revenue collection’) and one concerning policy coherence (‘Enhance policy coherence for sustainable development’).
The first target, on resource mobilisation, has two indicators:
17.1.1 Total government revenue as a proportion of GDP, by source, and
17.1.2 Proportion of domestic budget funded by domestic taxes.
Both are Tier I indicators with established methodologies and widely available data. The first has the World Bank as the custodian agency and the second IMF.
The second, relating to policy coherence, has as its indicator:
17.14.1 Number of countries with mechanisms in place to enhance policy coherence of sustainable development.
There is no established standard or methodology for this indicator. The UN Environment Programme (UNEP) is the custodian agency, in line with its work to promote policy coherence in relation to the environment and other fields at international, regional and national levels, but it is looking to collaborate with other agencies in developing metho-dologies for this currently Tier III indicator.
There are a number of challenges associated with the indicators relating to resource mobilisation. They do not dis-cuss the question of progress on international resource mobilisation and alternative financing mechanisms, as dis-cussed in the Bachelet Report (ILO, 2011) and Deacon (2013). They also fail to consider broader issues concerning government revenue generation and the composition of revenue in the light of global challenges relating to tax eva-sion, and responses such as the 2013 Organisation for Economic Co-operation and Development (OECD) Base Erosion and Profit Sharing (BEPS) action plan (OECD, 2013). Moreover, in terms of policy coherence, there is a need to directly link and align policy relating to this goal with the post-2020 climate change regime, the Doha Development Agenda of the World Trade Organization (WTO) and financing for development processes.
3.5. Discussion of SDG indicators as they relate to social protection
The aim of the indicator development process was to develop goals that are mutually acceptable to governments and agencies working in the sector and that conform to international standards, ensuring the indicator will be easy to understand, relevant to the objective, feasible and amenable to disaggregation. Inasmuch as only one of the five indicators reviewed has unanimously agreed Tier I status, ongoing work is required to achieve this. The focus on de-veloping provisional targets within a limited period of time in line with a fixed diplomatic process required a degree of pragmatism in the development of the SDG indicators, in line with the inherently political nature of the SDG pro-cess for agreeing goals and targets. The result in terms of indicators was a technical process subject to negotiated outcomes based on competing agency mandates and conceptions, government preferences, data availability or po-tential development and ready comprehensibility as well as technical adequacy. This resulted in indicators that are essentially compromises between what would be technically preferable and what is politically acceptable. The resul-ting indicators are recognised as not necessarily ideal, in terms of their function as indicators of progress towards the SDGs, but they are accepted as the result of political compromise.
The key challenge is that global monitoring should be based as much as possible on comparable and standardised national data, based on consistent conceptual definitions, provided through established reporting mechanisms from countries to the international statistical system. This implies increased standardisation and also strengthened natio-nal statistical offices and/or other national institutions and processes for international reporting (as envisaged in the work of the Global Action Plan for Data and the organisation of the biennial UN World Data Forum). A tension exists between the diversity of approaches and definitions currently used at national level and the desire to promote the domestication of the SDGs at national level, and associated national-level monitoring and reporting. The key chal-lenge here is to identify acceptable and generalisable definitions that can be consistently measured and will provide a meaningful indication of progress towards the goals and targets. The twin goals of global progress monitoring and the domestication of indicators and selection of those most relevant to national political priorities represents a challenge in this context, as the indicators will need to be adapted and applied at country level.

38 INDICATORS TO MEASURE SOCIAL PROTECTION PERFORMANCE: IMPLICATIONS FOR EC PROGRAMMING
There remain some unresolved questions relating to responsibility for aggregating and reporting globally, given the shift in focus from a supranational process, driven by MLAs, as in the case of the MDGs, to one driven and owned by member states. Key agencies such as the World Bank, ILO and UNICEF are likely to have different roles within the SDG monitoring process from those they performed under the MDGs, and a greater focus on supporting country-le-vel activity. How this will link to aggregate regional- and global-level analysis and synthesis remains to be decided.
Documentation indicates a degree of contestation between agencies over some key concepts (such as ‘coverage’ of social protection or health services, and affordability) and over associated methodologies and datasets. This reflects differences in agency-level definitions and mandates, as indicated by the discrepancies in the tier allocations given by the custodian agencies and the Secretariat. What is clear is the need for ongoing work to identify, agree and fi-nalise methodologies that are acceptable to member states and the range of agencies working in the social protec-tion sector, and to pinpoint, or in some cases gather or construct, the requisite datasets.
As we have noted, the indicators are in some instances suboptimal from a technical perspective, having been selec-ted as a result of political processes. Thus they represent challenges in terms of the ensuing need to develop appro-priate methodologies and data. The adequacy of the indicators for capturing the spirit and aspirations articulated in the language of the SDGs, and monitoring performance towards those goals, is limited in relation to social protec-tion. Inasmuch as indicators can serve to drive activity and resource prioritisation, this may constrain performance towards the more fundamental goals of equity and poverty reduction. This implies a role for the development of complementary indicators in programming aligned with the realisation of the SDGs by other agencies.
3.6. Appraisal of the SDGS using the analytical framework
Drawing on the conceptual overview and key considerations identified in developing and selecting quality indica-tors presented above, we discuss the SDGs in relation to the five-stage analytical framework set out in Section 2.3.
3.6.1. Definition of social protection
There is still a need to develop an agreed taxonomy of social protection in relation to the SDG indicators, and also a definition of key concepts used, such as coverage. This relates both to the composition of social protection (which components are included and how broadly it is defined) and also to ‘coverage’ (with regard to whether provision should include potential coverage in terms of all those with health, pension or unemployment insurance, or actual coverage based on usage at any one time). Different agencies currently adopt different approaches, and no agreed set of conceptual definitions has yet been developed.
3.6.2. Identification of objectives and targets and indicators
In considering the relationships between the goals, targets and indicators, we see that each indicator does relate back to the associated target, although they do not in all cases capture the key characteristics of the goal or the intent of the targets and do not necessarily shed light on performance against the objective overall. Thus the associated in-dicators do not in all cases adequately capture the SDG targets. They also sometimes miss significant components of the aspirations of the targets, for example excluding informal workers in the growth and employment target (8), or of the larger goals, in the case of the indicator selected to measure movements towards equity (10). In some ins-tances, existing well-developed indicators have been replaced with less adequate alternatives, as in the adoption of labour share as the key indicator of a reduction in inequality.
3.6.3. Choice of type of indicators and data sources
Indicator type
Many of the targets are open-ended and hence not easily quantifiable; others are aspirational rather than feasibly attainable (Hsu et al., 2015). While these choices are not necessarily problematic, they do introduce a degree of in-consistency in terms of how the indicators are to be understood, and also present difficulties in terms of attemp-ting to measure progress.
Although the SPF is at the core of the SDG text, there is little focus in the indicators on monitoring progress in terms of investment in building social protection systems (the legislative, administrative and policy context for extended provision). This would require monitoring process-oriented outcomes such as building capacity, setting up regulatory

39SUSTAINABLE DEVELOPMENT GOALS OVERVIEW
frameworks and promoting policy harmonisation, or implementing systems such as single national registries (Deacon and St Clair, 2015). This is of concern given the focus on ILO Recommendation 202 on Social Protection Floors and the critical role of the extension of legislative and policy frameworks to underpin this, or the development of any form of national social protection system. There are few quantifiable impact indicators relating to the core targets of poverty reduction overall, the contribution of social protection to poverty reduction, the percentage of the poo-rest served, overall fiscal incidence (see Bastagli, 2015) or changes in the Gini. Those that are quantitative do not necessarily have a quantified target or end point, but can be used to measure changes in performance rather than attainment of a specific goal.
The focus is on quantity of provision, using output indicators, rather than quality, which is problematic in terms of appraising the likely impact and value of interventions. The focus on coverage does not include any reference to the success or otherwise of poverty-targeting social protection provision, and other aspects of quality are also omitted, so this dimension of performance is missing.
Data
The indicators are based in part on pre-existing data, but will require the development of some new datasets: data do not exist to serve all the indicators, and much of what is needed is not available for all countries. There is signifi-cant variation in the availability, accessibility and usability of data between LICs, MICs and HICs, in particular in the ability to disaggregate key statistics as required.
While data are generally available in standardised national accounts relating to income poverty metrics and labour markets, this is less true for social protection coverage, and no full data exist on programme coverage, particularly when disaggregated by programme type.
The lack of agreement on what constitutes social protection (and associated inconsistent data-gathering across agencies) and coverage engenders challenges related to agreement on the appropriate data source and methodo-logy. This will require resolution once the terms are agreed.
Lack of data to cover the issues included in the social protection-related indicators confirms the need to invest in improving data quality at national level, particularly in LICs and MICs if the SDG indicators are to be fully functio-nal. The need to invest in improved data-gathering at country level in order to enable adequate indicators is ac-knowledged in the SDG process.
The SDGs recognise the critical role of data – that data are a tool for development, and as such part of the SDG pro-ject. Target 17.18 explicitly aims to ‘increase significantly the availability of high-quality data’.
3.6.4. Indicator performance
The indicators are broadly relevant, acceptable, credible, easy and robust, but most are not yet fully worked through to Tier I status (a significant number of those reviewed have not yet achieved Tier I status, lacking either or both of the agreed and tested methodologies or the requisite data), and their adequacy is open to debate. Many do not conform to the SMART or RACER checklists, largely because the process to develop them has been one of compro-mise and ‘second best’, so as to facilitate overall progress in the SDG process.
Perhaps the most important issue is the quality of the indicators: in some instances they fail to capture the intent of their associated targets and goals, or capture only one dimension of a complex concept, and may not do so adequa-tely. Therefore, they may not serve effectively to measure progress, for example on reducing inequality, or to guide policy decision and priorities. They may also skew incentives and programming outcomes away from the primary in-tention of the goal, given the function of indicators in driving decision-making and resource flows.
The indicators reviewed are weak in terms of quantifying poverty and inequality outcomes. They are also weak in terms of their ability to capture progress relating to processes linked to social protection. There is an absence of indicators monitoring progress on social protection-related systems development (legislation, policy frameworks, etc.) concerning redistribution and rights (see discussion in Deacon and St Clair, 2015), which is key to the objectives of the SPF, for example.
The indicators are not in all cases linked to existing evaluation and indicator frameworks for international processes already in progress, such as the SPF, despite the latter’s centrality in the targets. ILO has set out a variety of options

40 INDICATORS TO MEASURE SOCIAL PROTECTION PERFORMANCE: IMPLICATIONS FOR EC PROGRAMMING
relating to incorporation of the SPF into the SDGs, presenting a selection of the targets and associated indicators together with information on data availability and the range of potential coverage targets that could be adopted, in addition to the aggregated indicator selected for the SDG indicator framework. Selected Goal 1 target and indicator options are set out in Table 2 below, to illustrate the range of potential options for coverage.
3.6.5. Political economy
While social protection is fundamentally an issue of national redistribution, the SDG indicator framework noticeably avoids indicator options that imply the adoption of a more redistributive development agenda, both nationally and internationally. Examples of this conservatism is are the use of the ‘labour share’ (Indicator 10.4) in preference to es-tablished income inequality indicators in relation to target 10.4 (adopt policies, including social protection, to achieve equality) and the prioritisation of indicators to capture domestic, rather than international, financing of poverty re-duction and essential services including social policy (Indicators 1.a.1 and 1.a.2), and the associated omission of re-ference to alternative international financing sources, such as the proposed Global Fund, as set out for example in ILO, 2011, and Deacon, 2013. The absence of established indicators to measure redistribution and equity in terms of income and wealth is also a sign of this somewhat conservative agenda.
The Tier II status of some established indicators is indicative of ongoing institutional contestation of both definitions (e.g. social protection ‘coverage’ differences between the ILO and World Bank) and spheres of influence, reflecting differing organisational mandates and conceptions. This is part of a broader institutional ‘war of position’ for institu-tional dominance in the social protection debate (Deacon, 2007; McCord, 2013), which is not yet resolved. Similarly, failure to ensure that SPF process indicators are reflected in the SDG indicators may also point to a less than unani-mous endorsement of the concept as being at the core of Agenda 2030 by member states and development agencies.
The indicators also reflect a particular, and arguably outdated, tradition of conceptualising both social protection and labour markets with reference to formal workers within the labour market, illustrating the ongoing challenge of incorporating the informal workers who comprise the majority of the labour force in most LICs and many MICs (McCord and Slater, 2014) within social protection schemes.
Target Indicator Data availability
All older persons receive an adequate pension
Share of persons above retirement age that benefit from an old-age pension
All children receive appropriate support Share of families with children that re-ceive support
109 countries have a child or fami-ly allowance scheme. There is not yet a consolidated figure for families with children receiving support; data are wi-dely available for this target.
Those of working age without jobs re-ceive adequate support
Share of unemployed of active age who receive a regular unemployment benefit
Unemployment indicators are available for 79 of the 85 countries where bene-fits are available.
All persons with disabilities receive ap-propriate support
Share of persons with severe disabilities who receive a regular disability benefit
171 countries have disability benefit programmes and administrative data.
All women receive support in case of maternity
Share of pregnant women or recent mo-thers who receive maternity benefits
139 countries have a formal maternity benefit programme.
All workers are covered against em-ployment injury
Share of those covered against an occu-pational accident
172 countries administer employment injury programmes.
The labour force contributes to social security
Share of persons aged 15+ contributing to a pension scheme
Data exist for this target in 164 countries.
All countries have a National Social Protection Strategy
Number of countries that have a natio-nal strategy
More resources are allocated to social protection
Social protection expenditures as a percentage of GDP
Data are available for 178 countries.
Increase the share of persons with so-cial protection coverage during the life cycle
Share of persons covered in all areas of social protection, a result of the develop-ment of the previous indicators
Source: Ortiz et al. (2014)
Table 2: ILO social protection target options

41SUSTAINABLE DEVELOPMENT GOALS OVERVIEW
In some cases, the indicator selected is not acceptable to the custodian agencies, for example indicators to capture UHC under Target 3.8, where WHO does not accept the IAEG-SDG proposal (see section 3.4 above). This suggests that factors other than exclusively technical considerations may be driving indicator selection.
3.7. Assessment of indicator comparability
Pending the resolution of issues of methodology and definitions, there is some uncertainty about the level of indi-cator comparability of the SDGs in relation to pre-existing indicators currently in use by the other key agencies en-gaged in social protection provision. These indicators are not, and cannot be, consistent with pre-existing metho-dologies in all cases, as there is significant variation in the indicators and/or methodologies different agencies use in relation to social protection outcomes (Bonnet and Tessier, 2013). The SDG indicators by definition cannot incor-porate this diversity but will rather have to choose one of a plurality of approaches, or alternatively one that is se-parate from existing approaches. The more that ILO-related indicators, used in common across a range of institu-tions (see Section 4) and countries, are adopted in the SDG process, the higher the indicator comparability and use of common datasets will be across these agencies. However, agencies, including the World Bank, will not necessa-rily adopt different conceptual approaches relating to labour markets, coverage and social protection content. The adoption of ILO-related indicators would enhance consistency with national-level indicators, in that ILO has an es-tablished record of supporting provision of data on its priority indicators at national level.
Given that the SDGs provide new indicators and methodologies, or ones not currently in general use, to measure glo-bal trends over the coming decades, this will represent a challenge to the wider social protection community, whe-ther revising their own indicators in order to promote consistency, with attendant benefits of cost efficiency etc., at agency and country level, or continuing to invest in the production of alternative indicators. Some combination of convergence and complementarity is the most likely outcome, although continued duplication on some indicators is also to be expected.
However, greater comparability in this context does not necessarily mean superior indicators, in terms of capturing measurement towards the target. This is indicated by the relative downplaying of informal workers in the ILO-related indicators and the gap between legal provision and actual coverage. Therefore, there may be trade-offs between comparability and adequacy.
It is likely there will ultimately be a high level of comparability between country reporting if the SDGs are adopted at national level, as they will be based on common datasets, although the quality and the extent of disaggregation possible are likely to be lower in LICs. This will, however, depend on the extent to which countries ‘domesticate’ the targets and indicators to suit their own preferences and datasets. The degree of variation in reporting this engen-ders could adversely affect the potential for cross-country comparison and aggregation.
This section has provided a critical perspective on the indicators selected to capture progress against the SDG tar-gets. The findings raise a question about the extent to which, given further attention, they have the potential to be-come meaningful indicators, given the inherently political nature of the process.

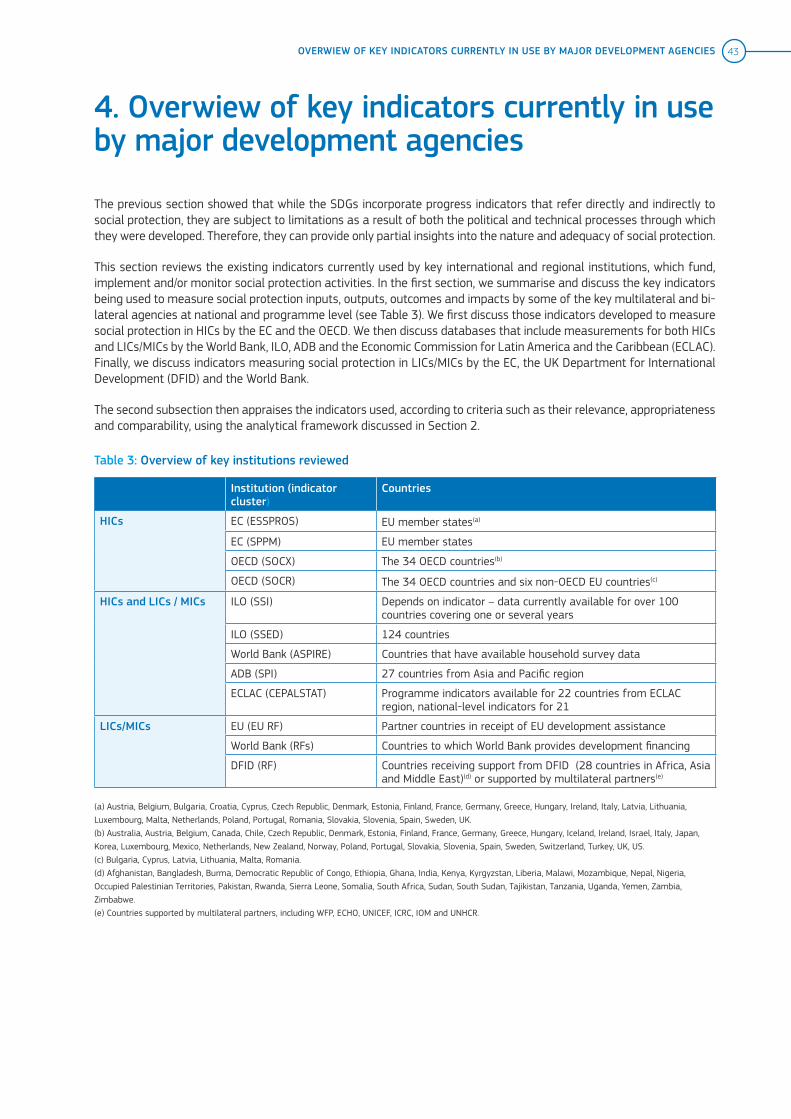
43OVERWIEW OF KEY INDICATORS CURRENTLY IN USE BY MAJOR DEVELOPMENT AGENCIES
4. Overwiew of key indicators currently in use by major development agencies
The previous section showed that while the SDGs incorporate progress indicators that refer directly and indirectly to social protection, they are subject to limitations as a result of both the political and technical processes through which they were developed. Therefore, they can provide only partial insights into the nature and adequacy of social protection.
This section reviews the existing indicators currently used by key international and regional institutions, which fund, implement and/or monitor social protection activities. In the first section, we summarise and discuss the key indicators being used to measure social protection inputs, outputs, outcomes and impacts by some of the key multilateral and bi-lateral agencies at national and programme level (see Table 3). We first discuss those indicators developed to measure social protection in HICs by the EC and the OECD. We then discuss databases that include measurements for both HICs and LICs/MICs by the World Bank, ILO, ADB and the Economic Commission for Latin America and the Caribbean (ECLAC). Finally, we discuss indicators measuring social protection in LICs/MICs by the EC, the UK Department for International Development (DFID) and the World Bank.
The second subsection then appraises the indicators used, according to criteria such as their relevance, appropriateness and comparability, using the analytical framework discussed in Section 2.
Table 3: Overview of key institutions reviewed
Institution (indicator cluster)
Countries
HICs EC (ESSPROS) EU member states(a)
EC (SPPM) EU member states
OECD (SOCX) The 34 OECD countries(b)
OECD (SOCR) The 34 OECD countries and six non-OECD EU countries(c)
HICs and LICs / MICs ILO (SSI) Depends on indicator – data currently available for over 100 countries covering one or several years
ILO (SSED) 124 countries
World Bank (ASPIRE) Countries that have available household survey data
ADB (SPI) 27 countries from Asia and Pacific region
ECLAC (CEPALSTAT) Programme indicators available for 22 countries from ECLAC region, national-level indicators for 21
LICs/MICs EU (EU RF) Partner countries in receipt of EU development assistance
World Bank (RFs) Countries to which World Bank provides development financing
DFID (RF) Countries receiving support from DFID (28 countries in Africa, Asia and Middle East)(d) or supported by multilateral partners(e)
(a) Austria, Belgium, Bulgaria, Croatia, Cyprus, Czech Republic, Denmark, Estonia, Finland, France, Germany, Greece, Hungary, Ireland, Italy, Latvia, Lithuania, Luxembourg, Malta, Netherlands, Poland, Portugal, Romania, Slovakia, Slovenia, Spain, Sweden, UK.(b) Australia, Austria, Belgium, Canada, Chile, Czech Republic, Denmark, Estonia, Finland, France, Germany, Greece, Hungary, Iceland, Ireland, Israel, Italy, Japan, Korea, Luxembourg, Mexico, Netherlands, New Zealand, Norway, Poland, Portugal, Slovakia, Slovenia, Spain, Sweden, Switzerland, Turkey, UK, US.(c) Bulgaria, Cyprus, Latvia, Lithuania, Malta, Romania.(d) Afghanistan, Bangladesh, Burma, Democratic Republic of Congo, Ethiopia, Ghana, India, Kenya, Kyrgyzstan, Liberia, Malawi, Mozambique, Nepal, Nigeria, Occupied Palestinian Territories, Pakistan, Rwanda, Sierra Leone, Somalia, South Africa, Sudan, South Sudan, Tajikistan, Tanzania, Uganda, Yemen, Zambia, Zimbabwe.(e) Countries supported by multilateral partners, including WFP, ECHO, UNICEF, ICRC, IOM and UNHCR.
44 INDICATORS TO MEASURE SOCIAL PROTECTION PERFORMANCE: IMPLICATIONS FOR EC PROGRAMMING
4.1. Overview of social protection indicators used by key institutions
4.1.1. Indicators measuring social protection in HICs(10)
European Commission
The EC currently has two tools that measure social protection, focusing on social protection in EU member states; the European System of Integrated Social Protection Statistics (ESSPROS) and the Social Protection Performance Monitor (SPPM) dashboard.
Furthermore, progress on fighting poverty and social exclusion within Europe 2020, the European Union’s ten-year growth strategy(11) , is measured by the headline indicator ‘people at risk of poverty or social exclusion’ (AROPE), consisting of three component indicators: monetary poverty (AROP), severe material deprivation (SMD) and very low work intensity (VLWI):
― Monetary poverty is measured by the at-risk-of-poverty (AROP) rate, calculated as the share of people with a disposable household income (taking into account direct taxes and social contributions and also receipt of social protection interventions) below 60 % of the national median equivalised disposable income.
― SMD is an absolute measure of poverty and gives an indication of the proportion of people whose living stan-dards are affected by a lack of resources, measured by the enforced inability to pay for at least four out of ten defined elements of a decent living standard.
― Finally VLWI is defined as the number of persons living in a household having a work intensity below a threshold set at 0.20. The work intensity of a household is the ratio of the total number of months that all working-age household members have worked during the income reference year. VLWI is a measure for exclusion of the labour market which is been seen as an essential cause for social exclusion.
ESSPROS was developed in the 1970s by Eurostat jointly with representatives of the member states of the EU. It is a common framework that enables comparison between European countries of social benefits to households and their financing in the EC member states. ESPROSS is geared towards international comparability and harmonisation with other statistics, particularly national accounts, in its main concepts. It is based on an annually collected set of data on the receipts and expenditures of social protection schemes in the EU (input and output indicators) and is structured around different social protection schemes covering eight functions: sickness/health care, disability, old age, survivors, family/children, unemployment, housing, and social exclusion not elsewhere classified. The main indi-cators covered include expenditure and receipts.
(10) There are other high-income databases that also report on social protection and social policy objectives, including the Comparative Welfare Entitlements Dataset (http://cwed2.org/) and the Social Policy Indicators database (http://www.sofi.su.se/spin/), but these are not discussed further here.
(11) http://ec.europa.eu/europe2020/europe-2020-in-a-nutshell/targets/index_en.htm

45OVERWIEW OF KEY INDICATORS CURRENTLY IN USE BY MAJOR DEVELOPMENT AGENCIES
Table 4: Selected social protection indicators in ESSPROS
Indicator Further information / definition
Input indicators
Expenditure on social protection by function (sickness/health care, disability, old age, survivors, family/children, unemployment, housing, and social exclusion)
Social protection expenditure includes:
― social benefits, which consist of transfers, in cash or in kind, to households and individuals to relieve them of the burden of a defined set of risks or needs
― administration costs, which represent the costs charged to the scheme for its management and administration
― transfers to other schemes; unrequited payments made to other social protection schemes (i.e. transfer of funds by one scheme to reduce the deficit of another)
― other expenditure, which consists of miscellaneous expenditure by social protection schemes (payment of property income (normally interests for loans) and other expenditure such as payment of taxes on income or wealth), calculated in current prices expressed using following denominators: ● as % of GDP
● per head of population
● per inhabitant.
Expenditure on pensions current prices (% of GDP)
Comprises part of periodic cash benefits under disability, old age, survivors and unemployment functions. Defined as the sum of the following social benefits: disability pension, early retirement owing to reduced capacity to work, old age pension, anticipated old age pension, partial pension, survivors’ pension, early retirement benefit for labour market reasons.
Expenditure on care for elderly (% of GDP)
These expenditures cover care allowance, accommodation and assistance in carrying out daily tasks.
Total expenditure on social protection (benefits, administration costs or other expenditure) (% of total expenditure on social protection)
Social protection includes social benefits (transfers, in cash or in kind, to households and individuals to relieve them of the burden of a defined set of risks or needs); administration costs (costs charged to the scheme for its management and administration); other expenditure (miscellaneous expenditure by social protection schemes – payment of interests for loans and other), calculated in current prices.
Output indicators
Social protection receipts, by type (% of GDP)
Receipts include:
― social contributions
― general government contributions
― transfers from other schemes
― other receipts.
Source: http://ec.europa.eu/eurostat/web/social-protection/overview
Data sources: Information is collected annually for ESSPROS through the use of questionnaires drawing on natio-nal-level sources.
Countries covered: EU country member states.
Key points: The ESSPROS manual (2011) states that there is no universally accepted definition of the scope of social protection, and has therefore formulated a ‘conventional’ definition of the scope of social protection to try to meet the needs of social policy analysis and data collection on an international level. The definition used is, ‘Social protec-tion encompasses all interventions from public or private bodies intended to relieve households and individuals of the burden of a defined set of risks or needs, provided that there is neither a simultaneous reciprocal nor an indivi-dual arrangement involved’(12). The risks or needs are the eight functions of social protection above.
The indicators covered by ESSPROS provide a detailed insight into the financial resources allocated to the full range of different types of social protection, expressed as a proportion of GDP and by population. They also allow for a pic-ture of the proportions spent on benefits relative to administrative and other costs. The indicator for social protection receipts gives a basic picture of the numbers of beneficiaries receiving different types of social protection. However, while aggregate expenditures give some sense of the level of benefits being targeted, which can be compared against
(12) http://ec.europa.eu/eurostat/documents/3859598/5917481/KS-RA-11-014-EN.PDF/ee86d517-3348-4c20-94ee-a37c330755b1

46 INDICATORS TO MEASURE SOCIAL PROTECTION PERFORMANCE: IMPLICATIONS FOR EC PROGRAMMING
the number of recipients to give some idea of average benefit levels, what is missing are indicators of the adequacy of social protection received, for example in relation to national poverty lines or GNI.
The second tool is the Social Protection Performance Monitor (SPPM) dashboard. Developed in 2012 by the SPC, this is a relatively new tool with the overarching objective to reinforce and support coordination of social policy and multilateral surveillance of social protection policies in the EU, in order to bring results of major social trends to the attention of the European Council (SPC, 2012).
It draws on the existing EU portfolio of indicators on social protection and social inclusion, which are the main source for the indicators included (SPC, 2012). It is based on the indicators developed by the ISG and makes use of natio-nal data and information (both qualitative and quantitative to ensure national contexts are taken into account) from the existing EU portfolio of indicators (ibid).
SPPM is consistent with the Joint Assessment Framework and incorporates all three strands of the EU cooperation in the field of social protection and social inclusion: social inclusion, pensions, health care and long-term care (ibid).
Table 5: Selected social protection indicators in SPPM
Indicator Further information / definition
Outcome indicators
Aggregate replacement ratio To assess pension adequacy by measuring median individual pension income of those aged 65-74 as % of median individual earnings of population aged 50-59
Impact indicators
Impact of social transfers (excluding pensions) on poverty reduction
To assess effectiveness of social protection by calculating the percentage point change from previous ‘at-risk-of-poverty’ level (before the social transfers)
To assess effectiveness of social protection by measuring share of persons aged 0-59 with an equivalised disposable income below 60% of the national equivalised median income who live in households where working-age adults (18-59) worked less than 20% of their total work potential during the past year
Source: http://ec.europa.eu/social/main.jsp?catId=758
Data sources: Eurostat, EU Statistics on Income and Living Conditions (SILC).
Countries covered: EU member states.
Key points: The indicators above add an important dimension to those from the ESSPROS in that they provide fur-ther details on the adequacy of pensions and also an indicator to allow some sense of the impact of social pro-tection. However, there are limitations. For example, the impact of social transfers is measured in terms of the re-duction in the ‘at-risk-of-poverty rate’ in percentage terms owing to social transfers, calculated as the percentage difference between the at-risk-of-poverty rate before and after social transfers. Like the World Bank ASPIRE impact indicators (discussed below), this indicator is based on the simulated effect of transfers on poverty, providing a sta-tic picture of the impact of social transfers, and does not account for any dynamic effects arising from their receipt.
Organisation for Economic Co-operation and Development
The OECD has two key tools to measure social protection. First, the Social Expenditure Database (SOCX) was de-veloped in the 1990s to monitor trends in national expenditure on social protection, including changes in its composi-tion. As with ILO, the indicators cover schemes that fall into a number of different categories depending on the func-tion of the social protection scheme and the needs and risks it addresses(13). SOCX includes statistics on public and (mandatory and voluntary) private social expenditure at programme level as well as net social spending indicators.
(13) Social policy areas covered are old age, survivors, incapacity-related benefits, health, family, active labour market pro-grammes, unemployment, housing and other social policy areas.
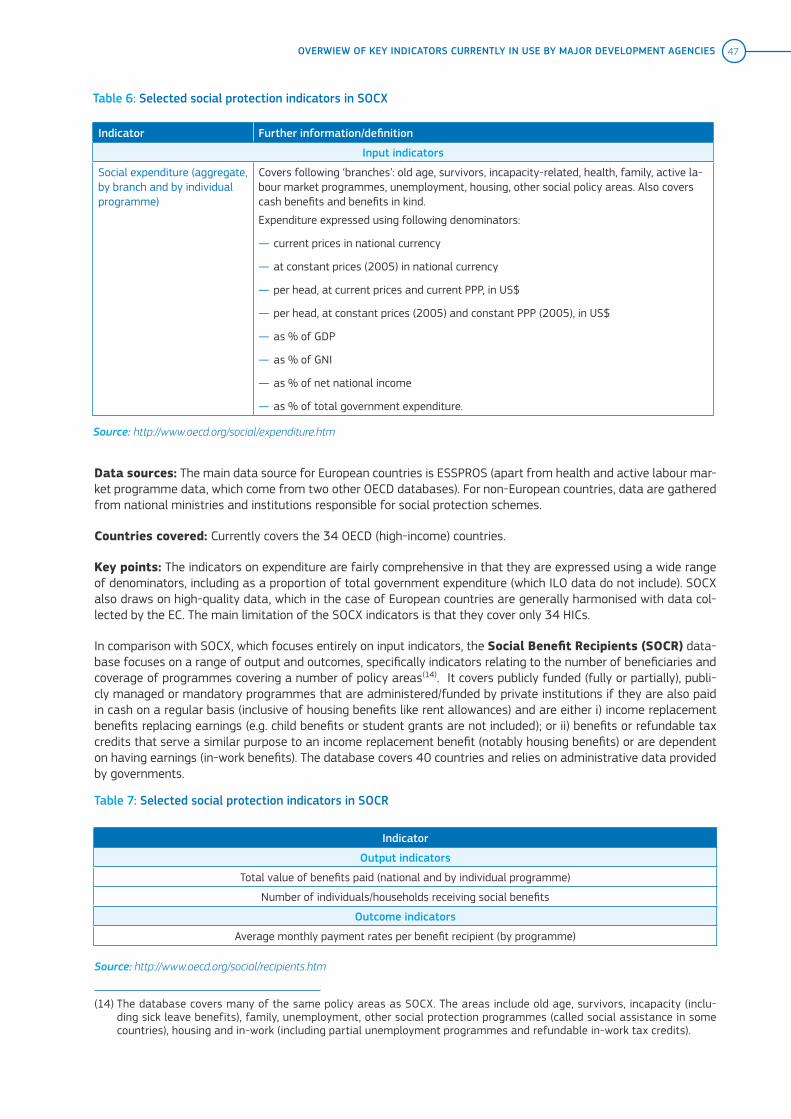
47OVERWIEW OF KEY INDICATORS CURRENTLY IN USE BY MAJOR DEVELOPMENT AGENCIES
Data sources: The main data source for European countries is ESSPROS (apart from health and active labour mar-ket programme data, which come from two other OECD databases). For non-European countries, data are gathered from national ministries and institutions responsible for social protection schemes.
Countries covered: Currently covers the 34 OECD (high-income) countries.
Key points: The indicators on expenditure are fairly comprehensive in that they are expressed using a wide range of denominators, including as a proportion of total government expenditure (which ILO data do not include). SOCX also draws on high-quality data, which in the case of European countries are generally harmonised with data col-lected by the EC. The main limitation of the SOCX indicators is that they cover only 34 HICs.
In comparison with SOCX, which focuses entirely on input indicators, the Social Benefit Recipients (SOCR) data-base focuses on a range of output and outcomes, specifically indicators relating to the number of beneficiaries and coverage of programmes covering a number of policy areas(14). It covers publicly funded (fully or partially), publi-cly managed or mandatory programmes that are administered/funded by private institutions if they are also paid in cash on a regular basis (inclusive of housing benefits like rent allowances) and are either i) income replacement benefits replacing earnings (e.g. child benefits or student grants are not included); or ii) benefits or refundable tax credits that serve a similar purpose to an income replacement benefit (notably housing benefits) or are dependent on having earnings (in-work benefits). The database covers 40 countries and relies on administrative data provided by governments.
(14) The database covers many of the same policy areas as SOCX. The areas include old age, survivors, incapacity (inclu-ding sick leave benefits), family, unemployment, other social protection programmes (called social assistance in some countries), housing and in-work (including partial unemployment programmes and refundable in-work tax credits).
Indicator Further information/definition
Input indicators
Social expenditure (aggregate, by branch and by individual programme)
Covers following ‘branches’: old age, survivors, incapacity-related, health, family, active la-bour market programmes, unemployment, housing, other social policy areas. Also covers cash benefits and benefits in kind.
Expenditure expressed using following denominators:
― current prices in national currency
― at constant prices (2005) in national currency
― per head, at current prices and current PPP, in US$
― per head, at constant prices (2005) and constant PPP (2005), in US$
― as % of GDP
― as % of GNI
― as % of net national income
― as % of total government expenditure.
Source: http://www.oecd.org/social/expenditure.htm
Table 6: Selected social protection indicators in SOCX
Indicator
Output indicators
Total value of benefits paid (national and by individual programme)
Number of individuals/households receiving social benefits
Outcome indicators
Average monthly payment rates per benefit recipient (by programme)
Source: http://www.oecd.org/social/recipients.htm
Table 7: Selected social protection indicators in SOCR

48 INDICATORS TO MEASURE SOCIAL PROTECTION PERFORMANCE: IMPLICATIONS FOR EC PROGRAMMING
Data sources: Data provided or published by country administrations.
Countries covered: Currently covers the 34 OECD (high-income) countries, plus six non-OECD EU countries.
Key points: The indicators provide a comprehensive overview of the number of beneficiaries of a wide range of dif-ferent social protection schemes and the proportions these represent of wider reference populations. They also give a sense of average benefits paid. However, aside from providing information to calculate coverage rates, they do not provide an insight into the adequacy, effectiveness or impact of the transfers.
4.1.2. Indicators measuring social protection in HICs and MICs/LICs
International Labour Organization
ILO has two main tools that measure social protection in HICs and MICs/LICs.
The first is the Social Security Inquiry (SSI) database, which collects statistical data from around the world at two levels: national data and scheme-level data. Data collection at the national level focuses on social protection expenditure and receipts of social protection schemes, and at the programme/scheme level on expenditure and re-ceipts as well as data on beneficiaries and benefits provided by the schemes. The idea behind the SSI database is to address the lack of comparable social protection statistics outside the OECD, which is why it aims to be compatible with existing frameworks such as the EU’s ESSPROS and the OECD’s SOCX. The SSI database defines schemes by the functions they play and risks and needs they address, in line with the framework used by ESSPROS(15).
(15) Eleven functions are covered, including old age, disability, survivors, sickness and health, unemployment, employment injury and occupational disease, family/children and maternity. These are supplemented by three other functions that come under a wider definition of social protection: housing, basic education and other income support and assistance/social exclusion.
Table 8: Selected social protection indicators in the SSI database
Indicator Further information/definition
Input indicators
Total social expenditure (from scheme questionnaires) (as % of total public expenditure)
Public social protection expenditure ex-cluding health benefit in kind (as % of GDP)
Social expenditure covers social benefits, administration costs, transfer to other schemes and other expenditure relating to all schemes concerning the following functions: old age, invalidity/disability, survivors, sickness and health, maternity, employment injury and occupational disease, unemployment, family and children, housing, basic education, other income support and assistance.
Public social protection expenditure on old age and survivors benefits (as % of GDP)
Old age covers all benefits paid to persons who have withdrawn from the labour market owing to retirement, and benefits are payable to people who meet a cer-tain number of qualifying conditions. Survivors covers the benefit accorded to de-pendants of a protected person as a result of the death of this protected person.
Public social protection expenditure on benefits for children (as % of GDP)
Function described as ‘family and children’ in ILO Social Security Inquiry Ma-nual, which ‘covers benefits which are provided to families to help meet costs and needs related to child-raising and the support of other dependants. Gene-rally speaking, family benefits are provided for children up to a certain age limit (usually linked to the compulsory school leaving age or the age at which higher studies are completed)’.
Public social protection expenditure on benefits for working age (as % of GDP)
Core employment indicators are broken down by age group (0-14; 15-64; 65+).
Outcome indicators
Unemployed receiving unemployment benefits (as % of those unemployed)
Unemployed defined as ‘those persons who were without work, available for work and seeking work during the reference period’.
Old age pension recipient ratio above retirement age (as % of those above retirement age)
Pension includes means-tested – periodic benefit.
Note: The SSI database covers a wide range of indicators, some of them more relevant to HICs. The above represent the core indicators relevant for MICs/LICs. Other information is also collected through the SSI database questionnaire, covering legisla-tive frameworks, scheme information and country context information (ILO, 2005, 2016).
Source: Drawn from country examples from SSI database (http://www.ilo.org/dyn/ilossi/ssimain.home)
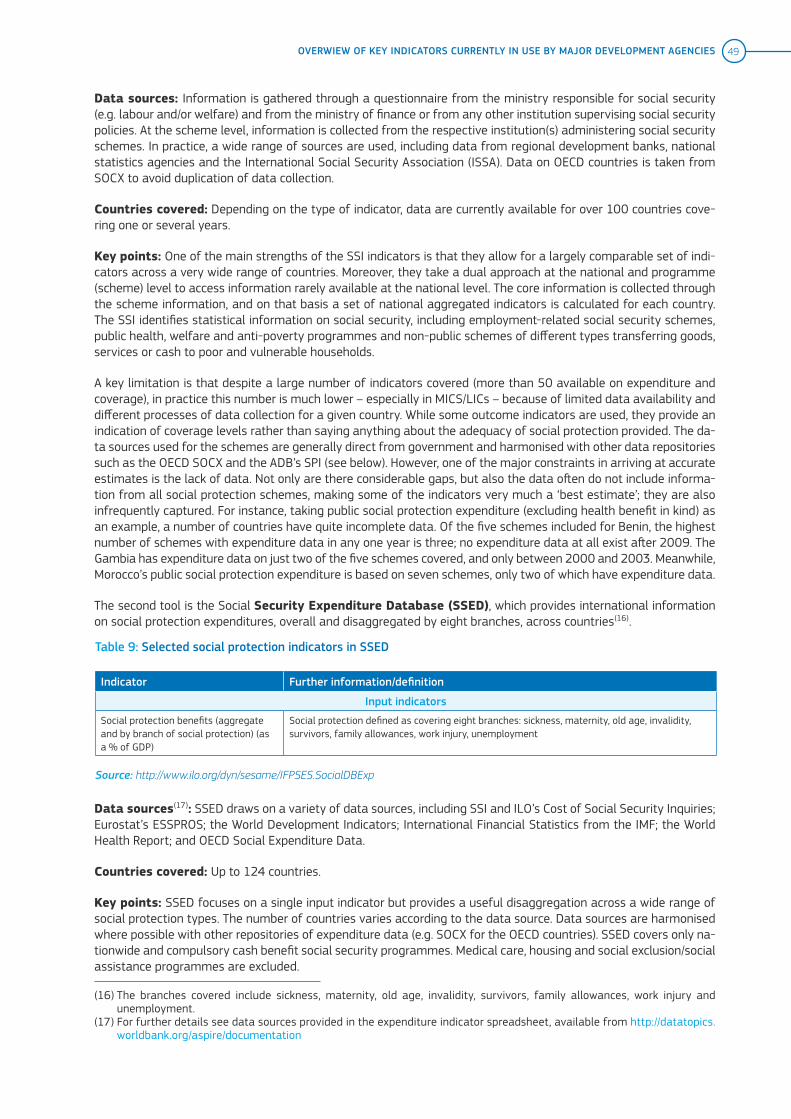
Data sources: Information is gathered through a questionnaire from the ministry responsible for social security (e.g. labour and/or welfare) and from the ministry of finance or from any other institution supervising social security policies. At the scheme level, information is collected from the respective institution(s) administering social security schemes. In practice, a wide range of sources are used, including data from regional development banks, national statistics agencies and the International Social Security Association (ISSA). Data on OECD countries is taken from SOCX to avoid duplication of data collection.
Countries covered: Depending on the type of indicator, data are currently available for over 100 countries cove-ring one or several years.
Key points: One of the main strengths of the SSI indicators is that they allow for a largely comparable set of indi-cators across a very wide range of countries. Moreover, they take a dual approach at the national and programme (scheme) level to access information rarely available at the national level. The core information is collected through the scheme information, and on that basis a set of national aggregated indicators is calculated for each country. The SSI identifies statistical information on social security, including employment-related social security schemes, public health, welfare and anti-poverty programmes and non-public schemes of different types transferring goods, services or cash to poor and vulnerable households.
A key limitation is that despite a large number of indicators covered (more than 50 available on expenditure and coverage), in practice this number is much lower – especially in MICS/LICs – because of limited data availability and different processes of data collection for a given country. While some outcome indicators are used, they provide an indication of coverage levels rather than saying anything about the adequacy of social protection provided. The da-ta sources used for the schemes are generally direct from government and harmonised with other data repositories such as the OECD SOCX and the ADB’s SPI (see below). However, one of the major constraints in arriving at accurate estimates is the lack of data. Not only are there considerable gaps, but also the data often do not include informa-tion from all social protection schemes, making some of the indicators very much a ‘best estimate’; they are also infrequently captured. For instance, taking public social protection expenditure (excluding health benefit in kind) as an example, a number of countries have quite incomplete data. Of the five schemes included for Benin, the highest number of schemes with expenditure data in any one year is three; no expenditure data at all exist after 2009. The Gambia has expenditure data on just two of the five schemes covered, and only between 2000 and 2003. Meanwhile, Morocco’s public social protection expenditure is based on seven schemes, only two of which have expenditure data.
The second tool is the Social Security Expenditure Database (SSED), which provides international information on social protection expenditures, overall and disaggregated by eight branches, across countries(16).
Data sources(17): SSED draws on a variety of data sources, including SSI and ILO’s Cost of Social Security Inquiries; Eurostat’s ESSPROS; the World Development Indicators; International Financial Statistics from the IMF; the World Health Report; and OECD Social Expenditure Data.
Countries covered: Up to 124 countries.
Key points: SSED focuses on a single input indicator but provides a useful disaggregation across a wide range of social protection types. The number of countries varies according to the data source. Data sources are harmonised where possible with other repositories of expenditure data (e.g. SOCX for the OECD countries). SSED covers only na-tionwide and compulsory cash benefit social security programmes. Medical care, housing and social exclusion/social assistance programmes are excluded.
(16) The branches covered include sickness, maternity, old age, invalidity, survivors, family allowances, work injury and unemployment.
(17) For further details see data sources provided in the expenditure indicator spreadsheet, available from http://datatopics.worldbank.org/aspire/documentation
49OVERWIEW OF KEY INDICATORS CURRENTLY IN USE BY MAJOR DEVELOPMENT AGENCIES
Table 9: Selected social protection indicators in SSED
Indicator Further information/definition
Input indicators
Social protection benefits (aggregate and by branch of social protection) (as a % of GDP)
Social protection defined as covering eight branches: sickness, maternity, old age, invalidity, survivors, family allowances, work injury, unemployment
Source: http://www.ilo.org/dyn/sesame/IFPSES.SocialDBExp

50 INDICATORS TO MEASURE SOCIAL PROTECTION PERFORMANCE: IMPLICATIONS FOR EC PROGRAMMING
World Bank
The World Bank’s Atlas of Social Protection Indicators of Resilience and Equity (ASPIRE) is a repository of international indicators aiming to provide a comprehensive set of comparable and accessible indicators to measure the performance of social protection and labour (SPL) market systems. The ASPIRE portal provides a set of indica-tors covering the performance of social assistance, social insurance and labour market programmes as well as the country context where relevant programmes operate. The indicators used cover both the expenditure, size and ‘per-formance’ of social protection systems, with different data sources and coverage for each.
Table 10: Selected social protection indicators in ASPIRE
Indicator Further information /definition
Input indicators
Total programme expenditure on social assistance as % of GDP (overall and by ‘harmonised programme categoryùa
Total programme expenditure includes spending on benefits and on administrative costs
Outcome indicators
Coverage (number of individuals in quintile who live in a household where at least one member receives the transfer)/(number of individuals in that quintile)
Overlap and duplication of programmes % of population receiving no programme or % of beneficiaries receiving one or more different programmes
Average per capita transfer Average per capita transfer among beneficiaries (daily 2005 PPP US$); for each household per capita average transfer is estimated as total transfers received divided by household size
Transfer adequacy Amount of transfers received by a quintile/total income or consumption of beneficiaries in that quintile
Targeting performance (benefit incidence)
(sum of all transfers received by all individuals in the quintile)/(sum of all transfers received by all individuals in the population); includes both direct and indirect beneficiaries
Targeting performance(beneficiary incidence)
(number of individuals in each quintile who live in household where at least one member participates in an SPL programme)/(number of individuals par-ticipating in SPL programmes in the population); includes both direct and indirect beneficiaries
Benefit-cost ratios Reduction in poverty gap obtained for each $1 spent on SPL programme, calculated as (poverty gap before transfer - poverty gap after transfer)/total transfer amount
Impact indicators
Impact on poverty gap reduction Simulated change (%) on poverty gap owing to SPL programmes calculated as (poverty gap pre transfer - poverty gap post transfer)/ poverty gap pre transfer
Impact on poverty headcount reduction Simulated change (%) on poverty headcount owing to SPL programmes calculated as (poverty headcount pre transfer - poverty headcount post transfer)/poverty headcount pre transfer
Impact on inequality reduction Simulated % change on Gini inequality coefficient owing to SPL programmes computed as (inequality pre transfer - inequality post transfer)/inequality pre transfer
Note: Many indicators provide disaggregated information by programme type (social assistance, social insurance and labour market programmes) as well as by wealth quintile.
Sources: http://datatopics.worldbank.org/aspire and http://datatopics.worldbank.org/aspire/documentation
a Only aggregate data on total social assistance expenditure are available (expenditure data on social insurance and labour market pro-
grammes not yet). Categories with expenditure data available include cash transfers, conditional cash transfers, fee waivers, in-kind, other
social assistance, public works, school feeding and social pension. Disaggregated data are not available for 21 countries. For a full list of
harmonised programme categories see http://siteresources.worldbank.org/SOCIALPROTECTION/Resources/280558-1353009461419/ASPIRE_
Programs_Classification.pdf

51OVERWIEW OF KEY INDICATORS CURRENTLY IN USE BY MAJOR DEVELOPMENT AGENCIES
Data sources: (Expenditure indicators) national ministries; World Bank Social Protection expenditure and evalua-tion Database (SPeeD); regional development banks; multilateral and other institutions such as ILO and HelpAge. (Performance indicators) nationally representative household survey data.
Countries covered: (Expenditure indicators) currently available for 120 countries. (Performance indicators) cur-rently available for 117 countries.
Key points: One of the key limitations of the outcome indicators within ASPIRE relates to their data source, as they are based on national household survey data. This has a number of implications. First, household surveys do not ty-pically capture the full universe of relevant programmes and may focus on just the flagship or largest programmes. The available data on those programmes that are included also vary considerably (e.g. do not always include in-formation on transfer amounts or confound public and private transfers). This means not all programmes in every country will have information to allow for a reliable analysis of the adequacy of social transfers (outcome indica-tors) or their impact on poverty or inequality (impact indicators), and may instead only have information on number of beneficiaries, which provides an output indicator (or potentially an outcome indicator if coverage can be genera-ted). This means the performance indicators are not fully comparable across the individual harmonised programme categories and provide only an approximate measure of the performance of social protection systems.
Besides the data sources used, there are also important limitations of the specific indicators used. For example, while the coverage indicators provide a useful insight by showing the number of individuals per wealth quintile who live in a household receiving a transfer as a share of all individuals within the same quintile, this does not account for the fact that some social protection transfers may be targeted on a basis other than household wealth. Similarly, the adequacy of benefits considers the total transfer amount received by all beneficiaries in a quintile as a share of total income or consumption of beneficiaries in that quintile. However, if a quintile is especially poor, this may make even small transfers look ‘adequate’, and the indicator does not account for actual cost of living or local prices. Nor does this indicator of adequacy consider transfer timing, meaning that ‘adequacy of benefits’ is a rather misleading indicator title. Another example of a misleading indicator is the benefit–cost ratio, calculated simply by the simula-ted change in poverty gap divided by the total transfer amount.
Asian Development Bank
In 2005, ADB pioneered the use of the Social Protection Index (SPI), in an innovative attempt to develop compara-tive indicators on a supranational level in order to monitor progress on social assistance, social insurance and la-bour market programmes. The SPI aimed to help ‘assess, measure and compare social protection programmes’ for countries in the Asia and Pacific region, by capturing information on expenditures, coverage, distribution and impacts on poor and vulnerable populations. The indicators below are from the revised SPI (2011).

52 INDICATORS TO MEASURE SOCIAL PROTECTION PERFORMANCE: IMPLICATIONS FOR EC PROGRAMMING
Data sources: Data collected from a range of national sources by a ‘country consultant’. Sources include (Basic sta-tistics) national accounts, labour force surveys, censuses, central bank; (Social protection programme information) government statistics and reports, reports by international financial institutions and bilateral agencies, discussions and interviews with agencies responsible for social protection programmes and household survey data. However, ‘experience from the original SPI suggests that most data will come from direct interviews with program operators. Virtually no countries have centralized or easily accessible information on SP programs, particularly beneficiary num-bers and characteristics’ (ADB, 2011: 27).
Countries covered: 27 countries from Asia and Pacific region.
Key points: While the SPI is in essence an input indicator, through its various decompositions it in fact not only of-fers numerous insights into the resources invested in social protection at a national level but also provides a sense
Table 11: Selected social protection indicators in SPI
Indicator Further information / definition
Input indicators
SPI (aggregate – all types of social protection)
The SPI can be interpreted as social protection expenditures per potential beneficiary as % of per capita poverty line expenditures calculated by total social protection ex-penditures per total reference population(a) divided by a regional poverty line(b).
SPI (disaggregated – by type of so-cial protection: social assistance, social insurance or labour market programmes)
The disaggregation of SPI into social assistance, social insurance and labour market programmes uses a similar formula to the one above but, although total expenditures on social protection is easily disaggregated into the three categories, the reference population for each is different. See below for the example for social insurance:SPIsi = (SI expenditures/SI beneficiaries) x (SI beneficiaries/ SI reference population) x (SI reference population/all SPI reference populations) x 1/poverty line(NB Third term is a population weight representing weight of social insurance reference population relative to total weight of all SP reference populations.)
Expenditure on poor SPIp gauges total expenditures per poor beneficiaries as a ratio of the total reference population (both poor and non-poor).There is a population-weighting term that enables adding SPIp and SPInp to equal SPI as a whole. This is why, when the denominator of the total reference population is used for both SPI formulations, summing the two ratios will give the SPI itself.
Expenditure on non-poor SPInp gauges the ratio of total expenditures per non-poor beneficiaries as a ratio of the total reference population (both poor and non-poor).There is a population-weighting term that enables adding SPIp and SPInp to equal SPI as a whole. This is why, when the denominator of the total reference population is used for both SPI formulations, summing the two ratios will give the SPI itself.
Gender disaggregated SPI Same method used as for disaggregating beneficiaries by poor and non-poor – providing data are available.
Output indicators
Depth of coverage Average benefits received, calculated in terms of expenditures per beneficiary as % of poverty line, with per beneficiary expenditure defined as total expenditure divided by the total number of beneficiaries.
Outcome indicator
Breadth of coverage Presented as a %, this is the proportion of potential beneficiaries actually reached, given by the term ‘total beneficiaries divided by total reference population’.
Poverty focus indicator Assesses social protection effectiveness, by comparing the proportion of social protection expenditures going to the poor (relative to those going to the total reference population) with the national poverty rate. If, for example, the proportion of social protection expenditures going to the poor were 60% of the total and the national poverty rate were 50%, the poverty focus indicator would be 60/50 = 1.20.
Source: ADB (2011)
(a) The reference population is the proportion of the population that qualifies for social protection benefits from a particular programme.
(b) This poverty line uses the average of national poverty lines across the 27 countries in Asia and the Pacific for which social protection data are available. The
regional average of the 27 national poverty lines was about 28% of GDP per capita in 2010 and so a poverty line for each country that is 25% of its GDP per
capita is used for the revised SPI.

53OVERWIEW OF KEY INDICATORS CURRENTLY IN USE BY MAJOR DEVELOPMENT AGENCIES
of the adequacy of those investments through output and outcome indicators. For example, rather than just giving the level of financial resources spent on social protection, the various decompositions of the SPI allow for a sense of the breadth and depth of coverage, as well as the distribution of expenditures in terms of income-related poverty.
When comparing with other expenditure indicators from other institutions, it is important to note that ADB proposes that ‘expenditure data should exclude administrative and operating costs and reflect actual transfers to beneficia-ries’ (ADB, 2011: 26). Other institutions, such as ILO and OECD, incorporate administrative costs. The SPI therefore arguably better reflects the actual benefits being received by beneficiaries compared with expenditure indicators that lump together administrative costs. At the extreme, if an indicator includes administrative costs as part of so-cial protection expenditure then an inefficient social protection system (with high administrative costs) could be mi-sinterpreted as a system with more generous social protection expenditure.
Economic Commission of Latin America
ECLAC collects information through CEPALSTAT. Information is collected both at the programme level and on pu-blic social expenditures, of which social security represents one component.
Table 12: Selected social protection indicators in CEPALSTAT
Indicator
‘Programme-level indicators’ ‘National level indicators’
Input indicators
― Programme budget
― Programme expenditure
Output indicators
― Programme coverage (number of households, individuals)
― Minimum and maximum transfer levels (by household and per capita)
Input indicators
― Per capita public expenditure on social security (absolute and as a % of GDP)
― Public expenditure on social security as a percentage of total public expenditure
― Public expenditure on social security as a percentage of total public social expenditure
Sources: Programme level: http://dds.cepal.org/bdptc/; national/system level: http://estadisticas.cepal.org/cepalstat/WEB_CEPALSTAT/estadisticasIndicadores.asp?idioma=i
Note: Programme indicators cover conditional cash transfers, social pensions and labour programmes.
Data sources: (Programme indicators) national ministries responsible for the programmes (National/system-level indicators) official data provided by the corresponding government bodies (e.g. directorates, departments, sections or units for planning, budgeting or social policy within the ministries of the treasury, finance or the economy). Information on budgetary execution is also obtained from countries’ general accounting offices or treasury departments, and oc-casionally from central banks, national statistical institutes and national social and economic information systems.
Countries covered: (Programme indicators) 22 from the ECLAC region. In terms of programmes covered: conditio-nal cash transfers – 48 programmes (31 currently in operation); social pensions – 19 programmes (17 currently in operation); labour and productive inclusion programmes – 63 programmes listed (although information not available for all) (3 programmes listed as completed). (National/system level indicators) 21 countries from the ECLAC region.
Key points: This covers basic input and output indicators, though they do provide a useful resource, with data co-ming directly from national ministries. Public expenditure on social protection indicators are useful as they provide absolute expenditure figures but also as a proportion not just of GDP but also of total public social expenditure. However, there does not appear to be an indicator for social protection expenditure as a proportion of total govern-ment expenditure overall.

54 INDICATORS TO MEASURE SOCIAL PROTECTION PERFORMANCE: IMPLICATIONS FOR EC PROGRAMMING
4.2. Indicators measuring social protection in MICs/LICs
4.2.1. European Commission
The Development and Cooperation Results Framework (EU RF, 2015)(18) aims to measure the EU’s contribu-tion to global development progress. It was developed in the context of the EU and its member states’ participation in the intergovernmental negotiations over the post-2015 development agenda within the UN framework, including the design of the new set of SDGs and targets. It is associated with 16 out of 17 SDGs(19) corresponding with EU policy priorities as stated in the EU’s 2011 Agenda for Change(20).
To this end, the EU RF is part of a wider set of measures the EC is putting into place to strengthen monitoring and reporting on results of EU international cooperation and development assistance at the various levels, at the project and programme level (discussed below), at country level and at the corporate level of the EU as a donor (EC, 2015b). The framework reports on results aggregated from projects and programmes financed under EU external assistance, managed by DEVCO. The EU RF, as set out in the working document, covers 121 areas and sectors, including ‘employ-ment and social protection’ as well as other sectors that contain indicators of direct relevance to social protection.
The indicators are structured around three levels, corresponding with the concept of inputs and processes leading to outputs, outcomes and final impacts. Level 1 indicators are based around ultimate development progress in par-tner countries (medium- to long-term development outcomes or impacts), Level 2 indicators on outputs and out-comes and Level 3 indicators on the organisational performance of the EU insofar as it contributes to the outputs, outcomes and impacts the other levels cover.
Data sources: EU project and programme monitoring systems – annual and final reports from implementing or-ganisations (governments, international organisations, non-state actors), baseline surveys, results-oriented monito-ring mid-term reviews and evaluations; action fiche, Technical and Administrative Provisions, contribution agreement, contracts (for NGOs); national statistics – national Vocational Education Training (VET) agencies and administrative records, national departments of education, administrative records from relevant services (e.g. ministry of labour, employment services, training providers etc.); chambers of commerce, NGO-managed institutions, private providers. (18) http: //register.consilium.europa.eu/doc/srv?l=EN&t=PDF&gc=true&sc=false&f=ST%2017709%202013%20
INIT&r=http%3A%2F%2Fregister.consilium.europa.eu%2Fpd%2Fen%2F13%2Fst17%2Fst17709.en13.pdf(19) The exception is SDG 14, ‘Conserve and sustainably use the oceans, seas and marine resources for sustainable
development’.(20) Agreed in 2011, this sets out the EU’s development policy with the overall aim of significantly increasing the impact and
effectiveness of EU development policy.
Table 13: Selected social protection indicators in the EU RF
Indicator Further information/definition
Input indicators
Share of EU-funded international cooperation and development assistance directed towards supporting human development
Output indicators
Number of food insecure people receiving assistance through social transfers supported by EU
Agriculture and food security indicator Level 2 in EU RF (development outcome and outputs) – reflects the fact that food and nutrition security is one of the EC’s entry points to social protection
Number of people who have benefited from VET/skills development and other active labour market programmes with EU support
Employment and social protection Indicator Level 2 in EU RF (development outcome and outputs)
Outcome indicators
Share of older persons receiving pensions Employment and social protection indicator Level 1 in EU RF (global development progress – impact)
Proportion of employed people living below $1.25 (PPP) per day Employment and social protection indicator Level 1 in EU RF (global development progress - impact)
Sources: http://capacity4dev.ec.europa.eu/eu-rfi and EC (2015b)
Notes: Further details of specific definitions and calculations from http://capacity4dev.ec.europa.eu/eu-rfi

55OVERWIEW OF KEY INDICATORS CURRENTLY IN USE BY MAJOR DEVELOPMENT AGENCIES
The proposed data sources for the input indicators are internal monitoring systems such as the Common RELEX Information System (CRIS) and the External Assistance Management Report (EAMR).
Countries covered: Beneficiary partner countries.
Key points: The input indicators provide data on the level of resources for the purpose of specific outcomes (i.e. human development) but there is an inconsistent use of social protection terms throughout the different levels of monitoring. For example, the inputs on human capital do not explicitly refer to social protection or social transfers, which is used at Level 2. Moreover, the definitions used do not directly overlap with the definitions of different forms of social protection used by the EU’s ESSPROS, or OECD or ILO indicators, making comparisons difficult.
The three levels enable monitoring at the project level and the national level (e.g. to capture country trends), but the output indicators focus on specific types of social protection (food and nutrition security and labour market pro-grammes, two of the key entry-points for the EC) and therefore do not provide an overall picture of the numerous different forms social protection expenditure takes. While there is an outcome indicator for social pensions (at the impact Level 1 of the EU RF), there are no Level 2 or Level 3 indicators to track inputs or outputs of pensions throu-ghout the rest of the framework.
Finally, while outcomes are measured by coverage of social protection, this does not tell us about the quality or the impact of social protection interventions.
In terms of project-level indicators, each project has a different set of indicators, which depend on the programme’s aims and objectives. As an illustrative example, Table 14 below shows some of the key indicators from the EC-funded programme Social Protection Development Strategy of the Kyrgyz Republic for 2012-14. The data for these indica-tors comes from Ministries, National Statistical Committees, and local governments. As illustrated, the focus is on measuring inputs, outputs and outcomes.
Table 14: Selected programme-level social protection indicators from Kyrgyzstan
Input indicators Output indicators Outcome indicators
― Budget allocated to social protection as a % both of GDP and of total government expenditure
― Ratio of the amount of the guaranteed minimum income of the current year to the amount of the guaranteed minimum income of base year
― Percentage of able-bodied citizens covered by state pension insurance
― Ratio of the average size of pension for elderly citizens to the minimum pensioner subsistence level
Source: Based on SP Performance matrix, Kyrgyzstan (EC, 2012c)
4.2.2. Department for International Development (DFID), United Kingdom
Description: Working in a similar way to the EU RF, DFID’s (2014) RF has been used to monitor progress against the outcomes DFID seeks to achieve (overall), in line with its own strategic priorities and the MDGs(21). It monitors pro-gress across a range of social protection measures through both bilateral country programmes and DFID funding for multilateral organisations and aggregates these indicators from programme level up to the RF. The framework is structured around four levels, based on the equivalent of an input-output-outcome-impact framework. Level 1 indicators are the final development outcomes to which DFID seeks to contribute (specifically, the MDGs). However, as changes in the MDGs cannot be attributed to DFID alone, Level 2 indicators are included to measure a range of outputs and intermediate outcomes that can be directly linked to DFID, through either its country programmes (bi-lateral indicators) or DFID funding to multilateral organisations (multilateral indicators) (see below for programme-level indicators). The indicators are set around a number of sectors or thematic pillars, some of which overlap with social protection. Level 3 and 4 indicators then relate to internal operational and organisational effectiveness. The relevant indicators included below are Level 2 indicators(22).
(21) An updated RF that links to the SDGs is currently under preparation (DFID, pers comm.).(22) The Level 1 indicators are not included as they do not refer to social protection, as with the Level 3 and Level 4 indicators.
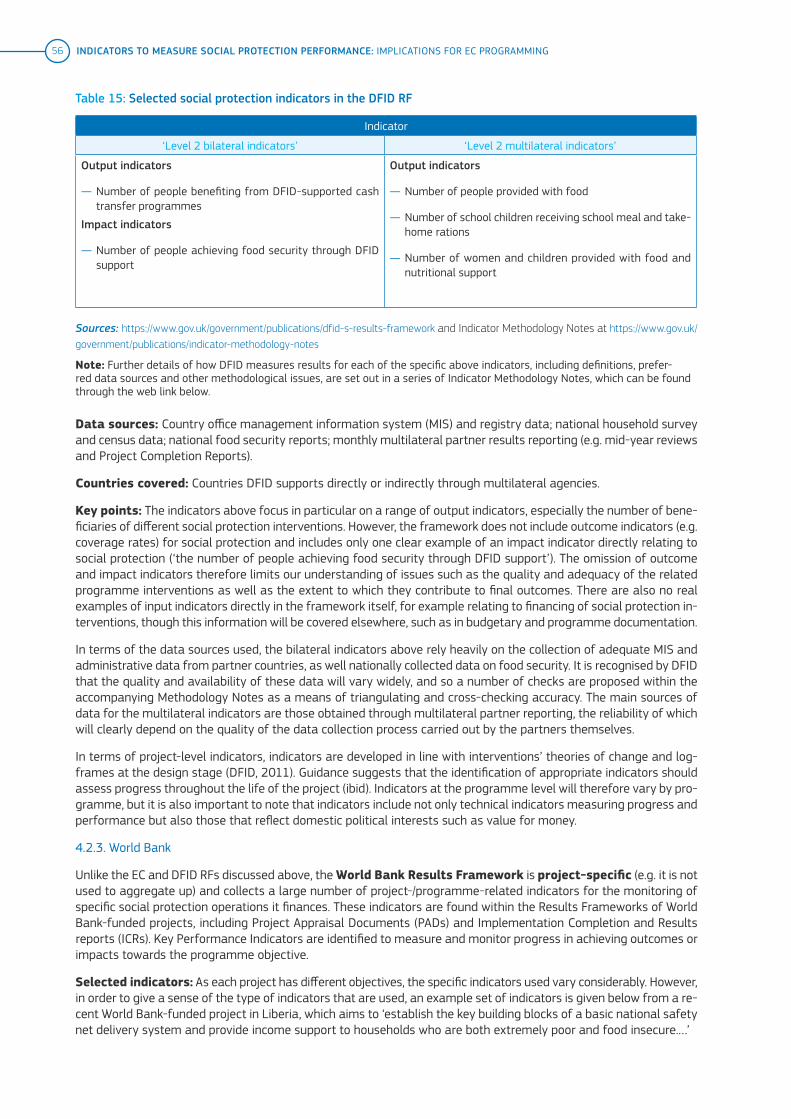
56 INDICATORS TO MEASURE SOCIAL PROTECTION PERFORMANCE: IMPLICATIONS FOR EC PROGRAMMING
Data sources: Country office management information system (MIS) and registry data; national household survey and census data; national food security reports; monthly multilateral partner results reporting (e.g. mid-year reviews and Project Completion Reports).
Countries covered: Countries DFID supports directly or indirectly through multilateral agencies.
Key points: The indicators above focus in particular on a range of output indicators, especially the number of bene-ficiaries of different social protection interventions. However, the framework does not include outcome indicators (e.g. coverage rates) for social protection and includes only one clear example of an impact indicator directly relating to social protection (‘the number of people achieving food security through DFID support’). The omission of outcome and impact indicators therefore limits our understanding of issues such as the quality and adequacy of the related programme interventions as well as the extent to which they contribute to final outcomes. There are also no real examples of input indicators directly in the framework itself, for example relating to financing of social protection in-terventions, though this information will be covered elsewhere, such as in budgetary and programme documentation.
In terms of the data sources used, the bilateral indicators above rely heavily on the collection of adequate MIS and administrative data from partner countries, as well nationally collected data on food security. It is recognised by DFID that the quality and availability of these data will vary widely, and so a number of checks are proposed within the accompanying Methodology Notes as a means of triangulating and cross-checking accuracy. The main sources of data for the multilateral indicators are those obtained through multilateral partner reporting, the reliability of which will clearly depend on the quality of the data collection process carried out by the partners themselves.
In terms of project-level indicators, indicators are developed in line with interventions’ theories of change and log-frames at the design stage (DFID, 2011). Guidance suggests that the identification of appropriate indicators should assess progress throughout the life of the project (ibid). Indicators at the programme level will therefore vary by pro-gramme, but it is also important to note that indicators include not only technical indicators measuring progress and performance but also those that reflect domestic political interests such as value for money.
4.2.3. World Bank
Unlike the EC and DFID RFs discussed above, the World Bank Results Framework is project-specific (e.g. it is not used to aggregate up) and collects a large number of project-/programme-related indicators for the monitoring of specific social protection operations it finances. These indicators are found within the Results Frameworks of World Bank-funded projects, including Project Appraisal Documents (PADs) and Implementation Completion and Results reports (ICRs). Key Performance Indicators are identified to measure and monitor progress in achieving outcomes or impacts towards the programme objective.
Selected indicators: As each project has different objectives, the specific indicators used vary considerably. However, in order to give a sense of the type of indicators that are used, an example set of indicators is given below from a re-cent World Bank-funded project in Liberia, which aims to ‘establish the key building blocks of a basic national safety net delivery system and provide income support to households who are both extremely poor and food insecure.…’
Table 15: Selected social protection indicators in the DFID RF
Indicator
‘Level 2 bilateral indicators’ ‘Level 2 multilateral indicators’
Output indicators
― Number of people benefiting from DFID-supported cash transfer programmes
Impact indicators
― Number of people achieving food security through DFID support
Output indicators
― Number of people provided with food
― Number of school children receiving school meal and take-home rations
― Number of women and children provided with food and nutritional support
Sources: https://www.gov.uk/government/publications/dfid-s-results-framework and Indicator Methodology Notes at https://www.gov.uk/government/publications/indicator-methodology-notes
Note: Further details of how DFID measures results for each of the specific above indicators, including definitions, prefer-red data sources and other methodological issues, are set out in a series of Indicator Methodology Notes, which can be found through the web link below.

57OVERWIEW OF KEY INDICATORS CURRENTLY IN USE BY MAJOR DEVELOPMENT AGENCIES
Table 16: Selected social protection indicators in the World Bank RF
Indicator
‘Project development objective indicators’ ‘Intermediate results indicators’
Output indicators
― Number of households with complete data records registered in the single registry
― Number of direct project beneficiaries, disaggregated by female-headed households and male-headed households
Outcome indicators
― Proportion of cash transfer beneficiaries who eat at least one meal a day
― Proportion of cash transfer beneficiary households in the target counties below the extreme poverty line
― Proportion of project beneficiaries satisfied with project interventions
Output indicators
― Number of social protection programmes in the country utilizing the single registry
Outcome indicators
― Proportion of cash transfer beneficiaries with payment tracking records logged in the MIS
― Proportion of grievance and redress cases raised under the social cash transfer programme recorded in the MIS
― Proportion of cash transfer beneficiaries receiving the intended quarterly cash transfers
― Proportion of cash transfer beneficiaries receiving at least one information, education and communication nutrition session
― Proportion of cash transfer beneficiaries with at least one information, education and communication IEC session on home gardening
Impact indicators
― Proportion of cash transfer households demonstrating improved nutrition
Source: World Bank, 2016
Data sources: Administrative reports by national ministries; MIS data; multilateral development partner surveys (e.g. World Food Programme and FAO); bespoke independent surveys (for beneficiary satisfaction indicator).
Countries covered: Any country in which there is a World Bank-financed project taking place.
Key points: In commenting on the indicators used in World Bank RFs, it is useful here to highlight the findings from a review of World Bank RFs carried out by the Independent Evaluation Group (IEG, 2011). The IEG analysed RFs from 71 Social Safety Net (SSN) interventions to look at what they were measuring and how well they were measuring expected results. In particular, the Key Performance Indicators (KPIs) were assessed to determine whether SSN ope-rations had KPIs that were outcome-driven, measurable by having a target to achieve, mentioned the target popu-lation, were time-bound and had baseline data at the time of project appraisal. Among the key findings of the re-view were the following:
― Only 59% of SSN operations had objectives that explicitly targeted the poor and vulnerable.
― 47% did not have even one indicator to monitor progress on reaching the poor.
― In one third of operations, Project Development Objectives were outputs rather than outcomes, and only 46% of such projects actually contained outcome indicators.
― Only half of the operations included target values for the outcomes indicators.
― Just 48% mentioned the target population.
― Just 32% had time-bound indicators.
― Just 30% contained any baseline data.
These criticisms are useful to keep in mind when considering the development of appropriate indicators for mea-suring social protection programming. The indicators presented from the specific example project above do in ma-ny respects address the concerns raised by the IEG review. For example, the indicators do allow for measurement

58 INDICATORS TO MEASURE SOCIAL PROTECTION PERFORMANCE: IMPLICATIONS FOR EC PROGRAMMING
of targeting efficiency of the poor and vulnerable. The actual PAD template does also include specific target values that are time-bound for these indicators, and most indicators also all have baseline data. The indicators also include many outcome indicators rather than simply output indicators, giving a sense of the scale and proportion of effects rather than simply numbers of beneficiaries. The final intermediate results indicator is also an example of an impact indicator (attempting to link the cash transfer to changes in dietary diversity). However, these indicators are not wit-hout their weaknesses. For example, the impact indicator in itself clearly does not allow for any causal interpretation between the cash transfer in question and dietary diversity, as it captures only changes within the group of benefi-ciaries, ignoring any pre-existing trends that may affect the population more broadly.
4.3. Analysis of social protection indicators
Using the framework discussed in Section 2, this subsection analyses the above indicators, pulling out key points around how indicators have been developed and selected, the appropriateness of indicators in measuring the effects of social protection and the comparability of indicators used.
4.3.1. Definition of social protection
Among the institutions reviewed here, the definition of social protection and thus how it is used to influence the selec-tion of indicators vary across institutes. Given the breadth of social protection programmes, it is understandable that institutional definitions are different. Exceptions to this include Eurostat (EU), the OECD and ILO, which have some es-tablished criteria for classifying social protection that is shared across these institutes (Bonnet and Tessier, 2013).
Indeed, the EU, ILO and OECD all organise their indicators around the functions social protection performs and the risks they address, making international comparisons easier. For example, underpinning the indicators used by the EC, social protection is defined in terms of different social protection schemes covering different functions, as developed origi-nally through the ESSPROS framework. Specifically, they are based around the following eight functions of social pro-tection: sickness and health care; disability; old age; survivors; family and children; unemployment; housing; and so-cial exclusion not elsewhere classified. ILO and the OECD also organise their indicators around similar functions. For example, ILO uses the following eight core functions: old age, invalidity/disability, survivors, sickness and health, unem-ployment, employment injury and occupational disease, family and children and maternity. These are supplemented by three others that come under a wider definition of social protection and include housing, basic education and other income support and assistance (not elsewhere classified). The OECD uses the following nine functions: old age, survi-vors, incapacity-related benefits, health, family, active labour market programmes, unemployment, housing and other social policy areas. These are largely consistent with the categories used by ILO and the EC, with a few differences (e.g. use of the category for active labour market programmes).
Other institutions categorise their indicators or databases according to type of social protection. The World Bank’s ASPIRE, for example, splits up its social protection indicators by type of social protection: social assistance, social insurance and labour market programmes. This broad categorisation reflects the Bank’s own institutional make-up, with social protec-tion falling under its SPL Global Practice(23). ECLAC divides the country programme indicators in its database into three categories: conditional cash transfers, SPL and productive inclusion programmes. ADB also categorises social protec-tion in terms of social assistance, social insurance and labour market programmes. The indicators in DFID’s RF are also based around programme area (e.g. cash transfers, emergency food assistance, school meals and rations). In principle, having similar categorisations within social protection may allow for a certain amount of cross-institutional comparison.
4.3.2. Identification of objectives, targets and indicators: logical chain analysis
Only a few of the indicator sets reviewed here make some explicit link between objectives, targets and indicators by developing final indicators and intermediate indicators to capture impacts of the social protection interventions. These include, for example, the World Bank’s RF, the World Bank’s ASPIRE database and the EU’s SPPM. However, there are challenges with these.
(23) Each of the three broad programmatic areas is then further disaggregated into 12 programme categories, each of which has its programme sub-categories. For example, social insurance comprises contributory pensions and ‘other social insu-rance’ (e.g. occupational injuries benefits, paid sickness leave benefits, health and maternity/paternity benefits). Social pensions are included under social assistance, along with unconditional and conditional cash transfers, food and in-kind transfers, school feeding, public works, workfare and direct job creation, fee waivers and subsidies and ‘other social assistance’ (scholarships and education benefits, social care services, transfers for care givers and other not included elsewhere).

59OVERWIEW OF KEY INDICATORS CURRENTLY IN USE BY MAJOR DEVELOPMENT AGENCIES
At programme level, targets and indicators are set according to the scheme’s objectives. This may be reflected by the programme logframe or project appraisal documents. For example, application of the World Bank RF may differ according to each evaluation and, as each project has different objectives, the specific indicators used vary consi-derably. Although PAD templates include specific target values and indicators, a review of RFs by the IEG of 71 SSN interventions (looking at what they were measuring and how well) found only 59% of SSN operations had objec-tives that explicitly targeted the poor and vulnerable and 47% did not have even one indicator to monitor progress on reaching the poor. Moreover, in one third of operations, Project Development Objectives were outputs rather than outcomes, only 46% of such projects actually contained outcome indicators, and only half of the operations included target values for the outcome indicators.
Indeed, one of the main problems seems to be developing impact indicators at the system level that would indicate any causal interpretation between the social protection programme and the impact. The World Bank’s ASPIRE data-base and the EU’s SPPM attempt to capture these causal relationships through performance indicators that mea-sure simulated changes in poverty.
4.3.3. Choice of type of indicators and data sources
The predominant focus of social protection indicators is on inputs and outputs, with fewer indicators measuring out-comes and impacts. It is notable that across all the inputs there is limited disaggregation by sex, age, disability etc. This is a particular concern in terms of capturing not only the direct effects of programmes on different beneficia-ries, but also indirect effects. A recent review of the impacts of cash transfers by Bastagli et al. (2016) highlight the importance of measuring programme performance with sex-disaggregated data, as unintended consequences of transfer receipt can have negative effects on gender equality and women’s empowerment.
Inputs and outputs
Reflecting the emphasis on intermediate indicators (outputs) rather than final indicators, there is a focus on input and output indicators by the majority of the institutions reviewed, at the system and programme level. This is the case for those reporting on social protection in HICs as well as LICs (or combining the two). This makes sense in that it links directly to the inputs provided, is easily quantifiable and is not challenged by issues of attribution and mul-tiple causality, so there is an important role for these type of indicators, but there is a need for them to be comple-mented by outcome indicators.
For example, across the different agencies and databases, common input indicators focus on financial resources, and common output indicators focus on the number of beneficiaries receiving different types of social protection. Some indicators also go further to measure the adequacy of social protection investments, by measuring benefits as a percentage of GDP (e.g. SSED, SSI), or as a percentage of total public expenditure (e.g. CEPALSTAT), or propor-tion of total government expenditure (e.g. OECD) or on the distribution of expenditures in terms of income-related poverty, for example.
Outcomes and impacts
While the majority of indicators report on input and output indicators, there are also some indicators that capture outcomes and impacts. Outcomes are more common, and tend to focus on coverage, with some capturing social pro-tection adequacy. This is important in order to be able to distinguish between countries and programmes that may have very good coverage but inadequate transfer levels, or very poor coverage but more adequate transfer levels.
The World Bank ASPIRE’s indicators show a number of indicators that consider the issue of transfer adequacy (e.g. amount of transfers received by a wealth quintile in a country as a share of the total income/consumption of bene-ficiaries in that same wealth quintile). The SPPM dashboard identifies annual poverty reduction trends by capturing outcome (adequacy of pensions) and impacts (of social transfers) (excluding pensions). However, the SSI (ILO) out-come indicators provide an indication of coverage levels rather than saying anything about the adequacy of social protection provided.
Data sources
The different institutions reviewed here use a wide range of data sources. These different data sources depend in part upon the nature of the indicators and programmes being monitored but also upon the level of data availability.

60 INDICATORS TO MEASURE SOCIAL PROTECTION PERFORMANCE: IMPLICATIONS FOR EC PROGRAMMING
As would be expected, data availability is better in HICs. Data are more likely to be centralised and harmonised. However, in LICs data are more limited and also fragmented. For example, in databases measuring social protection in HICs, such as the OECD and the EC, much of the data come directly from country administrations or statistical repositories (e.g. Eurostat and the EU SILC) as part of highly developed institutional processes. Moreover, while da-ta sources used for OECD and EU member states and EC indicators are generally drawn from comparable sources, institutions and indicators covering MICs and LICs typically depend on the best available data source, which may in-volve drawing on multiple sources if there is a lack of centralised or easily accessible information.
Some types of indicators may have more sources of data availability than others. For example, it may be easier to capture input data (e.g. financial data) than outcomes and impacts. Indeed, certain data sources, like household sur-vey data, may be the only source available to assess certain indicators, like social protection coverage or impacts of social protection benefits on household poverty or inequality reduction, but many household surveys do not include questions on social protection (Bonnet and Tessier, 2013). Moreover, the absence of qualitative data is also a concern, especially as qualitative data are necessary to provide contextual analysis of the social protection programmes (see, for example, the EC’s ESSPROS, which combines qualitative and quantitative data collection).
Even if data are available, the issue of data consistency is still a concern. For example, Bonnet and Tessier (2013) draw attention to the limited consensus on measuring financial data and coverage data.
Indicator performance
Going beyond assessing the type of indicators used to measure social protection, it is important to assess the qua-lity of the indicators. There are variations to whether the indicators are broadly relevant, acceptable, credible, easy and robust, and this assessment must also consider the limitations imposed by inadequate data (especially in mea-suring social protection in LICs) as well as political processes that influence the selection of final indicators.
Some of the key gaps include measuring the quality and adequacy of social protection, and its impacts on poverty and inequality reduction, rather than just the relatively easier measurements of inputs and outputs in terms of social protection expenditure, benefit levels and number of beneficiaries. However, while there has been progress made in measuring results, there remains a gap in presenting the whole picture of the contribution of different types of so-cial protection towards reducing poverty and inequality.
Assessment of indicator comparability
Historically, there has been a degree of harmonisation and potential for indicator comparability across a number of the databases measuring social protection in HICs (see Box 5 for the relationship between Eurostat, ILO and the OECD). For example, the ESSPROS common framework was developed in the late 1970s by Eurostat and EU mem-ber states to provide a comprehensive and coherent description of social protection in the member states. It is gea-red to be internationally comparable and harmonised with other European statistics, particularly the EU national ac-count data, in terms of its main concepts.

61OVERWIEW OF KEY INDICATORS CURRENTLY IN USE BY MAJOR DEVELOPMENT AGENCIES
Box 5: Cooperating on the basis of complementarities – the Eurostat-ILO-OECD collaboration
Over time, Eurostat, ILO and the OECD have built bridges between their social protection databases (Eu-rostat ESPROSS, ILO SSID and OECD SOCX), avoiding duplication in data collection, thanks to an effort to harmonise their respective data classifications. As a result of this successful collaboration, the three organisations have recently begun work with ADB on similar issues. This box briefly presents the main milestones over the lifetime of this collaboration so far.
1970s: The European System of Integrated Social Protection Statistics (ESSPROS), linked to the SNA, is a common framework developed in the late 1970s by Eurostat and EU member states to provide a co-herent comparison between European countries. Through ESSPROS, Eurostat defines eight functions of social protection: sickness/health care; disability; old age; survivors; family/children; unemployment; hou-sing; and social exclusion not elsewhere classified. The units of reference are the schemes and then benefits provided by these schemes. The ILO SSID follows the same approach and criteria to define sche-mes and benefits.
1990s: The OECD SOCX database was developed in the 1990s as a tool for monitoring trends in aggre-gate social expenditure and analysing changes in its composition. It contains data for 34 OECD countries for the period 1980-2009 and estimates for 2010-2012. The main social policy areas are as follows: old age, survivors, incapacity-related benefits, health, family, active labour market programmes, unem-ployment, housing and other social policy areas. The main data source for the 21 European countries is ESSPROS (with the exception of health and active labour market programmes data, which come from two other OECD databases). The process of importing ESSPROS (Eurostat) data into SOCX is well esta-blished and cooperation is extended to non-expenditure data.
2000s: The ILO social security inquiry methodology was developed as a comprehensive tool for data collection and monitoring. ILO adopted an extended operational definition of social security that com-prises 11 functions or policies: health, disability, old age, survivors, maternity, family/children, unemploy-ment, employment injury, housing, active labour market programmes and general protection against poverty and social exclusion. This definition, fully in line with the ILO Convention 102, is relevant for the analysis of evolving social security programmes and compatible with existing statistical methodologies and frameworks (mainly ESSPROS and SOCX). Eurostat data as well as OECD data can be imported into the structure of SSID, and data from SSID can be exported automatically into the OECD structure. Since its creation, SSI has been importing social protection expenditure data from OECD countries, avoiding duplication in the collection of data in this area.
2005-2013: More recently, the OECD, ILO and ADB have worked together to enhance compatibilities and comparability between data collected by ADB in most Asian countries (part of the SPI database) and the OECD and ILO databases. At present, some ADB data are part of the ILO SSID and used by the OECD for wider social protection expenditure comparisons. Future potential collaboration with other or-ganisations includes further harmonisation and standardisation of social protection data (categorisa-tion/qualification) and data collection tools (among others) in order to improve data comparability, compatibility and quality.
Source: Bonnet and Tessier (2013: 3-4)

62 INDICATORS TO MEASURE SOCIAL PROTECTION PERFORMANCE: IMPLICATIONS FOR EC PROGRAMMING
Box 6: The ISPA Initiative
The Inter-Agency Social Protection Assessments (ISPA)(24) initiative was established by a group of multi-late-ral development actors, including the World Bank, ILO, EU and OECD, with endorsement from SPIAC-B, a glo-bal coordinating body for international organisations and bilateral institutions working on social protection. ISPA was initially intended to contribute to a process of data harmonisation across the key actors working in the sector, including the World Bank and ILO, responding to coordination challenges highlighted by the G20 Development Working Group. To this end, it took forward a work programme developed during a series of meetings involving the ILO, World Bank, UNICEF, IPC, DFID and UNRISD. An action plan was developed (ODI, 2012) and a road map defining a preparatory process for harmonisation was set out in Bonnet and Tessier (2013). As part of the process a series of instruments were devised with the initial objective of identifying and harmonising the key concepts, data requirements and indicators across the main agencies which were active in the social protection sector, and actively engaged in separate data collection processes. However, the lead agencies subsequently decided not to move forward with the harmonisation agenda and instead the focus of the ISPA shifted to the provision of a framework to analyse various aspects of national systems of social protection provision through a set of practical assessment tools.
Therefore, indicators measuring social protection in LICs remain largely incomparable across institutions and countries (Bonnet and Tessier, 2013). While the ASPIRE database holds a repository of international indicators aiming to pro-vide a comprehensive set of comparable and accessible indicators to measure the performance of social protec-tion and labour market systems, one of the key limitations of the performance indicators is that, because of data limitations in each country, in practice it will be difficult to compare indicator results if the data used are from dif-ferent sources. This means the performance indicators are not fully comparable across the individual harmonised programme categories and provide only an approximate measure of the performance of social protection systems.
(24) https://ispatools.org/
While other indicator sets have not been developed with such explicit harmonisation, there are ways in which some indicators can be comparable. One of the main strengths of the SSI indicators, for example, is that they allow for a largely comparable set of indicators across a very wide range of countries. However, a key limitation is that despite the large number of indicators covered, those of relevance to MICs and LICs demonstrate relatively limited scope, and it appears that many have been developed more with HICs in mind. The SSED data sources are also harmonised where possible with other repositories of expenditure data (e.g. SOCX for the OECD countries). The EU RF also pro-vides information on aggregated key results achieved with EU assistance, reporting on results aggregated from pro-jects and programmes financed under the external assistance instruments managed by DEVCO. The data sources used for the schemes are generally direct from government sources and may be harmonised with other data repo-sitories such as the OECD SOCX and ADB’s SPI.
More recently, the Inter-Agency Social Protection Assessments (ISPA) initiative (see box below), endorsed by the in-teragency grouping known as the Social Protection Inter-Agency Cooperation Board (SPIAC-B) took forward a pro-cess for the creation of a framework for gathering consistent and comparable data about social protection systems, programmes and delivery (including aspects of performance, with a focus on inputs and outputs) (ISPA, 2016). Tools were developed initially to provide a core set of common social protection related data which would obviate the need for each development agency to gather similar information on core performance indicators and would render data in a consistent and comparable format, with significant cost and efficiency saving implications at agency and country level. As such the ISPA tools had the potential to contribute to interagency harmonisation, but the objective of im-proving indicator comparability was not then taken forward (see Box 2). Harmonisation objectives can only be rea-lised if agreed data on basic social protection indicators (coverage, value etc.) with common definitions and a unified data gathering process will be adopted by agencies and/or governments as the basis for their programming, in lieu of existing agency-specific indicators and processes. However, the adoption of a shared set of indicators in place of institution-specific tools and indicators implies a diminution of individual agency autonomy, and as such agencies have not to date been willing to surrender their own definitions and methodologies in favour of a shared approach.
63CONCLUSIONS
5. ConclusionsThe key challenge relating to indicators for social protection monitoring is described by Bonnet and Tessier (2013) in their comprehensive sectoral overview thus:
The scope and the level of disaggregation of data collected vary widely from one organisation to the other. Thus, the lack of comparability and compatibility mentioned above results in a large number of data sets, sometimes incomplete in terms of periodicity of collection, geographical coverage, etc.
The findings in our review echo Bonnet and Tessier’s key findings on existing international social protection data and indicators in use among the major agencies. The main challenges highlighted by Bonnet and Tessier are discussed in some detail below, given their critical importance for future EU activity in the sector.
Currently, agencies are often not able to use each other’s data, being unable to link datasets using consistent clas-sifications, and the differing scope of indicators used by each organisation is not readily discernible to those outside the agencies. In order to address this challenge, a shared definition of core data to be collected would ensure com-parability and allow for the use of data by various organisations as well as the creation of bridges between different classifications as a first step towards coordination and harmonisation between organisations on social protection statistics. Key areas where core classifications are required were identified as expenditure, financing, coverage, bene-fit level and impact. Bonnet and Tessier argue that this approach would facilitate closer collaboration at the country level and contribute to a ‘division of labour’ among agencies, depending on their respective areas of strength, rather than the duplication which characterises the current situation, and ‘delimit the scope for a possible standard in the area of social protection statistics to be applied by organisations and in countries’. Some principles would be defined progressively as the minimum core set of social protection data was extended.
In addition, they argue for a focus on the collection of social protection data through household surveys as the pri-mary source of data enabling assessment of coverage and needs as well as estimation of the impact of existing (or simulated) social protection benefits on household poverty or inequality reduction. They note that currently ma-ny household surveys include inadequate questions on social protection, and they propose the regular inclusion of standardised questions concerning main existing programmes and benefits as part of any questionnaire using stan-dardised methods and generic questions, as well as definitions of reference populations, to increase the quantity and comparability of available data.
In terms of coverage measurement, there is agreement across agencies that coverage should be measured using both administrative records and household surveys, noting that coverage indicators can ‘easily lose relevance in the absence of a clear definition of what benefits (policy area, periodic or not, cash or in kind, etc.) are included or not’. This is a key issue still under discussion in relation to the SDGs, reflecting the fact that ‘there are no standardized methods of data collection on coverage, nor a set of basic principles on how to measure coverage. This results in a variety of incomparable coverage rates calculations across organizations’. Bonnet and Tessier also note that it is ne-cessary to accommodate the fact that ‘not all social protection benefits contribute to the same extent to income se-curity’, (for example due to differences in terms of value, frequency of payment, duration of support, etc.) pointing to the need for a level of disaggregation in the analysis of data collected.
They also highlight the relevance of qualitative and contextual information, to provide an inventory of country-le-vel programmes and benefits, which requires consistency in terms of definitions, eligibility and the categorisation of programmes and benefits, as well as additional qualitative information (referring to programme design, legal fra-mework, qualifying conditions, governance and administrative structure, etc.) to assess systems development. While Eurostat, ILO, the OECD and ISSA collect broadly consistent data, there is no agreed approach among the wider set of development actors. As outlined above, the ISPA initiative was initially intended to address this challenge, but did not achieve the anticipated agreement on definitions, harmonisation of agency activity on data collection, or the de-velopment of a practical methodology for data integration.
Multiple poverty lines are in use (including internationally defined poverty and extreme poverty lines, and nationally defined poverty and extreme poverty lines), and there is no agreed method among agencies to determine which one to use when building social protection indicators or evaluating the social protection needs of specific population groups.

64 INDICATORS TO MEASURE SOCIAL PROTECTION PERFORMANCE: IMPLICATIONS FOR EC PROGRAMMING
The absence of a shared micro-data repository was identified, alongside critical gaps in the existing data relating to i) benefit levels (a key indicator of the quality of provision), ii) provision through programmes targeting working age beneficiaries (especially in relation to public employment programmes and disability benefits. There is as yet no standardised approach to the measurement of domestic financing sources (taxes, contributions, etc.), with analy-sis varying in terms of the treatment of taxes, loans and grants and the financing of non-contributory programmes.
Bonnet and Tessier also identify significant areas of agency duplication in data-gathering and, drawing on the ex-perience of the sharing of data collection among Eurostat, ILO and the OECD, they propose a similar collaborative exercise for outstanding areas between ILO and the World Bank(25), although this initiative has subsequently been put on hold(26).
The overall conclusions based on the overview of the indicators currently in usage pertaining to social protection are summarised below. First, definitions of social protection remain a major challenge and the subject of ongoing de-bate, as does the focus – in the majority of indicator frameworks reviewed –on inputs and outputs, with limited at-tention to quality of provision, outcomes or systems. A difference in data availability and hence indicator feasibility between HICs and LICs is noted; this represents a major challenge and potential limiting factor to objectively selec-ting appropriate indicators.
Data availability remains a key constraint in terms of methodological feasibility. This can be addressed endogenous-ly at programme level by ensuring management and evaluation data exist, but this is not always feasible at natio-nal level for data that require national institutional provision over time.
There remain challenges of inconsistencies and redundancies in the data gathered and indicators monitored. These derive from limited coordination and collaboration in indicator selection and data provision and gathering among agen-cies. Efforts at addressing this through institutional coordination have been partially successful (see ILO, ESSPROS, etc. as discussed above), but challenges remain, and the recent attempt to promote coordination among the main social protection agencies as anticipated in Bonnet and Tessier (2013) did not move ahead. The ISPA initiative and to a greater extent the SDG process still have the potential to stimulate improved data harmonisation. However, as noted above neither process is yet resulting in improved levels of harmonisation, in part due to the key role of orga-nisational mandates, institutional hegemony and political economy considerations more broadly in driving indicator selection in the social protection sector.
Political economy factors also play a role in driving what is measured and included in indicator frameworks, reflec-ting institutional priorities. This is illustrated, for example, by ILO’s focus on labour markets and formal-sector-rela-ted indicators and legislative eligibility, and by DFID’s focus on indicators that are amenable to political reporting and value for money analysis, such as coverage and quantifiable changes in poverty headcount (DFID, 2011).
The SDG-supported process of data development at national level should contribute to improved data and consis-tency, although the impact this is likely to have in terms of comparative and aggregative analysis will depend to some extent on the degree of national domestication of the SDG targets and indicators, as well as national capa-city and commitment.
Perhaps we can conclude that, across agencies, existing indicators are still characterised by data gaps, methodolo-gical challenges and conceptual inconsistencies, and thus overall provide a fair, but not fully adequate, overview of provision and performance of social protection. By combining insights from across agencies, the indicators can serve to inform many aspects of our understanding of social protection outcomes and impacts, but no single indicator fra-mework currently forms a consistent or complete indicator response to the question of social protection performance.
There is legitimacy in the existing plurality of systems, which provide insights into performance relating to differing objectives and drivers, and also space for differing definitions of social protection in line with institutional mandates and preferences. However, the outstanding challenge is the extent to which these different approaches remain unable to ‘speak’ to each other and be used in a linked way to provide insights into performance; it is the creation of a core set of common indicators across the agencies, enabling the different datasets and methodologies to be linked, that remains the outstanding challenge. This would need to address discrepancies in definitions and approaches, diffe-rential definitions of social protection and, most problematically, differential underlying philosophies and approaches to both social protection and the essentially ideologically informed question of which datasets to use and the role of nationally, compared with institutionally, generated data.
(25) A detailed road map was developed for this collaboration, set out in Appendix 2 of Bonnet and Tessier (2013).(26) ILO informant, pers comm.

65CONCLUSIONS
Attempts have been made to promote a degree of convergence, including Bonnet and Tessier (2013), with support from the international community, but the political and institutional barriers to rationalisation have not yet been overcome. The ILO has a mandate to address these challenges inasmuch as they relate to the SPF process and to the promotion of improved data analysis to inform the biennial Social Protection Report, while the World Bank also has a mandate in that it receives donor funding to carry out initiatives that are partly in parallel, such as the crea-tion of the ASPIRE database, outside the common framework established by ILO, ESSPROS, etc. There is currently no active process to rationalise indicator selection and definition across agencies in line with commitments made in relation to the Paris and Busan partnerships and the associated efficiency agenda (OECD, 2012).
It is as yet too early to identify indicator revision within the donor community in line with monitoring the SPF goals, although given their limited engagement with social protection, as discussed above, this would have little impact on sector indicators overall, and indicators (and associated targets) remain an area of donor contestation, despite agreement on top-level goals. The implication of this is ongoing duplication and inefficiency, representing a conti-nuing burden on national governments and the international community, as well as a missed opportunity for poten-tial meta-analysis on progress against social protection development priorities.


67GUIDANCE FOR THE EC IN INDICATOR SELECTION
6. Guidance for the EC in indicator selectionHaving summarised and provided some commentary on the SDGs and indicators from other institutions, in this final section we explore the usefulness of the SDG indicators on social protection for the EU, consider implications and draw recommendations for the development of social protection indicators for use in EU programming by DEVCO staff in both Delegations and in Brussels. The aim is to provide guidance on the selection and usage of social pro-tection indicators for EU Delegations formulating new social protection programmes or general budget support ope-rations, which should reflect national and international circumstances and commitments as well as the availabili-ty and use of such data in existing frameworks to measure social protection inputs, outputs, outcome and impact.
First, we review the relationship between the EU RF indicators and the SDGs. Then we provide guidance for the EU in terms of developing systems for reporting coherently on results on social protection and its contribution to gene-ral development progress in relation to the performance of EC programming under its various aid delivery methods.
6.1. The EU Development Cooperation Results Framework and the SDGs
While the EU RF aims to measure the EU’s contribution to global development progress and is oriented towards in-ternational development goals as articulated in the draft SDGs as available in 2013, it is aligned with a set of deve-lopment outcomes that focus on the priority sectors of EU cooperation as stated in the EU’s Agenda for Change. To this end, the framework uses indicators at three levels: the overall contextual level, the level of aggregated results achieved with EU assistance and the level of results aggregated from projects and programmes financed under the external assistance instruments managed by DEVCO(27). It covers 12 areas and sectors, although ‘employment and social protection’ has only one indicator, relating to the provision of pensions. The ‘agriculture’ component also has one social protection-related indicator: number of food-insecure people receiving assistance through social trans-fers supported by the EU. Several other sectors contain indicators indirectly affected by social protection. Appraisal of the Level 1 and 2 indicators reveals only a limited overlap between the EU RF and the SDGs, as set out in Table 17.
(27) The indicators are structured around three levels that correspond with the concept of inputs and processes leading to outputs, outcomes and final impacts. Level 1 indicators are based around ultimate development progress within partner countries (the medium- to long-term development outcomes or impacts), Level 2 indicators focus on outputs and out-comes and Level 3 indicators are more concerned with the organisational performance of the EU insofar as it contributes to the outputs, outcomes and impacts covered by the other two levels.
Table 17: Level 1 and 2 EU RF indicators relating the SDGs
No. Sector EU RF indicator Associated SDG indicators
Level 1
1 Inclusive growth and poverty reduction
Proportion of the po-pulation living below $1.25 (PPP) per day
1.1.1. Proportion of the population below the international po-verty line, by sex, age, employment status and geographical location (rural/urban)1.2.1. Proportion of the population living below the national poverty line, by sex and age1.2.2. Proportion of men women and children of all ages living in poverty in all its dimension according to national definitions10.2.1. Proportion of people living below 50% of median in-come, by age, sex and persons with disabilities
2 Inclusive growth and poverty reduction
Income share held by the lowest 40% of income distribu-tion (% income, period averages)
10.4. Labour share of GDP, comprising wages and social pro-tection transfers
3 Inclusive growth and poverty reduction
Real GDP growth i) la-test year and ii) ave-rage over last 5 years
8.1.1. Annual growth of rate of real GDP per capita
9 Nutrition (agriculture and food security)
Prevalence of stunting (moderate and severe) of children aged below 5 years
2.2.1. Prevalence of stunting (height for age <-2 standard de-viations from the median of the WHO Child Growth Standards) among children under 5 years of age

68 INDICATORS TO MEASURE SOCIAL PROTECTION PERFORMANCE: IMPLICATIONS FOR EC PROGRAMMING
Level 1 indicators consider development progress at country level, and relate to impacts from the collective action of all development actors rather than directly attempting to isolate the impact of EU assistance. Seven Level 1 indi-cators and one Level 2 indicator relate to SDG indicators that directly or indirectly relate to social protection inputs, outputs or outcomes.
There is close correspondence between Indicator 1 of Level 1, relating to the first SDG of inclusive growth and po-verty reduction and the target:
By 2030, eradicate extreme poverty for all people everywhere, currently measured as people living on less than $1.25 a day
The single RF indicator is matched with four SDG indicators (three for SDG 1 and one for SDG 10) attempting to mea-sure poverty reduction, which add several additional dimensions to the simple poverty indicator in the RF. A decent work dimension is added by adding disaggregation by sex, age, employment status and geographical location (ur-ban/rural), thereby combining the indicator for MDG 1.a with the indicator for MDG 1b. In addition, national as well as international poverty lines are accommodated and multiple dimensions of poverty beyond income poverty are included, as is an alternative measure of poverty in the population living below 50% of median income. Both the di-saggregation and the variety of poverty lines provide options for RF development while remaining consistent with the SDG approach.
The second RF indicator relating to inclusive growth and poverty reduction that attempts to capture inequality is in-consistent with the SDG indicator, relating to the labour share; neither is consistent with prevailing conventions rela-ting to measuring inequality and they are both not adequate indicators. There is consistency in the third indicator re-lating to GDP growth, although in the SDGs this is expressed on a per capita rather than an absolute basis. Indicator 9 relating to nutrition uses undernourishment and is also consistent with the SDGs.
Indicator 27, relating to employment and social protection, is the proportion of employed people living below $1.25 (PPP) per day. This is consistent with SDG Indicator 1.1.1, as discussed above, which addresses both unemployment and also poverty by adding labour status disaggregation.
Indicator 28 attempts to capture the social protection component of this goal, through an estimate of coverage in the form of the share of older persons receiving pensions. This addresses just one component of the broader cove-rage encompassed in SDG Indicator 1.3.1, which accommodated all forms of provision, disaggregated by beneficiary type. Thus the SDG indicator better reflects the intent of the SPF and social protection provision generally. Another of the dimensions of provision is captured in the Level 2 Indicator 10 on nutrition, which measures the number of food-insecure people receiving assistance through social transfers supported by the EU.
Overall, the social protection indicators included in the RF could be refreshed to render them consistent with the SDGs without losing their identity, but significantly improving their ability to appraise progress. Options for addres-sing this challenge, drawn from the discussion above, are set out in section 6.4. below.
10 Systemic resilience to food crisis (agriculture and food security)
Prevalence of undernourishment
2.1.1. Prevalence of undernourishment
27 Employment and so-cial protection
Proportion of em-ployed people living below $1.25 (PPP) per day
1.1.1. Proportion of the population below the international po-verty line, by sex, age, employment status and geographical location (rural/urban)
28 Employment and so-cial protection
Share of older persons receiving pensions
1.3.1. Proportion of population covered by social protection floors/systems, by sex, distinguishing children, unemployed persons, older persons, persons with disabilities, pregnant women, newborns, work injury victims and the poor and the vulnerable
Level 2
10 Nutrition (agriculture and food security)
Number of food-inse-cure people receiving assistance through so-cial transfers suppor-ted by the EU
1.3.1. Proportion of population covered by social protection floors/systems, by sex, distinguishing children, unemployed persons, older persons, persons with disabilities, pregnant women, newborns, work injury victims and the poor and the vulnerable
Source: RF indicator data taken from EC (2015b)
Note: Details of specific definitions and calculations available from http://capacity4dev.ec.europa.eu/eu-rfi

69GUIDANCE FOR THE EC IN INDICATOR SELECTION
6.2. Improving the EU RF in relation to social protection
There is potential to refresh the EU RF in line with recent institutional and political developments in terms of impro-ving the adequacy of the indicators selected at all three levels. The three-level approach remains appropriate, in or-der to distinguish between differing types of institutional needs and arenas of engagement. The working note pre-pared for the launch of the RF remains appropriate, and the approach and associated methodology notes set out in Annexe 4 are apposite. The only issue for consideration is the elaboration of the indicators themselves, and how much they can be improved.
As outlined above, depending on the EC’s commitment to using the SDGs as an organising framework, as well as its institutional relationship with World Bank and ILO initiatives, and the extent to which the EC is committed to da-ta harmonisation in relation to its own institutional priorities, a revised set of indicators could be developed. These considerations will be subject to political preferences, and in this paper we provide guidance on which technical fac-tors should be taken into consideration. As discussed, the existing indicators do not conform fully to RACER criteria and may not be adequate for EC purposes moving forward, in terms of monitoring programme performance and al-so in terms of consistency and promoting harmonisation internationally. The gaps are identified in the review out-lined in section 3 and they could benefit from redefinition and potentially the inclusion of additional indicators. A harmonisation process could be informed by the successful example of the ILO, EC and OECD collaboration noted above (Bonnet and Tessier, 2013).
The analytical framework as set out in Section 2 and the analysis and critique of the EU RF in Section 3 are proposed as a suggested starting point in redeveloping social protection indicators. The range of alternative options presented above can be considered the source of potential indicators from which to select those that best match EU policy prio-rities. This process should take into account the gaps and challenges identified in relation to social protection indica-tors generally and the role of the EU within this. Key options lie in supporting the SDG process and adopting indicators that are consistent, where the SDG indicators are considered adequate for EU monitoring purposes, and attempting to build on rather than duplicating existing indicators. In this capacity, the EU can play a role in supporting the pro-cess of data and indicator coordination through collaborative engagement with the other agencies, and in promo-ting shared, rather than institution-specific, core indicators, to the extent that this is institutionally feasible. Working with the other development agencies could help promote the potential for harmonisation more broadly to minimise duplication and promote efficiency. There is also the potential for harmonisation with the new developments in sup-porting national data development processes as part of the SDG process, in line with SDG 17.
In developing indicators, the EU can play a role in ensuring key development challenges are not overlooked, poten-tially complementing the indicators of the SDG, which are to some extent constrained by the complexity of their multiple stakeholders. For example, it could ensure equality/redistribution is adequately captured, as well as interna-tional and domestic financing. Similarly, the EU can support and model the adoption of process and systems deve-lopment monitoring, and the critical arena of social protection quality, which is also notably missing from the SDGs and other institutions’ indicators. The EU can promote outcome indicators and ensure these are centre stage, and work towards integration across targets, to avoid the silo approach for which the SDGs have been criticised (ICSU, 2015). This work can recognise the potential tensions between targets and find ways to accommodate this through the development of multidimensional targets. An example is the proposed SDI, designed to integrate measurement of progress against two global systemic risks simultaneously: increasing greenhouse gas emissions and increasing income disparity (Chuluun and Oyun, n.d.)(28). This would potentially initiate a move away from GDP-denominated targets of poverty reduction performance (Chuluun, 2012) and better accommodate inclusive economic growth.
The ongoing development of the SDG indicators, the associated investment in global data development, the inte-rest in SPIAC-B and the need to consider progress on key labour market and social protection initiatives, notably the SPF, mean this is an excellent time to review and strategically develop the indicators that inform the EU’s social protection programming. This has the potential not only to promote improved monitoring and hence accountability to beneficiaries and funders, but also to contribute to a broader debate on the measurement of poverty, to promote the principles of donor coordination reiterated in Busan and also to model appropriate responses to the challenge and institutional commitment to harmonisation, while ensuring key elements of the development agenda, relating to systems development, equity and impacts, remain on the table.
(28) The SDI integrates the economic (composite of GDP per capita and income inequality), environmental (CO2 per capita) and social (expected longevity at birth) dimensions.

70 INDICATORS TO MEASURE SOCIAL PROTECTION PERFORMANCE: IMPLICATIONS FOR EC PROGRAMMING
6.3. Recommendations for the programme level
This section provides recommendation on how to select social protection indicators at programme level in relation to EC development instruments in order to monitor programme performance effectively and contribute to broader development objectives simultaneously. This guidance can assist EC staff both in headquarters and in Delegations to identify the key issues for consideration in order to develop the most appropriate indicators to contribute to na-tional and international development commitments, taking into account the EC Project Cycle Management (PCM) guidelines (EC, 2004).
Figure 3 below sets out a decision tree to provide guidance for thinking through the main steps and decisions which need to be taken when selecting social protection indicators, in line with the framework set out in section 2.3. Before discussing the key steps in the decision tree, we first identify the key elements of the PCM to contextualise the dis-cussion. The PCM argues that projects and programmes should be seen in the context of both the EC and partners’ development priorities and EC projects should form part of and be consistent with national development policies, EC development policy and country strategy papers; government programmes (e.g. in health, education); and/or deve-lopment priorities and programmes of non-state actors – which indicates the EC should be mindful of the objectives and indicators of other actors in its programme formulation.
The PCM highlights the requirement to establish for each intervention a ‘performance monitoring system to mea-sure progress towards the achievement of policy objectives and planned results, distinguishing between male and female beneficiaries and ensuring the needs of vulnerable groups (disabled, young/old) are assessed’. This indicates a focus on beneficiary outcomes directly linked to EC-financed interventions. However, it also highlights the need for harmonisation across agencies and the need to streamline donor procedures to reduce the significant administra-tive burden these can place on partner countries, recognising that an ‘insistence on using donor specific procedures can have high transaction costs and works against the principle of promoting partner ownership of project ideas, documentation and decision making/management processes’ (EC, 2004). Having ‘donors each with their own ma-nagement and reporting arrangements […] has resulted in large (and wasteful) transaction costs for the recipients of development assistance’ (ibid).
For these reasons, it is not appropriate to be prescriptive regarding the specific indicators that should be adopted, which must necessarily be context-specific and informed by pre-existing data and monitoring activities. However, it is appropriate to outline the key elements to include and minimum indicator requirements (relating to quality, outcomes and process monitoring) to assess performance and ensure accountability. The decision tree set out below (Figure 3) provides a guide through the process of indicator selection based on the analytical framework set out in section 2.3.
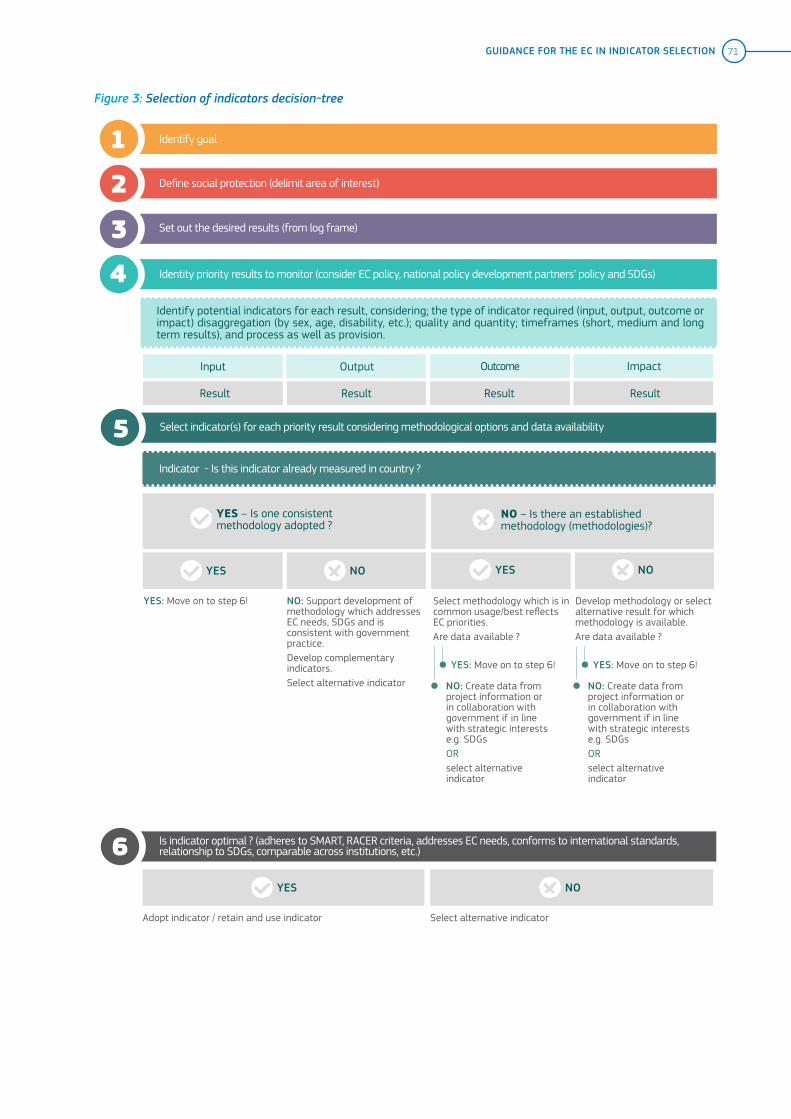
71GUIDANCE FOR THE EC IN INDICATOR SELECTION
Identify goal
Define social protection (delimit area of interest)
Set out the desired results (from log frame)
Identity priority results to monitor (consider EC policy, national policy development partners’ policy and SDGs)
Identify potential indicators for each result, considering; the type of indicator required (input, output, outcome or impact) disaggregation (by sex, age, disability, etc.); quality and quantity; timeframes (short, medium and long term results), and process as well as provision.
Input Outcome
Result Result Result Result
Output Impact
Select indicator(s) for each priority result considering methodological options and data availability
Indicator - Is this indicator already measured in country ?
YES – Is one consistent methodology adopted ?
NO
NO: Support development of methodology which addresses EC needs, SDGs and is consistent with government practice.Develop complementary indicators.Select alternative indicator
YES
YES: Move on to step 6!
NO
Select alternative indicator
YES
Adopt indicator / retain and use indicator
Is indicator optimal ? (adheres to SMART, RACER criteria, addresses EC needs, conforms to international standards, relationship to SDGs, comparable across institutions, etc.)
YES
Select methodology which is in common usage/best reflects EC priorities. Are data available ?
YES: Move on to step 6!
NO: Create data from project information or in collaboration with government if in line with strategic interests e.g. SDGs OR select alternative indicator
NO
Develop methodology or select alternative result for which methodology is available. Are data available ?
YES: Move on to step 6!
NO: Create data from project information or in collaboration with government if in line with strategic interests e.g. SDGs OR select alternative indicator
NO – Is there an established methodology (methodologies)?
Figure 3: Selection of indicators decision-tree

72 INDICATORS TO MEASURE SOCIAL PROTECTION PERFORMANCE: IMPLICATIONS FOR EC PROGRAMMING
(1) Identify goal
The goals and objectives of the project need to be identified and referred to throughout the process of indicator de-velopment, to ensure the indicators will adequately measure progress towards the selected targets and final goal. As discussed above, goals will be project specific and will be influenced by a variety of factors, including national and donor priorities.
(2) Define social protection
It is necessary to consider what definition of social protection should be used. This cannot be decided a priori, outside the context of the programme. The indicators should not drive the definition of social protection; rather, this should be informed by the intent and scope of the project, alongside the nationally accepted definition, and the extent of project linkages with other agencies, which may have fixed institutional definitions that may be more or less broad in scope.
It is important to ensure when indicators are developed that they are consistent with and reflect the definition adop-ted in programme documentation.
Also, it is necessary to consider whether the intervention intends to have impacts and outcomes at the household level, or to relate to policy or legislative outcomes or the development of social protection systems: this will also in-form the definition of social protection adopted.
(3) Set out desired results from logframe
The identification of indicators should be linked to the process of definition of project/programme objectives and targets. There is a need to ensure there is evidence of logic in the choice of indicators and how they relate to out-comes and impacts, based on problem analysis and the interrogation of causal assumptions. This could be achie-ved through the use of a logical framework matrix, as recommended in the PCM, to ensure a robust and credible link between programme objectives, inputs and indicators. Where proxy indicators are under analysis, the assumed link between the indicator, output and anticipated outcome should be critically tested and the role of other key me-diating factors considered.
The PCM contains insights relating to programme design, including indicator development in terms of the process of logical framework matrix development, which requires definition of the project structure, testing its internal logic and risks and formulating measurable indicators of success. At the purpose and result levels, the key indicators and sources of verification contained in the logframe matrix provide the focus for data collection and analysis. The PCM suggests the process of indicator identification is a positive aspect of programme design, that requires analysis on how to measure the achievement of objectives, in terms of both quantity and quality, and helps improve clarity and specificity of objectives as well as establish the M&E framework. However, it also acknowledges that finding mea-surable and practical indicators for higher-level objectives and for projects with ‘capacity-building’ and ‘process’ ob-jectives can be a challenge. In addition, establishing unrealistic targets too early in the planning process can be pro-blematic, as can relying on ‘project reports’ as the main ‘source of verification’ rather than establishing sources of data and how they should be gathered. The PCM also sets out key considerations for indicator development in rela-tion to programme objective, purpose, results and activities (Table 18).

73GUIDANCE FOR THE EC IN INDICATOR SELECTION
Within the logframe it may be relevant to include indicators that enable the appraisal of both direct and indirect ef-fects of social protection, moving beyond direct poverty reduction or consumption impacts to include, for example, improved service utilisation or health/education outcomes, increased job search, improved livelihoods or local eco-nomic development, where these are anticipated in the programme narrative. Moreover, it will also be important to consider the effects of programmes disaggregated by sex, age, disability etc., and it is important that this disaggre-gation is captured across the range of indicators, not just in inputs and outputs.
(4) Identify priority results to monitor
The choice of type of indicators is critical, and it is necessary to consider which types should be included, given that only a limited number may be selected (for reasons of cost and pragmatism).
There should be an a priori preference for indicators already in use by the relevant government agencies and inter-national agencies, given the commitment in the PCM to harmonisation and programming consistent with the 2003 Rome Declaration on Harmonisation, which states that:
The EC will therefore play its part in promoting harmonisation of policies and practices [...]. To minimise as far as possible the transaction costs associated with the provision of external financing, either by direct adoption of go-vernment procedures or through progressive harmonisation of individual donor procedures (EC, 2004).
Where methodology or definitions might not be consistent with EU preferences, selection of a second best option and engagement in dialogue to improve indicator quality or content may be appropriate. There may be an opportu-nity for the EC to play a role in stimulating movement towards indicator coordination at the national level, taking an active role in identifying and promoting resolution of discrepancies and duplication. In this endeavour, the EC should work closely with national statistics offices, in line with the Global Partnership, where they are active, as well as in-ternational agencies, and ensure voice is given to national priorities as well as donor preferences.
In terms of EC institutional preferences, it is recommended that the focus not be only on input/output indicators, des-pite their relative ease of measurement. These are not adequate to appraise programme attainment in social pro-tection. Outcome and impact indicators should be included where possible.
Indicators relating to quality, as well as quantity should be included, and indicators should assess both provision and process, where both are anticipated in programme goals. Such indicators would represent a significant comple-ment to existing indicators in the sector, particularly the SDG indicators, which provide a limited appraisal of both quality and process.
Table 18: Indicator considerations in EC logical framework matrices
Component of logframe Indicators
Overall objective:
The broad development impact to which the project contri-butes – at a national or sectoral level (provides the link to the policy and/or sector programme context)
Measures the extent to which a contribution to the overall ob-jective has been made. Used during evaluation. However, it is often not appropriate for the project itself to try and collect this information.
Purpose:
The development outcome at the end of the project – more specifically the expected benefits to the target group(s)
Helps answer the question ‘How will we know if the purpose has been achieved’? Should include appropriate details of quantity, quality and time.
Results:
The direct/tangible results (food and services) that the pro-ject delivers, and which are largely under project manage-ment’s control
Helps answer the question ‘How will we know if the results have been delivered’? Should include appropriate details of quantity, quality and time.
Activities:
The tasks (work programme that needs to be carried out to deliver the planned results)
(inputs)
Source: Adapted from EC (2004)

74 INDICATORS TO MEASURE SOCIAL PROTECTION PERFORMANCE: IMPLICATIONS FOR EC PROGRAMMING
A checklist of key questions to be considered in relation to the type of indicators to select are:
― How many indicators are desirable for a policy or programme (taking into consideration the size of the programme)?
― What types of indicators are already used or omitted and are necessary for appraising performance (input, pro-cess, output, outcome, impact)?
― What is the rationale behind using the existing indicators?
― Do these indicators collect an appropriate range of social protection outcomes and impacts?
― What indicators can be used to assess the quantity of social protection provided?
― What indicators can be used to measure the quality of social protection?
― What types of benchmarks are used to measure the quantity and quality of social protection (both processes and provision) (e.g. objective, time-based, comparative national or international)?
― Are composite indicators used and if so are the results useful or meaningful for appraising performance?
― Do indicators create perverse monitoring incentives?
― Are targets disaggregated by, for example, gender, disability, geography?
Once these questions have been considered, an informed selection of the appropriate type of indicators to be used in project and programme level programme design can be made.
(5) Select indicator(s) for each priority result considering methodological options and data availa-bility indicator
Next it is critical to assess existing methodologies and data availability, as this will limit indicator selection and also indicate where technical assistance may be necessary. The absence of baseline information is often a major constraint in indicator selection. It is necessary to assess the data sources in use and available in each context, considering the data produced by national statistics authorities or other agencies, and administrative data produced through pro-gramme monitoring, which may be produced by government, civil society or donor agencies. There is also a need to assess whether there is already collaborative data utilisation and the adoption of common indicators.
If requisite project-level data are not available, it may be appropriate for the EC to collect them directly, but this should be done in support of existing national and international priorities and processes for data strengthening, such as the Global Partnership.
Where data are collected by the EC or other national or international actors, including government, donors and ci-vil society, the EC should work to ensure that data and metadata are shared across agencies, rather than retained or used unilaterally. The EC should consider opportunities to gather data collaboratively and build on existing initia-tives rather than adding to unilateral data-gathering activities. Similarly, the EC should seek opportunities to sup-port the Global Partnership and associated activities to strengthen the quality of national data, contributing to pro-moting national initiatives such as labour force and household surveys. It should also seek opportunities to promote discussion of the inclusion of social protection in such instruments in order to avoid separate project-by-project da-ta-gathering where possible.
Where methodologies are already in use for appraising particular indicators by agencies and or government, the EC should assess their adequacy, and where possible adopt them, attempting to strengthen them where necessary, again in line with Global Partnership initiatives.
(6) Is indicator optimal?
Indicators should be considered in relation to RACER, SMART or CREAM criteria (see Section 2) to ensure their internal adequacy as indicators. Adequacy in relation to capturing programme performance will be context- and programme-specific, and linked to programme objectives, but it is important to ensure that selected indicators are able to cap-ture outcome and impact performance, as well as quality and process, rather than just input and output.

75GUIDANCE FOR THE EC IN INDICATOR SELECTION
Despite the documented limitations of the SDG indicators, it would be appropriate to include them where they are in operation and relevant to EC project outcomes. Data are already being gathered and analysed, as the opportu-nity cost is low, and there is significant overlap between the SDG targets and areas prioritised in the EC’s Agenda for Change. However, the indicators adopted for the SDGs do not in all instances capture the social protection out-comes of interest to the EC (as articulated by Lay and Prediger, 2016). For example, in SDG 5 (gender), the indicators do not capture the contribution of social protection in addressing the challenge of unpaid domestic work. In SDG 10 (equity), they do not capture the role of social protection in addressing poverty; moreover, they are attempting to assess progress on a national and aggregated global scale, rather than appraising project- or programme-level in-terventions. Therefore, the SDG indicators need to be complemented by additional indicators to ensure project per-formance against its stated objective is captured adequately. Where the existing methodology and data are weak, it would be consistent with EC priorities and in line with the objectives of the Global Partnership to provide support to national agencies to strengthen overall data-gathering and promote the quality of future SDG and other repor-ting. In order to do this effectively, it will be necessary to have knowledge of the domestication of the SDGs, targets and indicators in each national context.
Moreover, comparability of indicators is also important. While programme- and project-specific indicators may be adequate in terms of appraising programme-level performance, the comparison of results nationally and internatio-nally is valuable. This enables cross-programme comparison and learning by facilitating meta-analysis; to achieve this, the adoption of consistent indicators across programmes is suggested. This will also enable the aggregation of impacts across projects and programmes to gain wider insight into performance and progress internationally, as in-tended in the global SDGs. However, comparing performance across programmes and countries requires indicators to be comparable, in terms of the use of consistent methodological/definitional specifications. Availability of com-parable data will also be necessary.
This indicates a tension in the short term between the EC priority of promoting harmonisation (EC, 2004) and SDG global monitoring aspirations on the one hand, and the desire to promote national priorities and use existing natio-nal approaches on the other, in contexts where national approaches are not consistent with other national and in-ternational practices in terms of definitions, methodologies or data. This tension cannot be resolved in the imme-diate term but can be addressed through a process of national-level dialogue and support. In the interim, the use of a limited number of key indicators at project level that permit meta-analysis should be considered. Perhaps a lar-ger challenge is to promote dialogue and consistency among the major development agencies, which currently mo-nitor parallel performance indicators based on differing methodologies and data, as illustrated in Section 4. It may be that the EC can play a constructive role at country level and internationally in contributing to processes of deve-lopment agency indicator integration.
6.4. Recommendations for EC Indicator Programming
Throughout this paper a number of potential activities and recommendations have been set out for future work on indicator development. In this section they are drawn together as a set of options for the EC to consider in relation to future RF development, as well as its national and international engagement on social protection more widely. In developing social protection indicators, the EU can play a role in ensuring key development challenges are not over-looked, potentially complementing the indicators of the SDGs, which are to some extent constrained by the com-plexity of their multiple stakeholders. For example, it could ensure equality/redistribution is adequately captured, support and model the adoption of process and systems development monitoring, and address the critical arena of social protection quality, which is also notably missing from the SDGs and other institutions’ indicators. Specific re-commendations to the EC relating to these issues are set out below in relation to nine key areas:
Inclusion of the SDG Indicators
Despite the documented limitations of the SDG indicators, it would be appropriate to include them where they are in use and relevant to EC project outcomes. Where SDG indicator data are already being gathered and analysed, the opportunity cost of adopting them is low, and there is significant overlap between the SDG targets and areas prio-ritised in the EC’s Agenda for Change.
Where the existing methodology and data are weak, it would be consistent with EC priorities and in line with the ob-jectives of the Global Partnership to provide support to national agencies to strengthen overall data-gathering and promote the quality of future SDG and other reporting.

76 INDICATORS TO MEASURE SOCIAL PROTECTION PERFORMANCE: IMPLICATIONS FOR EC PROGRAMMING
Complementary Indicators
The SDG indicators overall are compromises between what would be technically preferable and what is politically ac-ceptable and as such are not necessarily ideal. They are not of themselves sufficient to capture the social protection outcomes of interest to the EC and as such, need to be complemented by additional indicators to ensure project per-formance against its stated objective is captured adequately. This creates an opportunity for other agencies to play a role in the development of complementary indicators aligned with the realisation of the SDGs, compensating for identified weaknesses in the SDG indicators by ensuring that a core set of technically valuable indicators are adopted.
Taxonomy
There is a need to develop an agreed taxonomy of social protection in relation to the SDG indicators, and more broadly within the sector, and also a definition of key concepts used. This would include both the composition of so-cial protection (which components are included and how broadly it is defined) as well as issues such as the measu-rement of the coverage of provision, for example whether it is legal coverage, or actual coverage at any one time that should be considered.
Quality of Provision
The focus in the SDGs is on the quantity of provision, based on output indicators, rather than quality, which is pro-blematic in terms of appraising the likely impact and value of interventions. The focus on coverage does not include reference to the success or otherwise of poverty-targeting social protection provision, or other aspects of quality (value, frequency, duration, opportunity cost, reliability etc). Other agencies are well place to develop indicators re-lating to these dimensions of performance.
There is an institutional ‘war of position’ for institutional dominance in the social protection debate which is evident in institutional contestation of both definitions (e.g. social protection ‘coverage’ differences between the ILO and World Bank) and spheres of influence, reflecting differing organisational mandates and conceptions. The absence of SPF process indicators among the SDG indicators is one outcome of this contestation which could be addressed by agency support for the adoption of SPF related indicators.
Systems Development
The SDG indicators pay little attention to monitoring progress in terms of investment in building social protection systems (the legislative, administrative and policy context for extended provision). This would require the monitoring of process-oriented outcomes such as building capacity, setting up regulatory frameworks, promoting legislation or policy harmonisation, or implementing systems such as single national registries. This is of concern given the fo-cus on ILO Recommendation 202 on Social Protection Floors and the critical role of the extension of legislative and policy frameworks to underpin this, or the development of any form of national social protection system. Output, outcome and process indicators linked to systems development could be fruitfully included in agencies’ results fra-meworks to complement the SDG indicators.
Poverty Reduction and Equality
The indicators reviewed are weak in terms of quantifying poverty and inequality outcomes. There are few quanti-fiable impact indicators relating to the core targets of poverty reduction overall, the contribution of social protec-tion to poverty reduction, the percentage of the poorest served, overall fiscal incidence or changes in the Gini. Those that are quantitative do not necessarily have a quantified target or end point, but rather can be used to measure changes in performance rather than attainment of a specific goal. There is the potential for other agencies’ to com-pensate for these limitations.
For example, the SDG indicator relating to equality would benefit from being complemented by indicators to appraise progress in this area. These could use social protection data in combination with data to assess state efforts at re-distribution, in the form of fiscal incidence analysis, taking into account the net effect of both taxation and redistri-bution through social protection, drawing on the AROP indicator adopted in the Europe 2020 strategy.
Compatibility of Frameworks
The SSID was developed to address the lack of comparable social protection statistics outside the OECD, by being compatible with existing frameworks and defining schemes by the functions they play and the needs they address,

77GUIDANCE FOR THE EC IN INDICATOR SELECTION
in line with the framework used by ESSPROS. Agencies could adopt a similar functional approach in relation to their own indicator framework.
There is not consistency across agencies in terms of whether administrative costs should be included when compa-ring expenditure. While the ADB proposes that expenditure data should exclude administrative and operating costs, and take into account only transfers, other institutions, such as ILO and the OECD, incorporate administrative costs. In order to measure performance adequately there is a need to capture both transfer and administrative costs and present them in both aggregate and disaggregate form.
Within the EU RF the output indicators focus on specific types of social protection (food and nutrition security and labour market programmes, two of the key entry-points for the EC) but are not adequate to provide an overall pic-ture of the numerous different forms of social protection interventions funded. In the light of this it may be useful to extend the RF to include the other seven functions, or at least those of relevance to the EC’s work.
Harmonisation
There is scope for the reinvigoration of attempts to harmonise processes of data gathering and analysis across agen-cies, given the limited success of initiatives to date, building on the successful example of the ILO, EC and OECD col-laboration and the process initiated by the ILO in 2013 with support from SPIAC-B.
Data
Many household surveys include inadequate questions on social protection; the EC may be able to promote the re-gular inclusion of standardised questions concerning main existing programmes and benefits as part of any ques-tionnaires using standardised methods and generic questions and definitions of reference populations which would increase the quantity and comparability of available data.
6.5 Conclusion
Social protection is one of three priority areas defined in the EC’s 2011 Agenda for Change, which calls for ‘more strategic, targeted and results-oriented’ assistance(29), implicitly highlighting the need for the adoption of adequate indicators to appraise performance. The context and role of indicators within the programme development process is clearly articulated in the PCM. This paper has sought to provide insight into the key consideration that should be ta-ken into account by managers in headquarters and Delegations when developing indicators for social protection pro-grammes in line with the mandate set out in the Agenda, which prioritises national ownership and aid harmonisation.
There are trade-offs between indicators that are optimal in terms of monitoring progress, from a methodologi-cal and data perspective, those that are feasible and those that are politically acceptable, particularly in relation to the appraisal of national programme performance. If national ownership and capacity development are primary concerns, as set out in the PCM and Agenda for Change, it may be that the accommodation of second best indica-tors is sometimes the most appropriate strategy, although this may be at the expense of insight and accountabili-ty, and there may be greater space for the adoption of better indicators in relation to project- and programme-level activities. At this level, integration with pre-existing government and donor indicators, coupled with investment in the promotion of a dialogue to promote indicator integration and the development of indicators shared by a range of actors in the social protection sector, complementing those already included in the SDGs, and which are interna-tionally consistent, would be the most desirable practice, demonstrating the willingness of the EC to adapt is own RF in order to promote harmonisation.
(29) Andris Piebalgs, Development Commissioner cited in Euractive, 8 March, 2013 http://www.euractiv.com/section/development-policy/linksdossier/agenda-for-change-eu-s-helping-hand-gets-an-overhaul/


79REFERENCES
REFERENCES
ADB (Asian Development Bank) (2011) The revised social protection index: Methodology and handbook. Manila: ADB.
Alkire, S. and Foster, J. (2011) ‘Counting and multidimensional poverty measurement’, Journal of Public Economics 95(7-8): 476-487.
Bastagli, F. (2015) Bringing taxation into social protection analysis and planning. Working Paper 421. London: ODI.
Bastagli, F., Hagen-Zanker, J., Harman, L., Sturge, G., Barca, V., Schmidt, T. and Pellerano, L. (2016) Cash transfers: what does the evidence say? A rigorous review of programme impact and of the role of design and implementation fea-tures. ODI Research Report. London: ODI.
Bierbaum, M., Oppel, A., Tromp, S. and Cichon, M. (2016) A Social Protection Floor Index: Monitoring National Social Protection Policy Implementation. Discussion Paper. Maastricht: Maastricht Graduate School of Governance and UNU-Merit.
Bonnet, F. and Tessier, L. (2013) Report on the workshop ‘Mapping existing international social protection statistics and indicators that would contribute to the monitoring of social protection extension through social protection floors’ Geneva, Switzerland, 13-15 March 2013. Extension of Social Security (ESS) Working Paper 38. Geneva: ILO.
Chuluun, T. (2011) ‘Time to stop celebrating the polluters’, Nature: World View 479(269). doi: 10.1038/479269a.
Chuluun, T. (2012) ‘Greening the Human Development Index: Accounting for all pillars of sustainability’, Outreach, 27 March.
Chuluun, T. and Oyun, S. (n.d.) Sustainability Across Human, National and Global Scales: Three Keystones and Fire. https://Www.Scribd.Com/Document/237458419/Sustainability-Across-Human-National-and-Global-Scales-Three-Keystones-and-Fire
Cichon, M. et al. (2004) Financing social protection. Geneva: ILO.
Deacon, B. (2007) Global social policy and governance. Thousand Oaks, CA: Sage.
Deacon, B. (2013) Global Social Policy in the Making. The Foundations of the Social Protection Floor. Bristol: Policy Press.
Deacon, B. and St Clair, A. (2015) ‘End poverty in all its forms everywhere’ in ICSU (2015) Review of targets for the Sustainable Development Goals: The science perspective. Report coordinated by ICSU in partnership with ISSC. Paris: ICSU.
Delorme, P. and Chatelain, O. (2011) ‘The role and use of performance measurement indicators’. Aid Delivery Methods Programme. Brussels: EC and EuropeAid.
Devereux, S. and Sabates-Wheeler, R. (2004) Transformative Social Protection. IDS Working Paper No. 232. Brighton: Institute of Development Studies, University of Sussex.
DEVCO (Directorate-General for International Cooperation and Development) (2016) ‘Annex 7: Monitoring and indica-tors’, in Integrating the environment and climate change into EU international cooperation and development: Towards sustainable development. Tools and Methods Series Guidelines 6. Brussels: DEVCO.
DFID (Department for International Development) (2011) ‘DFID’s Approach to Value for Money (VfM)’ DFID July 2011. https://www.gov.uk/government/uploads/system/uploads/attachment_data/file/67479/DFID-approach-value-money.pdf
DFID (2013) ‘Indicator methodology notes (annex to DFID’s results framework)’. London: DFID.
DFID (2014) ‘DFID’s Results Framework: Managing and reporting DFID results’. London: DFID.

80 INDICATORS TO MEASURE SOCIAL PROTECTION PERFORMANCE: IMPLICATIONS FOR EC PROGRAMMING
EC (European Commission) (2004) Aid delivery methods, Volume 1: Project Cycle Management Guidelines. Brussels: EC.
EC (2012a) Budget Support Guidelines: Programming, design and management – A modern approach to budget support. Tools and Methods Series Working document. Brussels: EuropeAid Development and Cooperation Directorate-General, EC.
EC (2012b) Social protection performance monitor (SPPM) – methodological report by the Indicators Sub-group of the Social Protection Committee. European Commission.
(EC (2012c) ‘Matrix of key indicators for monitoring of the Social Protection Development Strategy of the Kyrgyz Republic for 2012-14’.
EC (2015a) Supporting social protection systems. Tools and Methods Series Concept Paper 4. Luxembourg: DEVCO.
EC (2015b) Launching the EU International Cooperation and Development Results Framework. Commission Staff Working Document SWD (2015) 80 Final. Brussels: EC.
EC (n.d.) ‘Guiding principles for the selection of indicators and statistics’. Brussels: Social Protection Committee Indicators Sub-group.
Gassmann, F. (2010) ‘Note on performance measurement for social protection’. Commissioned by DG EuropeAid, E3/ESIP, October. Brussels: EC.
Giedion U., Alfonso E.A. and Díaz, Y. (2013) The impact of Universal Coverage Schemes in the developing world: A review of the existing evidence. Washington, DC: World Bank.
Hagen-Zanker, J. and McCord, A. (2013) ‘The affordability of social protection in the light of international spending com-mitments’, Development Policy Review 31(4): 397-418.
Hsu, A., Parnell, S. and Sánchez-Rodríguez, R. (2015) ‘Make cities and human settlements inclusive, safe, resilient and sustainable’, in ICSU Review of targets for the Sustainable Development Goals: The science perspective. Report coordi-nated by ICSU in partnership with ISSC. Paris: ICSU.
IAEG-SDG (Inter-Agency and Expert Group on Sustainable Development Goal Indicators) (2016) ‘Report of the Inter-agency and Expert Group on Sustainable Development Goal Indicators, Annex IV’. New York: IAEG: SDG.
ICSU (International Council for Science) (2015) Review of targets for the Sustainable Development Goals: The science perspective. Report coordinated by ICSU in partnership with ISSC. Paris: ICSU.
IEG (Independent Evaluation Group) (2011) Social safety nets: An evaluation of World Bank support, 2000-2010. Washington, DC: IEG, World Bank Group.
IISD (International Institute for Sustainable Development) (2016a) ‘UNSC Chair Updates ECOSOC on Indicators, Data’. 1 June. http://sd.iisd.org/news/unsc-chair-updates-ecosoc-on-indicators-data/
IISD (2016b) ‘HLG discusses World Data Forum as 2030 review venue’. http: //sd.iisd.org/news/hlg-discusses-world-data-forum-as-2030-review-venue/
ILO (International Labour Organization) (2005) ILO Social Security Inquiry Manual. First inquiry, 2005. Geneva: ILO.
ILO (2009) ‘Recovering from the crisis: A Global Jobs Pact’. Adopted at the 98th Session, Geneva, 19 June.
ILO (2011) Social Protection Floor for a Fair and Inclusive Globalization. Report of the Advisory Group Chaired by Michelle Bachelet. Convened by the ILO with the collaboration of the WHO. (‘The Bachelet Report’). Geneva: ILO.
ILO (2012) Decent Work Indicators: Concepts and definitions. ILO Manual, First Version. Geneva: ILO.

81REFERENCES
ILO (2016) Social Security Inquiry Manual. Technical Guides. Geneva: ILO.
ISPA (Inter Agency Social Protection Assessments) (2016) http://ispatools.org/
Lay, J. and Prediger, S. (2016) ‘Interlinkages within the 2030 Agenda: Implications for development cooperation’. Analysis and Policy Brief. European Expert Network on International Cooperation and Development.
Lustig, N., Lopez-Calva, L.F. and Ortiz-Juarez, E. (2014) ‘Deconstructing the decline in inequality in Latin America’, in K. Basu and J. Stiglitz (eds) Proceedings of IEA round table on Shared Prosperity and Growth. Basingstoke: Palgrave-Macmillan.
McCord, A. (2013) The Public Pursuit of Secure Welfare. Background Paper on International Development Institutions, Social Protection & Developing Countries. Brussels: EC.
McCord, A. and Slater, R. (2014) Social protection and sustainable employment. Department of Foreign Affairs and Trade, Australia. http://innovation.brac.net/fif2016/images/library/DFAT_Social%20Protection%20and%20Sustainable%20Employment.pdf
Meth, C. (forthcoming) ‘Sen’s shadow: Frailties of the Alkire-Foster MPIs, the “human rights” and the “human develop-ment” approaches to poverty and inequality’.
Muchhala, B. (2016) ‘SDG indicators challenged by many UN member states’. Third World Network: http://www.tralac.org/news/article/9349-sdg-indicators-challenged-by-many-un-member-states.html#downloads
Muñoz, P. and Chuluun, T. (2015) ‘Promote sustained, inclusive and sustainable economic growth, full and productive em-ployment and decent work for all’, in ICSU Review of targets for the Sustainable Development Goals: The science pers-pective. Report coordinated by ICSU in partnership with ISSC. Paris: ICSU.
Nardo, M., Saisana, M., Saltelli, A. and Tarantola, S. (2005) Tools for Composite Indicators Building. Brussels: Applied Statistics Group, Joint Research Centre, EC.
Ocampo, J.A. and Gomez-Arteaga, N. (2016) Social protection systems in Latin America: An assessment. Extension of Social Security (ESS) Working Paper 52. Geneva: SOCPRO, ILO.
ODI, 2012. Inter-Agency Social Protection Financing Workshop 6 th November 2012. https://www.odi.org/sites/odi.org.uk/files/odi-assets/events-documents/4983.pdf
OECD (Organisation for Economic Co-operation and Development) (2012) ‘The Busan Partnership for Effective Development Cooperation’. https://www.oecd.org/dac/effectiveness/Busan%20partnership.pdf
OECD (2013) Action Plan on Base Erosion and Profit Shifting. OECD Publishing. http://dx.doi.org/10.1787/9789264202719-en
Ortiz, I., Pinheiro, V., Schwarzer, H. and Canonge, J. (2014) ‘Social protection floors in the post-2015 agenda: Targets and Indicators’. Social Protection for All Policy Brief. Geneva: ILO.
Stiglitz, J., Sen, A. and Fitoussi, J-P. (2009) Report by the Commission on the Measurement of Economic Performance and Social Progress.
Suter, S. (2014) ‘Background Paper 2 – Goals, Targets and Indicators: Definitions and key concepts for the post-2015 de-velopment agenda. Background Paper 3 – Defining and Prioritizing Targets: Potential criteria for targets in the post-2015 development agenda’. Independent Research Forum 2015
Tilbury, C. (2004) ‘The influence of performance measurement on child welfare policy and practice’, British Journal of Social Work 34(2): 225-241.

82 INDICATORS TO MEASURE SOCIAL PROTECTION PERFORMANCE: IMPLICATIONS FOR EC PROGRAMMING
UN Data Revolution Group (2014) A World That Counts: Mobilising The Data Revolution for Sustainable Development. Data revolution report. http://www.undatarevolution.org/report/
UN Global Partnership for Sustainable Development Data (2016) ‘Progress report, May’.
UN HLG (High-level Group) (2016) ‘Data and indicators for the 2030 Agenda for Sustainable Development. Update on the work of the High-level Group for Partnership, Coordination and Capacity-building for post 2015 Monitoring’. Item 3(a) of the Provisional Agenda Items for Discussion and Decision, Statistical Commission 47th Session, 8-11 March.
UNStats (2016a) ‘Provisional proposed tiers for global SDG indicators as of March 24, 2016’. Prepared by the IAEG-SDG.
UNStats (2016b) ‘Third Meeting of the Inter-agency and Expert Group on Sustainable Development Goal Indicators’, 47th Session of the Statistical Commission: Outcome on Global SDG Indicators. Mexico City, 30 March - 1 April.
UNStats (2016c) ‘Statistical Commission Report on the 47th Session, 8-11 March 2016’. Economic and Social Council Official Records 2016 Supplement No. 4. E/2016/24-E/CN.3/2016/34.
UNStats (2016d) ‘Welcome to the Sustainable Development Goal indicators website’. http://unstats.un.org/sdgs/
Wilkinson, R. and Rogers, D. (2015) ‘Reduce inequality within and among countries’, in ICSU (2015) Review of targets for the Sustainable Development Goals: The science perspective. Report coordinated by ICSU in partnership with ISSC. Paris: ICSU.
World Bank (2012) Resilience, Equity and Opportunity. The World Bank’s Social Protection and Labor Strategy 2012-2022. Washington, DC: World Bank Group.
World Bank (2016) Liberia – Social Safety Nets Project. Washington, DC: World Bank Group. http://documents.worldbank.org/curated/en/2016/05/26216581/liberia-social-safety-nets-project

83DATASETS
DATASETS
ADB Social Protection Index: https://spi.adb.org/spidmz/index.jsp
CEPALSTAT. Data on public expenditure: http://estadisticas.cepal.org/cepalstat/WEB_CEPALSTAT/estadisticasIndicadores.asp?idioma=i. Data on social protection programmes: http://dds.cepal.org/bdptc/
ESSPROS: http://ec.europa.eu/eurostat/web/social-protection/overview
European Union Mutual Information System on Social Protection, Comparative Tables Database: http://www.missoc.org/MISSOC/INFORMATIONBASE/COMPARATIVETABLES/MISSOCDATABASE/comparativeTableSearch.jsp
HelpAge International Pension Watch Database: http://www.pension-watch.net
ILO Social Security Programmes and Mechanisms Database: http://www.ilo.org/dyn/sesame/IFPSES.SocialDatabase
ILO SSED: http://www.ilo.org/dyn/sesame/IFPSES.SocialDBExp
ILO SSI: http://www.ilo.org/dyn/ilossi/ssimain.home?p_lang=en
OECD SOCX: http://www.oecd.org/social/expenditure.htm
OECD SOCR: http://www.oecd.org/social/recipients.htm
World Bank ASPIRE: http://datatopics.worldbank.org/aspire/~/indicator_glance


HOW TO OBTAIN EU PUBLICATIONS
Free publications:
• one copy: via EU Bookshop (http://bookshop.europa.eu);
• more than one copy or posters/maps: from the European Union’s representations (http://ec.europa.eu/represent_en.htm); from the delegations in non-EU countries (http://eeas.europa.eu/delegations/index_en.htm); by contacting the Europe Direct service (http://europa.eu/europedirect/index_en.htm) or calling 00 800 6 7 8 9 10 11 (freephone number from anywhere in the EU) (*)
(*) The information given is free, as are most calls (though some operators, phone boxes or hotels may charge you).
Priced publications:
• via EU Bookshop (http://bookshop.europa.eu).

ISBN 978-92-79-64610-2 doi: 10.2841/606804
MN
-BC-16-0
01-EN-C