concept 14
TRANSCRIPT
8/9/2019 Concept 14
http://slidepdf.com/reader/full/concept-14 1/27
Prentice Hall, 2004 Chapter 14Wheelen/Hunger
1
Chapter 14
Suggestions for Case Analysis
PowerPoint Slides Anthony F. Chelte
Western New England College

8/9/2019 Concept 14
http://slidepdf.com/reader/full/concept-14 2/27
Prentice Hall, 2004 Chapter 14Wheelen/Hunger
2
Case Analysis
Research:
Go beyond information in the case
Research environmental setting Check decision date of case
Use information services ± COMPUSTAT, Compact Disclosure,
CD/International ± www.hoovers.com
± www.sec.gov

8/9/2019 Concept 14
http://slidepdf.com/reader/full/concept-14 3/27
Prentice Hall, 2004 Chapter 14Wheelen/Hunger
3
Case Analysis
Research:
Annual reports
10K form
Income statements
Balance sheets
Cash flow statements
Economic conditions
Industry information

8/9/2019 Concept 14
http://slidepdf.com/reader/full/concept-14 4/27

8/9/2019 Concept 14
http://slidepdf.com/reader/full/concept-14 5/27
Prentice Hall, 2004 Chapter 14Wheelen/Hunger
5
Case Analysis
Resources for Case Library Research:
± Economic Information:
Business Cycle Development
U.S. Census Bureau
Current Business R eports
Economic Indicators
Long-Term Economic Growth Monthly Labor R eview
U.S. Industrial Outlook
Overseas Business R eports

8/9/2019 Concept 14
http://slidepdf.com/reader/full/concept-14 6/27
Prentice Hall, 2004 Chapter 14Wheelen/Hunger
6
Case Analysis
Resources for Case Library Research:
±
Industry Information: Business Week
Fortune
Industry Survey
Industry Week Forbes
Inc.

8/9/2019 Concept 14
http://slidepdf.com/reader/full/concept-14 7/27
Prentice Hall, 2004 Chapter 14Wheelen/Hunger
7
Case Analysis
Resources for Case Library Research:
± Directory and Index Information: Business Periodical Index
Directory of National Trade Associations
Encyclopedia of Associations
Funk and Scott¶s Index of Corporations
and Industries Thomas¶s R egister of American
Manufacturers
Wall Street Journal Index

8/9/2019 Concept 14
http://slidepdf.com/reader/full/concept-14 8/27
Prentice Hall, 2004 Chapter 14Wheelen/Hunger
8
Case Analysis
Resources for Case Library Research:
± Ratio Analysis Information:
Almanac of Business and Industrial
Financial R atios
Annual Statement Studies
Dun¶s R eview
Industry Norms and Key Business R atios
8/9/2019 Concept 14
http://slidepdf.com/reader/full/concept-14 9/27
Prentice Hall, 2004 Chapter 14Wheelen/Hunger
9
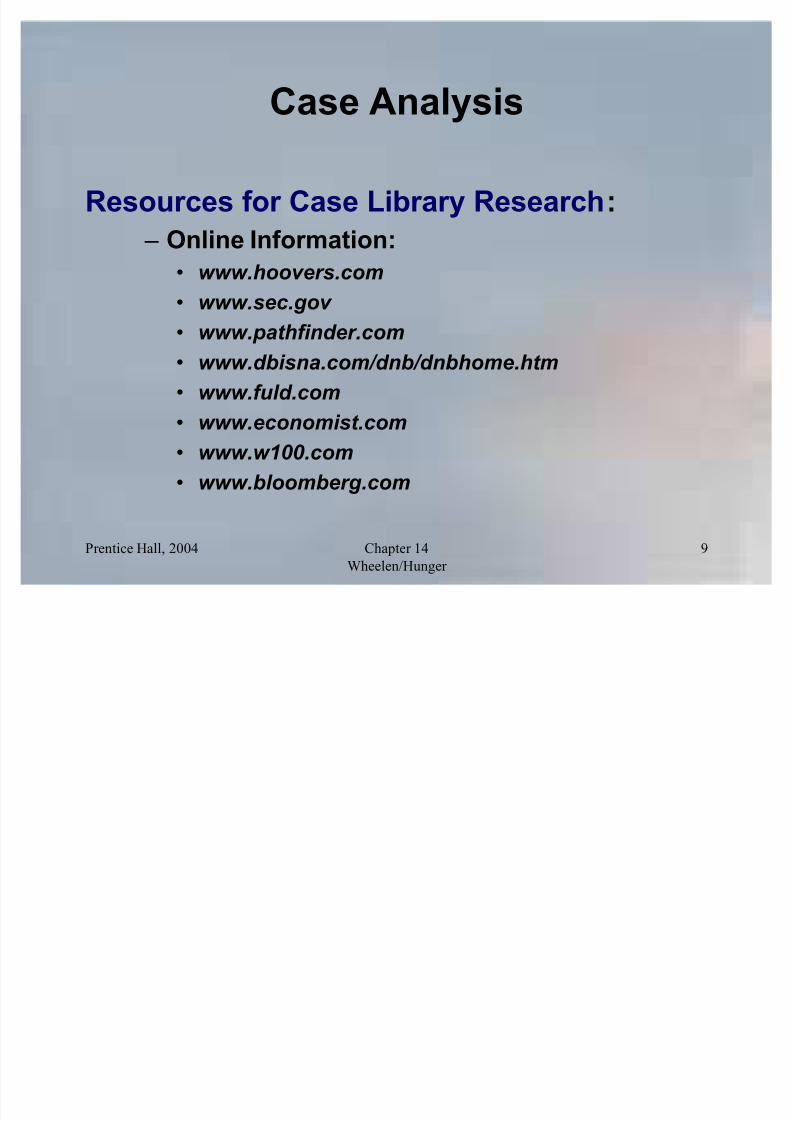
Case Analysis
Resources for Case Library Research:
± Online Information:
www.hoovers.com
www.sec.gov
www.pathfinder.com
www.dbisna.com/dnb/dnbhome.htm
www.fuld.com
www.economist.com
www.w100.com
www.bloomberg.com

8/9/2019 Concept 14
http://slidepdf.com/reader/full/concept-14 10/27

8/9/2019 Concept 14
http://slidepdf.com/reader/full/concept-14 11/27
Prentice Hall, 2004 Chapter 14Wheelen/Hunger
11
Financial Ratio Analysis ² Liquidity
1. Liquidity Ratios
Current ratio
Quick (acid test) ratio
Inventory to networking capital
Cash ratio
HowFormula Expressed Meaning
Current assets²²²²²²²²²
Current liabilities Decimal
Decimal
Decimal
Decimal
A short-term indicator of the company¶sability to pay its short-term liabilitiesfrom short-term assets; how much of current assets are available to cover
each dollar of current liabilities.
Measures the company¶s ability to payoff its short-term obligations fromcurrent assets, excluding inventories.
A measure of inventory balance;measures the extent to which thecushion of excess current assets over current liabilities may be threatened by
unfavorable changes in inventory.
Measures the extent to which thecompany¶s capital is in cash or cashequivalents; shows how much of thecurrent obligations can be paid fromcash or near-cash assets.
Current assets ± Inventory²²²²²²²²²²²²
Current liabilities
Inventory²²²²²²²²²²²²²²²Current assets ± Current liabilities
Cash + Cash equivalents²²²²²²²²²²²
Current liabilities

8/9/2019 Concept 14
http://slidepdf.com/reader/full/concept-14 12/27
Prentice Hall, 2004 Chapter 14Wheelen/Hunger
12
Financial Ratio Analysis ²
Profitability
2 . Profitability Ratios
Net profit margin
Gross profit margin
Return on investment(ROI)
Return on equity(ROE)
Earnings per share(EPS)
HowFormula Expressed Meaning
Net profit after taxes²²²²²²²²²
Net sales Percentage
Percentage
Percentage
Percentage
Dollars per share
Shows how much after-tax profits aregenerated by each dollar of sales.
Indicates the total margin available to
cover other expenses beyond cost of goods sold, and still yield a profit.
Measures the rate of return on the totalassets utilized in the company; ameasure of management¶s efficiency, itshows the return on all the assetsunder its control regardless of sourceof f inancing.
Measures the rate of return on thebook value of shareholders¶ totalinvestment in the company.
Shows the after-tax earningsgenerated for each share of commonstock.
Sales ± Cost of goods sold²²²²²²²²²²²²²
Net sales
Net profit after taxes²²²²²²²²²
Shareholders¶ equity
Net profit after taxes ±
preferred stock dividends²²²²²²²²²²²²
Average number of common shares
Net profit after taxes²²²²²²²²²
Total assets

8/9/2019 Concept 14
http://slidepdf.com/reader/full/concept-14 13/27
Prentice Hall, 2004 Chapter 14Wheelen/Hunger 13
Financial Ratio Analysis ² Activity
3. Activity Ratios
Inventory turnover
Days of inventory
Net working capitalturnover
Asset turnover
Fixed asset turnover
Average collectionperiod
Accounts receivableturnover
Accounts payableperiod
Days of cash
HowFormula Expressed Meaning
Net sales²²²²²²²
Inventory Decimal
Days
Decimal
Decimal
Decimal
Days
Decimal
Days
Days
Measures the number of times that average inventory of finished goods was turned over or sold during a period of time, usually a year.
Measures the number of one day¶s worth of inventory that
a company has on hand at any given time.Measures how effectively the net working capital is usedto generate sales.
Measures the utilization of all the company¶s assets;measures how many sales are generated by each dollar of assets.
Measures the utilization of the company¶s fixed assets(i.e., plant and equipment); measures how many salesare generated by each dollar of fixed assets.
Indicates the average length of time in days that acompany must wait to collect a sale after making it; maybe compared to the credit terms offered by the companyto its customers.
Indicates the number of times that accounts receivableare cycled during the period (usually a year).
Indicates the average length of time in days that thecompany takes to pay its credit purchases.
Indicates the number of days of cash on hand, at presentsales levels.
Inventory²²²²²²²²²²²Cost of goods sold ÷ 365
Net sales²²²²²²²²²Net working capital
Sales²²²²²²²²²
Total assets
Sales²²²²²²²
Fixed assets
Accounts receivable²²²²²²²²²Sales for year ÷ 365
Annual credit sales²²²²²²²²² Accounts receivable
Accounts payable²²²²²²²²²²²²Purchases for year ÷ 365
Cash²²²²²²²²²²²Net sales for year ÷ 365

8/9/2019 Concept 14
http://slidepdf.com/reader/full/concept-14 14/27
Prentice Hall, 2004 Chapter 14Wheelen/Hunger 14
Financial Ratio Analysis ² Leverage
4. Leverage Ratios
Debt to asset ratio
Debt to equity ratio
Long-term debt tocapital structure
Times interest earned
Coverage of fixedcharges
Current liabilities toequity
HowFormula Expressed Meaning
Total debt²²²²²²²
Total assetsPercentage
Percentage
Percentage
Decimal
Decimal
Percentage
Measures the extent to which borrowedfunds have been used to finance thecompany¶s assets.
Measures the funds provided by creditorsversus the funds provided by owners.
Measures the long-term component of capital structure.
Indicates the ability of the company tomeet its annual interest costs.
A measure of the company¶s ability tomeet all of its f ixed-charge obligations.
Measures the short-term financingportion versus that provided by owners.
Total debt²²²²²²²²²Shareholders¶ equity
Long-term debt²²²²²²²²²Shareholders¶ equity
Profit before taxes +Interest charges + Lease charges
²²²²²²²²²²²²²²²²Interest charges + Lease obligations
Profit before taxes + Interest charges²²²²²²²²²²²²²²²²
Interest charges
Current liabilities²²²²²²²²²Shareholders¶ equity

8/9/2019 Concept 14
http://slidepdf.com/reader/full/concept-14 15/27
Prentice Hall, 2004 Chapter 14Wheelen/Hunger 15
Financial Ratio Analysis ² Other
5 . Other Ratios
Price/earning ratio
Dividend payout ratio
Dividend yield oncommon stock
HowFormula Expressed Meaning
Market price per share²²²²²²²²²Earnings per share Decimal
Percentage
Percentage
Shows the current market¶s evaluationof a stock, based on its earnings;shows how much the investor is willingto pay for each dollar of earnings.
Indicates the percentage of profit thatis paid out as dividends.
Indicates the dividend rate of return tocommon shareholders at the current
market price.
Annual dividends per share²²²²²²²²²²²² Annual earnings per share
Annual dividends per share²²²²²²²²²²²²²²²
Current market price per share
Note: In using ratios for analysis, calculate ratios for the corporation and compare them to the average and quartile ratios forthe particular industry. Refer to Standard and Poor·s and Robert Morris Associates for average industry data. Special thanksto Dr. Moustafa H. Abdelsamad, Dean, Business School, Texas A&M University²Corpus Christi, Corpus Christi, Texas, forhis definitions of these ratios.

8/9/2019 Concept 14
http://slidepdf.com/reader/full/concept-14 16/27
Prentice Hall, 2004 Chapter 14Wheelen/Hunger 16
Case Analysis
Analyzing Financial Statements:
± Scrutinize historical statements
± Compare historical statements over
time
± Calculate changes in categories from
year to year
± Determine the change as a percentage ± Adjust for inflation

8/9/2019 Concept 14
http://slidepdf.com/reader/full/concept-14 17/27
Prentice Hall, 2004 Chapter 14Wheelen/Hunger 17
Case Analysis
Common Size Statements: ± Income statements and balance
sheets in which the dollar figures have
been converted into percentages.

8/9/2019 Concept 14
http://slidepdf.com/reader/full/concept-14 18/27
Prentice Hall, 2004 Chapter 14Wheelen/Hunger 18
Altman¶s Bank ruptcy Formula
Z = 1.2 x 1 + 1.4 x 2 + 3.3 x 3 + 0.6 x 4 + 1.0 x 5
where
x 1 = Working capital divided by total assets.
x 2 = Retained earnings divided by total assets. x 3 = Earnings before interest and taxes divided
by total assets.
x 4 = Market value of equity divided by total
liabilities.
x 5 = Sales divided by total assets.Z = Overall index of corporate fiscal health.

8/9/2019 Concept 14
http://slidepdf.com/reader/full/concept-14 19/27
Prentice Hall, 2004 Chapter 14Wheelen/Hunger 19
Index of Sustainable Growth
g*= [ p (1 ± D) (1 + L)] / [T ± P (1 ± D)
(1+L)]
where
P = Net profit before taxes/net sales x 100
D = Target dividends/profit after tax
L = Total liabilities/net worth
T = Total assets/net sales x 100

8/9/2019 Concept 14
http://slidepdf.com/reader/full/concept-14 20/27
Prentice Hall, 2004 Chapter 14Wheelen/Hunger 20
Case Analysis
Operating cash flow: ± Amount of money generated by a
company before the cost of financing
and taxes.
Net income + depletion, amortization,interest expense, and income tax expense

8/9/2019 Concept 14
http://slidepdf.com/reader/full/concept-14 21/27
Prentice Hall, 2004 Chapter 14Wheelen/Hunger 21
Case Analysis
Economic Measures: ± Constant dollars
Dollars adjusted for inflation to make themcomparable over various years.
± CPI
± Prime interest rate Rate of interest banks charge on their lowest risk
loans. ± Gross Domestic Product (GDP)
Total output of goods and services within acountry¶s borders.

8/9/2019 Concept 14
http://slidepdf.com/reader/full/concept-14 22/27
Prentice Hall, 2004 Chapter 14Wheelen/Hunger 22
StrategicAudit Work sheet: Part 1
Analysis CommentsStrategic Audit Heading
(+) Factors (-) Factors
I. C urrent Situation
A. Past C orporate Pe rformance Indexes
B. Strategic PostureCurrent MissionCurrent ObjectivesCurrent Strategies
Current Policies
SWOT Analysis Begins:
II. Corporate Governance
A. Board of Directors
B. Top Management
III. External Environm ent (EFAS):
Opportunities and Threats(SWOT)
A. S ocietal Environment
B. Task Environment Industry Analysis
IV. Internal Environment (IFAS):
Strengths and Weaknesses(SWOT)A. Corporate Structure
B. C orporate Culture
C. Corporate Resources

8/9/2019 Concept 14
http://slidepdf.com/reader/full/concept-14 23/27
Prentice Hall, 2004 Chapter 14Wheelen/Hunger 23
StrategicAudit Work sheet: Part 2
Analysis CommentsStrategic Audit Heading
(+ ) Factors (-) Factors
1. M arketing
2. Finance
3. R esearch and Development
4. Operations and Logistics
5. H uman Re sources
6. Information Systems
V. Analysis of Strategic Factors(SFAS)
A. Key Internal and E xternalStrategic Factors (SWO T)
B. Re view of Mission and Objectives
SWOT Analysis Ends. Recomm endation Begins:
V I. Alternatives and Recommendations
A. Strategic Alternatives
B. Recommended Strategy
V II. Implementation
V III. Evaluation a nd C ontrol

8/9/2019 Concept 14
http://slidepdf.com/reader/full/concept-14 24/27
Prentice Hall, 2004 Chapter 14Wheelen/Hunger 24
Convert the following two years of income statements from the Maytag Corporation into common-size
statements. The dollar figures are in thousands. What does converting to a common size reveal?
1992 % 1991 %
Net sales $3,041,223 $2,970,626Cost of sales 2,339,406 2,254,221
²²²²² ²²²²² ²²²²² ²²²²²
Gross profits 701,817 716,405
Selling, general, and admin. 528,250 524,898
expenses
Reorganization expenses 95,000 ²²²²²² ²²²²² ²²²²² ²²²²²
Operating income 78,567 191,507
Interest expense (75,004) (75,159)
Other²net 3,983 7,069²²²²² ²²²²² ²²²²² ²²²²²
Income before taxes and
accounting changes 7,546 123,417
Income taxes (15,900) (44,400)
Income beforeaccounting changes (8,354) 79,017
Effects of accounting changes for
post-retirement benefits (307,000) ²²²²²² ²²²²² ²²²²² ²²²²²
Net income (loss) $(315,354) $79,017²²²²² ²²²²² ²²²²² ²²²²²²²²²² ²²²²² ²²²²² ²²²²²

8/9/2019 Concept 14
http://slidepdf.com/reader/full/concept-14 25/27
Prentice Hall, 2004 Chapter 14
Wheelen/Hunger
25
Case Analysis
Case Analysis Method:
Read case Read case with strategic audit
Do outside research
Begin SWOT analysis EFAS
IFAS

8/9/2019 Concept 14
http://slidepdf.com/reader/full/concept-14 26/27

8/9/2019 Concept 14
http://slidepdf.com/reader/full/concept-14 27/27