comsol magazine...
TRANSCRIPT

MULTIPHYSICSSIMULATION
OCTOBER 2017
Sponsored by
MULTIPHYSICS MULTISCALE
MULTIRATEANALYZING THE LHC MAGNET
QUENCHES AT CERNPAGE 6
Image supplied by CERN. Copyright © CERN.
COMSOL MULTIPHYSICS SEPTEMBER 2016
M U L T I P H Y S I C S S I M U L A T I O N
+ ONLINE: www.comsol.com/products
COMSOL, COMSOL Multiphysics, and COMSOL Desktop are registered trademarks of COMSOL AB. COMSOL Server and LiveLink are trademarks of COMSOL AB.
OVER THE YEARS WE’VE PARTNERED with COMSOL to describe how technology teams are using multiphysics simulation to inform and enhance their design innovation processes.
This issue of Multiphysics Simulation contains some wide-ranging examples of how numerical simulation is being used to transform R&D and product design at leading organizations.
Vehicular electrification companies, 5G component manufacturers, and large scientific research groups have all benefited from using multiphysics simulation design tools to tackle the formidable and unique technology challenges they face.
The electric car manufacturer Faraday Future used multiphysics simulation to reduce the number of design iterations of one of their motors from 10 to 2.
Manufacturing and consulting company Signal Microwave is producing on-demand connectors for high-speed RF applications by using multiphysics simulation to optimize their designs for connecting myriad network components. Building these components is essential to successfully competing in the race to implement 5G technology.
The CERN Large Hadron Collider team designed a fault protection device that helped it avoid costly shutdowns of the collider’s cooling systems.
In all of these cases, numerical simulation enabled new concepts to be explored, verified, and optimized quickly and inexpensively. Tech companies that aspire to lead their sectors in design and productivity need to deploy tools like these to gain and maintain a competitive advantage in rapidly changing markets.
I hope you enjoy reading about the impressive design innovations put forward in this special COMSOL report.
By MICHAEL FORSTER, MANAGING DIRECTOR — PUBLICATIONS, IEEE
CONTENTS
ON THE COVER: 3D view of the LHC machine. Image is courtesy of CERN.
10 INNOVATIVE MOTOR DESIGNS
FOR ELECTRIC CARS COME TO LIFE—Faraday Future, USA
6 ANALYZING THE LHC MAGNET QUENCHES
—CERN, Switzerland
13 INVISIBLE CONNECTORS WILL
UNVEIL OUR 5G FUTURE—Signal Microwave, USA
16 FUEL CELLS POISED TO REPLACE INDIA’S
DIESEL GENERATORS— NCL, India
3 IT’S A BIRD, IT’S A PLANE: FLOW PATTERNS
AROUND AN OSCILLATING PIEZOELECTRIC FAN BLADE —Nokia Bell Labs, Ireland
22 SIMULATION APPS BRING STEM TO LIFE
—University of Hartford, USA
27 A NEW ROUTE TO HIGH SENSITIVITY
PRESSURE SENSORS—Unicamp and IEAv, Brazil
30 MODELING AND SIMULATION FOR
MEETING THE CHALLENGES OF BATTERY DESIGN—COMSOL, USA
24 MTC DEVELOPS SIMULATION
APP TO REVOLUTIONIZE DESIGN FOR ADDITIVE MANUFACTURED PARTS—MTC, UK
SUCCESSFUL DESIGN INNOVATION DEPENDS ON MULTIPHYSICS SIMULATION
2
19 PEELING AWAY MEMORY CHIPS
—Besi, Switzerland
32 THE BEST ENGINEERING
DESIGNS ARE A COLLABORATIVE EFFORT— Cornell Dubilier Electronics, USA
3COMSOL MULTIPHYSICSOCTOBER 2017Courtesy of Nokia © 2017 Nokia. All Rights Reserved.
IT’S A BIRD, IT’S A PLANE: FLOW PATTERNS AROUND AN OSCILLATING PIEZOELECTRIC FAN BLADEEngineers at Nokia Bell Labs use multiphysics simulation to capture the interplay between an oscillating piezoelectric fan and the surrounding airflow in the pursuit of a quiet, reliable, and low-energy cooling solution.
By SARAH FIELDS
FROM A SNAKE’S MOVEMENT, TO A GECKO’S CLIMBING GRIP, to a cheetah’s running stride, bio-inspired design is making its way into robotics, electronics, and medical device innovations. Among the creatures that have influenced recent tech developments, the motion of a bird’s wings has inspired the creation of an oscillating piezoelectric fan blade.
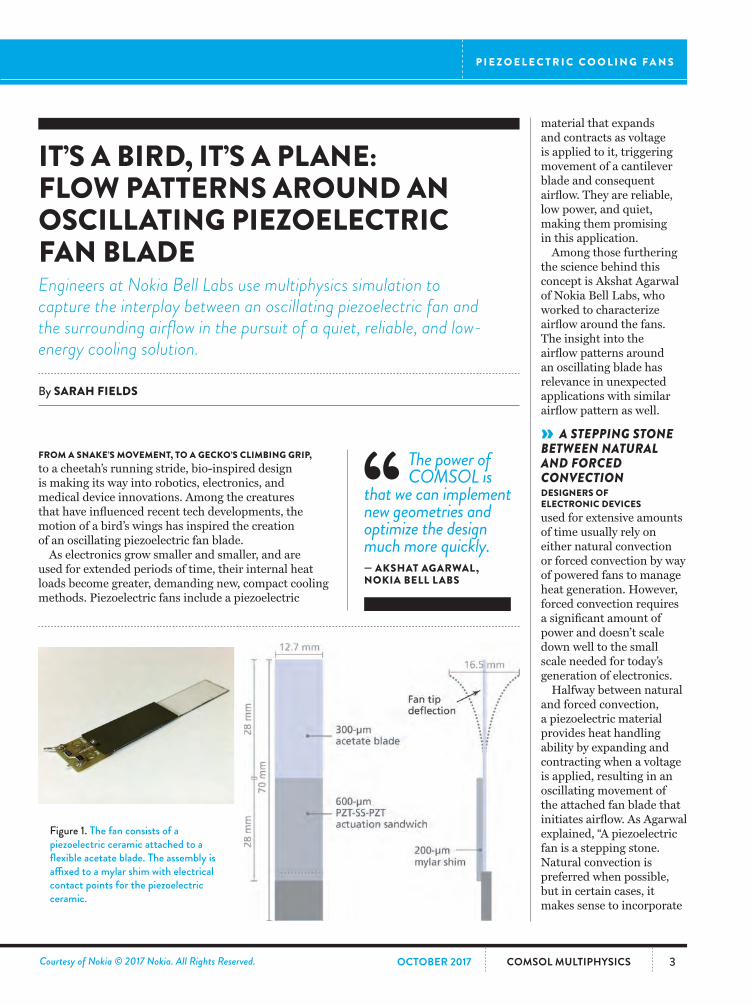
As electronics grow smaller and smaller, and are used for extended periods of time, their internal heat loads become greater, demanding new, compact cooling methods. Piezoelectric fans include a piezoelectric
Figure 1. The fan consists of a piezoelectric ceramic attached to a flexible acetate blade. The assembly is affixed to a mylar shim with electrical contact points for the piezoelectric ceramic.
material that expands and contracts as voltage is applied to it, triggering movement of a cantilever blade and consequent airflow. They are reliable, low power, and quiet, making them promising in this application.
Among those furthering the science behind this concept is Akshat Agarwal of Nokia Bell Labs, who worked to characterize airflow around the fans. The insight into the airflow patterns around an oscillating blade has relevance in unexpected applications with similar airflow pattern as well.
» A STEPPING STONE BETWEEN NATURAL AND FORCED CONVECTIONDESIGNERS OF ELECTRONIC DEVICES used for extensive amounts of time usually rely on either natural convection or forced convection by way of powered fans to manage heat generation. However, forced convection requires a significant amount of power and doesn’t scale down well to the small scale needed for today’s generation of electronics.
Halfway between natural and forced convection, a piezoelectric material provides heat handling ability by expanding and contracting when a voltage is applied, resulting in an oscillating movement of the attached fan blade that initiates airflow. As Agarwal explained, “A piezoelectric fan is a stepping stone. Natural convection is preferred when possible, but in certain cases, it makes sense to incorporate
The power of COMSOL is
that we can implement new geometries and optimize the design much more quickly.— AKSHAT AGARWAL, NOKIA BELL LABS
P I E Z O E L E C T R I C C O O L I N G F A N S

4 COMSOL MULTIPHYSICS OCTOBER 2017
an active part to move the air.” The fan blade used in the research at Nokia consists of a piezoelectric material bonded to an acetate strip and a mylar shim (Figure 1).
With a dynamic system on a small scale, understanding the fluid dynamics can be tricky. In order to truly capture the airflow around the oscillating beam, the engineers at Nokia needed to expand upon work that had been done in two dimensions to three-dimensional simulations and physical testing.
» DETERMINING THE AIRFLOW PATTERNENGINEERS AT NOKIA BELL LABS first characterized the system experimentally using phase-locked particle image velocimetry (PIV), which allowed them to determine the vorticity and in-plane velocity of an unconfined fan in free space (Figure 2), for a total of 11 positions of the oscillating beam. For each position, data was acquired along five x-y planes and five x-z planes to obtain a 3D field.
The next step was to model the beam-air interaction to gain further insight into the
system. When it came to determining a strategy for the simulation, speed and accuracy were key considerations.
“It was important for us to be able to accurately model fluid flow around the blade as fast as possible,” Agarwal said. “This would let us virtually perform design iterations and investigate how these blades would behave in many different situations.”
The engineers first looked at modeling methods used in literature, but the computational demands of such approaches led them to consider another approach.
The COMSOL® software would demand fewer computational resources and included the arbitrary Lagrangian-Eulerian method, the preferred method for simulating the physics of this system. This method combines fluid flow formulated using an Eulerian description with solid mechanics formulated using a Lagrangian description.
Agarwal used COMSOL to perform a 3D bidirectional fluid-structure interaction (FSI) analysis of the forces and fluid behavior in and around the oscillating blade. This
Nor
mal
ised
Def
lect
ion
Phase
-�/2 -3�/11 0 3�/11 �/2
Accelerating tip
Zero tip velocity
Peak tip velocityDecelerating tip
Zero tip velocity
Fan Motion
−� −�/2 0 �/2 �−1
−0.8
−0.6
−0.4
−0.2
0
0.2
0.4
0.6
0.8
1
Measured data
−3�/11 3�/11
Nor
mal
ised
Def
lect
ion
Phase
-�/2 -3�/11 0 3�/11 �/2
Accelerating tip
Zero tip velocity
Peak tip velocityDecelerating tip
Zero tip velocity
Fan Motion
−� −�/2 0 �/2 �−1
−0.8
−0.6
−0.4
−0.2
0
0.2
0.4
0.6
0.8
1
Measured data
−3�/11 3�/11
Figure 2. Top left: Plot of the phase-locked measurements showing displacement of the normalized fan tip. Top right: Illustration showing the deflection of the fan for half a time period. Bottom: Phase-locked PIV measurements for the vorticity (colored contour map) and the in-plane velocity (vector field) of an unconfined fan.
P I E Z O E L E C T R I C C O O L I N G F A N S

5COMSOL MULTIPHYSICSOCTOBER 2017
Figure 3. The COMSOL simulation shows the vorticity and the velocity field at two positions during oscillation.
analysis allowed him to accurately capture the physics of the system. Thanks to the flexibility of COMSOL, Agarwal was able to simplify the design in some of his simulations to select the best approach in each aspect of the simulation.
To simplify the study for computational efficiency, the engineers modeled the shear force and fluid pressure during the movement instead of studying the fan actuation itself. The simulation results revealed the fluid velocity (Figure 3), as well as the structures of the vortices and their movement around the fan blade (Figure 4).
“We obtained a picture of the airflow close to the blade, with a better resolution than what we could get from experimental results. At the edge of the blade is where most flow occurs and momentum is greatest. From our experiments, we were able to look at the velocimetry image and capture planes of motion. Then we stitched those
planes together to obtain the shape of the vortices. But the resolution is limited because you can only get a certain number of planes during an experiment,” Agarwal added. “When you do a full 3D simulation of such a problem, you can study velocity close to the fan and far away, and you can plot many different variables.”
“The software also provides a way to extract data evaluated on the mesh or grid defined by the user. That data can then be used however needed, for example, in another software, or processed with a script,” Agarwal explained, referring to the postprocessing he performed to generate representations of the vorticity in the airflow around the blade.
» ANALYSIS AND EXPERIMENT: A POWERFUL COMBINATIONTHE NOKIA BELL LABS TEAM FOUND that their
simulations captured all the details and dynamics of the system and the simulations analyzed airflow and movement near the blade in more detail than physical experimentation alone. Their study resulted in a validated model that they expect to use as a benchmark in future designs. Knowledge from their results can even be used for applications in other fields, such as flapping wing unmanned aerial vehicles (UAVs).
“The power of COMSOL is that we can implement new geometries and optimize the design much more quickly. I was able to play with the design and take the best of the design features that I was after,” Agarwal concluded. Future studies may examine the airflow and fluid dynamics around more than one oscillating blade, to understand how multiple fans used together might impact the cooling effect.
From left to right: Nicholas Jeffers, Kevin Nolan, Diarmuid O’Connell, and Akshat Agarwal.
6 COMSOL MULTIPHYSICS OCTOBER 2017
L H C P R O T E C T I O N S Y S T E M
to the energy stored in 1.5 tons of dynamite. In the unlikely event of an unprotected quench occurring at nominal energy, high-field accelerator magnets will very likely be severely damaged beyond the possibility of repair. The replacement of a faulty magnet would take up to several months, severely impacting machine availability, since no beam operation would be possible.
Lorenzo Bortot, electrical engineer and research fellow at CERN, worked on the development of a 2D finite element, electrothermal rep-resentation for superconducting magnets. He develops time domain studies, suitable for assessing the performance of the newest techno-logical solutions for the automated quench response systems.
» DETECTING THE QUENCHDURING THE NORMAL OPERATION, the magnets are mostly at a steady state,
ANALYZING THE LHC MAGNET QUENCHESEngineers at CERN use multiphysics simulation to improve the understanding of transient effects in superconducting magnets and magnet circuits of the Large Hadron Collider.
By SARAH FIELDS & LEXI CARVER
AT THE EUROPEAN ORGANIZATION FOR NUCLEAR RESEARCH (CERN), located near Geneva, Switzerland, physicists and engineers conduct experiments that aim to answer fundamental questions in particle physics and about the origin and nature of our universe.
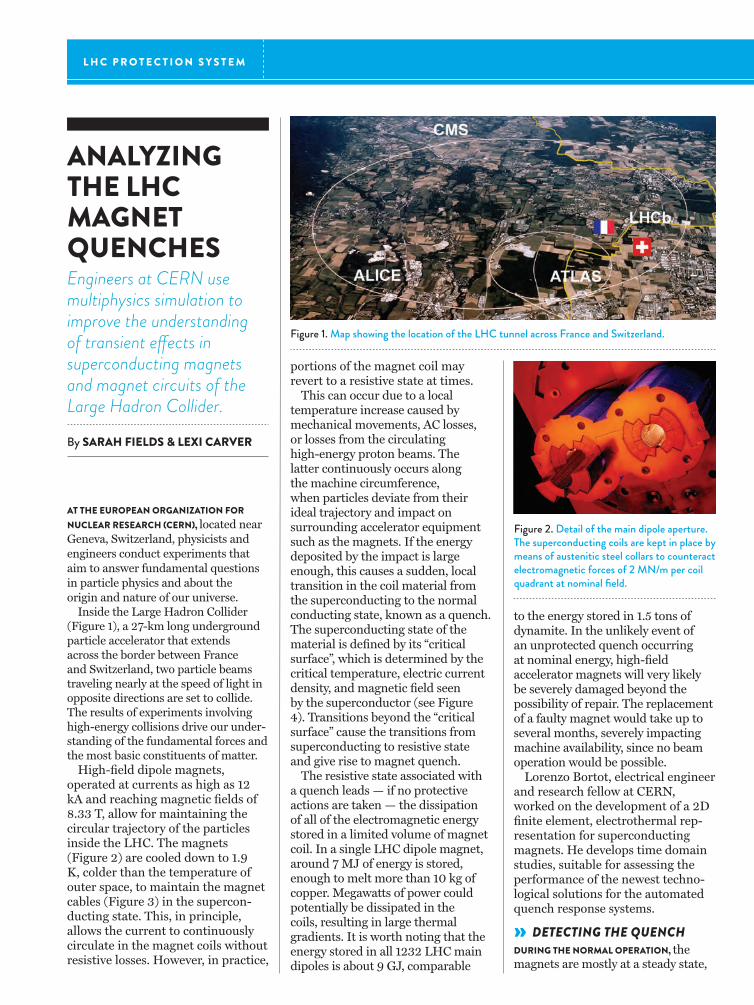
Inside the Large Hadron Collider (Figure 1), a 27-km long underground particle accelerator that extends across the border between France and Switzerland, two particle beams traveling nearly at the speed of light in opposite directions are set to collide. The results of experiments involving high-energy collisions drive our under-standing of the fundamental forces and the most basic constituents of matter.
High-field dipole magnets, operated at currents as high as 12 kA and reaching magnetic fields of 8.33 T, allow for maintaining the circular trajectory of the particles inside the LHC. The magnets (Figure 2) are cooled down to 1.9 K, colder than the temperature of outer space, to maintain the magnet cables (Figure 3) in the supercon-ducting state. This, in principle, allows the current to continuously circulate in the magnet coils without resistive losses. However, in practice,
portions of the magnet coil may revert to a resistive state at times.
This can occur due to a local temperature increase caused by mechanical movements, AC losses, or losses from the circulating high-energy proton beams. The latter continuously occurs along the machine circumference, when particles deviate from their ideal trajectory and impact on surrounding accelerator equipment such as the magnets. If the energy deposited by the impact is large enough, this causes a sudden, local transition in the coil material from the superconducting to the normal conducting state, known as a quench. The superconducting state of the material is defined by its “critical surface”, which is determined by the critical temperature, electric current density, and magnetic field seen by the superconductor (see Figure 4). Transitions beyond the “critical surface” cause the transitions from superconducting to resistive state and give rise to magnet quench.
The resistive state associated with a quench leads — if no protective actions are taken — the dissipation of all of the electromagnetic energy stored in a limited volume of magnet coil. In a single LHC dipole magnet, around 7 MJ of energy is stored, enough to melt more than 10 kg of copper. Megawatts of power could potentially be dissipated in the coils, resulting in large thermal gradients. It is worth noting that the energy stored in all 1232 LHC main dipoles is about 9 GJ, comparable
Figure 1. Map showing the location of the LHC tunnel across France and Switzerland.
Figure 2. Detail of the main dipole aperture. The superconducting coils are kept in place by means of austenitic steel collars to counteract electromagnetic forces of 2 MN/m per coil quadrant at nominal field.

7COMSOL MULTIPHYSICSOCTOBER 2017
Figure 4. Critical surface for the Nb-Ti superconducting material of the magnets.
Figure 5. A model shows magnetic fields in the magnet with nominal current applied during its superconducting state.
Figure 3. Left: A cross section of the LHC main dipole. Red and blue domains represent the superconducting coils keeping the particles in a circular trajectory. The gray domain represents the iron yoke. Right: High-current superconducting magnets in the Large Hadron Collider are based on cables made of superconducting microfilaments embedded in a copper matrix.
and their field (Figure 5) guides the particles through the LHC. The coils are superconducting, so the measured voltage drops across the magnets are equal to zero, and almost no Joule losses are observed. Dedicated electronic systems monitor the magnets and react quickly to the sudden presence of a resistive voltage drop across a coil or between neighboring magnets. Once the signal exceeds a certain voltage threshold for a minimum validating time, the quench detection system will trigger protective actions.
Not only must the protection system be properly designed and adapted to the supervised magnet, but the electronics must be properly configured and optimized. On one hand, the detection system must be kept sensitive enough to not miss any quench event. On the other hand, applying unnecessarily strict criteria could potentially lead to false alarms. These would result in the interrup-tion of LHC operation and undesired downtimes up to several hours, reducing the machine availability.
» PROTECTING AGAINST QUENCHTHE MAGNET QUENCH PROTECTION SYSTEM EXPLOITS A SIMPLE yet effective strategy: Spread the quench along the entire magnet to maximize the volume where energy gets dissipated, instead of allowing only a fraction of the magnet to absorb all of the stored energy.
“We heat the magnet itself up to increase the size of the normal conducting zone and dissipate the energy stored in the magnet over the entire coil volume,” Bortot explained. “This trick is counterintuitive: As long as the magnet is in normal operation, we want it as cold as possible to maintain its superconducting state — but if a single point fails, we then need to heat up the entire magnet as quickly as possible. Homogeneity is key.”
A novel yet very promising technology for quench protection recently developed at CERN is called the Coupling-Loss Induced Quench system (CLIQ). Its main component is a charged capacitor bank connected in parallel to the magnet’s coil. When enabled, it introduces an LC
resonance, forcing an oscillation of the magnetic field within the magnet.
This in turn induces the coupling and eddy currents in the cable, including at the level of the filament structure. The coil heats up from the inside in a very uniform way, in a process analogous to microwave heating. The aim of CLIQ is twofold: maximize the volume over which the eddy currents are induced, and minimize the time required for these losses to force the superconductive cable passed the critical temperature over which it becomes resistive. At this point, energy dissipation is dominated by Joule heating, which occurs over nearly the whole coil length instead of being localized to one region, allowing the quenching zone and resistive heating to spread as evenly as possible.
» COMPUTATIONAL CHALLENGESA TEAM OF ELECTRICAL ENGINEERS at CERN is also developing a modular framework, based on a combination of commercial tools for simulating transient effects in accelerator magnet circuits. Bortot, specializing in COMSOL Multiphysics® software and Java® code, created a numerical model of the electrodynamics and thermal evolution of the quench propagation. This required careful setup and flexible tools to account for all of the computational challenges.
The cross section of an LHC dipole magnet contains several hundred of subdomains, each representing
Oracle and Java are registered trademarks of Oracle and/or its affiliates.

8 COMSOL MULTIPHYSICS OCTOBER 2017
where each magnet half-turn can quench independently of the others, a dedicated set of equations is needed for each subdomain.”
Representing the electrodynam-ics and thermal evolution of a quench event involves modeling behavior on the scale of both meters (due to the size of the magnet cross section) and micrometers (due to the small diameter of the filaments within the cable). Furthermore, the quench is initiated in only a few microseconds and propagates in the order of millisec-onds, while the complete discharge of the magnet can take up to one second. The team needed to study three very different timescales simultaneously.
“This problem is multiphysics, multiscale, and multirate,” Bortot explained. “Interdependent phenomena develop at different spatial and temporal scales.”
Most simulation software lacks the power to set up the model in a com-putationally efficient way and would necessitate a mesh covering six orders of magnitude and a solver time step fixed by the fastest time scale, creating an extraordinary amount of data and unreasonable computation time.
To circumvent this issue, the team at CERN implemented an expression for equivalent magnetization to analyze the system in the COMSOL® software (Figure 7). Instead of resolving the micrometric scale paths of the coupling currents occurring in the superconducting cable, they modeled such parasitic currents through their equivalent effect on the resulting magnetic field. “We implemented a formulation where we have an equivalent magnetization that is pro-portional to the derivative of the field through a time constant,” says Bortot. “This is a combination of Faraday-Neumann-Lenz and Ampère-Maxwell’s laws blended together. We could do this because we know the path the coupling currents will take in the cable and so we could associate
Figure 6. Top: Geometry of the magnet sections. Bottom: Mesh of the finite element model of the magnet sections.
a half-turn of the wound cable that composes the coil (Figure 6, top). Not all the half-turns quench at the same time, but due to the local nature of the quench, the phenomenon propagates and spreads through the cross section creating a complicated behavior to model. “It is important to find a way to couple heat and electrodynamics in a consistent way,” Bortot explained. “In order to represent such a geometry,
Being able to edit the equations COMSOL solves,I could modify their formulation for my needs.”
— LORENZO BORTOT, ELECTRICAL ENGINEER, CERNFigure 7. Equivalent magnetization of the eddy currents (A/m) during a linear ramp-up of 100 A/s at 8 kA.
an equivalent time constant.”Bortot also took advantage of the
flexibility COMSOL offers to edit the standard Maxwell equations and change the variables. “Being able to edit the equations COMSOL solves, I could modify the standard vector potential formulation for my needs. Moreover, it was imperative that we have access to the previous solution time step because we needed the field derivative.
“Since we were already considering the coupling currents in the equivalent magnetization, we didn’t want any more currents circulating — they were already embedded. I disabled the induced currents over the coil domain and this simplified a lot of work. This was, I would say, the keystone of the whole architecture.” By not directly
Figure 8. Different losses mechanisms in the coil, in W/m3. Top: CLIQ-induced eddy current losses. Bottom: Ohmic losses due to the spread of the quench.
L H C P R O T E C T I O N S Y S T E M

9COMSOL MULTIPHYSICSOCTOBER 2017
Figure 9. Temperature distribution (K) in the coil after a 500 ms quench event.
Figure 10. The COMSOL® software model results during a quench. Top: Growth of the Ohmic resistance in the coil. Bottom: Voltage signal extracted at the coil’s terminals.
quench throughout the magnet, ensuring that the right level of power was injected into the coil. The model furthermore allowed for the extraction of quench-related lumped parameters such as the coil resistance and voltage over time (Figure 10), to be used as further input for circuital models simulating the magnet’s external electrical network.
» FROM THE LHC TO THE ACCELERATORS OF THE FUTUREFROM BORTOT’S SIMULATION RESULTS, it was possible to reproduce the interconnected physics phenomena involved in the sudden energy dissipation, providing an analysis tool suitable for the deep investigation of magnet quench phenomena.
The models are now being extended to the magnets currently under design and construction for the High Luminosity upgrade for LHC and for the Future Circular Collider project, the next-generation accelerator. The feasibility of extending the models to the 3D domain will also be explored (Figure 11). Running in parallel to the design process, the models will support and contribute to the development of the future quench detection and protection systems. The team’s contribution will help in protecting current and future accelerators from the consequences of quenches, allowing researchers to continue their investigations into the nature of matter without fear of damage to the superconducting magnets.
modeling the coupling currents, they were also able to significantly simplify the mesh (Figure 6, bottom).
In addition to the consistent
From left to right: Lorenzo Bortot, Michal Maciejewski, and Marco Prioli.
Figure 11. Proposed geometry and mesh for a future 3D model
modeling of the physics of the system, the practical construction of the model itself represents its own challenge. At cryogenic temperatures, the highly nonlinear material properties manifest as complicated numerical structures that are efficiently implemented and managed via external C functions, arranged in a shared, common library. Moreover, each half-turn needs to be characterized with both its related set of variables and operators and its micrometric insulation coating. The latter is critical for correctly capturing the quench propagation, and it is modeled with the built-in thin layer feature, that prevents an explicit mesh.
The assembly of these repetitive subunits is automated to be time-efficient and reduce the likelihood of human error. For this reason, the FEM model of the magnet’s cross section is created by a Java routine that transforms a user’s input into a distributed model, relying on the Application Programming Interface (API) provided by COMSOL. This guarantees that the FEM approach has the flexibility to adapt to different magnet types.
Modeling the coupling currents as an equivalent magnetization allowed them to calculate losses immediately and express them as a function of the magnetic field variation. The team concluded that a variation of the magnetic field is directly dissipated as equivalent coupling current losses.
One of the main achievements was a simulation of a quench event in the LHC main dipole, assuming the sudden activation of the CLIQ protection system for the mitigation of the quench consequences. The analysis, which accounts for nonlinear temperature- and magnetic field- dependent material properties, investigated the oscillations in the magnetic field and the induced eddy and coupling current losses (Figure 8, top) in the superconductor; the spread of the quench and the resulting resistive heating (Figure 8, bottom); and the final temperature distribution due to the thermal loss deposition in the coil (Figure 9). By solving the heat balance equation, the design of the CLIQ unit was also cross-checked confirming the proper temperature was obtained in order to spread the
10 COMSOL MULTIPHYSICS OCTOBER 2017
INNOVATIVE MOTOR DESIGNS FOR ELECTRIC CARS COME TO LIFEFaraday Future designs motors for electric cars.
By GEMMA CHURCH
THE AUTOMOTIVE INDUSTRY IS IN THE MIDST OF A DISRUPTION, and the transcendence of electric vehicles from niche to mainstream is a driving force behind this change.
Challenges remain to improve the motor designs used in electric vehicles. One potential solution is the use of power magnetic devices (PMDs), a category of devices that includes motors, generators, transformers, and inductors. In simple terms, these components utilize an electromagnetic field to convert electrical energy to mechanical energy, or vice versa.
In the field of power engineering, and particularly in the design of PMDs, modern advances are targeted at reducing system losses, mass, volume, and cost, while simultaneously increasing power capability, reliability, and large-scale manufacturability.
» MODELING, OPTIMIZATION, AND COLLABORATION COME TOGETHER ACHIEVING THESE COMPETING OBJECTIVES in modern applications requires advanced methods to optimize the design of various PMDs such as electric motors. These include computationally efficient device models in conjunction with state-of-the-art optimization techniques. Furthermore, the design constraints pertaining to electric motors represent a complex multiphysics problem from a mechanical, electrical, and thermal perspective.
Faraday Future, a start-up technology company focused on the development of intelligent electric vehicles, is using COMSOL Multiphysics® software, a multiphysics finite element analysis program, to produce cutting-edge electric motors with high power density.
The organization is also taking an innovative, modular approach to electric vehicle design. Omar Laldin, lead electromagnetic engineer at Faraday Future, explained: “My group develops motor designs for a generic set of vehicles, primarily suited to our variable platform architecture, which allows for modular development of electric vehicle powertrains. We can add or remove motors,
adjust battery quantities, and collapse or increase the size of the chassis.
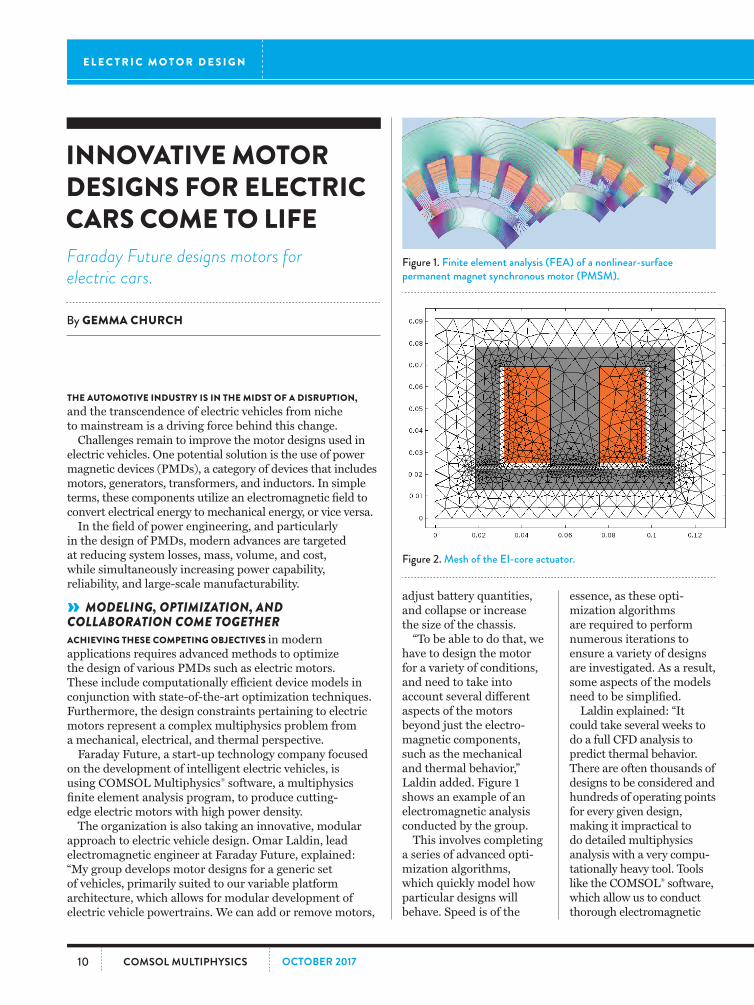
“To be able to do that, we have to design the motor for a variety of conditions, and need to take into account several different aspects of the motors beyond just the electro-magnetic components, such as the mechanical and thermal behavior,” Laldin added. Figure 1 shows an example of an electromagnetic analysis conducted by the group.
This involves completing a series of advanced opti-mization algorithms, which quickly model how particular designs will behave. Speed is of the
essence, as these opti-mization algorithms are required to perform numerous iterations to ensure a variety of designs are investigated. As a result, some aspects of the models need to be simplified.
Laldin explained: “It could take several weeks to do a full CFD analysis to predict thermal behavior. There are often thousands of designs to be considered and hundreds of operating points for every given design, making it impractical to do detailed multiphysics analysis with a very compu-tationally heavy tool. Tools like the COMSOL® software, which allow us to conduct thorough electromagnetic
Figure 1. Finite element analysis (FEA) of a nonlinear-surface permanent magnet synchronous motor (PMSM).
Figure 2. Mesh of the EI-core actuator.
E L E C T R I C M O T O R D E S I G N

11COMSOL MULTIPHYSICSOCTOBER 2017
Figure 3. Left: Pareto-Optimal Front providing mass vs. loss tradeoff. Right: Magnetic flux distribution in the EI-core actuator.
and mechanical analyses along with simplified thermal analysis, work in a very stable way and give us quick feedback on each of these aspects during the design process.”
The versatility of COMSOL also helps the Electromagnetic Motor Design Group collaborate with the other teams within Faraday Future, including Motor Mechanical, Inverter, Motor Control, Powertrain Control, Systems Engineering, and so forth. Collectively, these groups form the Powertrain Group within the organization.
“We do all the early stage analysis before we send data to other teams to make sure we’re in the right ballpark, and that limits the number of iterations we have to do with other teams. I think that’s one of the most beneficial aspects of the COMSOL simulation and modeling tools,” he added.
» DESIGNING AN ACTUATORTHE EM TEAM DESIGNED an EI-core actuator to meet certain constraints, while obtaining a compromise between competing volume and power loss objectives. While the power loss must be minimized, they did not want to increase the size of the component to do so, as package size is a critical metric in most vehicular systems. The actuator was made up of a coil of conducting wire wrapped around a stationary E-core, along with a movable I-core (Figure 2).
They performed a 2D electromagnetic field analysis in COMSOL®, coupled with a genetic algorithm implemented in MATLAB® software. The model accounted for the highly
nonlinear behavior of the various steel materials, while the genetic algorithm provided the globally optimized and multi-objective Pareto-Optimal Fronts, which provided the tradeoff between reducing the volume and power loss (Figure 3).
They used geometric parameters of the actuator as inputs in the algorithm and obtained losses based on the coil resistance. This allowed for the rapid investigation of numerous designs of the electromagnetic actuator, capable of delivering 2500 N of force.
» INVESTIGATING LOSSESTHE TEAM INVESTIGATED the nonlinearity of the steel used in electric motors, which changes the nature of high-frequency conductor losses in a slot. These losses increase at high speeds due to the increase in skin and proximity effect in the conductors; they are also affected by the temperature. Due to the geometry of
the motor, some winding architectures and their conductors are more easily cooled than others. For example, the spacing of the conductors and their dimensions can affect the heat transfer in the slot.
Laldin and his colleagues performed further multi-physics analysis, coupling the electromagnet-ic components with the thermal behavior to identify hotspots in the motor that could cause catastroph-ic failure. They discovered that the current density within the conductors changed significantly due to changes in flux density across the slot. They calculated the loss density in each of the conductors and then obtained the temperature distribu-tion, which provided the maximum hot spot tem-peratures in different areas of the motor (Figure 4).
Laldin said: “The loss in different conductors can vary even if we have the same current. We model these variations and do some
COMSOL was a very natural choice for us, as we are developing state-of-the-art
technologies and appreciate the need for speed.— OMAR LALDIN, LEAD ELECTROMAGNETIC ENGINEER, FARADAY FUTURE
MATLAB is a registered trademark of The MathWorks, Inc.

12 COMSOL MULTIPHYSICS OCTOBER 2017
approximate and quick thermal analysis in COMSOL, which allows us to study the temperature distribution.”
Identifying the maximum hot spot temperatures enables manufacturers to determine the reliability of the design and prevent destructive motor events.
This multiphysics approach brings further time savings to Faraday Future, as one person can both design and analyze a motor and/or its components. Laldin said: “Instead of doing 10 iterations with the various teams, our tools allow us to complete the design in 1 to 2 iterations. This is one of the biggest advantages of having a multiphysics analysis tool — we can cut down on the number of iterations we need to do between different groups. It’s a lot quicker for one person to optimize the design, followed by minor refinements across the teams, than it is for each team to independently analyze each aspect of the physics.”
» APPLICATION EXCHANGE FOR THE FUTUREFARADAY FUTURE IS A RELATIVELY young company, yet it has achieved great strides in the electric vehicle sector as they designed, developed, and constructed a working electric vehicle within just two years. The organization has embraced COMSOL’s Application Exchange, an online community where users can upload and share their models
Figure 4. Left to right: Model geometry, magnetic flux, current density, power loss, and temperature distribution in a model of a stator slot.
and discuss techniques and findings with other users, to help fuel this growth. Laldin said: “The only realistic way to achieve such innovation is to utilize the experience of our suppliers and the capabilities they have. In a user community, it’s a lot easier to find solutions for problems that we all have in the field.”
Laldin added: “COMSOL was a very natural choice for us, as we are developing cutting-edge technologies and appreciate the need for speed. For example, if I need a new feature in the software, the company is very responsive in including that feature in the next release.”
The open and dynamic
Application Exchange platform will also help Faraday Future stay ahead of the competition, as Laldin added: “On top of that, fostering this online community fits with the start-up mentality, where you’re willing to contribute non-sensitive data and know-how in an open exchange for the benefit of everyone involved. I have always felt that you get more out of user communities and the exchange than what you put into them, especially when it’s backed by a state-of-the-art industrial partner. It’s a very good combination for a company like ours.”
MODEL FLUX CURRENT LOSS TEMPERATURE
E L E C T R I C M O T O R D E S I G N

13COMSOL MULTIPHYSICSOCTOBER 2017
INVISIBLE CONNECTIONS WILL UNVEIL OUR 5G FUTUREAt Signal Microwave, simulation is being used to design specialized connectors for high speed RF applications.
By SARAH FIELDS
AS THE NUMBER OF MOBILE USERS and the demand for high speed communication grows, companies and industry groups are working around the clock to rise to the challenge. The 5G network aims to be 100 times faster than 4G LTE and increase broadband connection speeds by 10 times. “There are a lot of moving pieces that need to arrive at the same place in order for 5G to move from concept to reality,” says Bill Rosas, cofounder of Signal Microwave. “Those on the front line not only have to implement the 5G, they need to figure out everything from testing the networks to updating the interconnects in their systems.”
The small details of connectors are worthy of significant R&D focus. These indispensable electromechanical parts used to join electrical terminations, which can transfer electromagnetic energy from one transmission line to another component for transmission or interpretation. Connectors are omnipresent across all electronic devices and systems, and their precision is critical in circuits that transmit information, especially as data transfer rates increase.
Eric Gebhard and Bill Rosas cofounded Signal Microwave in order to provide specialized connectors for the signal integrity market on demand. By anticipating the need for optimized RF, microwave, and millimeter-wave connectors for circuits transmitting higher and higher data transfer rates, Signal Microwave will support the development of our 5G future.
» THE COMPLEXITY OF INCREASED FREQUENCY THOSE WORKING ON RF (radiofrequency) connectors face a multifaceted set of design hurdles, as geometry, size, and transmission constraints must be met while matching the impedance of the connector to the rest of the transmission
line. “The component manufacturers have been very quick in offering products for 5G applications,” says Rosas. “But providing components that are highly optimized is where the opportunities lie.”
As the frequency increases, maintaining the impedance becomes more complex, as small quirks arising from the geometry or selected materials can
be magnified. Figure 1 shows a photo of an RF connector designed for a 5G communications application under development.
Gebhard and Rosas were interested in ways that these critical pieces of RF infrastructure could be further optimized through the use of simulation. Signal Microwave’s customers are far ranging
Figure 1. Close up of the launch transition (top). Completed test verification board used by engineers building 5G systems (bottom).
5 G N E T W O R K C O M P O N E N T S
Providing components that are highly optimized is where the opportunities lie.”
— BILL ROSAS, CO-FOUNDER, SIGNAL MICROWAVE

14 COMSOL MULTIPHYSICS OCTOBER 2017
Figure 2. Measured voltage standing wave ratio (VSWR) (top) and insertion loss, value of dB-scaled S21, of a test circuit board with Signal Microwave components (bottom).
and include engineers developing high-frequency applications for the communication sector, commercial market, and military, from 40 GHz to 110 GHz.
» DESIGNING AN RF CONNECTORMULTIPHYSICS SIMULATION HAS ENABLED Eric and his team to swiftly meet the design challenges that accompany each new customer. “The software can interface with other design tools, which has allowed our
team to rapidly develop optimized connectors that meet the individualized requirements of the diverse industries our customers represent,” said Gebhard. This approach reduces time to market, overall development costs, and required investment, allowing device designers to focus on other critical aspects of the design knowing they can safely rely on the connecting components. Simply stated, the designer of an electrical connector takes a mechanical part and
turns it into a transmission line. The goal in designing an RF connector is to build a part that is electrically invisible, making it indistinguishable from the rest of the transmission line which means meeting minimum requirements for resistance and energy loss. “We’re interested in minimizing mismatches causing reflections, which results in distortion or a diminished signal,” says Gebhard. Simulation offers a way to do this before fabrication and testing.
» CHASING THE PERFECT CONNECTION WITH SIMULATIONSIGNAL MICROWAVE’S CUSTOMERS OFTEN require specific geometric parameters for one part of the connector as well as a predetermined impedance, which then informs the rest of the design. Gebhard and Rosas take a holistic approach to connector design and consider the requirements for the circuit board and device in their entirety before beginning the design of the connector. The team typically starts by building the geometry in Solid Edge® software and importing it into COMSOL Multiphysics® software, where they can use the RF modeling functionality to analyze and optimize the design.
Simulation allows
Gebhard to investigate the measured voltage standing wave ratio (VSWR), reflection and insertion loss, or power loss due to mismatches or unexpected discontinuity, which must be minimized. For example, the measured voltage standing wave ratio (VSWR) of a test circuit board with Signal Microwave components matched simulation results and was found to be less than 1.5:1, indicating sufficiently low reflectance and loss (Figure 2, top). It was determined that the losses are not drastic and increase gradually as the frequency goes up (Figure 2, bottom). With multiphysics simulation, the team at Signal Microwave has created a portfolio of solderless edge connectors that feature minimal reflections, which can be extended to the millimeter-wave range.
» EDGE-LAUNCH CONNECTORS GET EXCITEDGEBHARD ALSO MODELED two edge-launch connectors, excited and terminated by 50-ohm coaxial lumped ports. In this example, the grounded coplanar waveguide (GCPW) circuit board was built with an 8-mils substrate with a dielectric constant of 3.55. Metalized vias connect
Those on the front line not only have to implement the 5G, they need to figure
out everything from testing the networks to updating the interconnects in their systems.— BILL ROSAS, CO-FOUNDER, SIGNAL MICROWAVE
5 G N E T W O R K C O M P O N E N T S

15COMSOL MULTIPHYSICSOCTOBER 2017
the pair of ground planes of the CPW to the bottom ground plane (Figure 3).
“In order to make a connector electrically invisible we minimize reflection, described by scattering parameters, by looking at geometric discontinuities,” says Gebhard.
In addition to adjusting the geometry to minimize reflection, Gebhard may also optimize the dielectric materials to obtain the desired impedance. In certain cases, Gebhard will use the COMSOL® software to evaluate additional structural design considerations, such as the minimum force required to remove the pin from the main frame of the connector.
» A CLOSE MATCH TO REALITYGEBHARD ALSO DEVELOPED 70-GHz blind mate connectors used for automated test equipment. After creating the RF model in the software, he had the prototypes built. Surprisingly, the prototype connectors did not work as expected. Gebhard took a closer look at the machined prototype and realized
Figure 3. Simulation image of a test circuit board for high speed interconnect applications combined with 5G and SatCom. Contour and arrow plot of the dB-scaled norm of the electric field at 20 GHz (top). Zoomed in version of the first plot (middle). Isosurface plot of the dB-scaled norm of the electric field on top of the circuit board at 1 GHz (bottom).
there was a small defect in one connector. In a bit of forensic engineering, Gebhard then returned to the original model and added the defects into the model. Lo and behold, the simulation then matched the physical test results.
“The virtual design was right, but the parts weren’t and we didn’t catch that. Once we tested it and looked at the parts closely, we found the problem. We then put the defect into the virtual model, and saw the simulation results match what we were seeing. You could say it was one of our ‘Eureka’ moments.
“In this case especially, I was very happy to see the simulation results so closely match reality. In this RF connector design, we had added a few unique aspects, which made us eager to see how the connector would perform.”
High-fidelity simulation allowed Gebhard the freedom to design and build custom connectors for specialized RF applications, reducing the number of physical prototypes and speeding up development time.
From left to right: Bill Rosas and Eric Gebhard, co-founders of Signal Microwave.
Solid Edge is a registered trademark of Siemens Product Lifecycle Management Software Inc. or its subsidiaries in the United States and in other countries.

16 COMSOL MULTIPHYSICS OCTOBER 2017
FUEL CELLS POISED TO REPLACE INDIA’S DIESEL GENERATORSScientists at India’s National Chemical Laboratory have pinpointed a clean, cost-effective fuel cell that can replace the unreliable and pollutive diesel generators that power India’s telecom towers.
By LEXI CARVER
DESPITE SIGNIFICANT ADDITION TO POWER generation and transmission capacities in recent years, India still faces an energy deficit of 2.1% and about 20,000 villages are off-grid. Moreover, electricity supply to urban and rural India is still unreliable. As a result, diesel generators are widely used for decentralized power generation. These generators (Figure 1, top), although inexpensive, are inefficient and pose great environmental and health risks.
This is why the National Chemical Laboratory (NCL) in India, along with two other labs in the Council of Scientific and Industrial Research (CSIR), the Central Electrochemical Research Institute (CECRI), and the National Physical Laboratory (NPL), are investigating cleaner, cost-effective, and more dependable technology for powering telecom towers and eventually buildings.
A promising answer to the cost and pollution conundrum can be found in proton exchange membrane fuel cells (PEM fuel cells or PEMFCs, shown in Figure 1, bottom), which are being phased into many applications as replacements for older power technology. Thanks to their small carbon footprints, low decibel levels, fuel compatibility, and excellent complementarity with other renewable energy options, they have potential for use in transportation, residential buildings and offices, and certain industrial sectors. PEM fuel cell systems have an overall efficiency exceeding 30% (compared
to 22-25% for diesel generators), and when run on pure hydrogen, their only emission is water vapor.
» INSIDE A PEM FUEL CELLPEM FUEL CELLS CONTAIN a membrane electrode assembly (MEA) that comprises gas diffusion layers, electrodes, and polymer electrolyte membrane. Electrochemical reactions that generate power occur inside the MEA.
In a single PEM fuel cell, hydrogen streams to the anode side of the assembly, where it is split into protons and electrons by reactions in the presence of a catalyst. A network of carbon nanoparticles in the electrode conducts the electrons, providing current output to power a device before they reach the cathode on the other side. Meanwhile, protons travel through a proton exchange membrane and oxygen from air diffuses through a gas diffusion layer (GDL) in the MEA to reach the cathode (Figure 2).
The protons react with oxygen and electrons at the catalyst’s active sites on the cathode to form water; the byproducts of the reactions are simply water and heat. Multiple such cells connected in series make a PEM fuel cell stack (Figure 3).
The power output and efficiency of the fuel cell is determined by many factors, such as catalytic activity of the active layers at the anode and cathode, the ability of the electrodes to transport liquid water out of the gas diffusion electrodes, the conductivity and porosity of the carbon network,
the transport of reactant gases to the catalyst, the proton conductivity of the PEM, and the electrical conductivity of the bipolar plates.
» CONFIGURING FOR MAXIMUM EFFICIENCYTHE TRICK WHEN CHOOSING a PEM fuel cell for India’s telecom towers is to find the best configuration for maximum efficiency, knowing that improving the design in one area might reduce the effectiveness of another. For example, increasing porosity in the GDL allows hydrogen and air to enter more freely and moisture to leave more freely, but might decrease electrical conductivity.
Dr. Ashish Lele, chief scientist on the project at NCL, leads a team that has simulated and analyzed different configurations to find the optimal combination of properties in the PEM fuel cells intended for India’s telecom towers. “We wanted to understand the reactions at the carbon electrode and study how the transport of reacting gases and protons in the electrodes would modulate the overall reaction rate,” he explains. “We were ultimately interested in understanding how various parameters, such as
Figure 1. Top: Diesel generators used to power telecommunications towers in India. Bottom: PEM fuel cell.
P E M F U E L C E L L S

17COMSOL MULTIPHYSICSOCTOBER 2017
Figure 2. Concept of a PEM fuel cell. Hydrogen enters the anode where it reacts on the catalyst’s active sites to split into protons and electrons. Electrons are conducted through an external circuit over a load to the cathode, while the protons migrate to the cathode through the proton exchange membrane electrolyte. The PEM is made of a solid polymer that conducts protons but not electrons.
Figure 3. An example of a PEM fuel cell stack, which includes several layers of repeated units.
operating conditions, flow field geometry, and MEA structural parameters influence the overall PEM fuel cell performance.”
Lele and his team modeled the convection of reactant gases in the flow field along with simultaneous reactions occurring at the catalyst layers and proton conduction through the PEM fuel cell. They relied on the functionality of the COMSOL Multiphysics® software for modeling chemical reactions and electrochemical impedance spectroscopy (EIS). EIS is used for characterizing electrochemical systems through measuring impedance and frequency response. The sidebar on the next page gives a brief overview of modeling EIS in the COMSOL® software.
“The nature of COMSOL allowed us to include mass balance, momentum balance, species balance, and charge balance together,” he says. “We ran a sensitivity analysis on different parameters — for instance, design parameters such as the flow field shape, operating parameters such
as back pressure and stoichiometry, and structural parameters such as the ionomer-carbon ratio — to determine their effect on the performance of the PEM fuel cell.” Thanks to the software, they were able to understand the effects of these variables on the overall power output of the PEM fuel cell.
The effect of stoichiometry —the ratio between the actual inflow of reactant gases and the amount required for producing a given amount of power — is shown in Figure 4 for a parallel flow field.
Lele’s team studied different flow field types to determine the most effective shape and layout for the flow channels. “We were interested in analyzing the four known principle types of flow fields: parallel, serpentine, pin, and interdigitated,” he continues. “Using COMSOL, we found that the last of these [interdigitated] had certain advantages that could be exploited for high-temperature PEM fuel cells.”
Comparisons of the current density resulting from different flow shapes confirmed that the interdigitated flow type was preferable (Figure 5). More
Figure 4. Plots of the current density produced by the fuel cell for different air stoichiometries. An air-to-fuel ratio of 5 resulted in greater and more consistent current output.
Air Stoichiometry = 1
Air Stoichiometry = 5
specifically, the faster reaction rate occurring with the interdigitated flow field is a consequence of pressure-driven convective mass transport in the GDL and electrode, which is absent in the other three flow types. Faster reaction rates occurring with the interdigitated type lead to better efficiency and more hydrogen and

18 COMSOL MULTIPHYSICS OCTOBER 2017
Figure 5. Left: Comparison of the average current density delivered by the fuel cell as a function of air stoichiometry for interdigitated and parallel flow designs. Right: Fluid pressure in microchannels with the interdigitated flow design.
THE PRINCIPLE OF EIS IS QUITE SIMPLE. An average voltage (V0) is applied with a small sinusoidal perturbation over time. As a consequence, a corresponding sinusoidal current is obtained as a response to the voltage perturbations (see the figure below).
The current response may have a shift in time (δt) compared to the voltage. A shift can be caused by processes that delay
VIRTUALLY INVESTIGATE THE CHARACTERISTICS OF YOUR SYSTEM WITH EIS ANALYSIS
By ED FONTES
the response of the current to the sinusoidal perturbation in voltage. For example, at low frequencies, slow processes such as mass transport may be responsible for such a shift while fast processes may be able to perfectly “follow” the voltage perturbations. At high frequencies, slow processes will only “see” the average voltage; they will not be able to respond to the voltage perturbations. Instead, fast processes, such as the reaction kinetics, will be responsible for the shift in the response at high frequencies. Additionally, the amplitude of the response (δI) may vary at different frequencies.
By sweeping over different
oxygen being used up in the reactions. The pressure profile (Figure 5) clearly reveals the possibility of convection within the GDL due to a pressure drop between two consecutive channels.
» MOVING TOWARD GREENER FUELANALYZING THE PEM FUEL CELL configuration in COMSOL allowed the team to choose the right flow pattern, carbon fiber layer, and gas input levels to maximize the power output. “COMSOL has helped us to look at the influence of all these variables on the final output,” Lele concludes. “Once you run the sensitivity analysis, you can figure out which variables are most important.”
As they move toward licensing and mass production of the PEM fuel cells for power generation, the researchers
at NCL look forward to seeing India’s telecom towers run more cleanly and reliably. In the future, they expect these advancements
to help the whole country move toward greener fuel for powering other structures, such as buildings and transportation networks.
frequencies, the method is able to separate processes with different time constants. The time shift and the current response’s amplitude to the voltage perturbation are reflected in the complex impedance, where a shift in time can be represented in the imaginary part of the impedance and the absolute value of the impedance explains the proportionality of the response.
The impedance response gives insight into several fuel cell properties and processes. At high frequencies, short time-scale processes such as capacitance, electrochemical reactions, and local resistances affect the impedance. On the other hand, at low frequencies, phenomena such as the diffusion in the pore electrolyte contribute to the impedance. Frequency sweeps can be carried out at different polarizations of the fuel cell to investigate phenomena at different loads. The combination of modeling EIS and parameter estimation with experimental data can then provide accurate descriptions of transport and reaction properties during operation at different loads.
P E M F U E L C E L L S
19COMSOL MULTIPHYSICSOCTOBER 2017
PEELING AWAY MEMORY CHIPSAs consumers demand smaller memory chips with greater capacity, engineers optimize the manufacturing process to ensure the chips will hold up.
By LEXI CARVER
IN THE 1980S, during the dawn of what would become a booming tech industry, flash memory made a splash by offering erasable and programmable computer storage. These storage chips now appear in cameras, memory cards, USB sticks, and phones that can store thousands of photo, music, and video files.
Though they often go unnoticed by consumers, designers work tirelessly to keep up with demands
for smaller size and greater capacity. Behind the production of a single memory device stands a long line of researchers, engineers, and assemblers who must overcome the manufacturing challenges associated with processing these tiny chips.
» KEEPING THE DIES INTACTMEMORY CHIPS ARE PRODUCED by placing a 300 mm diameter semiconductor wafer onto a carrier
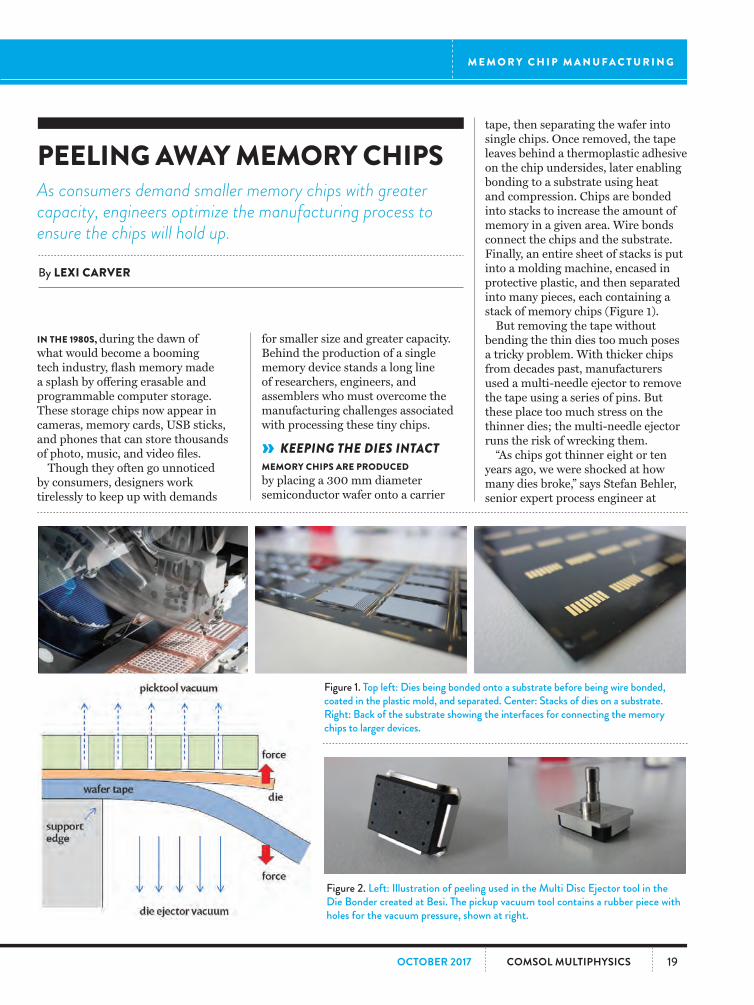
tape, then separating the wafer into single chips. Once removed, the tape leaves behind a thermoplastic adhesive on the chip undersides, later enabling bonding to a substrate using heat and compression. Chips are bonded into stacks to increase the amount of memory in a given area. Wire bonds connect the chips and the substrate. Finally, an entire sheet of stacks is put into a molding machine, encased in protective plastic, and then separated into many pieces, each containing a stack of memory chips (Figure 1).
But removing the tape without bending the thin dies too much poses a tricky problem. With thicker chips from decades past, manufacturers used a multi-needle ejector to remove the tape using a series of pins. But these place too much stress on the thinner dies; the multi-needle ejector runs the risk of wrecking them.
“As chips got thinner eight or ten years ago, we were shocked at how many dies broke,” says Stefan Behler, senior expert process engineer at
Figure 1. Top left: Dies being bonded onto a substrate before being wire bonded, coated in the plastic mold, and separated. Center: Stacks of dies on a substrate. Right: Back of the substrate showing the interfaces for connecting the memory chips to larger devices.
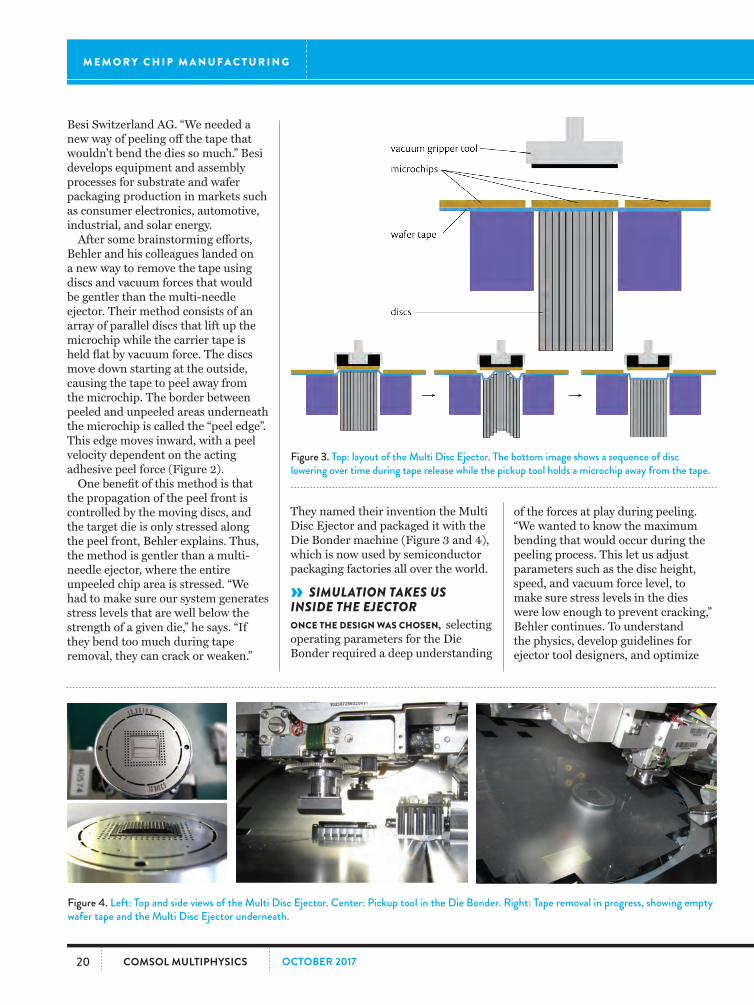
Figure 2. Left: Illustration of peeling used in the Multi Disc Ejector tool in the Die Bonder created at Besi. The pickup vacuum tool contains a rubber piece with holes for the vacuum pressure, shown at right.
M E M O R Y C H I P M A N U F A C T U R I N G
20 COMSOL MULTIPHYSICS OCTOBER 2017
Figure 3. Top: layout of the Multi Disc Ejector. The bottom image shows a sequence of disc lowering over time during tape release while the pickup tool holds a microchip away from the tape.
Besi Switzerland AG. “We needed a new way of peeling off the tape that wouldn’t bend the dies so much.” Besi develops equipment and assembly processes for substrate and wafer packaging production in markets such as consumer electronics, automotive, industrial, and solar energy.
After some brainstorming efforts, Behler and his colleagues landed on a new way to remove the tape using discs and vacuum forces that would be gentler than the multi-needle ejector. Their method consists of an array of parallel discs that lift up the microchip while the carrier tape is held flat by vacuum force. The discs move down starting at the outside, causing the tape to peel away from the microchip. The border between peeled and unpeeled areas underneath the microchip is called the “peel edge”. This edge moves inward, with a peel velocity dependent on the acting adhesive peel force (Figure 2).
One benefit of this method is that the propagation of the peel front is controlled by the moving discs, and the target die is only stressed along the peel front, Behler explains. Thus, the method is gentler than a multi-needle ejector, where the entire unpeeled chip area is stressed. “We had to make sure our system generates stress levels that are well below the strength of a given die,” he says. “If they bend too much during tape removal, they can crack or weaken.”
They named their invention the Multi Disc Ejector and packaged it with the Die Bonder machine (Figure 3 and 4), which is now used by semiconductor packaging factories all over the world.
» SIMULATION TAKES US INSIDE THE EJECTORONCE THE DESIGN WAS CHOSEN, selecting operating parameters for the Die Bonder required a deep understanding
of the forces at play during peeling. “We wanted to know the maximum bending that would occur during the peeling process. This let us adjust parameters such as the disc height, speed, and vacuum force level, to make sure stress levels in the dies were low enough to prevent cracking,” Behler continues. To understand the physics, develop guidelines for ejector tool designers, and optimize
Figure 4. Left: Top and side views of the Multi Disc Ejector. Center: Pickup tool in the Die Bonder. Right: Tape removal in progress, showing empty wafer tape and the Multi Disc Ejector underneath.
M E M O R Y C H I P M A N U F A C T U R I N G

21COMSOL MULTIPHYSICSOCTOBER 2017
the operating conditions, he used COMSOL Multiphysics® software.
Behler first built a static model (Figure 5) to test how the chip would bend under a certain disc geometry, vacuum pressure level, and initial
h0 h
disc move
vacuum
silicon die
peeled length
peel front DAF adhesive
overhang
waferfoil
Figure 5. Top: Mesh of the geometry. Bottom: Simulation results showing stress in the vertical direction.
Figure 6. Simulation results showing stress levels for a peel front moving at 20 mm/s (left) and 32 mm/s (right). At 20 mm/s, the entire tape strip is able to peel free from the die/chip; at 32 mm/s, the die/chip becomes trapped and cannot be peeled: the red circle indicates how far the peel front has moved. It is not possible to peel any more by further disc moves, because the peel front is already too far away from the highest disc edge.
peel length. Since he knew the stress level that would cause the tape to release from the die based on the material properties, he calculated the force in the vertical direction.
“I converted the stress results to
find the peel energy or peel force, then compared this value to a data table to find the peeling speed,” Behler says. “I adapted the simulation to see how much the peel front propagated with each simulation step, to study how the chip bends over time. As the peel force and disc velocity increase, bending stress and likelihood of failure in the chip also increase.”
He calculated the maximum speed for the peel front’s propagation, which would determine the best speed for the discs (Figure 6) and thus the highest productivity achievable without breaking any dies.
Behler also discovered that the animations he created with the software’s postprocessing features were helpful for visualizing what was really going on in the tape and die. “When you look at the machine, you can’t see what the ejector is doing,” he explains. “The animations actually helped people understand the dynamics of what was happening inside.”
» ESTABLISHING CUSTOMER GUIDELINES FOLLOWING HIS MODELING WORK, Behler was able to draw up guidelines for Besi’s customers using the Multi Disc Ejector. His team could now name specifics for Die Bonder operating parameters and chip setup, such as how far the memory chip can extend past the outermost disc for successful peeling. Since their customers use chips of many different sizes, they also manufactured different disc sets that can be swapped into the Die Bonder depending on the need. As memory chips continue to grow thinner and more powerful, Besi continues to lead the charge in computer storage packaging.
Stefan Behler, senior expert process engineer at Besi Switzerland AG.

22 COMSOL MULTIPHYSICS OCTOBER 2017
SIMULATION APPS BRING STEM TO LIFEUniversity of Hartford integrates simulation apps into undergraduate engineering courses to prepare students for their future careers.
By GARY DAGASTINE
PROVIDING STUDENTS WITH THE KNOWLEDGE and skills to flourish in the workforce is at the core of higher education, but when it comes to teaching physics to undergraduates there are many challenges. The growing appeal of science, technology, engineering and mathematics (STEM) curricula has only magnified them, given the widely varying backgrounds and interests of many students.
A particularly thorny challenge is incorporating inquiry-based learning into a course, a method of teaching that involves students developing and answering their own research questions. This hands-on approach in which students must solve realistic physics problems on their own is vital for a better understanding of physics concepts. However, it is hard to structure effectively in lecture-based courses where the coverage of required material does not allow much time for the development of field-specific skills.
In a landmark effort to address this issue, the University of Hartford in Hartford, CT, has integrated multiphysics analysis software and applications into junior-year fluid mechanics and heat transfer courses as a required part of the coursework.
“Our undergraduate engineering curriculum contains many problem-based and project-based learning components,” said Dr. Ivana Milanovic, professor of
mechanical engineering. “However, before simulation apps, it was challenging to incorporate effective inquiry-based learning into a course. The COMSOL Multiphysics® software lets us quickly design, apps based on multiphysics models to supplement lectures.”
The apps let students view and control designated inputs, settings, and outputs, and a simplified interface enables them to take advantage of the software’s powerful computational tools without requiring them to be numerical simulation experts.
As a result, students can conduct virtual experiments easily. Visualizing what happens when a system’s operating parameters and initial and boundary conditions are altered helps cement relevant concepts into their understanding. Apps also add value to University of Hartford’s industry-sponsored research and increase students’ appeal to potential employers, because many aerospace- and manufacturing-related companies in Connecticut use simulation software.
» HOW APPS CAME TO BEMILANOVIC INTEGRATED SIMULATION APPS into successive junior-year courses in fluid mechanics and heat transfer, a decision based on learnings from a graduate-level course on mathematical modeling with COMSOL® software, given by Dr. Thomas Eppes, professor of electrical and computer engineering.
Eppes said, “Various studies validated our choice of software, but what students tell us is more meaningful. They say the use of simulation software has enhanced their learning, helped them easily visualize difficult theoretical concepts, and exposed them to valuable simulation methodology. These anecdotal reports are supported by the course’s 99% completion rate.”
In light of this, Milanovic began to think about incorporating modeling and simulation software into the undergraduate curriculum. But there were issues. “Many faculty perceived that the use of industrial-strength software with undergraduates would require a major time investment and an over-reliance on them by students,” she said. “They also wondered how useful it would be if students hadn’t previously taken, for example, a course in computational fluid dynamics (CFD).”
“The ease of working with simulation apps changed all that,” she said. “Students master theory and analytical problems through in-class discussions and self-study; their theoretical knowledge and analytical skills are assessed with major exams; and they conduct inquiry-based
Figure 1. In this simulation app created by Mark Markiewicz at University of Hartford, the user can study nonisothermal flow in a glass of cold water heated to room temperature. This gives outputs for fluid velocity, temperature, and pressure in the glass.
S I M U L A T I O N A P P S F O R T E A C H I N G
23COMSOL MULTIPHYSICSOCTOBER 2017
learning with the apps.”
» HOW STUDENTS WORK WITH APPSMILANOVIC’S JUNIOR-YEAR COURSES contain increas-ingly complex simula-tion-based laboratory assignments designed to help students achieve a greater understanding of, for example, thermofluids. They also help students develop competencies in modeling and in technical report writing, which are essential for success in subsequent research and future employment. Working with simulation apps helps students create a narrative describing the boundary conditions and setup used in the model, as well as arrange visual data, charts, graphs, and equations.
One simulation that students are introduced to early on analyzes a blood sample flowing through a filtration device, studying fluid flow distri-bution, electric potential, and particle positioning. The students study the effects of different voltage levels and alternating polarity of the particles.
Other simulation assignments include analysis of non-Newtonian flow, swirl flow around a rotating disk, a water purification reactor, a journal bearing, and flow past a cylinder.
By the time students move on to the heat transfer course, they have already learned basic simulation skills. “I leverage this into more complex simulation assignments, including 2D
heat transfer with convective cooling, heat conduction in a cylinder, shell conduction, and several others,” Milanovic said.
» HELPING STUDENTS UNDERSTAND “WHY”STUDENTS MUST ALSO CREATE their own apps based on simulations with specified inputs and outputs. When an app is complete, Milanovic asks a series of what-if questions to deepen understanding of basic cause and effect relationships. Students are also required to prepare written reports explaining why the results change from one case to another.
Students conduct a final independent research initiative where they prepare a work statement, review relevant literature, complete a technical study, and document the results.
Stefan Keilich, a mechanical engineering (ME) major with a minor in electrical engineering, created a wind tunnel simulation of airflow around a car for his final project. “I set variables for air speed, model height relative to the ground, wind tunnel dimensions, and model scale. The result was an awesome airflow trail pattern you could actually visualize,” he said.
Keilich said the apps have opened his eyes to their usefulness in describing a system to an associate who doesn’t need to know the technical details. They may even have given him a new career perspective. “Apps have
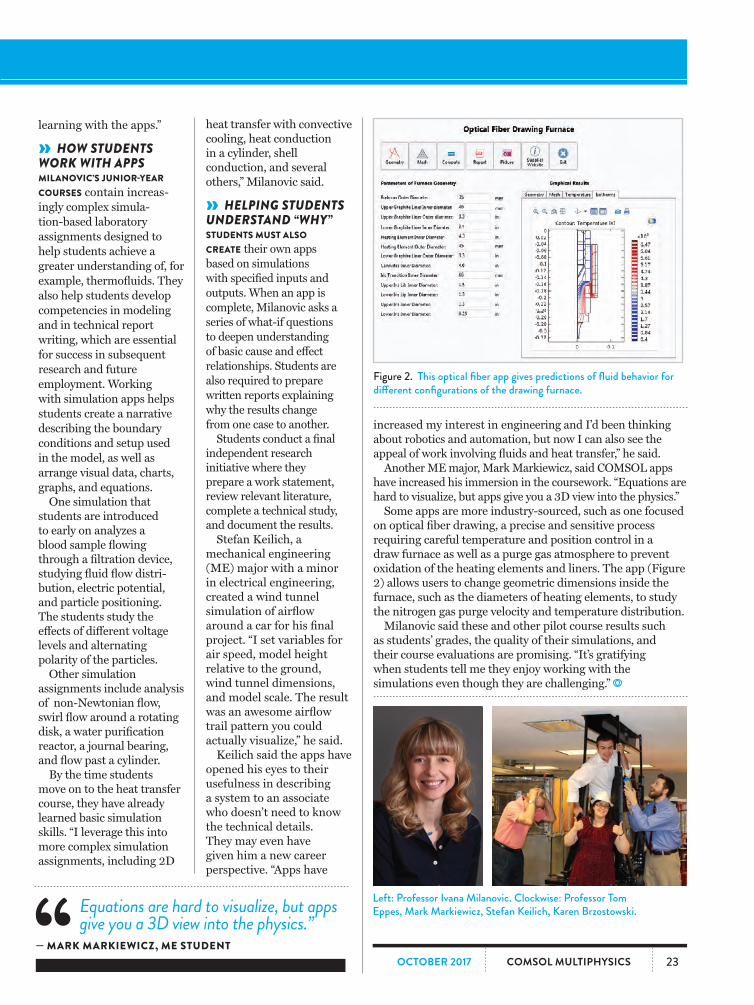
Figure 2. This optical fiber app gives predictions of fluid behavior for different configurations of the drawing furnace.
increased my interest in engineering and I’d been thinking about robotics and automation, but now I can also see the appeal of work involving fluids and heat transfer,” he said.
Another ME major, Mark Markiewicz, said COMSOL apps have increased his immersion in the coursework. “Equations are hard to visualize, but apps give you a 3D view into the physics.”
Some apps are more industry-sourced, such as one focused on optical fiber drawing, a precise and sensitive process requiring careful temperature and position control in a draw furnace as well as a purge gas atmosphere to prevent oxidation of the heating elements and liners. The app (Figure 2) allows users to change geometric dimensions inside the furnace, such as the diameters of heating elements, to study the nitrogen gas purge velocity and temperature distribution.
Milanovic said these and other pilot course results such as students’ grades, the quality of their simulations, and their course evaluations are promising. “It’s gratifying when students tell me they enjoy working with the simulations even though they are challenging.”
Left: Professor Ivana Milanovic. Clockwise: Professor Tom Eppes, Mark Markiewicz, Stefan Keilich, Karen Brzostowski.Equations are hard to visualize, but apps
give you a 3D view into the physics.”— MARK MARKIEWICZ, ME STUDENT
24 COMSOL MULTIPHYSICS OCTOBER 2017
MTC DEVELOPS SIMULATION APP TO REVOLUTIONIZE DESIGN FOR ADDITIVELY MANUFACTURED PARTSThe Manufacturing Technology Centre takes a new approach to part design and interdisciplinary research, using simulation and computational apps to support teams across the company.
By LEXI CARVER
ONE OF THE GREATEST CHALLENGES IN DESIGNING high-precision parts is being able to quickly fabricate them in a repeatable way to meet very tight specifications. If you’re designing aircraft engine fuel injectors, for instance, you need precisely measured parts in order for airplane machinery to perform properly and for passengers to entrust their safety to the airline. In order to achieve this, engineers must often optimize not only a specific part, but the manufacturing process itself.
Additive manufacturing, also known as 3D printing, has been on the rise in recent years as a novel and promising way to create parts with less material waste and even to build shapes that
were previously impossible to fabricate through more traditional methods.
The Manufacturing Technology Centre (MTC) in Coventry, UK, researches additive manufacturing techniques and supplies designs and prototypes to part producers in the aerospace industry. One additive manufacturing method they employ frequently is called laser powder bed fusion, which uses powder layers tens of microns thick to build parts layer by layer using a laser. The system follows a predefined toolpath to fabricate a part with very fine geometrical details.
In order to verify the quality and performance of their additively manufactured parts, the MTC has
used COMSOL Multiphysics® software for virtual design testing, validation, and performance prediction. Over the past couple of years, they began building apps from COMSOL models that allowed them to share their analysis capabilities among different teams exploring a variety of projects for their customers.
I interviewed the MTC team early on in the app-building stage (see page 5 of COMSOL News 2015). A couple of years later, we checked back in to find out how their use of simulation and computational apps have impacted their design process and their interdepartmental work.
» A NEW APPROACH TO PART DESIGNBORJA LAZARO TORALLES, TEAM LEADER of MTC’s Physics Modelling team, tells me that laser powder bed fusion has certain advantages over other methods of fabrication. Deposition rates are slower than shaped metal deposition processes, but higher accuracy and resolution can be achieved.
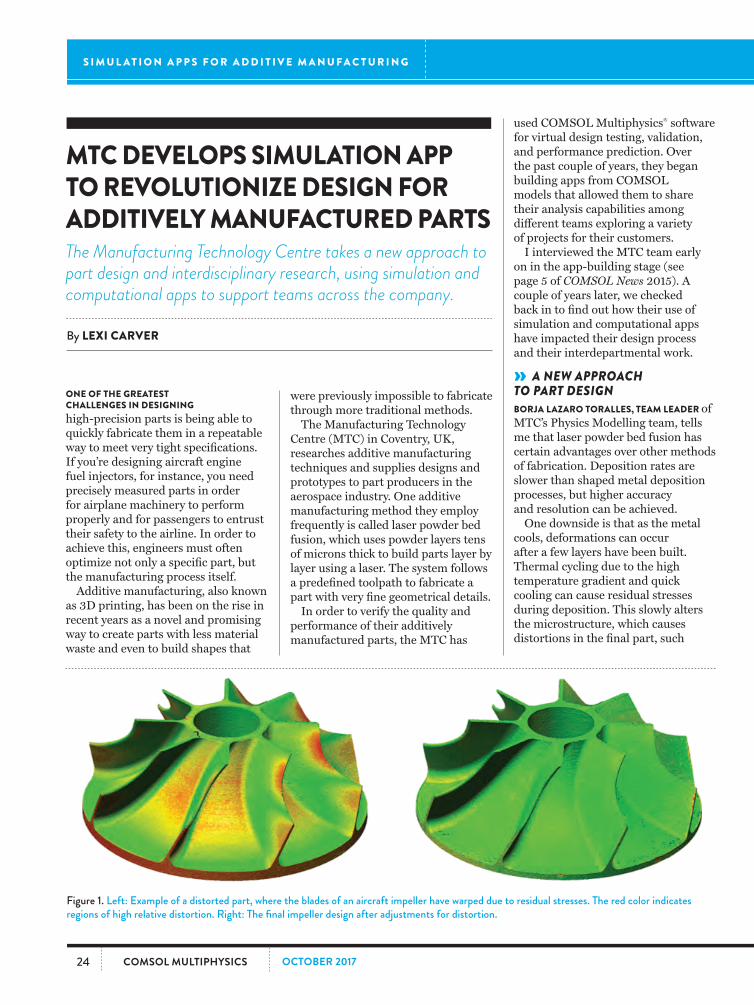
One downside is that as the metal cools, deformations can occur after a few layers have been built. Thermal cycling due to the high temperature gradient and quick cooling can cause residual stresses during deposition. This slowly alters the microstructure, which causes distortions in the final part, such
Figure 1. Left: Example of a distorted part, where the blades of an aircraft impeller have warped due to residual stresses. The red color indicates regions of high relative distortion. Right: The final impeller design after adjustments for distortion.
S I M U L A T I O N A P P S F O R A D D I T I V E M A N U F A C T U R I N G

25COMSOL MULTIPHYSICSOCTOBER 2017
Figure 2. Simulation results showing displacement in the impeller to predict the final part shape.
design engineers the information needed to make appropriate design adjustments, Lazaro Toralles and his team first defined a new modeling process that would predict the final shape of large parts.
“Traditional additive manufacturing models are very detailed, down to the microstructure. But these are not suitable for simulating large part builds because of the computational cost,” he tells me. “They take forever. But we still need to understand how an entire part will behave during printing. To circumvent this, we ‘lump’ the layers of the print build and impose an analytical temperature field based on experimental data. This reduces solving time but still gives an accurate solution.”
Since the MTC works with a variety of metals, from aerospace grade titanium to stainless steels, they parameterized inputs in the COMSOL model such as material properties, lumped layer thickness, build plate fixturing on the part, and mesh element size so that they could use the model to test parts of many shapes, sizes, and materials.
Within the COMSOL® software environment, they used the structural mechanics functionality to define a linear elastic material with temperature-dependent plasticity and thermal expansion, using the analytical temperature field. The app also performs several automated CAD operations to prepare the geometry for suitable ‘lumped’ layering.
The simulation then generates a grid to represent an approximate toolpath, given that the lumping of layers makes it impractical to use the real one. The temperature field is imposed on the grid points. The software then computes the stresses generated during deposition and predicts the final shape of the part (Figure 2).
» SPREADING PREDICTIVE CAPABILITIES WHEN THE SIMULATION PREDICTS the errors in a particular part, getting the information to the design team in a clear and concise way is another
as those shown in Figure 1 (left). In certain cases these deformations
are negligible, but in other cases a difference of just 100 microns (0.1 mm) can be too far off specification and make the part unusable. For these situations, the MTC team needed a way to get around the effects of thermal cycling.
Since they couldn’t remove the thermal cycling and the evolution of the microstructure, they approached it another way: “We created a simulation that predicts the stresses and deformation during a part build to give us a clear understanding of how it will distort during printing,” Lazaro Toralles begins. “Once we have this information, we can ‘invert’ the distortion in the part’s design, which allows us to account for the warping ahead of time so that the final product distorts into the shape we actually want.”
This clever way of working backward from errors and building them directly into the designs has helped them create parts within the required tolerances more efficiently, knowing that the predictive model will guide them to a shape that results in minimal error (Figure 1, right).
Adopting multiphysics simulation
has also opened up new lines of communication with the MTC’s design for additive manufacturing team. Lazaro Toralles’ team built an app around their COMSOL model for predicting distortions, which allows their colleagues to run the simulation and see where designs need to be changed without having to completely understand the original model.
Before sharing an app with their part designers, the team of course needed to build the high-fidelity model the app would be based on.
» MODELING FOR COMPLEX AND VARIED PARTSHOW WOULD YOU CREATE A SIMULATION that allows you to test any shape made from any metal? The range is extreme. To build a model that gives
We created a simulation that predicts
the stresses and deformation during a part build to give us a clear understanding of how it will distort during printing.—BORJA LAZARO TORALLES, TEAM LEADER, PHYSICS MODELLING DEPARTMENT, MTC

26 COMSOL MULTIPHYSICS OCTOBER 2017
matter. Many companies have broken down their modeling groups into design and simulation, benefiting from employees who specialize in one or the other. But this leaves a gap between part design and part analysis.
Apps bridge this gap by allowing simulation specialists to package their models into user-friendly interfaces, which designers use to run their own tests without needing to understand all the complexities of the simulation underneath. This allows design engineers to make adjustments more easily and saves the simulation experts from running an analysis every time a new part’s performance needs to be evaluated.
The design team creates lots of complex parts using a wide range of CAD platforms, so the COMSOL model and corresponding app needed to be quite robust. It includes CAD import features so that any shape can be tested. This is especially important for organic shapes — those based on natural features like plants, animals, and land formations — such as those drawn in a program like Rhino.
The app, created with the Application Builder available in COMSOL Multiphysics, displays the simulation results — final shape, deformation, and stress
Figure 3. The MTC app enables the user to make design adjustments and test changes in the simulation, but without showing the underlying multiphysics model.
levels for a given part, in this case an aircraft impeller (Figure 3).
“We [the simulation team] often use the app ourselves,” Lazaro Toralles adds. “Once we built it, it was easier to make a few input changes in the app rather than go back to the original model. But the design team doesn’t work on simulations. The app was built for them because it allows them to import part models and check the prediction of how it will warp during printing.”
The Application Builder included in COMSOL Multiphysics allowed Lazaro Toralles to have full control over what was available to the app user. As the app has evolved based on new needs from the company, he’s been careful to build in the necessary outputs and displays, as well as locking certain inputs and
conditions so that app users cannot inadvertently create errors. The underlying model setup remains hidden from the user, but the simulation capabilities have spread.
» SOLIDIFYING NEW COLLABORATIONLAZARO TORALLES DEPLOYS THE APP through the COMSOL Server™ product for distributing, managing, and running simulation apps. Hosting the app online makes it available for colleagues who have been given access, anywhere in the company.
Simulation has changed the way teams work together at the MTC. Now they have an established routine where designers and simulation engineers are able to communicate quickly, test designs easily, and make changes that result in the desired prototypes for their customers to manufacture on a wide scale.
Lazaro Toralles admits that there was skepticism when they first began offering simulation apps to other departments. “We had to earn their trust. But since the model consistently provided good results, everyone has found it helpful. The app contains everything: it slices the print geometry, shows the mesh, guides engineers through the distortion analysis, and provides feedback.” Their simulation work has been an important part of helping the MTC establish a workflow that improves communication between the physics modeling team and the design team. This, ultimately, has changed the way they approach part design.
Since the model consistently provided good results, everyone has found it
helpful. The app contains everything: it slices the print geometry, shows the mesh, guides engineers through the distortion analysis, and provides feedback.—BORJA LAZARO TORALLES, TEAM LEADER, PHYSICS MODELLING DEPARTMENT, MTC
S I M U L A T I O N A P P S F O R A D D I T I V E M A N U F A C T U R I N G
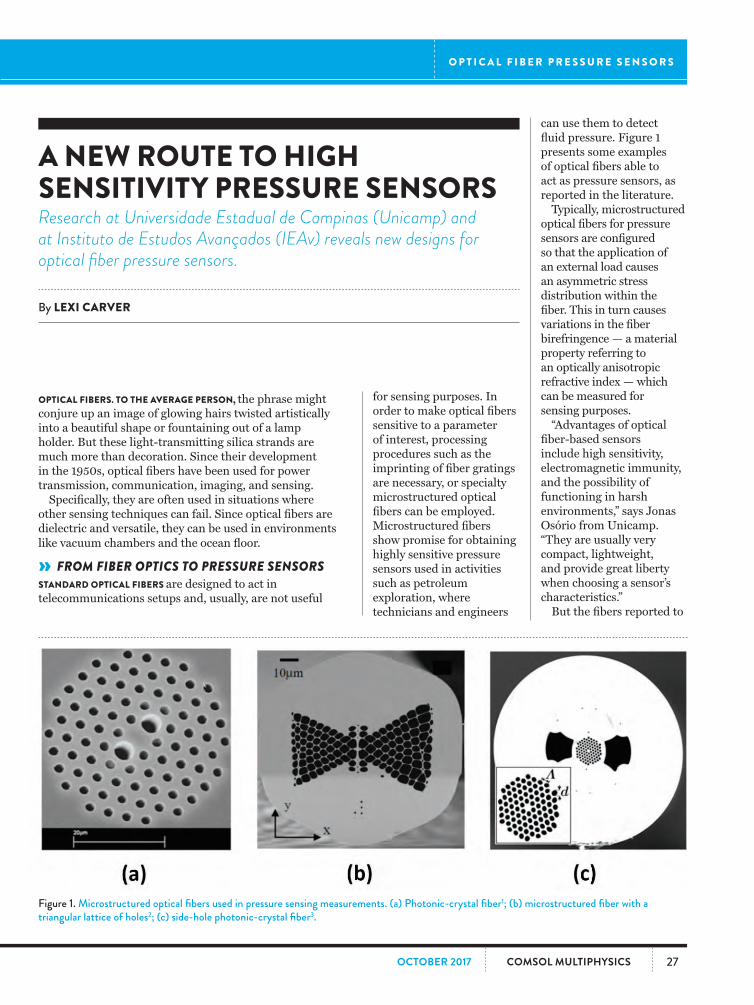
27COMSOL MULTIPHYSICSOCTOBER 2017
A NEW ROUTE TO HIGH SENSITIVITY PRESSURE SENSORSResearch at Universidade Estadual de Campinas (Unicamp) and at Instituto de Estudos Avançados (IEAv) reveals new designs for optical fiber pressure sensors.
By LEXI CARVER
OPTICAL FIBERS. TO THE AVERAGE PERSON, the phrase might conjure up an image of glowing hairs twisted artistically into a beautiful shape or fountaining out of a lamp holder. But these light-transmitting silica strands are much more than decoration. Since their development in the 1950s, optical fibers have been used for power transmission, communication, imaging, and sensing.
Specifically, they are often used in situations where other sensing techniques can fail. Since optical fibers are dielectric and versatile, they can be used in environments like vacuum chambers and the ocean floor.
» FROM FIBER OPTICS TO PRESSURE SENSORSSTANDARD OPTICAL FIBERS are designed to act in telecommunications setups and, usually, are not useful
for sensing purposes. In order to make optical fibers sensitive to a parameter of interest, processing procedures such as the imprinting of fiber gratings are necessary, or specialty microstructured optical fibers can be employed. Microstructured fibers show promise for obtaining highly sensitive pressure sensors used in activities such as petroleum exploration, where technicians and engineers
Figure 1. Microstructured optical fibers used in pressure sensing measurements. (a) Photonic-crystal fiber1; (b) microstructured fiber with a triangular lattice of holes2; (c) side-hole photonic-crystal fiber3.
can use them to detect fluid pressure. Figure 1 presents some examples of optical fibers able to act as pressure sensors, as reported in the literature.
Typically, microstructured optical fibers for pressure sensors are configured so that the application of an external load causes an asymmetric stress distribution within the fiber. This in turn causes variations in the fiber birefringence — a material property referring to an optically anisotropic refractive index — which can be measured for sensing purposes.
“Advantages of optical fiber-based sensors include high sensitivity, electromagnetic immunity, and the possibility of functioning in harsh environments,” says Jonas Osório from Unicamp. “They are usually very compact, lightweight, and provide great liberty when choosing a sensor’s characteristics.”
But the fibers reported to
O P T I C A L F I B E R P R E S S U R E S E N S O R S

28 COMSOL MULTIPHYSICS OCTOBER 2017
date have very sophisticated microstructures and usually require several drawings and a delicate manual procedure for assembling the structure. At Unicamp and IEAv in Brazil, work is being done to develop a different type of optical fiber — an embedded-core capillary fiber — which can act as a highly sensitive pressure sensor. This type of fiber requires a simpler fabrication process that involves a preform preparation method and direct fiber drawing.
» A CLOSER LOOK AT GEOMETRIC CHARACTERISTICSTHE EMBEDDED-CORE CAPILLARY fiber is a silica capillary tube endowed with a germanium-doped region (the fiber core) placed inside the capillary wall (Figure 2 shows representations of the fiber structure and cross section). In contrast to the fibers presented in Figure 1, the embedded-core fiber is much simpler than the typical microstructured fibers employed in pressure sensing applications.
Alongside Marcos Franco and Valdir Serrão from IEAv, Jonas Osório and Cristiano Cordeiro from Unicamp investigated pressure-induced birefringence in microstructured fibers in order to develop and validate a new design concept. They focused on fibers designed to sense hydrostatic pressure — pressure induced by a fluid at rest, such as a body of still water surrounding the sensor. However, they diverged from existing designs by using capillary fibers (very thin, hollow tubes) instead of solid fibers with a pattern of air holes that permits asymmetric stress distributions.
Ultimately their goal was to maximize the birefringence dependence on pressure variations, since this would improve the sensing capabilities of the fiber. Beginning from an analytical model, they studied pressure-induced displacements and mechanical stresses in the capillary walls (Figure 3).
The analytical model showed that applied
pressure generates an asymmetrical stress distribution inside the capillary wall due to the capillary structure. Via the photoelastic effect, these stresses cause variations in the material refractive index that are different along the horizontal and vertical directions, generating the desired birefringence.
» MAXIMIZING PRESSURE-DEPENDENT PROPERTIESUSING THE COMSOL MULTIPHYSICS® software, Franco, Serrão, Cordeiro, and Osório added the elliptical core, a
Figure 3. Study of a pressurized capillary fiber without the embedded core, under pressure. The displacement profile was initially studied for an inner radius of rin = 40 µm, an outer radius of rout = 80 µm, an inner pressure pin of 1 bar, and an outer pressure pout of 50 bar.
germanium-doped region inside the silica capillary wall, to their mathematical model. Through their simulation, they obtained the change in modal birefringence as a function of the applied pressure and the location of the core in the capillary wall (Figure 4). Modal birefringence describes birefringence of the optical modes that can travel through the fiber core.
The model calculated the effective refractive indices of the fundamental modes for different pressure conditions. These modes occur when incoming electromagnetic waves are
Advantages of optical fiber-based sensors include high sensitivity, electromagnetic
immunity, and the possibility of functioning in harsh environments.—JONAS OSÓRIO, UNIVERSIDADE ESTADUAL DE CAMPINAS
Figure 2. (a) Concept of embedded-core capillary fiber, showing a cross section of the tube with an embedded core, under hydrostatic pressure. (b) Embedded-core fiber cross section.
O P T I C A L F I B E R P R E S S U R E S E N S O R S

29COMSOL MULTIPHYSICSOCTOBER 2017
guided through the fiber core. They discovered that to make the birefringence as dependent on pressure as possible and therefore maximize the sensitivity of the sensor, it was necessary to embed the core area completely within the capillary structure, close to the inner wall. As they analyzed the changes in stress distribution for different geometries, they discovered that the birefringence derivative with respect to pressure values was higher for fibers with thinner walls and for positions closer to the inner radius of the capillary.
» A NEW ROUTE TO MICROSTRUCTURED OPTICAL FIBER SENSORSTHANKS TO THEIR RESEARCH in exploring birefringence pressure dependence, Franco, Serrão, Cordeiro, and Osório laid out a new way to simplify the production of microstructured optical fibers and confirmed that their design would perform properly as a pressure sensor. They compared the sensitivity of their concept to existing, more complicated fiber structures and determined that their design produced similar results but required less assembly
Figure 4. Changes in modal birefringence as a function of the position of the germanium core within the capillary wall. The case with the highest changes in birefringence due to pressure variations occurs when the core is very close to the inner radius of the fiber (top center case).
work. The embedded-core fiber provides a new route for obtaining highly sensitive optical fiber pressure sensors,
and will make it easier for petroleum explorers to evaluate the fluids they extract in real time.
ReferencesThe research team identified the embedded-core fiber as a new route towards the simplification of optical fiber-based pressure sensors. The developed research was recently published in Scientific Reports, by Nature Publishing Group (nature.com/articles/s41598-017-03206-w ).1. H. Y. Fu, et al. “Pressure sensor realized with polarization-maintaining photonic crystal fiber-based Sagnac interferometer,” Applied Optics, 47, 15, 2835-2839, 2008.2. A. Anuskiewicz, et al., “Sensing characteristics of the rocking filters in microstructured fibers optimized for hydrostatic pressure measurements,” Optics Express, 20, 21, 23320-23330, 2012.3. J. H. Osório, et al., “Photonic-crystal fiber-based pressure sensor for dual environment monitoring,” Applied Optics, 53, 17, 3668-3672, 2014.

30 COMSOL MULTIPHYSICS OCTOBER 2017
MODELING AND SIMULATION FOR MEETING THE CHALLENGES OF BATTERY DESIGNThe biggest challenges for battery design are energy density, power density, charging time, life, cost, and sustainability. Modeling and simulation are very efficient methods that can assist researchers, developers, and designers in meeting these challenges.
ENERGY DENSITY IS LIMITED by the battery’s chemistry, which even without losses limits the theoretical energy density. The chemistry is defined by the electrode material and the composition of the electrolyte. Lithium-air batteries get close to the energy density of gasoline, which is probably close to the maximum energy density for a battery. However, the components required for thermal management and current collection
By ED FONTES
contribute to the total weight of the battery system. The design of these components can substantially influence the energy density of a battery system.
» POWER DENSITY AND FAST RECHARGETHE POWER DENSITY of a battery is important for the efficiency of electric vehicles. A high power density is required to recapture high amounts of energy in a short time during
regenerative braking or fast recharge. This gives a difficult optimization problem, since the system has to cope with very high current densities during recharge and relatively low current densities during discharge. It also relates to the design of the thermal management and the current collectors mentioned earlier. In addition, the design of fundamental battery components such as the electrodes, separator, and electrolyte are of great importance for power density.
» LIFE, RELIABILITY, AND SAFETYLIFE IS A MAJOR CONSIDERATION where safety and reliability are closely related. Discharge, wear, and failure should occur slowly and in a controlled and transparent way. This is not only an issue of the chemistry of the battery, but also of the design, since uneven current density distribution and poor control of discharge/recharge and of the thermal management system may accelerate wear and increase the risks of failure. Short-circuits formed by metal deposition may be responsible for decrease in performance as well as an increased risk for runaway heating. Technologies for state-of-health monitoring are required in order to continuously assess the state of the battery system and the risks of failure.
» COSTSTHE MANUFACTURING PROCESS for high-power batteries and electric powertrains is not as optimized as for mechanical powertrains for combustion engines. There is a larger potential in productivity gains and decreased costs by large-scale production in the manufacturing process for the battery components.
» SUSTAINABILITYTHE DEVELOPMENT OF NEW BATTERIES has to include the aspect of sustainability. There has to be a strategy for mining, recycling, producing, and disposing of new battery types. This is primarily a legal matter for governments, but
Figure 1. Multiphysics simulation of the temperature profile in a liquid-cooled battery pack. Fluid flow and temperature are modeled in 3D and a lumped 1D model of the Li-ion battery is used to calculate the heat source.
L I - I O N B A T T E R Y M O D E L I N G A N D S I M U L A T I O N
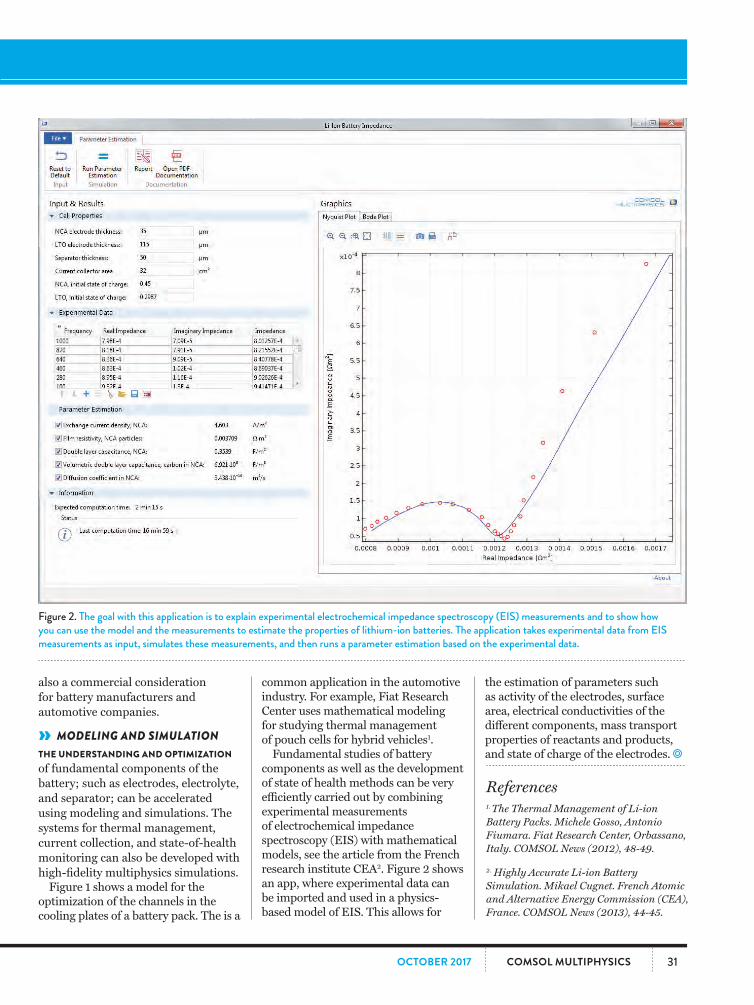
31COMSOL MULTIPHYSICSOCTOBER 2017
also a commercial consideration for battery manufacturers and automotive companies.
» MODELING AND SIMULATIONTHE UNDERSTANDING AND OPTIMIZATION of fundamental components of the battery; such as electrodes, electrolyte, and separator; can be accelerated using modeling and simulations. The systems for thermal management, current collection, and state-of-health monitoring can also be developed with high-fidelity multiphysics simulations.
Figure 1 shows a model for the optimization of the channels in the cooling plates of a battery pack. The is a
Figure 2. The goal with this application is to explain experimental electrochemical impedance spectroscopy (EIS) measurements and to show how you can use the model and the measurements to estimate the properties of lithium-ion batteries. The application takes experimental data from EIS measurements as input, simulates these measurements, and then runs a parameter estimation based on the experimental data.
common application in the automotive industry. For example, Fiat Research Center uses mathematical modeling for studying thermal management of pouch cells for hybrid vehicles1.
Fundamental studies of battery components as well as the development of state of health methods can be very efficiently carried out by combining experimental measurements of electrochemical impedance spectroscopy (EIS) with mathematical models, see the article from the French research institute CEA2. Figure 2 shows an app, where experimental data can be imported and used in a physics-based model of EIS. This allows for
the estimation of parameters such as activity of the electrodes, surface area, electrical conductivities of the different components, mass transport properties of reactants and products, and state of charge of the electrodes.
References1. The Thermal Management of Li-ion Battery Packs. Michele Gosso, Antonio Fiumara. Fiat Research Center, Orbassano, Italy. COMSOL News (2012), 48-49.
2. Highly Accurate Li-ion Battery Simulation. Mikael Cugnet. French Atomic and Alternative Energy Commission (CEA), France. COMSOL News (2013), 44-45.

32 COMSOL MULTIPHYSICS OCTOBER 2017
SAM G. PARLER, JR., P.E. lives in South Carolina, and graduated from Clemson University in electrical engineering. From 1988 to 1991 he worked as the principal investigator for a Strategic Defense Initiative at Cornell Dubilier, developing high energy density electrolytic pulse capacitors for military applications. In 1994 he cofounded Maven Capacitor Corporation (presently owned by Abbott Laboratories) to develop and produce thin, flat pulse capacitors for implantable defibrillators. Mr. Parler has served as director of research and development for Cornell Dubilier since 1996, is a senior member of IEEE and holds five patents in the area of capacitors, including two on hermetically sealed aluminum electrolytic capacitors.
FOR ENGINEERS CREATING NEW PRODUCTS, a clean slate is full of opportunities. But due to a universal principle known as Conservation of Sorrow, for every clean slate, there is also a calendar. And lately, it seems that the calendar is morphing into an hourglass. When the constraints and design goals are somewhat firm, while the inputs are fuzzy and timing is tight, the best simulation tools offer broad capabilities and rapid evaluation and emphasize interoperability, extensibility, automation, and robustness.
The necessity of numerical simulation during the design and development of electronic components is well established. The alternative of guess-build-and-test is too slow and expensive to be tenable. Capacitor life tests require thousands of hours of work, so uncovering design flaws late in their development is not optimal.
Using simulation to examine the electrical and thermal properties of a capacitor might seem simple and straightforward. Much of our design work is usually in the packaging and its details because this is, after all, where the device interfaces with the customer’s environment. That’s when we get into the structural modeling of the stresses surrounding very complex designs and realize that not all software is built the same. No single simulation tool can always do it all — though the COMSOL® software comes close. Having modeling software that allows for interoperability with the other tools in our R&D toolbox has given Cornell Dubilier Electronics (CDE) an edge in an industry that competes on quality, time, and costs.
In addition to the physics interfaces
with the Application Builder and shared through the COMSOL Server™ product can contribute mightily to the design effort and to the participation of all of the engineers involved. Other engineers can run their own parameters, coming up with new ideas without having to master the arcana of model development. Being able to run apps makes for a much more inclusive design environment, helping to build a stronger consensus on the final design of new products.
THE BEST ENGINEERING DESIGNS ARE A COLLABORATIVE EFFORTBy SAM PARLER, CORNELL DUBILIER ELECTRONICS
already available, the ability to edit material properties or input custom ODEs and PDEs enables us to work collaboratively with our customers on novel design requests. Not to mention the availability of tools to bidirectionally interface with MATLAB® software or Excel® spreadsheet software to automatically generate our capacitor catalog ratings tables. The product design engineer must also rapidly acquire familiarity with and expertise in the behavior of the product he or she is sculpting. Although the parameter space is usually too immense and multivariate to thoroughly explore in every detail, the frequent use of optimization, sensitivity analysis, and inverse-problem has helped us in gaining insight into many aspects of a product.
At CDE, the best designs and the most robust models are a collaborative effort among many engineers. For those with expertise in the software, model files are readily shared. But not every engineer needs to be an expert in COMSOL Multiphysics to benefit from — or even to directly use — the mathematical models we develop. This is where apps created
G U E S T E D I T O R I A L
Cutaway view and internal temperature distribution of new CDE Type 297 high-voltage, corona-free mica capacitor operating at 12 kHz, 20 kVrms.
Excel is a registered trademark of Microsoft Corporation in the United States and/or other countries. MATLAB is a registered trademark of The MathWorks, Inc.