computing machines for spectrochemical analysis
TRANSCRIPT

1590 A N A L Y T I C A L C H E M I S T R Y
noise ratio and seems capable of yielding qualitative and quanti- tative analyses of the surfaces of solids.
The instrument is being revised in order to increase its resolu- tion, precision, and ease of operation. -4mong the factors re- ceiving attention are:
Re lacement of present spectrometer tube with a highly pre- cise ciamber having considerably better resolution and intensity characteristics.
Improvement of magnet current control circuit. Construction of a hi hly precise electronic fluxmeter. A rotatable sample kolder is to be provided. One side of the
holder will embody a gold sample in order to standardize the instrument for each determination.
Replacement of the counting tube by an electron multiplier or scintillation counter.
ACKNOWLEDGMENT
The authors wish to express their appreciation to Frank E. Myers, head of the Physics Department, Lehigh University, for his many helpful suggestions and to the Lehigh Institute of Re- search for its financial support of this project.
LITERATURE CITED
Auger, P., Compt. rend., 180, 65 (1925). Ibid., 182, 773 (1926). Ibid., p. 1215. Auger, P., J . Phys., 6, 205 (1925). Backus, J., Phus. Rev., 68, 59 (1945). Barkla, C. G., Phil. Trans. Roy. Soc., 204,467 (1905). Broglie, &I. de, and Thiebaud, J . , J . phys., 6, 2 (1921). Ibid., p. 265. Bubb, F. W., Phys. Rev., 23, 137 (1924). Friedman. H., and Birks, L. S., Rev. Sci. Instruments, 19. 323
(1948). Hull, A. W., Phys. Rev., 10, 661 (1917). Kirchner, F., Ann. Phys. , 83, 521 (1927). Kirkpatrick, P., P h y s . Rec.. 38, 1938 (1931). Kretschmar, G. G., Ibid., 43, 417 (1933). Langer. L., and Cook, C. S., Rec. Sci. Instruments, 19, 257
LeMieux, A. F., and Beeman, W. W., Ibid., 17, 13 (1946). Owen, G. E.. and Primakoff, H., P h y s . Rev., 74, 1406 (1948). Owen, G. E., and Primakoff, H., Reu. Sci. I?isf,uments, 21, 447
Pietenpol, C. J., Phys . Re?., 32, 564 (1928). Robinson, H., and Rawhison, W. F., Phil. Mag., 28, 277 (1914).
(1 948).
(1950).
2ol 100
I I :, I 700 .?lo ,720 .730 .7w .750
X-Haj l'hotoelert ron Spectrum of Silver-Gold
MAGNET CURRENT
Figure 10. i l l O >
Enlarged detail
(21) Syl,oull, \I-. T., "S-Rays in Practice." Chap. 5 , Yew York, RIcGmw-Hill Hook Co., 1946.
RECEITED .Janiiary 18. 1931.
Computing Machines for Spectrochemical Analysis D. E. WILLIAMSON AND D. Z. ROBINSON, Baird Associates, Znc., Cambridge 38, Mass.
PECTROCHEIIICAL analysis has been used in many S laboratories for a number of years. The technique is in principle fairly simple, though in practice the difficulties occa- sionally seem ove-whelming.
The principle of all spectrographic analysis depends on the fact that a metal which is burned in an arc emits light of a character- istic wave length and the intensity of this light is a measure of the amount of material in the sample. Ordinarily the spectrum is recorded on photographic plate, the plate is developed, and the intensity of the lines is recorded with a densitometer. The intensity of the line is compared with the intensity of a standard line of another element and the ratio of the intensities is propor- tional to the ratio of the concentrations. This paper describes a measuring and computing device which will give the concentra- tion of the material directly without time-consuming measure- ments.
FUNCTIONS OF INSTRUMENTATION
In the discussion of aims of instrumentation by Wildhack ( 3 ) the specific functions of an instrument were broken down into six categories, These, in order of occurrence from input to output,
were: detection or respoiisp, transmission, indication, recording, control, and data reduction and analyzer. Obviously, not all these functions need be inrorporated in a single instrument, as frequently only detection, transmission, and indication are re- quired from the inst.rumrnt itself. An example of this might be a remote indicating pressure gage ronsisting of an elertric pressure- sensitive pickup, a transmission line with its amplifier, and an output meter calibrated in pressure units. In this case it is assumed, however, that come other agency, probably human, n-ill perform the services of recording, control, and data redurtion. It is also clearly possible to collst,ruct an instrument whieh will perform all six services and then frce the operation from human attention. JVhereas the siy functions of an instrument can be separated philosophically, it is not always possible to separate the components physically and assign to each only a distinct part pf one of the six tasks. Frequently the function of data reduction and analysis may be scattered back through parts of the system which appear to be serving only t'he function of a transmission line.
In addition to the six functions enumerated by Wildhack, "excitation" should be added at the head of the list. The list

V O L U M E 23, N O . 11, N O V E M B E R 1 9 5 1 1591
can now be used to desrribe the operation of a devioe for the quantitative analysis oi a sample from its emission spectrum. Such an instrument is the direct reading spectrometer for the analysis of metallic alloys and other solid mixtures (Figure 1). This instrument is of proved usefulness in spectrochemistry and owes its 8UCCe88 to the dogmatic impartiality of its instrumen- tality and its unique computat,ional ability. It is the last ai these that is examined here.
accumcy of the result can be adjusted to meet the known or s u e pected composition of the standards by mems ai which the in- strument is calibrated.
The “exciter” of the direct reading spectrometer may be con- sidered to be that part of the instrument which operates upon the unknown sample in such a wily as to cause its elements to emit their characteristic spectral lines. This in itself is a complex task and should not be treated lightly in a complete description
Figure 1. Direct Reading Spectrometer
In order to clarify discussion of the instrument, the purpose and the general electrical arrangement of its parts are reviewed briefly. An example of its usefulness might be in the quantita- tive analysis of low alloy steels. All the important elements in steel can be measured spectrographically with the exception oi cmhon, phosphorus, and sulfur (although techniques tor the measurement of phosphorus are rapidly being worked aut). The instrument may be required to make the analysis of this steel, showing eight to twelve of its important components with a pre- cision equal to or better than that possible by either chemical or spectrographic procedures. Far elements present in the alloy in fairly large quantities, precision of 1 to 2% of the amount present is common. The term precision is used here to represent the repeatability of the instrument on a standard or known sam- ple of what is considered to be homogeneous composition. The
Rapid speotmohemioal analysis requires the develop- ment of automatic equipment capable of giving answers in a matter of minutes. In multicornpn- nent mixtures in which the oonoentration of the standard cannot he considered constant, the pmh- lem is complioated by the necessity of solving the atomic dilution equations. One example is the computer embodied in the direot reading speetmm- eter to determine the logarithm of the ratio of two concentrations. A direot reading dilution com- puteer is then used to solve the simple atomic di- lution equations direotly. Instruments for speetro- chemical analysis have heretofore been considered as individual tools which may he used singly or in combination for research or production control. The current demand for rapid, push-button opera- tion requires combining these components into a single instrument. The paper analyzes the direct reiding spectrometer and direct reading dilution computer for their role in rapid spectroohernieal analysis.
of the instrument’s operation. There are two essential parame- ters involved in this step whioh may affect the precisian of the result: the preparation of the sample so that it may be homogene ous and of reasonably constant physical dimensions, and the source ronditions which exert a, profound effect upon the relative intensity and constancy of the spectral lines.
A part of this function is the dispersal of the spectral lines, by means of which the deteotors &re made selective. Each phototube is caused to respond electrically proportional to the intensity of one line of each element to be measured. Stability of the detector is essential, and it is found that this part of the circuit contributes less error than the exciter function.
Detection is accomplished by photomultiplier tubes.
THE ANALYSIS PROBLEM
The problem for the computer is simply to measure the ratio of the intensities of the alloying lines to the intensity of an iron line in such a u.ay that the relative concentration can be indicated directlv. For lou-allog- stcel vhere the iron composition is :lose t,o 100% the ratio of the intensities, which is directly related tq the ratio of the mncentrxtions, e m be considered the eomposi- tion.
The following problems must be aolved:
Short period fluctuations in sample or source conditions should he removed.
The method must cover a wide rangc of concentrations and give an error that is dat ively independent of concentration.
Changes in sensitivity should be corrected fairly simply.
It now becomes necessary t,o connect to the output of the photo- multiplier tubes a suitable computer to perform the functions of data. reduction and analysis, transmission, and indication (the functions of recording and control have not been assigned to this instrument up to the present time). As has been explained ( I ) , it can be shown that for each of the unknown elements present we must d v e tho equation
Ir 1 = R G log I ; + K
This formula. demonstrates that a choice has been made in which the relative intensities of two speptml lines are to be

1592 A N A L Y T I C A L C H E M I S T R Y
measured aa a function of time. The manner in which this is done is shown in the schematic diagram (Figure 2), which further identifies the meaning of the terms of the equation. If the cur- rent generated by the phototube looking at the standard line (usually iron in iron alloys) is allowed to accumulate on the capac- itor, CI, then the charge on Cz (or its voltage) will be proportional to the phototube current and consequently proportional to the spectral line intensity. The same can be said for the other un- known spectral lines which produce proportional currents in their own phototubes and charge up a series of X capacitors, of which only one, C1, is represented in the figure. This method of ac- cumulating information involves a time integration process which effectively removes short period fluctuations of source or sample conditions that might affect the over-all analysis. The charge on the capacitors is ordinarily held a t zero during a pre- sparking period of from 10 to 40 seconds, after which the circuit is switched to allow the capacitors to be charged as described above. The light intensities of the lines are then integrated over several seconds by adjusting circuit parameters and program timers.
MEASUREMENT When the charging cycle is over the capacitors are switched
into the circuit, &a shown in Figure 1, in which the standard capacitor, C2, is allowed to discharge through resistance R. All the unknown X capacitors are connected into the circuit simul- taneously, as indicated by C1, exce t that each unknown capaci- tor is associated with its own ampliger, relay, and indicator. The indicator is set to record the time, tl - t o , as shown in Figure 3, which represents the time necessary for capacitor C2 t o discharge to a voltage equal to that on Cl. - - k) I- U
CLOCK (t)
V. r,
Figure 2. Schematic Diagram of Circuit
There is a particular advantage to using a logarithmic ratio of thio nature, inasmuch as it gives the concentration ratio directly and ie independent of the total light intensity. Moreover, the coverage of a wide range of concentrations is possible and the ac- curacy of reading the indicator dial is the same a t any part in the scale. Another advantage is that any change in the light-collecb ing power or sensitivity of any part of the measuring system will affect only the constant, K , of the above equation, which merely ~erves to translate the whole scale in time, the shape of the curve remaining the same. A calibration shift is thus easily correeted through the rotation of the calibrated dial or the linear transla- tion of whatever scale is used to translate time into concentra- tion.
The output timers, which are in reality clocks with quick starting and stopping mechanisms, are ordinarily calibrated directly in per cent concentration of the desired element. How- ever, this is on the assumption that the standard element such as iron exists in the alloy in essentially 100% concentration. They give directly the ratio of the amount present to the per cent iron, and this is sufficient for low alloys, as even a large, change in the amount of one of the alloying elements would not so affect the percentage of iron present as to cause a detectable errQr in reading. This, however, is not the case with high ~ l loys
such a8 18-8 stainless steel, in which 26% of the metal is chro- mium and nickel. It is clear that in such a case the assumption of a constant percentage of a standard element is untenable. Another computing device is needed to give the actual concen- tration ( 2 ) .
DILUTION COiMPUTATIOX
The first step in resolving this difficulty is to establish the con- cept of “apparent concentration,” which i~ merely the ratio of the unknown to the standard element multiplied by 100. Hav- ing determined apparent concentrations, it is then only necessary to solve the simultaneous equations necessary to reduce the re- sult to actual concentrations.
If A , represents the apparent concentration of an element, X , represents its actual concentration, and S represents the con- centration of the standard element, we have the apparent con- centration represented as
The algebra is as follows:
IooX, A , = __ S or rewriting in another form,
x, A n
s loo
This equation assumes that under the given operating, condi- tions, the intensity ratio of two lines uniquely determines the concentration ratio. However, the reverse of this statement is not required. Also, self-absorption, constant background, and noise will produce curvature in the calibration. Because, how- ever, the calibration in apparent concentration is empirically determined, it is not necessary to this syetem that the con- centration ratio be linearly related to the intensity ratio. (The prohlems of line enhancement or suppression are more compli- cated, and are not greatly benefited by applying the “apparent concentration” concept. In steels including stainless and tool steels, however, no such effect has been definitely identified. In the copper matrix no such effect has been found in 10 to 30% zinc or nickel brasses. In the aluminum nlatrix the effects are widespread. )
- = -
VI
E x 4 0
z 0
Y)
J
e
VOLTS ON CI
I
to t l TIME A
Figure 3. Time Measurement of Capacitor Voltage Ratio
If all of the Equations 1 in A,, are added together we find
zx, z A , s 100
- = -
It is also clear that
EX, = 100 - s , (3) Substituting Equation 3 in 2
V O L U M E 23, NO, 11, N O V E M B E R 1 9 5 1 1593
and with it the moving arm of Pa to obtain balance between thia v_oltage_and the voltage being sampled by the tap switch at X ,
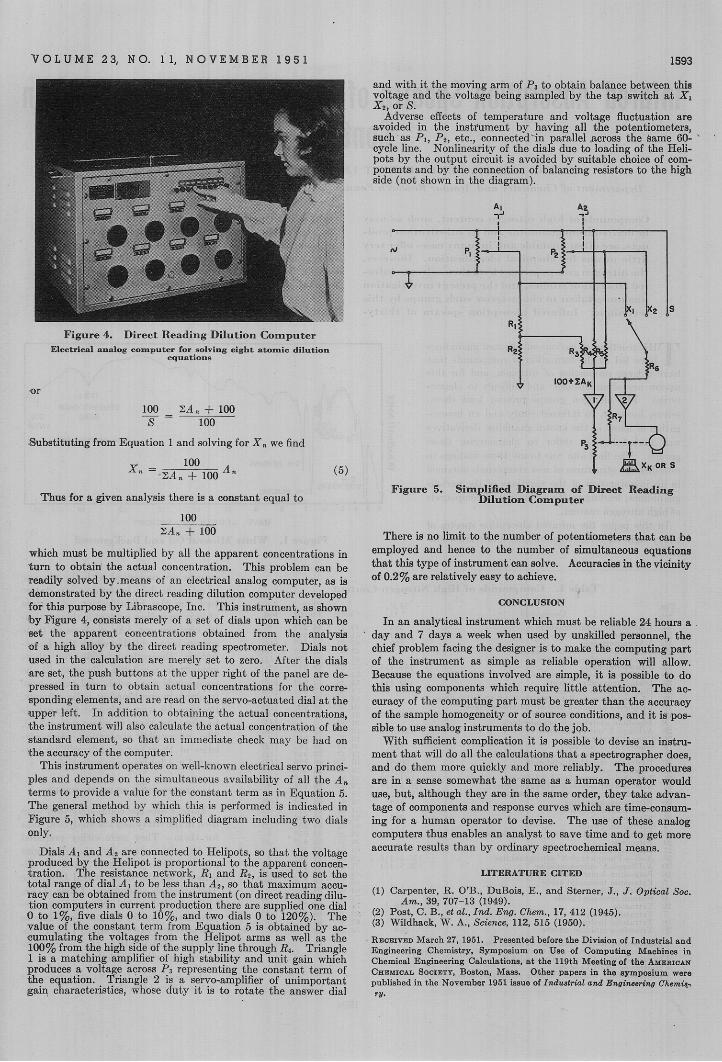
Figure 4. Direct Heading Dilution Computer Electrical analog e ~ m p ~ t e r for solving eight atomic dilution
equation*
100 Z A A . + l W - = s 100
Substituting from Equation 1 and solving for X , we find
Thus for a given analysis there is a constant equal to
100 Z A , + 100
which must be multiplied by all the apparent concentrations in turn to obtain the actual concentration. This problem can be readily solved by.means of an electrical analog computer, as is demonstrated by the direct reading dilution computer developed for this purpose by Librascope, Inc. This instrument, as shown by Figure 4, consists merely of a set of diala upon which can be set the apparent concentration8 obtained from the analysis of a high alloy by the direot reading spectrometer. Dials not used in the calculation me merely set to zero. After the dials m e set, the push buttons a t the upper right of the panel are de- pressed in turn to obtain actual concentration8 for the corm sponding elements, and are read on the servo-actuated dial a t the upper left. In addition to obtaining the actual concentrations, the instrument will also calculate the actual concentration of the atanderd element, so that an immediate check may be had on the accuracy of the computer.
This instrument operates on well-known electrical servo princi- ples and depends on the simultaneous availability of all the A,, t e m r to provide a value for the constant term as in Equation 5. The general method by whioh this is performed is indicated in Figure 5, which shows s simplified diagram including two dials only.
Dials AI and A , are connected to Helipots, m that the voltage produced by the Helipot is proportional to the apparent eoncen- tration. The resistance network, RI and Rs, is used to set the total range of dial A I to be less than As, so that maximum accu- racy can he obtained from the instrument (on direct reading dilu- tion computers in current production there are supplied one d id 0 to 1%, five dials 0 to IO%, and two dials 0 to 120%). The value of the constant term from Equation 5 is obtained hy ac- cumulating the voltages from the Helipot arms as well as the 100% from the high side of the supply line through RI. Triangle 1 is a matching amplifier of high stability and unit gain which produces a voltage B C ~ O B S PJ representing the constant term of the equation. Triangle 2 is a servo-amplifier of unimportrtnt gain characteristics, Those duty it is to rotate the answer dial
x*, or 8. Adverse effects of temaerature and voltage fluctuation are
0 ~~ ~ ~ ~~~~ ~ ~~ ~~ ~~~~~~
dots by the output cirouit is avoided by suitable choice of com- pments and by the connection of balancing resistors to the high side (not shown in the diagram).
Figure 5. Simplified Dilutio
Diagram of Direct Reading n Compute.
There is no limit to the nurnuer or pozencmnecers cnac can be employed and hence to the number of aimultaneous equations that this type of instrument can solve. Accuracies in thevicinity of 0.2% are relatively easy to achieve.
CONCLUSION
In au analytical instrument which must be reliable 24 hours a day and 7 day8 a week when used by unskilled personnel, the chief problem facing the designer is to make the oomputing part of the instrument a8 simple as reliable operation will allow. Because the equations involved are simple, i t is possible to do thirr using components which require little attention. The ac- curacy of the computing part must be greater than the accuracy of the sample homogeneity or of source conditions, and i t is pos- sible to uBe analog instruments to do the job.
With sufficient complication it is possible to devise an instru- ment that will do all the eeleulations that a spectrographer does, and do them more quickly and more reliably. The procedurea are in a sense somewhat the 8 m e as a human operator would use, but, although they are in the same order, they take advan- tage of components and response curves which are time-consum- ing for a human operator to devise. The use of these analog computers thus enables an analyst to save time and to get more accurate results than by ordinary apectrochemicd means.
LITERATURE CITED
DuBois, E., and Sterner. J., J . Optical 5 1 aL0, _"_",_ Id. Ew. C h m . , 17, 412 (1945). i a e e , 112, 515 (1950).
'00.
Rrckivm March 27. 1851. Presented before the Diviision of Industrial and Engineering Chemistry, 8ymposium on Wee of Computing Maahines in Chemical Engineering Calculations, st the 119th Meeting of the AMERICAN C a n ~ r c ~ r . 8ocre~r. Boston. Maas. Other ~ a p e r s in the aympoaium were published in the November 1951 issue of Induatriol and Ewi-ing Chcmis. 'Y.