computerized graphical representation of types of destruction of hardened glass
TRANSCRIPT

Glass and Ceramics Pbl. 57, Nos. 3 4. 2000
UDC 666.1.038.3.001.5
C O M P U T E R I Z E D G R A P H I C A L R E P R E S E N T A T I O N
O F T Y P E S O F D E S T R U C T I O N O F H A R D E N E D G L A S S
A. I. Shutov, ~ P. V. Popov, ~ and A. P. Kolos I
Translated from Steklo i Keramika, No. 4, pp. 9 - 10, April, 2000.
A general method, an algorithm, and results of computer modeling of destruction of hardened sheet glass un- der conditions approximating testing of real products are described. Recommendations for further improve- mcnt of the program are given.
Computational methods [I, 2] for predicting the nature of destruction o f hardened sheet glass make it possible to de- termine the total number of fragments N per prescribed sur-
face area of the article (5 x 5 cm), assuming t, niform distri- bution of them on the surface and identical shape (parallelepiped) and size of each fragment. Testing o f sam- ples according to GOST 5727-88 yields a certain spread in these parameters.
The present paper attempts to give a computer ized graphical representation of destruction of sheet glass under conditions approximating real conditions for product testing.
The development is based on analytical dependences ob- tained earlier [2].
In particular, the average length of a side of the base o f a fragment is equal to [2]
= 7 ~ ; , , ( 1 - 2 v )
where E is the modulus of elongation; 7 is the specific sur-
lace energy; r ~ is the central tensile stress; v is the Poisson
coefficient; 8 is the glass thickness. The average number of fragments for the length B o f a
side of a square plate will be
N = B 2 1 ~ v .
It is assumed that the crack grid is formed by N,. rows, each containing N. fragments. The destruction representation scale is determined:
mas = 400/B,
where 400 is the sheet side size in pixels (a pixel is a conven- tional-measurement unit for a computer display; one conven- tional unit ranges from 0.25 to 0.28 mm).
I Belgorod State Technological Acadcn W of Construction Materials, Bclgo- rod, Russia.
116
The average length of a base side of a fragment repre- sented on the computer display is
Zav = (B/N,. ) mas.
Experimental data show that fragments become larger as they recede f rom the center o f destruction (by the standard, this is the geometric center o f the article). We assume that
within the confidence interval + 20%, the variation in Z (Z is the length o f a base side of a fragment represented on the computer display) as it recedes from the center of destruction will be
0.8Zav _< Z _< 1.2Z~v.
These initial data were used as the basis tbr an original computer program " 'SETGRAPH" providing a graphical rep- resentation o f destruction o f hardened glass. The general structure o f the program is as fbllows.
One o f the main purposes o f the program is to position the center o f each fragment, taking into account the preset variation in the length of a fragment side. First. the centers o f fragments o f the first row are positioned, the ordinal number of the fragment k ranging from 1 to N,. The distance between fragment centers is/bund from the formula
N t AX0[m,k] ~ : " - k Br+O.8Z,~ ~.
where m is the ordinal number o f the row in which the frag- ment is posit ioned on the display; k is the ordinal number o f the fragment in the row; 0 . 8 Z is the arbitrarily adopted mi- nimum length o f a fragment side; B I is the absolute value o f the difference in the length of a side of the preceding and fol- lowing fragments in the row with the number m,
B, = IZ [m, k - 1 ] - Z [m, k]l - 0"4Zav N ./2
0361-7610/00/0304-0116525.00 :c~ 2000 Kluwer Academic/Plenum Publishers
Computerized Graphical Representation of Types of Destruction of Hardened Glass 117
where 0 .4Zv is the difference between the maximum and minimum length of a fragment side.
As a result, the coordinate along the X axis for the center o f fragment k in row m will be
,gO [m, k ] = X0 Ira, k - I ] + AX0 [m, k ].
The value of the coordinate along the Y axis for the cen- ters o f the fragments in this row is constant.
Next we construct the angles between the base sides o f each fragment shown on the display (Fig. 1). A fragment is arbitrarily split into four sections, the coordinates o f each vertex being determined:
X(m, k, i ) and Y(m, k, i ),
where i is the number o f the fragment angle, ranging from 1 to 4.
Let us assume that all vertices of the fragment base are equally far from its coordinate origin (Fig. 1), i.e., are posi- tioned on a circumferences with the radius R[m, k]. The value o f the radius is different for each fragment and is fbund as follows:
R[m, k] = Z [m, k] " - , 2
where
Z[m,k ]= N~" -Fk + ml B {_ 2 Jl '+0"8Z~v"
We assume that the shortest distance from a base vertex to the Y axis is
Lx[m, k, i ] : random (0.6R) + 0.335R,
where 0.335R is the arbitrarily adopted minimum possible distance from the vertex to the Yaxis; 0.6R is the difference between the arbitrarily adopted maximum (0.935R) and mi- nimum distances from the vertex to the Y axis.
The symbol "random(0.6R )" in the above relationship is a function that generates a random number in the interval (0.6R).
The shortest distance from a base vertex to the X axis is
L ,, Ira, k, i I = ~/R 2[m, k] - L2\. [m, k, t],
The base vertices on the display are connected by conti- nuous lines, which represent the crack grid o f the destroyed hardened glass.
The initial data (processed by the SETGRAPH program) make it possible to obtain a crack grid for hardened sheet glass up to 0.9 m 2 in size with the number o f fragments rang-
Y
X [m./., 31 ~ Y Ira. k, 4] Y[m,k, 3 ] ~ - - } - - ~ . - ~ " I
X Ira, k. 2 Y[+h,k, 2] " ~ " " - ' - - ~ g[m,k,l]
Fig. 1. Scheme of the glass fragment structure: I IV) quarters into which the fragment is split.
0 i
0 -
1 0 -
20 -
3(t -
41) -
5o {- mm
l0 20 30 40 50 i , i i i , i , i i mm
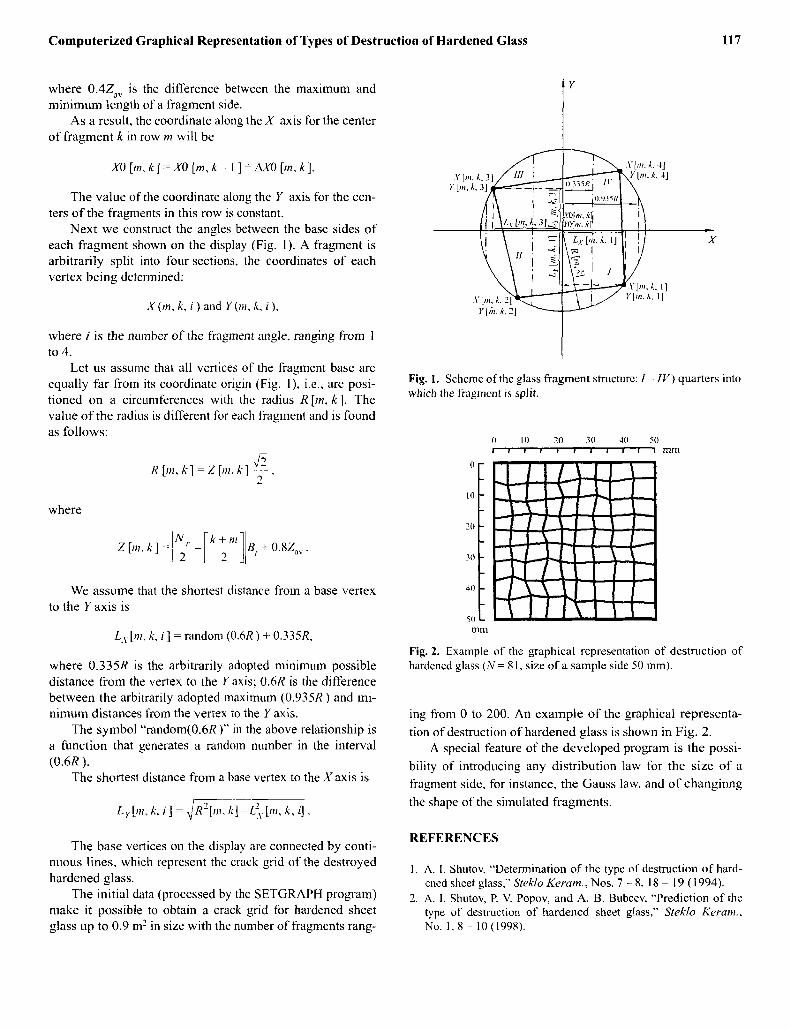
Fig. 2. Example of the graphical representation of destruction of hardened glass (N= 81, size of a sample side 50 ram).
ing from 0 to 200. An example o f the graphical representa-
tion of destruction o f hardened glass is shown in Fig. 2. A special feature o f the developed program is the possi-
bility of introducing any distribution law for the size o f a
fragment side, for instance, the Gauss law, and o f changinng
the shape of the simulated fragments.
REFERENCES
1. A. I. Shutov, "Determination of the type of destruction of hard- ened sheet glass," SteMo Keram., Nos. 7 - 8, 18 19 (1994).
2. A. I. Shutov, R V. Popov, and A. B. Bubeev, "Prediction of the type of destrnction of hardened sheet glass,'" Steklo Keram., No. 1 , 8 - 10(1998).