computer-controlled microwave drying … · of engneersof potentially difficult organic and...
TRANSCRIPT

AD-A23 487I I IITECHNICAL REPORT GL-90-26
COMPUTER-CONTROLLED MICROWAVE DRYINGof EngneersOF POTENTIALLY DIFFICULT ORGANIC
AND INORGANIC SOILS
by
Paul A. Gilbert
Geotechnical Laboratory
DEPARTMENT OF THE ARMYWaterways Experiment Station, Corps of Engineers
3909 Halls Ferry Road, Vicksburg, Mississippi 39180-6199
DTIC.k JUL 0 3 i991
{,/ December 1990
~Final Report
Approved for Public Release; Distribution Unlimited
(~ 9-03931
W Prepared for US Army Engineer Division, Ohio RiverLABORAFOR¥_ Cincinnati, Ohio 45201-1159 S91 7 02 017
,_ _ _ I I

Destroy this report when no longer needed. Do not returnit to the originator.
The findings in this report are not to be construed as an officialDepartment of the Army position unless so designated
by other authorized documents.
The contents of this report are not to be used foradvertising, publication, or promotional purposes.
Citation of trade names does not constitute anofficial endorsement or approval of the use of
such commercial products.

UnclassifiedSECURITY CLASSIFICATION OF THIS PAGE
Form ApprovedREPORT DOCUMENTATION PAGE OMNo.roe
'la. REPORT SECURITY CLASSIFICATION lb. RESTRICTIVE MARKINGSUnclassified
2a. SECURITY CLASSIFICATION AUTHORITY 3. DISTRIBUTION/AVAILABILITY OF REPORTApproved for public release; distribution
2b. DECLASSIFICATION IDOWNGRADING SCHEDULE unlimited.
4. PERFORMING ORGANIZATION REPORT NUMBF.R(S) S. MONITORING ORGANIZATION REPORT NUMBER(S)
Technical Report GL-90-266a. NAME OF PERFORMING ORGANIZATION 6b. OFFICE SYMBOL 7a. NAME OF MONITORING ORGANIZATIONUSAEWES (If applicable)Geotechnical Laboratory
6c. ADDRESS (City, State, and ZIP Code) 7b ADDRESS (City, State, and ZIP Code)
3909 Halls Ferry Road
Vicksburg, MS 39180-6199
So. NAME OF FUNDING/SPONSORING Bb. OFFICE SYMBOL 9 PROCUREMENT INSTRUMENT IDENTIFICATION NUMBERORGANIZATION (If applicable)
USAED, Ohio River I
8c. ADDRESS(City, State, and ZlPCode) 10. SOURCE OF FUNDING NUMBERSPROGRAM PROJECT I TASK IWORK UNIT
Cincinnati, OH 45201-1159 ELEMENT NO NO NO ACCESSION NO
1 TITLE (include Security Classification)
Computer-Controlled Microwave Drying of Potentially Difficult Organic and IT rganic Soils
12. PERSONAL AUTHOR(S)Gilbert, Paul A.
13,n, TYPE OF REPORT 13b. TIME COVERED 14 DATE OF REPORT (Year, Month, :aY) 15 E COUNTrna 1 report FROM ____TO ___ Decebr19U2'
16 SUPPLEMENTARY NOTATIONAvailable from National Technical Information Service, 5285 Port Royal Road, S-,ringfield,VA 22161.
17 .OSATI CODES 18 SUBJECT TERMS (Continue on reverse if necessary and identify by %Ixk number)FIELD GROUP SUB-GROUP
See reverse
19, ABSTRACT (Continue on rTverse if necessary and identify by block number)This report s the secono in a series on a microwave drying system for rapid water
content developed at the US Army Engineer Waterways Experiment Station. The focus of thefirst report in the series was on development of equipment and the investigation of its useon inorganic soils. The focus of the present reported investigation is on microwave systemdrying of potentially difficult soils and earth materials, some of which have a history ofrequiring special treatment for ordinary conventional oven water content determination.Materials tested in this investigation are gravels, gravelly soils and earth-rock mixtures,dredged materials, fly ash, gypsum rich soils, calcite rich soils, organic clay,, peat, andhalloysite rich soils.
Because specimen sizes too large to be practical for the microwave system would herequired for representative samples in earth-rock mixtures,, a procedure is outlined todetermine water content based on knowledge of earth-rock composition. Gravels,, dredged
(Continued),
20 DISTRIBUTION /AVAILABILITY OF ABSTRACT 21 ABSTRACT SECURITY CLASSIFICATIONEl UNCLASSIFIED/UNLIMITED L3 SAME AS RPT 0 DTIC USERS Unclassified
22a NAME OF RESPONSIBLE INDVIDUAL I2b TELEPHONE (Include Area Code) 22c OFFICE SYMBOL
DD Form 1473, JUN 86 Previous :dtions are obsolete SECURITY CLASSIFICATION OF THIS PAGE
Unclassified

UnclassifiedSECURITY CASSiHICATION OF THIS PAGE
i8. SUBJECT TERMS (Continued).
Compaction control equipment Microwave oven Water content
Computei--controlled equipment Rapid water content measurement
Field monitoring equipment User's manual
19. A3STRACT (Continued).
materials, organic clay, fly ash, and calcite rich soils are demonstrated to dry satis-factorily in the system using the same procedure ss for normal inorganic soils. The systemwas used to dry materials containing amounts of organic material varying from about 2 per-cent to nbout 90 percent, and it was demonstrated that even though special software wasrequired to dry highly organic soil (peat), the equipment dried these materials satisfac-torily The system failed to properly dry gypsum rich soils. Special software was re-quired to dry peat and halloysite rich soils, and the development and documontation of this
special sofcwaru are given along with a version of the software for drying inorganic soilswritten for International Business Machines compatible computers. Additionally, anenhanced version of the original software written for the Commodore 64 computer i given.This version allows for calculations of dry density and allows input and output of manyadditional pieces of information for site and test identification and documentation,
Data from use of the microwave system on two US Army Corps of Engineers fieldpojects are included along with an evaluation by field personnel who used the equipment.
Tue results of all soil tests are included. It is concluded that the equipment willsuccessfully aer all tLe potentially problem soils investigated to the conventional -ven
,r content with the exception of gypsum rich soils.
Unclassified
SECURITY CLASSIFICA I WIN OF THIS PAGE
4L

PREFACE
The study reported herein was sponsored by the US Army Engineer
Division, Ohio River (ORD), under IAO No. ORD-88-57, dated 24 May 1988. The
investigation was conducted by the US Army Engineer Waterways Experiment
Station (WES) during FY 1988 and FY 1989.
The study was conducted under the direction of Dr. William F.
Marcuson III, Chief, Geotechnical Laboratory (GL), WES, and under the general
supervision of Dr. Don C. Banks, Chief, Soil and Rock Mechanics Division
(S&RMD), and Mr. Gene P. Hale, Chief, Soils Research Center (SRC), S&RMD, GL.
[he project engineer for the study was Mr. Paul A. Gilbert, SRC, S&RMD. This
report was prepared by Mr. Gilbert. Special thanks are extended co Mr. Terry
V. Jobe, SRC, S&RMD, for his invaluable advice and assistance with computer
programming. Project monitors for this study were Messrs. David P. Hammer and
John W. Emmerich, ORD.
COL Larry B. Fulto,, EN, is the Commander and Director of WES.
Dr. Robert W. Whalin is the Technical Director.
OTIO
1. .' Ji -- i
Diet S e..t2
1I
tD
| ~ ~ ~ ~ ~ ~ ~ ~~ I i5! !cationl
Lwl!. ,I l l!!I

CONTENTS
PREFACE ..................................................................... 1
CONVERSION FACTORS, NON-SI TO SI (METRIC) UNITS OF MEASUREMENT ............ 4
PART I: INTRODUCTION................... ................................. 5
Background.......................................................... 5Objective and Scope................................................. 6
PART II: INTERNATIONAL BUSINESS RACHINES COMPATIBLE SOFTWARE ............. 7
PART III: HOMOGENIZATION OF WATER CONTENT SPECIMENS ....................... 12
Water Conten- Variation in Clay Chunks .............................. 12Water Content Variation in Homogenized Clay ..................... 13
PART IV: DEHYDRATION OF CLAY MINERALS.................................... 16
PART V:. EARTH-ROCK MIXTURES.............................................. 17
Background.......................................................... 17Explosion of Gravel Particles.................................... ... 17Water Content of Earth-Rock Mixtures ................................ 19Conclusions......................................................... 23
PART VI: MICROWAVE DRYING OF GRAVELS AND GRAVELLY SOILS .................. 25
Materials...................................................... .... 25Results of Tests on Gravels and Gravelly Soils ...................... 28Conclusions......................................................... 30
PART VII: DREDGED MATERIALS.............................................. 31
PART VIII: MICROWAVE DRYING OF FLY ASH ................................... 36
PART IX: DRYING OF GYPSUM RICH SOILS..................................... 39
Description of Soil .................................................. 39Factors Influencing Dehydration ..................................... 42
PART X: STUDIES OF CALCITE RICH SOILS.................................... 45
Material............................................................ 45Test Procedure...................................................... 46Calcite Test Results and Discussion ................................. 47Conclusion.......................................................... 49
PART XI* INVESTIGATION OF PEAT........................................... 50
Loss on Ignition Test................................ .............. 50Material......................... .................................. 50Conventional Oven Water Content Determination ....................... 52Modification of Controlling Software ................................ 53Test Results........................................................ 56Conclusions......................................................... 59
2
PART XII: MICROWAVE DRYING OF HAWAIIAI VOLCANIC ASH .................... 60
Background ......................................................... 60Test Results ....................................................... 61Conclusions ...................................................... .. 61
PART XIII: EVALUATION OF MICROWAVE DRYING SYSTEM ....................... 63
Field Performance of Microwave Oven Systems ....................... 63Field Comparison Studies .......................................... 63Microwave Oven System Evaluation by Yatesville .................... 64
PART XIV: CONCLUSIONS AND RECOMMENDATIONS .............................. 65
Conclusions ......................................................... 65Recommendation ..................................................... 66
REFERENCES ................................................................ 71
APPENDIX A: DATA FROM YATESVILLE LAKE PROJECT ANDGALLIPOLIS LOCK SYSTEM ..................................... Al
APPENDIX B: EVALUATION OF US ARMY ENGINEER WATERWAYS EXPERIMENTSTATION MICROWAVE OVEN SYSTEM BY YATESVILLE LAKE PROJECTPERSONNEL ................................................... BI
APPENDIX C: DEHYDRATION CHARACTERISTIC TABLES OF SOME MINERALS ......... C1
APPENDIX D: INTERNATIONAL BUSINESS MACHINES VERSION OF MICROWAVECONTROL PROGRAM FOR INORGANIC SOIL DRYING .................. Dl
APPENDIX E: INTERNATIONAL BUSINESS MACHINES VERSION OF MICROWAVECONTROL PROGRAM FOR DRYING PEAT ............................ El
APPENDIX F: INTERNATIONAL BUSINESS MACHINES VERSION OF MICROWAVESYSTEM CONTROL PROGRAM FOR DRYING MICROWAVERESISTANT SOILS... .......................................... Fl
APPENDIX G: ENHANCED VERSION OF COMMODORE 64 CONTROL PROGRAMFOR INORGANIC SOIL DRYING .................................. Gl
APPENDIX H: DATA TABLES ................................................. HI
3

CONVERSION FACTORS, NON-SI TO SI (METRIC)UNITS OF MEASUREMENT
Non-SI units of measurement used in this report can be converted to SI
(metric) units as follows:
Multiply By To Obtain
Fahrenheit degrees 5/9 Celsius degrees or Kelvins*
inches 2.54 centimetres
miles (US statute) 1.609347 kilometres
* To obtain Celcius (C) temperature readings from Fahrenheit (F) readings,use the following formula: C - (5/9)(F - 32) To obtain Kelvin (K)readings, use: K - (5/9)(F - 32) + 273.15
4

COMPUTER-CONTROLLED MICROWAVE DRYING OF POTENTIALLY
DIFFICULT ORGANIC AND INCRCTTC SOILS
PART I: INTRODUCTION
Background
1. This investigation is the second in a series ccicerned with
developing equipment and experimental cechniques for rapid water content
determination using microwave radiation. In the first investigat.on, a
computer-controlled mLcowave oven system was developed along with its
controlling software to allow rapid, accurate, and reliable water content
determination of inorganic soils. The investigation and its findings (which
included a development of the theory of microwave heating, design, and
construction of the equipment, and use and calibration of the equipment) were
documented in Gilbert (1988).
2. The equipment developed, called the Computer Controlled Microwave
Oven System (CCMOS), uses a microcomputer to continuously monitor mass (water)
loss of the soil specimen under test. The computer responds to specific soft-
ware-recognized cues by electronically manipulating the microwave oven func-
tion through specially designed interface circuits and terminates the test
when certain conditions are satisfied which signal that a water content con-
sistent with that obtained in a conventional oven maintained at 110 ± 50 C has
been reached.
3. A patent search was conducted to investigate the uniqueness of the
system; as a result of the search, it was determined that tha US Army Engineer
Waterways Experiment Station (WES) Microwave Drying System is unique, and a
patent has been applied fo- (application number 259661) at the United States
Patent Office. Uniqueness of the system stems from the fact that the computer
controlled system responds with variable power control to changes in the
specimen.
4. The initial investigation focused, primarily, on inorganic soils
with no unusual properties. The 1987 WES software-driven microwave drying
system worked very effectively on normal soils, but there was no assurance
that it would work on more difficult materials. In engineering practice,
unusual and sometimes difficult soils must often be utilized for construction;
therefore, the water content of these soils must also be determined in a rapid
5
and accurate manner. Problems hate been encountered in very early studies
(Gilbert 1974) when utilizing microwave energy to dry highly organic soils and
soils cont~ining high percentages of certain ferrous iron compounds.
5. 1h.re is, therefore, the need to expand the use of the WES Microwave
System to ronroatine soils that must be used in construction and to fine-tune
the system, making it more convenient and safe to operate.
Objective and Scope
6. The objective of this study is to extend the use of the WES Micro-
wave Oven Syscem for use with nonroutine materials. This objective will be
achieved by acquihing the unusual materials desired for study, testing them in
the microwave oven system and the conventional oven, collating the results,
and then modifying software and procedures when necessary to achieve the
desired correlauion between microwave system and conventional oven water
contents. The materials to be studied and investigated are gravels and earth-
rock mixtures, dredged materials, fly ash, gypsum rich soils, calcite rich
soils, peat, and tropical residual soils.
7. Because of the widespread distribution and use of International
Business Machines (IBM) (and IBM clone) computer hardware, the software
driving the WES Microwave System will be made IBM compatible.
6
PART II: INTERNATIONAL BUSINESS MACHINESCOMPATIBLE SOFTWARE
8. In the early 1980's, IBM published technical specifications for
several models of personal computers in the open literature. Consequently,
vendors from the private sector responded with IBM clones and compatible
personal computers which met the specifications set down by IBM. Personal
computers consistent with these specifications became available from many
vendors; these were immensely popular and achieved worldwide distribution
within 5 years.
9. Because of widespread use and availability of IBM and IBM compa-
tible personal computers and interface peripherals, it was determined neces-
sary to prepare software to allow control of the WES microwave drying system
with IBM compatible computers. The IBM system is directly RS232 compatible
through a built-in nine pin serial port; communication with the balance of the
WES microwave equipment through an RS232C interface is necessary for system
operation. A parallel digital input/output (I/O) interface card P1012 and a
specially prepared microwave oven interface circuit board are required for
communication with the microprocessor of the microwave oven (Figure 1). The
PI012 interface is a 24 bit parallel digital I/O card manufactured by
Metrabyte Corporation of Taunton, MA; this card is inserted into a slot of the
computer. The cost of the card was approximately $120 in early 1988. Connec-
tion of the I/O card to the microwave oven interface circuit board requires
five leads from the P1012 card, as shown on Figure 1, three leads from port A
of the card, a 5-V source, and a ground. The five leads from the PI012 card
connect to an integrated circuit chip, 74LS138, which is a three to eight line
decoder; this decoder in turn connects to two semiconductor switches,
AD75llDl. These three devices make up the microwave oven interface circuit,
described in detail by Gilbert (1988). To control the WES Microwave System
with a Commodore 64 computer, a special transistor-transistor logic (TTL)
signal booster circuit must be prepared with the same five leads that connect
to the microwave oven interface board (Gilbert 1988). However, the difference
in cost between the system which allows control with IBM compatible personal
computers and the Commodore 64 computer is small (less than $100), and with
the Commodore 64 system, the computer can be dedicated exclusively to the
microwave system.
10. Different versions of IBM compatible microwave system controlling
7

z0
wo z
> 00C)
0
z
"-4
co)
L "-4
<) ) ) C
CM ' O v~ C ) (D ' l D CY0 C ) to ( NC -
0
0 0
C.)
-A
00
o 000 0 0 0L

software to accomplish specific drying tasks are shown as source codes in
Appendices D, E, and F, to dry normal inorganic clay and sand, peat and highly
organic soil and microwave resistant , _erials, respectively. Microwave
resistant materials are those that require higher power application than
normal soils; these materials are in contrast to peat and highly organic
soils, which require lower power application than normal soils to reach the
conventional oven water content. The software for drying normal inorganic
soils is a direct conversion from the Commodore 64 code given in Gilbert
(1988). The computer programs for peat and microwave resistant materials
(such as halloysite) had to be developed specifically for those materials, and
the development will be described later. The IBM versions of the software
include a display of total elapsed time since the beginning of the test in
addition to total time of microwave exposure. Total elapsed time includes
"resting" time as well as time of microwave exposure. All the codes, except
that for peat, give the user the option to compute dry density by inputting
(during initialization) density specimen volume in cubic feet (determined from
a balloon test or sand cone device) and density specimen weight. The software
will store these values and when the final water content has been determined
will compute and display dry density based on this water content.
11. The Commodore 64 version of the software has been enhanced to allow
tabulation of total and microwave exposure times as well as the capability to
compute dry density. The operation of the programs will be exactly the same
except that the Commodore 64 monitor is only 40 characters wide and the
enhanced information cannot fit onto the monitor screen. Therefore, the
additional information will appear only on the hard copy from the printer.
The enhanced Commodore software is given in Appendix G. Examples of the
enhanced output for both the IBM and Commodore driven systems are shown in
Figures 2 and 3.
12. For any of tie IBM or Commodore 64 software versions, a printer is
optional and has to be specified by the user, since provision has to be made
for the printer in the timing sequence of the program.
9

MICROWAVE OVEN
WATER CONTENT DETERMiNATION
District: HUNTINGTON Project: YATESVILLE DAM Contract: CQGQY383
Location: YATESVILLE WV Date: 11/23/90 Time: 1605
Sample No.: 34-C Classification: CL Tare Weight (g): 97.69Wet Weight + Tare (g): 148.10
DENSITY SPECIMEN VOLUME IN CUBIC FEET = 9.294787E-04DENSITY SPECIMEN WET WEIGHT IN GRAMS = 50.44
ELAPSED DRYING WEIGHT WATERTIME (SEC) TIME (SEC) (G) CONTENT (%)
0 0 148.1 0.0030 30 147.8 0.0660 60 145,9 4.5690 90 144.1 8.62
120 120 142.7 12.00150 150 141.7 14.55180 180 141.1 16.13240 210 140.6 17.48300 240 140.4 18.03361 270 140.2 18.59421 300 140.0 19.15481 330 139.9 19.43541 361 139.8 19.71601 391 139.7 20.00661 421 139.7 20.00841 421 139.7 20.00
WATER CONTENT = 20.00 %FINAL WEIGHT = 139.7 G
TOTAL ELAPSED TIME : 841 SecTOTAL DRYING TIME : 421 Sec
TECHNICIAN : PAGDRY DENSITY = 99.70 PCF
Figure 2. IBM printer output
10

MICROWAVE OVEN
WATER CONTENT DETERMINATION
DISTRICT: HUNTINGTON PROJECT: YATESVILLE CONTRACT: 12345
LOCATION: WV DATE: 4/19/89 TIME: 1530
SAMPLE NO.: 1 CLASSIFICATION: CH TARE WEIGHT (G): 59.09
WET WEIGHT + TARE (G): 114.4
DENSITY SPECIMEN VOLUME IN CUBIC FEET = 9.294787E-04DENSITY SPECIMEN WET WEIGHT IN GRAMS = 49.7
ELAPSED DRYING WEIGHT WATERTIME (SEC) TIME (SEC) (G) CONTENT (%)
0 0 114.4 032 32 114.4 064 64 113.8 1.09696 96 112.5 3.558128 128 111.69 5.133160 160 111.19 6.142192 192 110.9 6.756252 223 110.69 7.17312 254 110.59 7.378492 254 110.5 7.378
WATER CONTENT = 7.58%
FINAL WEIGHT = 110.5 G
TOTAL ELAPSED TIME = 492 SEC
TOTAL DRYING TIME = 254 SEC
TECHNICIAN: TVJDRY DENSITY = 109.5 PCF
Figure 3. Commodore 64 enhanced output from printer
11

PART III: HOMOGENIZATION OF WATER CONTENT SPECIMENS
13. The conventional constant temperature oven is the standard for
accuracy in water content determination. For this reason, the microwave
drying system should occasionally be checked against the conventional oven.
For a valid comparison, care should be taken to ensure that specimens placed
in both oven systems are as identical as possible. To achieve identical spec-
imens, a single specimen should be placed in a vessel, broken up into small
pieces, thoroughly mixed, and then "split" into two water content specimens
for the microwave system and conventional oven.
Water Content Variation in Clay Chunks
14. Water content in clays of high plasticity may be highly hetero-
geneous even after long periods of curing because of the low permeability
sometimes characteristic of clays and the fact that small particles of highly
plastic clays bind and hold water molecules so tightly that they cannot easily
move through the soil mass. Therefore, uniform distribution of water content
throughout a large volume of specimen may not occur even after long periods.
Consequently, if a large water content specimen is not properly "homogenized"
before it is separated into the microwave and conventional oven specimens, two
specimens with different water contents may be placed in the microwave and
conventional oven systems and comparison of the systems will not be valid.
15. The degree of homogenization in terms of the size of particles into
which specimens are broken is significant. For example, in one experiment,
large chunks of a medium plastic clay (called pullout clay) (liquid limit
(LL) - 53 percent, plasticity index (PI) - 34 percent) were allowed to stand
uncovered and dry in the WES soils laboratory under conditions of relative
humidity about 60 percent and temperature about 250 C. After drying for
3 days in the open air, the large chunks were randomly separated into two
batches and processed: one batch was broken up into smaller chunks of soil
about 2 in.* in size; the second batch was shredded with a cabbage shredder
into about 0.1-in. granules. The two batches were then cured for 3 days in
airtight containers, and 72 conventional oven water contents consisting of
* A table of factors for converting non-SI units of measurement to SI
(metric) units is presented on page 4.
12
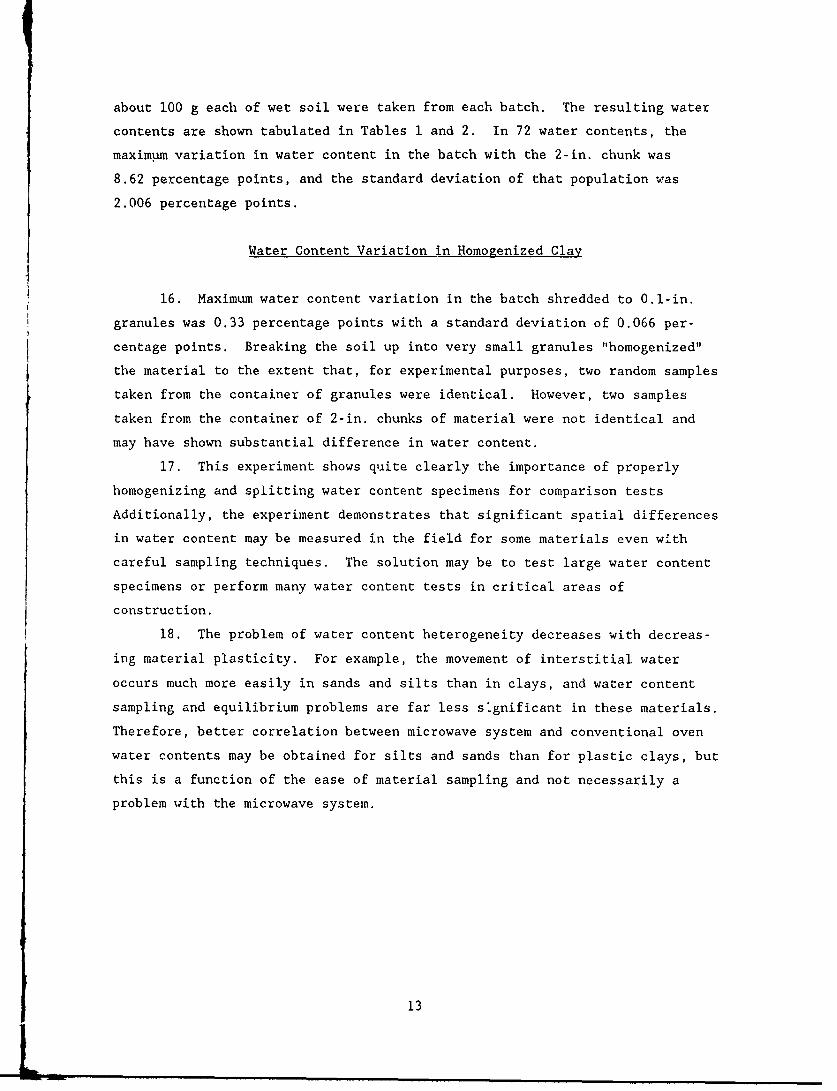
about 100 g each of wet soil were taken from each batch. The resulting water
contents are shown tabulated in Tables 1 and 2. In 72 water contents, the
maximum variation in water content in the batch with the 2-in. chunk was
8.62 percentage points, and the standard deviation of that population was
2.006 percentage points.
Water Content Variation in Homogenized Clay
16. Maximum water content variation in the batch shredded to 0.1-in.
granules was 0.33 percentage points with a standard deviation of 0.066 per-
centage points. Breaking the soil up into very small granules "homogenized"
the material to the extent that, for experimental purposes, two random samples
taken from the container of granules were identical. However, two samples
taken from the container of 2-in. chunks of material were not identical and
may have shown substantial difference in water content.
17. This experiment shows quite clearly the importance of properly
homogenizing and splitting water content specimens for comparison tests
Additionally, the experiment demonstrates that significant spatial differences
in water content may be measured in the field for some materials even with
careful sampling techniques. The solution may be to test large water content
specimens or perform many water content tests in critical areas of
construction.
18. The problem of water content heterogeneity decreases with decreas-
ing material plasticity. For example, the movement of interstitial water
occurs much more easily in sands and silts than in clays, and water content
sampling and equilibrium problems are far less significant in these materials.
Therefore, better correlation between microwave system and conventional oven
water contents may be obtained for silts and sands than for plastic clays, but
this is a function of the ease of material sampling and not necessarily a
problem with the microwave system.
13

ITable I
Water Content Variation in 2-in. Chunks
of Pullout Clay
Water WaterSample Content Sample ContentNumber % Number %
1 22.48 37 22.442 22.71 38 23.683 17.19 39 24.684 23.80 40 24.345 21.08 41 23.766 19.87 42 25.387 21.25 43 22.718 21.42 44 23.629 18.33 45 25.0810 18.06 46 21.98ii 21.38 47 23.0912 24.30 48 20.6513 25.29 49 24.3714 25.25 50 22.7315 19.05 51 21.8416 23.78 52 23.0817 23.34 53 23.7118 25.39 54 23.8419 22.90 55 23.5120 25.37 56 22.3121 25.81 57 23.6022 22.72 58 24.2623 24.35 59 23.1224 20.70 60 18.8925 24.74 61 21.2726 22.13 62 23.3727 25.28 63 21.9028 25.38 64 20.7229 20.00 65 20.4830 24.14 66 22.4731 20.98 67 23.2832 25.41 68 22.5033 25.11 69 25.1834 18.61 70 23.6835 21.95 71 23.7236 20.20 72 22.34
Note: Average Water Content - 22.788 percent.Standard Deviation = 2.006 percent.Maximum Variation = 8.62 percent.
14
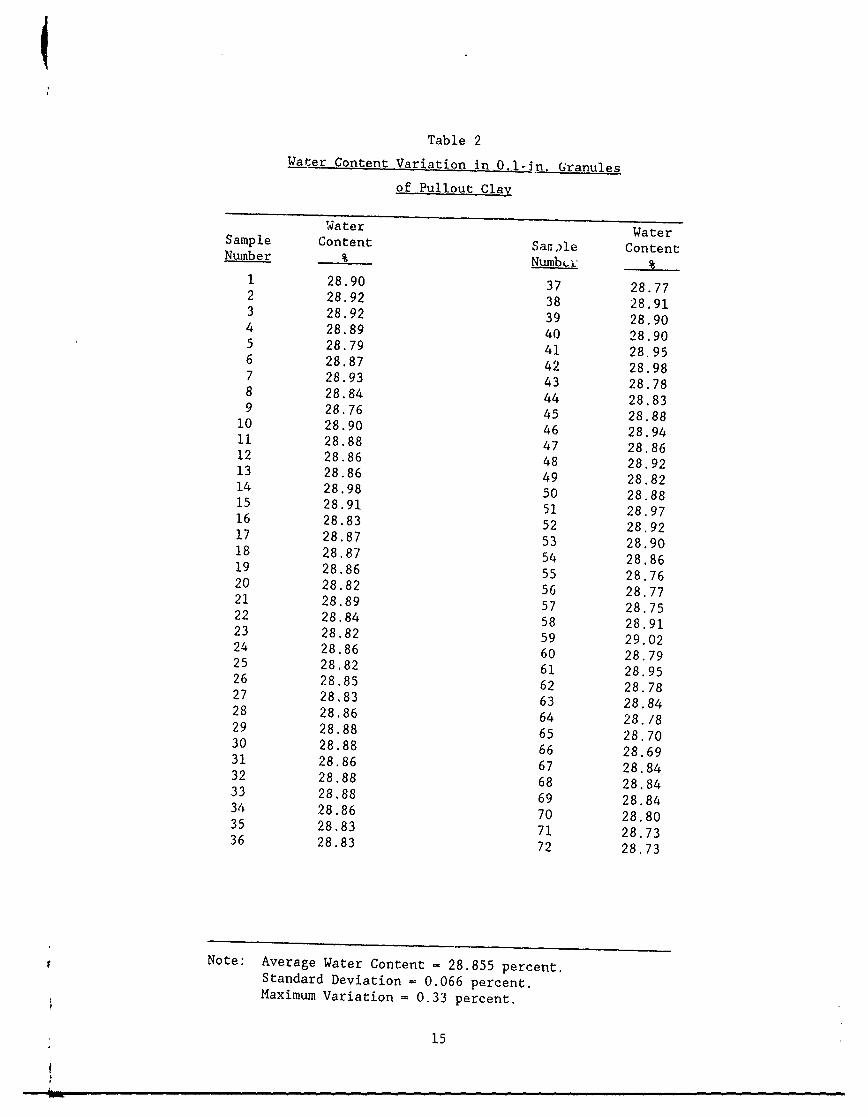
Table 2Water Content Variation in 0.l-in Granules
of Pullout Clay
Water WaterSample Content Saa,,le ContentNumber _____ NumbL' %_
1 28.90 37 28.772 28.92 38 28.913 28.92 39 28.904 28.89 40 28.905 28.79 41 28.956 28.87 42 28.987 28.93 43 28.788 28.84 44 28.839 28.76 45 28.8810 28.90 46 28.94
11 28.88 47 28.8612 28.86 48 28.9213 28.86 49 28.8214 28.98 50 28.8815 28.91 51 28.9716 28.83 52 28.9217 28.87 53 28.9018 28.87 54 28.8619 28.86 55 28.7620 28.82 56 28.7721 28.89 57 28.7522 28.84 58 28.9123 28.82 59 29.0224 28.86 60 28.7925 28.82 61 28.9526 28.85 62 28.7827 28.83 63 28.8428 28.86 64 28./829 28.88 65 28.7030 28.88 66 28.6931 28.86 67 28.8432 28.88 68 28.8433 28.88 69 28.8434 28.86 70 28.8035 28.83 71 28.7336 28.83 72 28.73
Note: Average Water Content - 28.855 percent.Standard Deviation - 0.066 percent.Maximum Variation = 0.33 percent.
15
4.- f

PART IV: DEHYDRATION OF CLAY MINERALS
19. The-relationship between propensity of a clay mineral to dehydrate
at a temperature between 1500 C and 250 ° C and close correlation between
microwave and conventional oven water content was discussed at length by
Gilbert (1988). Less weight loss between those temperature ranges will
correspond to better microwave/conventional oven correlation. Many exotic and
unusual clay minerals exist, some of which are rare and some of which exist
only in specific areas of the world. The difficulty and expense of acquiring
and assembling a large number of these unusual materials for testing are
obvious. However, the appropriateness of drying certain minerals in the
microwave oven and the expected correlation with a conventional oven can be
deduced by considering dehydration characteristics between 150 ° C and 2500 C.
For this purpose, dehydration characteristics of a number of clay minerals
have been assembled in Appendix C. The tables shown were taken from Nutting
(1943). The "weight ratio" used in the tables is the ratio of the weight at
any temperature to the weight at some reference temperature, usually 800' C.
However, 8000 C is not always the reference temperature; some chlorites and
silicates are referenced to 1,0000 C, some micas are referenced to 1000 C, and
some carbonates are referenced to 500 C. From these tables, the relative
difference in water content between microwave system and conventional oven may
be estimated based on the dehydration characteristics of a given clay mineral.
20. It must be stated that the dehydration tables of Appendix C were
determined in a constant temperature oven in which the respective minerals
were allowed to come to constant weight at a given temperature. Relatively
long periods of time were required for some minerals to reach constant weight.
Therefore, even if the tables of Appendix C show a significant relative weight
change between 1500 C and 2500 C for a specific mineral, it does not mean that
mineral cannot be successfully dried in the microwave system. A calibration
test should ba performed and compared with a test from the conventional oven
because, although temperatures may rise to 250' C in specimens in the
microwave oven, the time of high temperature exposure is short and the zone of
high temperature development is often localized, especially since microwave
energy application in the WES Microwave System is intermittent in the last
stage of drying.
16

PART V: EARTH-ROCK MIXTURES
Background
21. Mixtures of soil and gravel or stone are used extensively in the
construction of foundations, bases, and embankments. As with other earth
materials used in construction, the stress-strain and strength characteristics
of earth-rock mixtures are controlled by controlling water content and density
of placed and compacted fill. Structures bein6 built with earth-rock mixtures
mus, be carefully monitored in real time during construction to ensure that
water content and density remain within specified limits around target values;
this can be a problem even for the WES Microwave System because of the large
masses of material required to ensure representative sampling. For example,
the recommendation given by the American Society for Testing and Materials
(ASTM) (1988) for minimum specimen sizes ir materials containing large
particles is given in Table 3. It should be noted that the guidance given by
ASTM is in rough agreement with that given in the EM 1110-2-1906 (US Army
Corps of Engineers (USACE) 1970), as shown in Table 4. In either case, the
minimum mass of wet soil required for materials with a maximum particle size
greater than 1/2 in. varies from an amount that is very inconvenient for the
present microwave oven system (500 to 1,000 g) to an amount that is not
possible with the present system (>1,500 g).
EpIlosion of Gravel Particles
22. In addition to the inconvenience of handling and drying large spec-
imens of earth-rock mixtures, there is the danger that larger gravel, shale,
or stone particles will explode during microwave drying. If particles do ex-
plode, it is likely that the test will have to be aborted because the specimen
container may be broken or solid material may be ejected from the container.,
Specimen containers that have the capability to "smother" and contain
exploding particles are available (Gilbert 1988), but they are inconvenient to
use and may prevent complete soil drying because the container must be closed.
23. Water-saturated soil particles of high brittle strength tend to
explode upon drying inside a microwave oven that outputs about 700 w of
microwave energy. Particles explode because water vapor is generated more
rapidly in the interior of a particle than it can escape through particle
17

Table 3
ASTM D 2216-80 Minimum Water Content Specimen Sizes
Recommended MinimumSieve Retaining More Than Mass of Moist Specimen,
About 10% of Sample Rg_ _
2.0 mm (Ne. 10) sieve 100 to 200
4.75 mm (No. 4) sieve 300 to 500
19 mm (3/4 in.) 500 to 1,000
38 mm (1-1/2 in.) 1,500 to 3,000
76 mm (3 in.) 5,000 to 10,000
Table 4
EM 1102-2-1906 Minimum Water Content Specimen Sizes
Maximum Particle Size Minimum Weight of Sample. g
3-in. (76 mm) 6,000
2-in. (51 mn) 4,000
1-in. (25 mm) 2,000
1/2-in. (13 mm) 1,000
Finer than No. 4 sieve 200
Finer than No. 10 sieve 100
18

'Ipores. Therefore, with time, vapor pressure builds up to a level where the
strength of Lbe particle is exceeded and an explosive failure results because
of sudden brittle fracture of the particles.
24. The length of path through which vapor must pass to escape to
ambient pressure is a function of particle size. Experience has shown that
the division between exploding and nonexploding particles (in a 700-w oven) is
1 in. This size was identified by saturating various sizes of gravels known
to have a saturated, surface dry water content of about 3 percent and then
subjecting the material to microwave drying. The gravels were saturated using
vacuum to remove air from the particles and then soaking the particles in
water. Some 1-in. gravel particles so treated exploded upon microwave
heating. When the fragments of the exploded particles were collected,
resaturated, and reheated in the microwave oven, they did not explode. Of
course, the particles that resulted from the explosion were less than 1 in. in
size.
25. It must be stated that power output is an important consideration
in identifying explosion susceptibility of particles. Higher power ovens will
vaporize water more quickly. Therefore, ovens with power output levels
greater than 700 w will likely cause particles smaller than 1 in. in diameter
to explode. Therefore, problems associated with exploding stone particles may
be avoided by using any of the following measures:
a. Do not dry stone and aggregate particles bigger than 1 in. inovens of about 700-w output power. (Use smaller particles inovens of higher power.)
b. Use fractional power application to slowly heat stone particles1 in. or more in size, thus allowing time for vapor to escapeto avoid explosions.
c. Use containers that will effectively contain and absorb the
energy of an explosion.
d. Recover all the material ejected from specimen containers afteran explosion, restore the material to the container, andcontinue the test. This technique may be used to recover aspecific water content test but is not offered as a generalsatisfactory solution to the problem of exploding particles.
Water Content of Earth-Rock Mixtures
26. The water content of gravel particles resulting from the mechanical
breakdown of solid competent parent rock is generally limited to about 3 per-
cent. Table 5 shows percent water absorption (which is the saturated
19
iLAW

Table 5
Water Absorption Capacity of Some Coarse Aggregates
Material Percent Water Absorption Reference
Crushed limestone 3.0 WES 1955
Crushed limestone, limestone 0.4 WES 1956screenings, and fine river (+ No. 4 Fraction)bar sand
Uncrushed che!rt gravel, 2.1 WES 1956Natchez Sand, and (+ No. 4 Fraction)limestone dust
Porous basalt 2.4 WES 1956(Keflavik) aggregate (+ No. 4 Fraction)
Blend of slag (+ No. 4), 3.6 WES 1956crushed limestone, fine (+ No. 4 Fraction)river sand, and limestonedust (- No. 4)
Florida (Brooksville) 3.7 WES 1956limestone (+ No. 4 Fraction)
Coral: Cooper's Island 13.9 WES 1956Quarry, Bermuda (+ No. 4 Fraction)
Coral: Bourne Quarry, 7.1 WES 1956Bermuda (+ No. 4 Fraction)
Porous Basalt from Ririe Dam 3.1 This study
in Idaho
Average concrete sand 0 - 2 Troxell et al.1956
Average gravel; crushed 1/2 - 1 Troxell et al.
limestone 1956
Trap rock: granite 0 - 1/2 Troxell et al.
1956
Sandstone 2 - 7 Troxell et al.1956
Folsom Dam Gravel 2.0 Personal
Communication*
Warm Springs Dam Gravel 3.0 Personal
Communication**
DeGray Dam Gravel 4.0 Strohm and Torrey
1982
* Personal Communication, 1988, R. T. Donaghe, WES, Vicksburg, MS.
** Personal Communication, 1988, D. P. Hammer, ORD, Cincinnati, OH.
20

surface dry water content) of some coarse aggregate of chert, limestone,
basalt, and quartz. Clay, at the other extreme, can exist at water contents
that span hundreds of percent. Therefore, when clay, gravel, and intermediate
size and plasticity material exist in an earth-rock mixture, logic will
suggest that since the water content of the gravel fraction spans such a
narrow range, water content of the nongravel will dominate the average water
content of the mixture.
27. Simple moment analysis allows derivation of the equation
Wavg - wc + X (w8 - wc) (1)
wherew avg - average water content of an earth-rock mixture
wc - water content of the nongravel fraction in the earth-rockmixture
X - gravel fraction - Mgd/Mtd
M8d - dry mass of gravel in earth-rock mixture
Mtd - total dry mass of earth-rock mixture
w8 - water content of gravel in the earth-rock mixture
Equation I is valuable for a number of reasons. First, it allows a sensi-
tivity analysis of all the factors involved in determining the water content
of earth-rock mixtures. For example it may be shown that if the water content
of the gravel is bracketed at 3 percent or less, then the influence of the
gravel water content on the average water content of the mix is small (if X
is also small). Second, Equation 1 allows accurate estimation of the water
content of an earth-rock mixture if the water content of the nongravel and the
gravel fraction are known. Large size in water content specimens to ensure
proper sampling is not necessary if Equation 1 is used. This may be a great
advantage in using the microwave oven to determine the water content of earth-
rock mixtures since the use of large samples exceeding 1,000 g is often not
convenient or possible in the microwave oven. Water content of the nongravel
fraction may be measured routinely with the microwave oven system. The water
content of the gravel fraction may be estimated (based on judgment or experi-
ence), measured (using microwave or conventional oven), or assumed to be zero
since the range of the gravel water content is small and its influence on the
total water content slight. Once an accurate measure of gravel water content
is determined, that value may be assumed to be a constant for subsequent total
21

4water content determinations for some period of time or until the gravel
source changes since the water content for gravel in a given area is not
likely to vary appreciably.
28. The only remaining value necessary for the use of Equation 1 is
X , the gravel fraction. The actual value may be computed from the equation
M /i+Wag= (tw i+w) (2)
where
M1 - wet mass of gravelgw
Mtw - total wet mass of mixture
However, if the water content of gravel in the mixture is small compared with
the water content of the nongravel, then
Mg-9w (1 + w )(3)est M ctw
29. As an example of the magnitude of error involved in using Equa-
tion 3 for typical proportions of earth-rock mixtures, if the gravel water
content, w. , is 3 percent, clay water content, w. , is 20 percent, and the
gravel fraction, X , is 20 percent, then using Equations 2 and 3
Xest- = 1.06
This means that about 6-percent error will result in the estimate of gravel
fraction. If the true and estimated values of gravel fraction are then used
in Equation 1 to compute average water content of a mixture, then for the
values given
(Wavg)x
= 1.01(Wav)avg Xest
This means that typically about 1-percent error in the computed value of
avera6e water content using this system will result from the assumption that
water content of the gravel fraction is small compared with water content of
the nongravel fraction.
30. The gravel fraction, X , may be fairly easily obtained using
22

either Equation 2 or 3. An amount of wet material sufficiently large to
contain a representative soil and rock mix must be obtained and weighed (Mtw).
Now if it is determined to define the gravel fraction as the material coarser
than the No. 4 sieve, then the wet sample should be screened on the No. 4
sieve, and the clay that adheres to the rock particles dislodged by, for
example, blowing with pressurized air. The + No. 4 material should now be
weighed to obtain M . The microwave oven system may then be used to obtaingw
the water content of the nongravel fraction (and also the water content of the
gravel fraction)., The gravel fraction may now be determined using Equation 2
or 3, and Equation 1 may be used to compute the water content of the mix. The
obvious advantage of using this system is that a large sample which may be
representative of the in situ mass (but which is too large to be used in the
microwave oven) may be analyzed for water content.
Influence of gravel water content
31. An additional and valuable advantage of Equation I is that it
allows direct examination of the influence of change in gravel water content
on the change in average water content. This can be done by differentiating
Wavg with respect to w8 . This operation yields
awav X (4)awg
This equation written in a slightly different form is
Aw = X Aw (5)avg g
Equation 5 shows that the change in water content of the mixture is the pro-
duct of the gravel fraction and the change in gravel water content. For
example, if the gravel water content were determined to be in error by 2 per-
centage points and the gravel content 20 percent, then the error in gravel
water content would cause an error in the average water content of 0.4 per-
cent. The range over which gravel water content can vary, combined with
examination of Equation 5, shows that the influence of gravel water content on
average water content is small.
Conclusions
32. The conclusions which are warranted from the analysis presented in
the previous paragraphs of the microwave drying of earth-rock mixture are:
23

a. Samples of earth-rock mixtures large enough to be statisticallyrepresentative of the in situ mass would be so large as to beinconvenient or impossible for the microwave system to handle.
b. Stone or rock particles less than about an inch in diameter arenot likely to explode in microwave ovens generating about 700 wof output power. Explosions may be avoided by excluding suchoversize particles from microwave water content specimens.
c. The saturated surface dry water content of many rock or gravelparticles has an upper limit of about 3 percentage points, avalue that is small relative to the potential water content ofclay soils.
d. Based on c above, the water content of earth-rock mixture maybe conveniently computed with sufficient accuracy by deter-mining the gravel content and measuring the water content ofthe clay fraction (using the microwave oven system).
33. In the next part of the report, the combined effect of these
conclusions is tested experimentally where microwave oven water content of
gravels and gravelly soils are compared with conventional oven test results.
24

PART VI: MICROWAVE DRYING OF GRAVELS AND GRAVELLY SOILS
34. Gravels and gravelly soils are important as construction materials
in and of themselves and as components in earth-rock mixtures. It has been
demonstrated (Gilbert 1988) that the microwave system dries (inorganic) clays
and silts effectively and reliably to the conventional oven water content.
However, because of the extensive use of earth-rock mixtures, it is important
to demonstrate that the system works effectively on clean gravels as well as
clay-gravel mixtures. Several materials were obtained for study and evalua-
tion in this investigation, and they are described briefly in the following
section.
Materials
35. The materials tested during this phase of the study are described
in the following paragraphs.
Folsom Dam gravel
36. Gravel from the site of Folsom Dam was obtained near Sacramento in
northern California. The material has a relatively high specific gravity
(about 2.9), probably because much of the material is weathered granite and
rich in feldspar. The saturated surface dry water content specimens were
prepared by soaking the material under water with vacuum applied for 24 hr,
after which it was removed from the water and the surface blotted dry.
Warren County clay gravel
37. The Warren County sample is a red clay gravel mixture, 46-percent
gravel, 43-pe'cent sand, and l-percent silt and clay size particles by
weight. This soil was obtained from gravel pits in central Mississippi near
Vicksburg. The material is geologically 2 to 3 million years old and was
water deposited as a much coarser material that weathered under very moist
conditions to produce finer gravel, sand, and whatever clay is present. The
red color is due to the degradation of an iron compound and is present in the
clay in the ferrous state. This nmaterial was selected not only because it is
a clay gravel, but also because it contains ferrous iron and it is desirable
to demonstrate that iron compounds present in soils in normal quantities
present no problems for the microwave system.
25

Warren County pea gravel
38. This material is the washed-gravel faction of Warren County clay
gravel between the No. 4 and the 3/8-in. sieve. The material was tested
saturated surface dry and prepared like Folsom Dam gravel.
Warner Robbins AFB sand
39. Warner Robbir.s AFB sand is a reddish brown clayey sand rrom
Georgia. The grain size distribution curve of the soil is shown in Figure 4.
The material is about 41-percent silt and clay, and the liquid and plastic
limits of the silt and clay faction are 23 and 11 percentage points, respec-
tively. This material was chosen (in addition to its high sand content)
because it contains a significant amount of ferrous iron compounds.
NPD gravelly clay
40. This material is a brown gravelly clay from the core of
Mt. St. Helens Sediment Retention Structure in Washington State located about
20 miles west of the Mt. St. Helens Volcano on the Toutle River. The
composition is about 12 to 15-percent gravel and about 35-percent sand by
weight. Liquid and plastic limits of the clay fraction are 60 and 30 percent-
age points, respectively. This material was chosen for testing in the WES
Microwave System because uncontrolled microwave systems experienced problems
in drying this material to the conventional oven water content.
Fifty-percent gravel mix
41. This soil is a prepared mixture of 50-percent Folsom gravel
(No. 4 to 3/8-in. sizes) and 50-percent pullout clay by weight. Pullout clay
is an inorganic "Buckshot-like" clay (LL = 53 percent, PI = 19 percent) of
medium plasticity. This material was prepared to contain the maximum amount
of clay and still be considered a coarse-grained soil. The reason for the
preparation and testing of this "border-line" granular material was to
determine if any material classified granular by the Unified Soil
Classification System (USCS) (USAEWES 1960) should be dried to the same extent
that clean sands and gravels are. Clean sands and gravels consist of rela-
tively large particles (>0.074 mm in diameter) and bind and hold little
adsorbed water. Clay particles, on the other hand, may bind and hold
considerable adsorbed water very tightly because of their highly charged
crystal surfaces. Therefore, clays and granular soils react differently to
the application of microwave energy. Granular materials give up all water
fairly easily as the result of microwave energy exposure, but clays will
retain a level of adsorbed water. Different schedules of microwave energy
26

iH913M AS E13SHWOO iN3383d
In_ ~ ~ C _I - W_ 0n 4
cc V
Li
w w
U)Cf In 0
w
- P4
0 u 0
z- -i
cc_ "i -4
a. In 0
I04
LO %
o X:
x 0
c-
IDD
0 . 0)- z
-~~ E --- L
w 4
co 0 0 0 O0C
-4 in
-J
27<
application are required for the drying of clean granular materials and clays.
This fifty-percent gravel mix soil -,ill be used to determine if a "border
line" clay/gravel should be dried as a clean granular soil or as a clay.
Fifty-percent sand mix
42. This soil is a prepared mixture of 50-percent Ottawa silica sand
and 50-percent pullout clay by weight. This mix is designed to demonstrate
for sand what the 50-percent gravel mix demonstrates for gravel.
Results of Tests on Gravels and Gravelly Soils
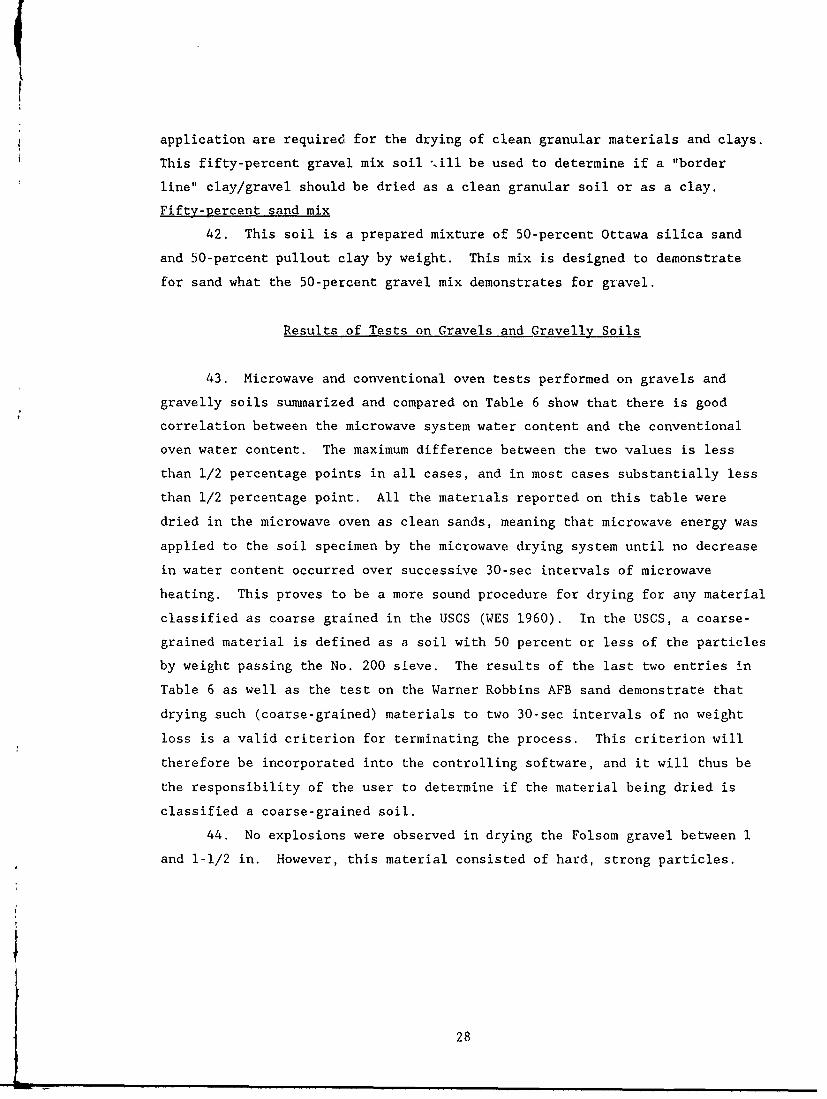
43. Microwave and conventional oven tests performed on gravels and
gravelly soils summarized and compared on Table 6 show that there is good
correlation between the microwave system water content and the conventional
oven water content. The maximum difference between the two values is less
than 1/2 percentage points in all cases, and in most cases substantially less
than 1/2 percentage point. All the materials reported on this table were
dried in the microwave oven as clean sands, meaning that microwave energy was
applied to the soil specimen by the microwave drying system until no decrease
in water content occurred over successive 30-sec intervals of microwave
heating. This proves to be a more sound procedure for drying for any material
classified as coarse grained in the USCS (WES 1960). In the USCS, a coarse-
grained material is defined as a soil with 50 percent or less of the particles
by weight passing the No. 200 sieve. The results of the last two entries in
Table 6 as well as the test on the Warner Robbins AFB sand demonstrate that
drying such (coarse-grained) materials to two 30-sec intervals of no weight
loss is a valid criterion for terminating the process. This criterion will
therefore be incorporated into the controlling software, and it will thus be
the responsibility of the user to determine if the material being dried is
classified a coarse-grained soil.
44. No explosions were observed in drying the Folsom gravel between 1
and 1-1/2 in. However, this material consisted of hard, strong particles.
28

dPI
-4 't0~ cn CC\0, I. M l o 0-4 -0 r4 0 0 - 4 4 )r0000) 0 0 000 0 0
-4-
00
0
$4 a'cjY)r, ~ D ' m' 0 ' I c) 00 .
0)
4) o
oU 0
$4 -4 0L) 0
t 0
E- .H4 0'5 U CO f~-(. Nr:I I~ '.0 Os'ta U- r,'.041$4 rq .- o 0N c -4I r-4 -0 4 - ' 1-4 -40 r, c C.N r- % ('- ) 0- -- 4 tr- C14 11,
IM -0
$4 r->-40
CU 00 0)$P 0 C4 r->)0C4r4 C4 -
m) $40) 11 " r n1- b Y 4 ~ Y
CtC
I I I-I Q) w > l. -~~~~~ 1U~ s 0 04 0r, UsI
(z z*coo-J4MQ.,-4 3( ) 0j~U U,r- 4 -A H r4 cl $40 c (U 4-1$400>vi > : A C144 -I,4 $4' $4J -0 4 co $41 UOZ Z di d
0 U ( 0 0d 0 * 0 Q 4,IL ., -4 34 zr P4u 4-4- d C
294 . -, p>

Conclusions
45. Conclusions from this investigation are:
a. The criterion for termining a microwave test on any coarse-grained soil should be to dry until no weight change occursduring two 30-sec drying intervals.
b. Hard, strong homogeneous gravel particles are more resistant toexploding than flawed, anisotropic particles.
c. The microwave system dried soils containing varying amounts offerrous iron compounds to the conventional oven water contentwithout difficulty.
d. The microwave system dried all the gravels and gravelly soilstested to the conventional oven water content withoutdifficulty.
30

PART VII: DREDGED MATERIALS
46. Millions of cubic yards of fine-grained soils having high water
content and low strength are dredged from the harbors and navigable waterways
of the United States each year. These dredged materials are generally
regarded as waste products to the extent that they are deposited in landfills
in the hope that they will drain, be reduced in volume by subsequent water
loss, gain strength, and ultimately become useful foundations. Because of the
fine-grained character of many dredged materials and the typically high field
water contents (generally several times the liquid limit), it may be necessary
to dry these materials from 30 to 48 hr in a conventional constant temperature
oven to determine an accurate water content. Accurate and expedient water
content information may be required for strength and stability evaluation and
decisions concerning the treatment, managemnent, or storage of dredged material
that may be contaminated with toxic chemicals or may contain varying amounts
of organic material.
47. Companion tests in the conventional oven and microwave systems were
performed on two typical dredged materials obtained for this invest.igation;
one material was taken from Mobile Bay in Alabama, and the other from the Pas-
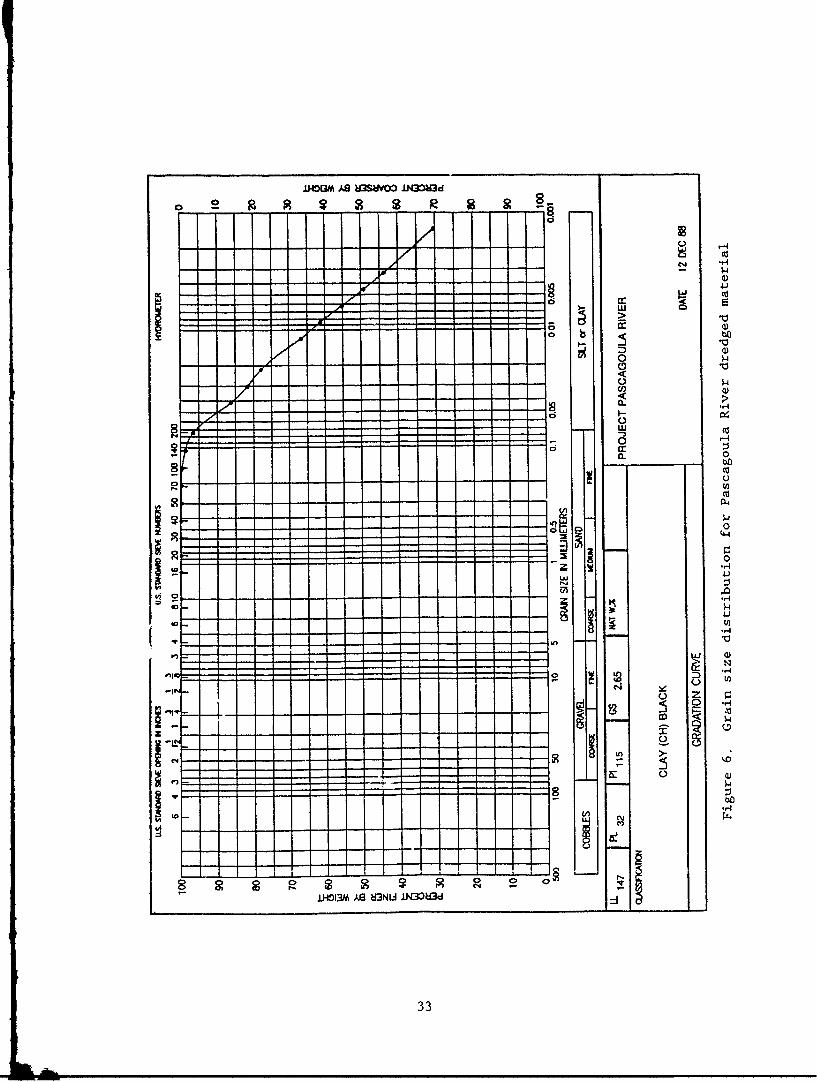
cagoula River in Mississippi. The range of grain size for the Mobile Bay
material is shown on Figure 5, and a single grain size curve for thE
Pascagoula River material is shown on Figure 6. These figures show 'hat the
particles of these particular soils range from medium sand size particles to
particles finer than 0.001 mm. Both materials tested in this investigation
are classified as highly Plastic Clay (CH) soils. The classifications as well
as Atterberg limits and physical description of the materials are given in
Figures 5 and 6.
48. It should be noted that no special precautions were required to dry
these dredged materials. They were dried as normal inorganic to slightly
organic clays with unmodified software and exhibited very unremarkable drying
behavior in the oven except that a great deal of vapor and odor were gener-
ated. Since some dredged materials may contain toxic chemical contaminants,
it will be recommended that when a microwave oven system is used to dry
dredged material, the vapors generated should either be discharged underneath
a ventilated fume hood or discharged to the outside air,
31

.LHO13M AS UJ3SUVOO 1N3OU~d 1V cc
- 0j
w<
o) C 4)J
-j w
C,)
CL)
-.4
LEUL 0
w 0SU 4
3 ZH
U. 0
zcng
I w co-4 0 j
Co W Z
(00 0
I z
80 p 0 00 0(0±HE~MA9 U~II .L~OCM adz
____ ___ ____ ___ ___ ____ ___ ____ ___ __0
32
.I4NGM AS2 U3SWOO ICXWd
s R 2 R
cio
4If) Q)
00
C 0
w O
U)U
U-- -m 44Fls
i i I r T0R4-
IM13,W OU 11MU0
33

49. Microwave and conventional oven tests are summarized and compared
on Table 7. It appears that dredged materials normally present no problems
for the microwave system. The materials dry unremarkably, and water contents
determined correlate well with conventional oven water contents. The only
conclusions that can be drawn from the investigation are that (a) the micro-
wave system is particularly advantageous for use with dredged materials since
long periods are required to determine water contents in the conventional
oven, and (b) large aanounts of vapor and odor may be generated during micro-
wave drying of dredged materials. Because of the possible presence of toxic
chemicals in the vapor, it should be vented or discharged to outside air.
34

X
C1 -
4 4
44
4
r-4
-,4
"."4
10 00 0-4 a a
t0 41) > -4 CN'41) r. r.
4.)
S 00 u
:3 -,
E-4 0 ko
-04 '.0 ('
V C) -4 C")
-4 -4
* -4
0
02)41)ca -
co wr.
-A4
(-4 4)
0 -A rA -4 4.)
".4
4) 1r4 41
., E! -4
0
0 caI
35

PART VIII: MICROWAVE DRYING OF FLY ASH
50. Fly ash is the material resulting from the combustion of coal or
oil for industrial purposes. This material is often precipitated or filtered
from the smokestacks of chemical refineries, foundaries, and power plants.
Fly ash is typically fine grained and light grey or tan in color, and it has
Pozzolonic properties in that the material hydrates and develops cohesive
strength upon exposure to water. The material has commercial value in that it
has been used to stabilize liquid chemical wastes and has been used as a par-
tial replacement for portland cement in concrete block and concrete mats used
to revet channels and rivers. Standards have been set down for fly ash and
approved by ASTM. For example, the material used in this study meets ASTM
specification C-618.
51. Fly ash was tested in this investigation to show that the microwave
oven system may be used to determine the water content of materials that
hydrate, such as portland cement concrete and fly ash. There may even be a
certain ad-antage in using the system to obtain the water content of fresh
concrete for the reason that, initially, concrete containing certain admix-
tures hydrates very quickly and the water of hydration is taken into the
crystalline structure of the concrete and bound so tightly that it cannot be
removed by heating to 1000 C. Fresh concrete will continue to hydrate as it
is placed in a conventional oven at 1000 C for 24 hr, and some water will be
bound by hydration before it is removed by the high temperature. Therefore,
not all water that riould be removed in a normal content determination is
removed, and the water content determined is, to a greater or lesser extent,
in error. In the microwave oven system, the test is finished in about 10 min
before much water is lost to hydration.
52. Microwave and conventional oven tests are summarized and compared
on Table 8. The specimen preparation and test procedure for this investiga-
tion were to mix up a specimen uniformly to the desired water content, split
it prperly, let it cure for the desired period, and then run comparison
microwave and conventi'nal oven tests.
53. The tact that fly ash hydrates is shown by examining the second and
third entries in Table 8, where it is seen that, even though 10-percent water
by weight is added to the dry material, only about 8-percent water content is
determined. Two-percent water is evidently lost to hydration and was not
recovered by either the microwave system or the conventional oven. Increasing
36

004r0 ~ t4 0 .4 r-4 14
4) 6(44 014~4
0
opsJ 4. 0 0 N
0 0
0
0
(t 0
(-4 00 '
04 0 00 '
0S0
004 ON
41, .4 00 ("4Y
0
:3t
0 c~ m~ 't r, 4 1>-C, 41 Nl CD 0 0
'-4o) r4 N4 ci cl
11
U, C
(z401
10 0 0
4--0 00a a) -
4-i ~ .4 *~ SU0-H W ~ 0
s-I ~ .Cd C 4C~ C
d: -4 d r-4 -4 -4-40
37

amounts of water are lost to hydration as the material is allowed to cure for
longer periods.
54. The microwave and conventional oven water contents correlate well
for all tests performed, and the drying process in the microwave system was
unremarkable. The conclusion is that the unmodified version of the software
dries materials that hydrate safely and predictably and does not drive off
water already hydrated. Additionally, it appears from examination of the test
results prebented in Table 8 that the short drying times effected by the
microwave system produced no measurable difference in water content relative
to that measured in the conventional oven.
38
L

PART IX: DRYING OF GYPSUM RICH SOILS
55. Gypsum is a mineral whose occurrence in fine-grained soils is
fairly widespread in the southwestern United States. It is a dihydrate of
calcium sulfate, and its chemical composition is Ca S04 2HZO . The water
in the chemical composition is bonded water, or water of crystallization and
can be shown to be about 21 percent of the weight of gypsum present. Bonded
water is rather weakly bound in the crystalline structure of gypsum to the
extent that it begins to be driven off at temperatures less than 1000 C. This
fact is well recognized in that the procedure recommended by ASTM (Test Method
D2216-80 1989) is to dry gypsum rich soil to a constant weight either by
I vacuum desiccation at room temperature (23 - 600 C) or in a constant
temperature oven maintained at 60 ± 50 C.
Description of Soil
56. For the purpose of this investigation, a fine-grained pink soil
rich in gypsum called Direct Course Soil was obtained from White Sands, New
Mexico. The presence of gypsum was determined by X-ray diffraction in a
procedure described by Phillips (1986). A dehydration curve of the Direct
Course Soil was obtained for this study by drying the soil to a constant
weight in a conventional oven maintained at a specific temperature. Figure 7
shows that water begins to be rapidly removed from the soil at a temperature
of about 800 C. A stable flat section of the curve is evident up to the
shoulder beginning at about 80° C. It may be of interest that one theory of
the dehydration of gypsum is that there are two stable hydrates in the system,
Ca SO4 2H20 and Ca SO4 • 1/2 H20 At temperatures slightly higher than750 to 800 C, the dihydrate (Ca SO4 • 2H20) in a sample is convetted to
hemihydiate (Ca SO4 - 1/2 H20) (Hansen and Offutt 1969). This is consistent
with the dehydration curve generated for this study (Figure 7) as well as a
dehydration curve of a gypsum-rich sand shown by Gilbert (1988) and included
here for clarity (see Figure 8), where a sha,. rise occurs in the curves
immediately after 80' C. The indication by Hansen et al. (1969) is that water
can then be slowly and continuously expelled from hemihydrate up to 5000 F as
it is converted to anhydrite.
39

25
20
15
wa. MICROWAVE OVEN A VG-12.25%
w10
VACUUM DESICCA TION
0 1 1 -I -i
0 20 40 60 s 100 120TEMP 'C
Figure 7. Dehydration relationship of Direct Course Soil
40

25
20
I-15zLU0cc
Ci)
LU
10
60 s0 100 120 140 160 180
TEMP 00
Figure 8. Dehydration curve of a gypsum-rich silty sand
41

Factors Influencing Dehydration
57. Factors influencing the dehydration characteristics of pure gypsum
have been studied by several investigators (Hansen and Offutt 1969, ASTM
1983) and determined to be complex and unpredictable. The dehydration process
will be affected not only by relative humidity in the atmosphere surrounding
the specimen but also by physical and chemical characteristics of the
specimen. A microwave oven dries soil by directing energy to water molecules
in a soil sample that ultimately raises the temperature of the soil-water
mixture to 1000 C and holds this temperature until all free water is
vaporized. If the ASTM recommendation of drying gypsum-rich soils at
60 ± 5° C is observed, then it may be inappropriate to use a microwave oven in
the manner that it normally functions to dry soil, and nearly impossible to
design a controlled process to dry gypsum-rich soil. For example, it may be
possible to determine a schedule of energy application to maintain a sample of
gypsum-rich soil of a given mass, water content, and gypsum content at 600 C.
However, oven load would be determined by the amount of water in the oven, and
this is an unknown function of mass, water content, and gypsum content.
Therefore, no general schedule of energy application could be designed in
light of the unknown gypsum content, water content, and the restriction that
the specimen temperature be maintained at 600 C. Even if the complex
procedure for drying gypsum soils could be easily devised, there would be no
advantage in using a microwave oven over a conventional oven since the same
amount of time would be required for either oven. For "normal" soils, the
very presence of water limits the temperature of the mixture to 1000 C.
However, 100 ° C is too great for gypsum-rich soils and will result in improper
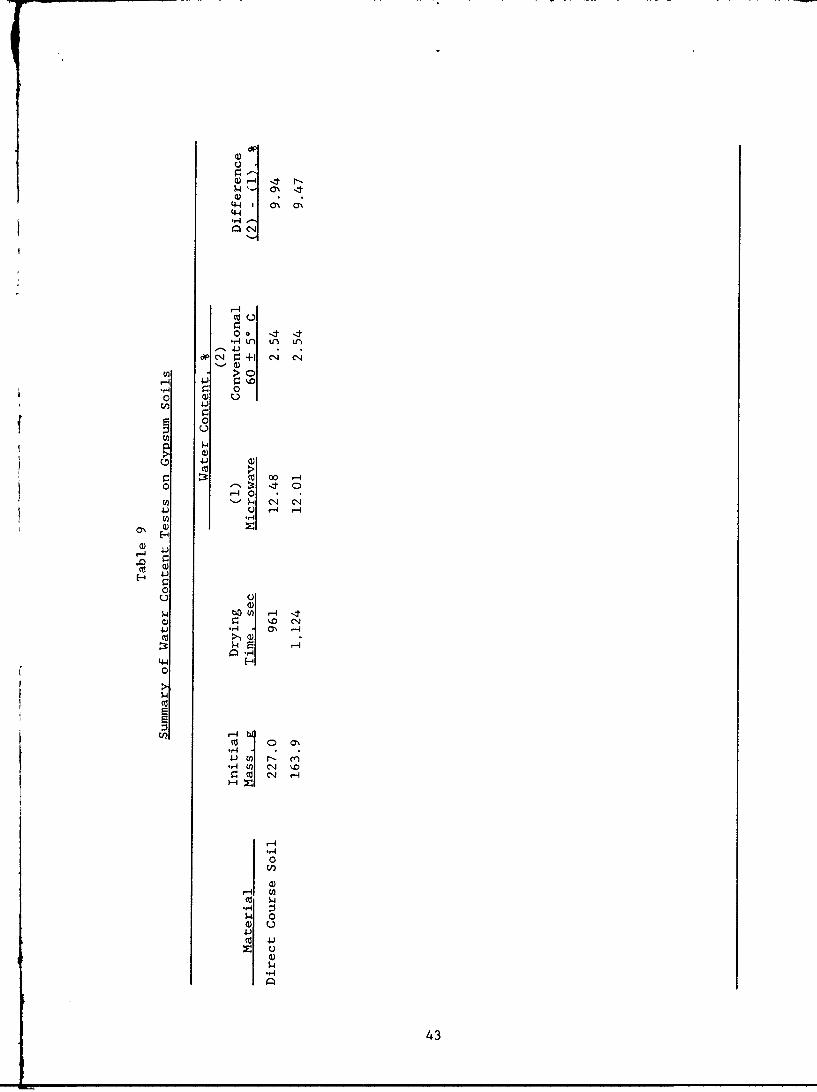
dehydration, as can be seen from Figures 7 and 8. To demonstrate this fact
with actual data (see Table 9), two microwave dried specimens of Direct Course
gypsum using unmodified software resulted in water contents of 12.48 and
12.01 percent. These values are in considerable error when compared with the
60 ± 5 ° C oven water content of 2.54 percentage points. The indicat.on is
that the microwave oven system will produce consistent water content results
for a soil with a given gypsum content. However consistent, tne values will
be incorrect, and the indicated water content will show variation if ihe
gypsum content of the soil (which is generally unknown) changes.
55. Therefore in light of the data and analyses presented above, it is
42
dpi
40)
04-4 tr r n
4j
r-4o 4 4
-,- 0
0 0
0
00 -0 31
41J 14 - -4V)
a' )E*-1
000
0 %Do l
P3 E4 1-4
C4-40
-4
.,j
ca4 Co4 -
( r -4
0 .V))
0
43

concluded that factors which are uncontrollable will prevent correct (relativeIto a 60 ± 5° C oven) microwave oven system water content determination ofgypsum-rich soils. It is recommended that the microwave oven system not be
used on soils containing gypsum.
44
PART X: STUDIES OF CALCITE-RICH SOILS
59. Calcite- and carbonate-rich soils occur commonly in the United
States. For this reason, it was decided to perform a study on calcite rich
soils to determine if problems are encountered in the microwave drying of such
materials. It is known that calcite breaks down according to the chemical
equation
Ca C03 +Heat - Ca 0+ C 2 t (6)
where it can be shown analytically that with the addition of heat, calcite
will lose 44 percent of its weight due to the volatilization loss of carbon
dioxide. The temperature that initiates the chemical breakdown of calcite is
6200 C (Nutting 1943), and it is not believed that overall temperatures reach
this level in microwave specimens; however, local temperatures may indeed
reach this level. For this reason, the investigation with calcite was judged
to be worthwhile, and calcite-rich soils were obtained from the Cerrillo Dam
site near Ponce, Puerto Rico. Ten-bag samples of material were received from
the site, and each material was tested in the microwave system and the
conventional constant temperature oven.
Material
60. All of the materials received contained varying amounts of calcite
or some other calcium carbonate derivative since they all reacted with hydro-
chloric acid (HCL). A brief visual description of each material by sample
number follows.
Sample CBA-WC-#l
61. Sample CBA-WC #1 was a light-brown plastic clay in a matrix of
white nodules with a few dark nodules. The white nodules reacted vigorously
with dilute HCL and were assumed to be calcite. The composite material was
very dense and cohesive and consisted of cliuiiks of material from about 1/2 to
2 in. in diameter.
Sample CBA-WC-#2
62. Sample CBA-WC-#2 was similar to the material of sample CBA-WC-#l
except the material was moister and the individual chanks were softer and more
pliable.
45

Sample CBA-WC-#3
63. This sample was very similar in texture and consistency to CBA-WCO-
#1 except the materials may have been slightly lighter in color.
Sample CBA-WC-#4
64. The fourth sample was a brown crumbly silty clay with lenses of a
white material that reacted with dilute HCL (assumed to be calcite). The
bagged material consisted of particles from individual clay size particles up
to chunks of material 2 in. or more in diameter.
Sample CBA-WC-#5
65. Sample CBA-WC-#5 was similar in color, texture, and consistency to
sample CBA-WC-#4 except there were larger chunks of calcite present.
Sample CBA-WC-#6
66. Sample CBA-WC-#6 was similar to CBA-WC-#l and CBA-WC-#2 in color,
appearance, and texture. There was reaction with HCL, although no large
nodules of calcite were observed.
Sample CBA-WC-#7
67. This sample was light brown to yellow crumbly clayey silt with
nodules of calcite present. Strong reaction was observed with HCL.
Sample CBA-WC-#8
68. Sample CBA-WC-#8 was similar to CBA-WC-#7 except, perhaps, darker
in color.
Sample CBA-WC-#9
69. This sample was similar to CBA-WC-#7.
Sample CBA-WC-#10
70. Sample CBA-WC-#10 was light brown crumbly clayey silt with nodules
of calcite and fragments of a darker rock believed to be limestone because of
its reaction with dilute HCL.
Test Procedure
71. Specimens for this study were prepared by weighing out about 400 g
of wet material, placing it in a clean, dry specimen jar, and sealing it with
a screw-on cap. The material was taken into the humid room (which is
generally maintained at about 95-percent relative humidity), spread on a clean
dry glass plate, and sliced up into small particles with a steel spatula. The
material was then replaced in the capped jar and turned several times in an
effort to mix the particles thoroughly. Equal amounts of the material were
46

then poured into specimen containers for the microwave drying test and the
control test in the conventional oven; it is believed that a reasonably even
split of the material was obtained by using these procedures.
72. It was desired to demonstrate that these materials may be hydrated
and dehydrated reversibly and that there is good correlation between the
microwave system and conventional oven water contents under conditions of
either water added (hydration) or water removed (dehydration). To accomplish
this, some specimens were wetted above the natural water content and some
specimens were oven dried and then wetted to a water content below the natural
water content and tested.
73. For tests on specimens to which it was necessary to add water,
materials at the natural water content were placed on a clean dry glass plate
in the humid room, and the appropriate amount of water necessary to raise the
water content 5 percentage points was added. The soil and water were then
thoroughly mixed with a steel spatula, placed in a sealed glass jar, and
allowed to cure for about 6 hr. The material in the jar was then split for
comparison water content tests.
74. For tests on specimens below the natural water content, the proce-
dure was the same as that previously described except that materials were
first dried to a constant weight in an oven at 110 ± 5' C and then brought to
a water content about 5 percentage points below the natural water content,
cured, split, and tested.
Calcite Test Results and Discussion
75. Results of all tests on the calcite-rich soils are summarized in
Table 10, which shows the initial mass of wet soil used in the microwave sys-
tem, drying time in seconds, a comparison of water contents given by microwave
system and conventional oven, and the difference in percentage between the two
values.
76. Wet specimen masses were about 200 g, which is recommended to
obtain good agreement in fairly short drying times. Drying times were about
600 sec in the microwave system. Agreement between microwave system and
conventional oven water contents is reasonably good, the greatest difference
being less than 1/2 percentage point. The differences between microwave
system and conventional oven water contents are believed to be due, in part,
to random sampling and nonhomogeneity of the "identical" specimens. For
47

Table 10
Summary of Microwave and Conventional Water Content Results on Calcite
Initial Drying Water Content, % Difference inSample Mass Time (1) (2) Water ContentNumber g sec Microwave Conventional (2) - (1),
CBA-WC-#I 211.2 566 21.37 20.91 -0.46
CBA-WC-#2 244.1 568 23.78 23.50 -0.28
CBA-WC-#3 226.2 535 20.31 20.25 -0.06
CBA-WC-#4 195.7 568 27.07 26.62 -0.45
CBA-WC-#5 211.5 567 23.97 23.81 -0.16
CBA-WC-#6 212.8 598 24.15 23.70 -0.45
CBA-WC-#7 213.5 504 18.47 18.77 +0.30
CBA-WC-#8 210.4 504 20.43 20.70 +0.27
CBA-WC-#9 221.6 600 27.57 27.15 -0.42
CBA-WC-#10 196.9 568 26.13 26.08 -0.05
CBA-WC-#2 185.1 599 28.54 28.22 -0.32+5%
CBA-WC-#7 207.5 598 23.80 23.51 -0.29+5%
CBA-WC-#2 201.8 503 18.56 18.18 -0.38-5%
CBA-WC-#7 181.0 440 15.95 15.92 -0.03-5%
48

example, if more of the larger calcite or limestone particles are randomly
placed in one test specimen than the other, then water content diffeiences
will be observed because the calcite has a significantly different water con-
tent than the soil. In this sense, calcite-rich soils are similar to earth-
rock mixtures.
77. In addition to comparison tests performed at the natural water
content, tests were performed on specimens that were wetted about 5 percentage
points above the natural water content and on specimens that were first oven
dried and then wetted up to about 5 percentage points below the natural water
content. Only two sets of such tests were performed because the materials
fell generally into two groups: clayey soils and silty soils. Clayey soils
were CBA-WC-#l, #2, #3, #4, #5, and #6. Silty soils were CBA-WC-#7, #8, #9,
and #10. The two soils chosen to demonstrate hydration and dehydration
reversibility were CBA-WC-#2 and #7, and these data are shown in the last four
entries of Table 1. For specimens wetted above the natural water content,
differences between microwave and natural water content are 0.32 and
0.29 percentage points for materials #2 and #7, respectively. For specimens
wetted up from the oven dry condition to about 5 percentage points below the
natural water content, differences between microwave and conventional oven
were 0.38 and 0.03 percentage points, respectively, for materials #2 and #7.
Conclusion
78. Conclusions believed warranted from this study on calcite-rich
soils are:
a. The difference between water contents determined in the micro-wave drying system and the convekitional oven for the materialstested is less than 1/2 percentage point and for most cases,substantially less than 1/2 percentage point.
b. The materials may be wetted and dried reversibly with no un-expected influence from the calcite. Water content measurementby the microwave system appeared to be well correlated to theconventional oven for wetted cr dried material.
C. Optimum specimen size for the materials was about 200 g wet
weight and drying time about 600 sec.
d. The response of these materials to microwave energy was unre-markable, and no problems were encountered in obtaining micro-wave system water content data that correlated well withconventional oven data.
49

PART XI: INVESTIGATION OF PEAT
79. Swamp muck deposits containing large amounts of decayed fibrous
vegetable matter are called peat. A certain amount of silt or clay may also
occur in peat, but this component is usually small compared with the amount of
organic matter present, which may be upward of 90 percent as determined by a
loss on ignition (LOI) test as described below.
Loss on Ignition Test
80. Loss on ignition tests were performed on two peats, and a highly
organic clay was tested in the investigation to determine the volatile solids
content. The test was performed by first drying the specimen to a constant
weight in an oven maintained at 110 ± 50 C. The specimen was then allowed to
cool to room temperature in a desiccator. An amount of 1100 C oven dry mate-
rial was then placed in a quartz crucible and weighed to the nearest milli-
gram, after which the material and crucible were placed in a thermostatically
controlled oven maintained at 5500 C. The material was allowed to remain in
the oven for 4 hr, a period which had been determined to result in the
specimen reaching a constant weight. The specimen was then removed, placed in
a desiccator to cool to room temperature, and weighed to the nearest
milligram. The percent weight loss on ignition was computed, and the loss
assumed to be volatile solids.
81. The procedure tsed in this study is described because it is some-
what different from ASTM designation D 2974 (ASTM 1988), where oven tempera-
tures of 4400 C (Method C) and 750 ° C (Method D) are specified along with cer-
tain other minor variations. It is believed that the method described above
results in an LOI content that is the same as that determined by ASTM D 2974
Method D.
Material
82. Two tubes of peat were obtained from a Corps levee repair project
at Davis Pond on the west bank of the Mississippi River in St. Charles Parish
in southern Louisiana. One tube of peat was black in color and consisted
chiefly of slightly fibrous vegetable remains and wood fragments with traces
of clay and pockets of black amorphous decayed vegetable matter. This
50

material will be referred to as Davis Pond black peat. Tbq second tube of
peat was dark brown in color and consisted of moderately fibrous vegetable
matter with some plant remains. Traces of clay were less evident in this
soil. This material will be called Davis Pond brown peat. Both these
materials are classified Peat (Pt) in the USCS.
83. An additional material, an organic clay, was included and tested
for the purpose of comparison with the peat. The material was an organic dark
gray clay (CH) from a Corps project called West Bank hurricane protection from
a site near the mouth of the Mississippi River at Venice, Louisiana. Proper-
ties of all these materials were determined (where possible) and are summa-
rized on Table 11, including three materials classified OH that were tested by
Gilbert (1988) and included here for completeness. The last column in the
table is the natural water content of th soils.
Table 11
Properties of Peat and Organic Clay
Material LOI % LL_* % PL,** % % Wnat' %
Davis Pond 82.7 810 .... 711brown peat
Davis Pond 67.6 450 310 140 425black peat
West nk 14.6 228 63 165 125hurricane soil
San Francisco 5.5 88 43 45 90Bay mud
Wilmington 36.7 133 53 80 263Harbor mate-rial 72/2703
Wilmington 184 62 122 91Harbor mate-rial 72/2697
* LL - Liquid limit.
** PL - Plastic limit,f PI - Plasticity index.
51

Conventional Oven Water Content Determination
84. The procedure recommended by ASTM for determining the water content
of peat (Standard D 2216-80 1989) is to dry the material in an oven maintained
at 60 ± 50 C until it reaches a constant weight. Drying peat in a 110 ± 50 C
oven (the temperature for drying inorganic soils) would drive off volatile
elements of the soil that should not be removed in a water content determina-
tion. To demonstrate sensitivity to drying temperature, a dehydration curve
was determined for Davis Pond black peat and is shown on Figure 9. The figure
shows that mass will be continually lost at temperatures above 600 C, and the
indicated water content at 1100 C will be about 34 percent age points higher
than that at 600 C.
470
460
460
C-)'U 0o0.
0
CC 430w
420
410
400
20 30 40 50 60 70 so 90 itO 110
TEMP "C
Figure 9. Dehydration curve of Davis Pond black peat
85. Water content by ASTM (Standard D 2216-80 1989) recommended proce-
dure was determined for Davis Pond brown and black peats in a 600 C oven and
for the black peat by vacuum desiccation at 270 C. Intermediate values of
water content taken with time up to the terminal water content value (Wf) and
the results are summarized on Figure 10. Examination of the figure shows that
52

Wf - 771%(60WC) LEGEND
800 0 BROWN DAVIS POND PEAT, 60°C OVEN(PERCENT WEIGHT LOSS ON IGNITION(LOI) - 82.7%)
700 A BLACK DAVIS POND PEAT, 60°C OVEN(LOI - 67.6%)
600 - 8 BLACK DAVIS POND PEAT, VACUUMDESICCATED 270C
SSoo - Wf . 425%
W400
0
W 3 00 -
200
100
1.000 2.000 3.000 4.000 5.000 6,000 7.000 8,000 9.000 10.000 11.000 12.000 13.000 17,000
TIME, MIN
Figure 10. Water content versus drying time of peat
the time required for a terminal water content to be reached in the 600 C oven
was more than 3 days (4,500 min) and the time by vacuum desiccation was about
12 days (17,000 min). These very extended periods for correct water content
determination suggest the desirability of an accurate and expedient water con-
tent method for these materials. Errlier attempts (Gilbert 1974) to dry peat
in a microwave oven failed and were lbandoned when peat specimens overheated,
overdried, and ultimately caught fire. It was determined to develop a proce-
dure for drying peat in the present computer-controlled microwave oven system
realizing that the procedure would have to be considerably different from that
for drying inorganic soil.
Modification of Controlling Software
86. Volatile organic material may be vaporized and improperly removed
from peat during a water content test at 110 ± 50 C inside a conventional
oven. For this reason, water content tests on highly organic clay and peat
are performed in the conventional oven at a temperature of 60° C to ensure
that volatile matter is not improperly removed.
53
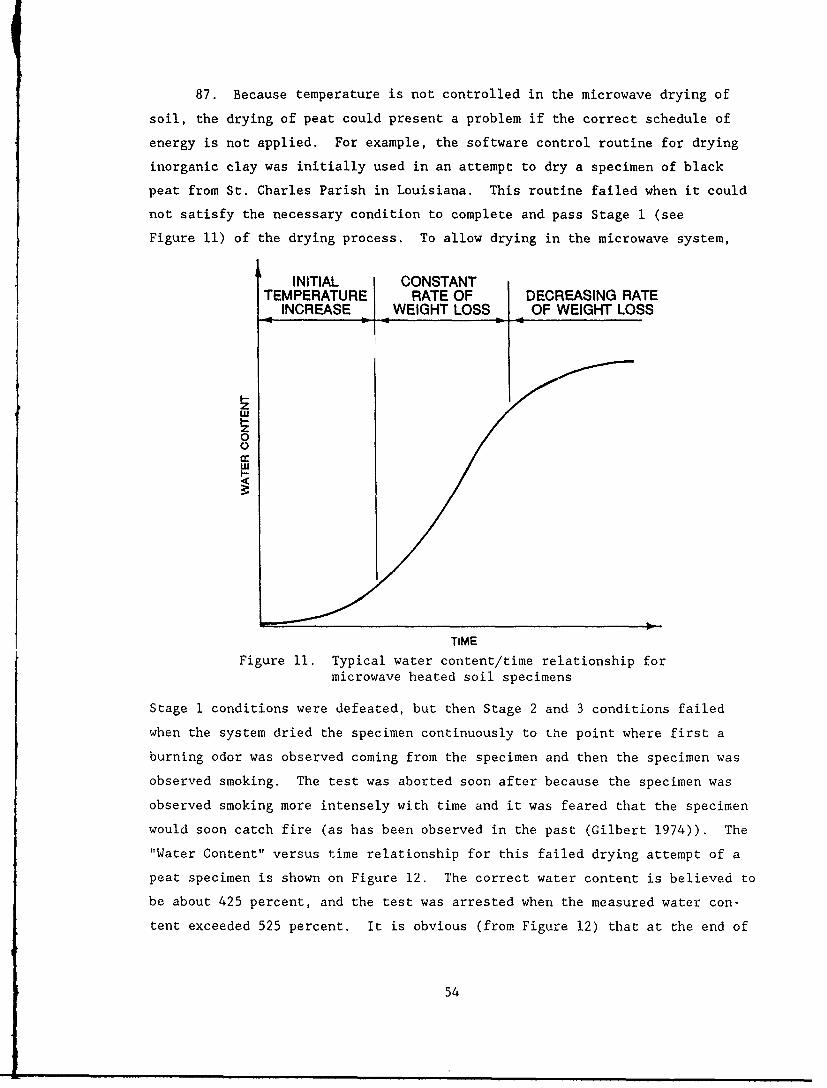
87. Because temperature is not controlled in the microwave drying of
soil, the drying of peat could present a problem if the correct schedule of
energy is not applied. For example, the software control routine for drying
inorganic clay was initially used in an attempt to dry a specimen of black
peat from St. Charles Parish in Louisiana. This routine failed when it could
not satisfy the necessary condition to complete and pass Stage 1 (see
Figure 11) of the drying process. To allow drying in the microwave system,
INITIAL CONSTANTTEMPERATURE RATE OF DECREASING RATE
INCREASE WEIGHT LOSS OF WEIGHT LOSS
00
TiME
Figure 11. Typical water content/time relationship formicrowave heated soil specimens
Stage 1 conditions were defeated, but then Stage 2 and 3 conditions failed
when the system dried the specimen continuously to the point where first a
burning odor was observed coming from the specimen and then the specimen was
observed smoking. The test was aborted soon after because the specimen was
observed smoking more intensely with time and it was feared that the specimen
would soon catch fire (as has been observed in the past (Gilbert 1974)). The
"Water Content" versus time relationship for this failed drying attempt of a
peat specimen is shown on Figure 12. The correct water content is believed to
be about 425 percent, and the test was arrested when the measured water con-
tent exceeded 525 percent. It is obvious (from Figure 12) that at the end of
54

600 SMOKIG-
NOTED
300
SLOPE SLOPE/
400 30 SEC
LoI
TIME. SEC
Figure 12. Water content versus time for drying of St. Charles Parish peat
the test, organic material was being burned and removed at an increasing rate
to the extent that, instead of converging to a constant weight/slope, the
weight of the specimen was continuously decreasing while the slope was
increasing.
88. The figure indicates that the specimen was initially brought to a
state of fairly rapid weight loss by the application of microwave energy. The
slope on Figure 12 corresponding to this condition is 14.86 percent/30 sec.
The rate then decreased to 5.36 percent/30 sec but then increased to a higher
rate in the precombustion stage.
89. From the experience gained from drying the peat sample and analyses
of Figure 12, a procedure for drying peat was determined. Consistent with the
procedure for drying inorganic clay and sand, the sequence for drying peat
will consist of three stages- (a) The first stage will consist of continuous
drying and will continue until a 30-sec increment is sampled when the increase
in water content is greater than 10 percent. At that point, stage two begins.
(b) The second stage will consist of continuous drying and will continue until
a 30-sec increment is sampled when the increase in water content is less than
8 percent. At that point, stage three begins. (c) The third stage consists
55

Iof intermittent drying at half power (30 sec of microwave energy application
and then 30 sec of rest) until the change in water content over a 30-sec
interval is less than 5 percent, at which time the drying process will be
terminated. After a 3-min waiting period, final water content will be
computed, and the test terminated. It should be mentioned that the variables
chosen to control drying of peat (less than 8-percent increase in 30 sec to
pass Stage 2, less than 5-percent increase in Stage 3 to terminate) were the
results of a fairly extensive calibration. For example, when less than
3-percent increase was investigated to terminate Stage 3, the material
consistently overheated and began to burn. The reason for this is obvious; in
an attempt to reach this (too small) shut off value, the material began to
overheat and give off volatile material that increased the rate of weight
loss. At that point, the drying procedure had failed because overheating and
continued weight loss would escalate. In this sense, the terminating value in
Stage 3 is very important. In drying peat or other highly organic material
with this version of the program, the specimen should be observed carefully
during testing, and if smoke and/or odor are evident, the test should be
aborted. However, the version of the program developed and given in
Appendix E proved effective and safe in drying peat with an LOI greater than
60 percent.
Test Results
90. Microwave and conventional oven tests (controls) performed during
this investigation are summarized on Table 12. It should be noted that these
are the tests performed with the completely modified software (except as
indicated). Tests performed to determine appropriate values of process-
controlling variables are not reported because many failed and had to be
aborted. The last three material entries in Table 12 were experiments
performed by Gilbert (1988) on OH soils and are included here for
completeness.
91. Certain measured values for peats (Pt), an organic clay (OH), and
an inorganic clay (CH) are shown on Table 13 for the purpose of comparison.
The first column of the table shows the difference in water content obtained
L at 1100 and 600 C. This difference is, of course, significant for peat with
high loss on ignition values but not so significant for moderately organic
clays. The indication of the data presented in Tables 12 and 13 is that
56

r-4
ox04 r r 0 -1 0r ) U,-4 .r- '.0 00 O
0 0Cl) %D-4
a%'.%0 ('l 4 c'JC"M 00 0
0D 0'.-4 a;C C'.04 00 ,-4 0(44Jr-4 4 14~4
*i-4
-,4r -4cocl ~ C' c-4 a% ON a C1J C'JU 00 Nbi 9 oo r r- 000 00 C'*)U Ln ,r 0
4 00 *p .4 ar4,4 U,,U 4 0'O (
4j r- r- r- N C4C44 C-4 00 (7
041) 41 0
0 0C-
o a) 0) * -x~~(
V/) co ( . %c It In'C-) U,-4N r-q CIULr 0041) ,'' ; M .0 U tn L)u ) 04 4 -400 '.0-
'-0P '- - C-4 N. C'Jl CN' '.0 0'0 N.t
C,4 E- I u r-00 a% L -4 C4 .4 C14 000' U, 0%D' N.'.-ItO-It4I4 4 (
0 0t-
4 CA)
,n '.-a
in L) 00E ) 0) 000oio( m C1~'4 11 000 C It C14 cn r, -4 m.
O00)U 4mL t00c4 c0 0:>0 C'-4 a\ -4-4 00 c) t 0 C'JC4'-4 0 00 00 U, 0
>1 0i
0-4) 0 U.,-40 U.)
0q (4- 04. 0 0C~(2 "-0 4
:3 0* *0 0r c; t 0 N.) U4 0) 44-,4 Cd a\04004 40 N Lr 0 \'JD 00D 0') C4p 4
(4 -q -4 CJ - ' - -4 cz '.14 1004fl :3:~ 0-U0 00 'O'0 C'
410 4
pd 00HC.) U) :3d
V)4.0 4j(D 4 00
0 H ,4 0 4 M W (10- 0 4C'4 0 \D 40-0
p.4 -,4 -4
14-J 0 0Cd co 0cz -00dC 0 r. 4 .,- 4j
CI4 P- 3q h p b
57

V-4
th U) ul U) U
0
41) 41 0o Cd o C C dC
0 14 s-I -4 -4 i- -4 r-4
0 0
0 0 r~*- ~ I 4 *.-4 ,
5-i ) 0 0c .-4 (d a o co C
3 44i 4-4 bD bD O bl4.3 "454 5-4 5-4 $-4
4C 10 0 0 0 0 0
En 000
-,4-4
o r .:0
0- r-
on 0-4 0
u
0 d
14400
o 0
00
544
if)V)C-))
0
-4 0 '-4
410 0 0 r-
" 0 0 - )4 -
5-4 co 5-o 0 r-4 C '
PQ 0 .l 0 a) 0 a /
>4 >) r- E - -
od 0d W. co :J-4 .d
58

unless a material is actually classified peat, the software modified for peat
does not have to be used to dry the material in the microwave oven.
Conclusions
92. Based on observations from the comparison tests and the evaluation
of data from Tables 12 and 13, the following conclusions are believed
warranted:
a. Peat specimens of high water content will require large initialmasses to determine accurate water contents. This is a problemassociated with the resolution of the scales of the system.What may look to be a large initial mass of peat may dry to afew grams of material for which the resolution of the balanceis not great enough to give an adequately accurate measurement.This can be seen by considering the second and third specimenof Davis Pond brown peat on Table 12, where poor agreementbetween control (conventional oven) and the microwave system isdue to inadequate specimen size. Therefore, it is recommendedthat all peat specimens have a minimum of 200 g wet weight.
b. Because of the large quantities of water involved, more than30 min may be required for a microwave oven test on peat.
c. More than 3 days may be required for a conventional oven watercontent test on peat (in a 60 ± 50 C oven).
d. Unless a material is actually classified peat, it is not neces-sary to use the software modified for peat to dry otherwiseorganic clays.
59

PART XII: MICROWAVE DRYING OF HAWAIIAN VOLCANIC ASH
Background
93. Tropical soils occur extensively throughout the world. The same
type of tropical lateritic soil that occurs in the State of Hawaii also occurs
in the Phillippines, New Guinea, Vietnam, Thailand, Indonesia, Burma, India,
Australia, Brazil and other equitorial South American countries, and
equitorial Africa. Latosol is the name of the soil group containing many of
these tropical soils, most of which are iron oxide and aluminum oxide rich,
highly weathered clayey soils (Mitchell 1976, Tateishi 1967). Research has
shown that the amorphous hydrated colloidal fraction of such tropical soils
has a definite influence on physical properties. For example, dehydration of
the soil will result in an irreversible change to a material with more
granular characteristics.
94. The process of laterization involves the leaching of SiO2 and the
deposition of Fe2 03 and A1203 ; the process is a natural consequence of
weathering in hot, wet tropical climates. Grim (1968) reports research which
confirms the laterization process just described by pointing out that the
weathering of basaltic rock in the Hawaiian Islands is largely a matter of
desilication and the removal of bases with the production of large amounts of
halloysite and gibbsite along with lesser amounts of various other minerals
and amorphous gels. Gibbsite is usually associated with the dehydration of
the amorphous gels, but these soils can be and usually are rich in halloysite.
95. The Hawaiian volcanic ash tested in this study is dark red in color
(possibly due to the presence of iron compounds), appears to be dry but has a
natural water content of about 300 percent, and has a liquid limit and plas-
ticity index of 353 and 238 percentage points, respectively. Interestingly
enough, the material is classified MH in that the Atterberg limits plot below
the "A" line on the USCS plasticity chart. Upon drying/dehydration, the
material degenerates to hard nodules of sandlike particles that can never be
rehydrated to the original soil texture. All indications are that this is a
classical latosol/halloysite rich material.
96. The standard software for drying inorganic soils had to be modified
to dry this tropical soil. The modification consisted of changing the timing
sequences to apply microwave energy in 90-sec intervals instead of 30-sec
intervals; rest periods during the third stage of drying remain unchanged.
60

This means that during the third stage of drying, 75-percent power is applied
to the specimen rather than 50 percent. It appears that this material is
somehow resistant to microwave energy, and 50-percent power applied during the
third stage allows the specimen to cool too much, causing the water content to
converge to a value that is too small. The controlling software for drying
microwave resistant soil is shown in Appendix F.
Test Results
97. Microwave and conventional oven tests are summarized on Table 14.
The first three entries in the table show comparison tests performed with the
modified software and tests that are considered successful. The last two
entries in the table show the results of the first two tests conducted, which
were performed with unmodified software. The microwave and conventional test
results do not compare favorably for these tests, but valuable lessons were
learned. Analysis of these tests shows that (a) the software modification was
effective and (b) the size of the specimen is important. Just as with
specimens of peat, too small a specimen of Hawaiian volcanic soil will lead to
mass resolution problems (because of the balance) toward the end of the test.
The result will be a microwave oven water content that converges too quickly
and to an apparently incorrect value because it will not correlate well with
the companion conventional oven water content. Experience would dictate that
a specimen of at least 200 g wet weight be used in the microwave oven system.
Conclusions
98. Conclusions believed to be warranted from this investigation are:
A. Latosol materials may be microwave energy resistant and requirehigher power levels for effective and complete microwavedrying.
b. Specimens of at least 200 g wet weight should be used in themicrowave oven system.
c. Typical drying times in the microwave oven system is of theorder of 2 hr.
d. The modified software allows the determination of water contentvalues in the microwave system that correlate satisfactorilywith those determined in the conventional oven.
_. These latosol soils dehydrate irreversibly becoming hard granu-lar particles upon drying. After dehydration, the originalproperties and material consistency cannot be regained byrehydration.
61

x
CjLno -4 Ui 00) -4 m' C14 r4 0'4
14
'-4
*1-4
.1
1-4 ,
044 C: -'C r
Cd 4.'0) a' 00 00 C 0C,4 0)4 04 1-4C
C.) 0M~ 0 U
o a) 4) coU) (2 ( \D C14 r- m' C14
U) . 0 . .ul0) 1* .- 4 -4 (Ln0
4 - 0 m' r- am Ln 41-4 -,4 C'4 C'.) c') Cs) 0'
0)
0 4 0)
H c(2 p-
0 bo U)-U r. m4 4 C14 C')
a'4 C-4 \D N
r.0)Eu) or 44 1-)
1') 004 00a' C' O -4a
0 )0
*'-4 '-
14 00 )
00
4-)

PART XIII: EVALUATION OF MICROWAVE DRYING SYSTEM
Field Performance of Microwave Oven Systems
99. Two microwave oven drying systems equipped with software designed
to dry inorganic soils were delivered to Corps field projects in the Ohio
River Division in April 1988. The two projects were the Yatesville Lake
Project, where an earth and rockfill dam was being constructed near
Huntington, West Virginia, and the Gallipolis Lock System on the Ohio River
near Gallipolis, Ohio.
i00. Personnel at the project offices used the microwave system as a
"rapid moisture detection device" and compared water content results with
comparison specimens tested in the conventional constant temperature oven.
The procedure used for specimen preparation was to obtain a large sample of
the desired material, break it into small particles in a vessel, homogenize
the material by thorough mixing, and then split the material into two water
content specimens for testing in the two oven systems. Results from field
tests were sent to WES as they w-re obtained for analysis and for incorpora-
tion into this report. The Yatesville Lake Project was successfully completed
in September 1988, but the Gallipolis Lock System repair continues at this
writing.
Field Comparison Studies
101. There were 369 comparison water content test results obtained from
Yatesville Lake Project and 301 results from Gallipolis Lock Project, The
data were analyzed using a least squares linear fit computer code and are
tabulated in Appendix A along with predicted values of water content from the
analysis.
102 The coefficients of determination (R2) of the Yatesville and
Gallipolis data are 0.984999 and 0.983984, respectively. However, when the
two data sets are combined, the coefficient of determination is 0.985304.
This indicates a very good fit of the data and a very reliable correlation.
63

Microwave Oven System Evaluation by Yatesville
103. Mr. Kenneth E. Zimmerman, Resident Engineer of Yatesville Lake
Project, evaluated the WES Microwave Oven System and documented his finding
and opinions in a Memorandum for Record (MFR) dated 19 September 1988. This
MFR is included in Appendix B, and the main points and observations may be
summarized as follows:
a. The system performed satisfactorily on pervious and impervioussoils, the typical difference between microwave and conven-tional oven water content being less than 1/2 percent.
b. Tall beakers or specimen containers caused condensation prob-iems that were solved by using shallow dishes as specimencontainers.
c. Dust contamination will occasionally cause a systemmalfunction which is remeeied by resetting the system.
d. Large shale particles will occasionally explode.
e. A 500-g specimen is recommended (over the original 200-gspecimen recommendation by this author). This helps to elim-inate representative sampling errors.
f. The greatest differences between microwave and conventionalwater content occurred in large particle materials where it ismost difficult to select identical samples with respect torock content.
g. The smallest differences between comparative specimensoccurred in sands. Perhaps this is due to the fact, that insand, particle size sampling and water content homogeneity (asdiscussed in Part III) is achieved most easily.
h. Dust protection is recommended for microwave system componentsin the field.
64
PART XIV: CONCLUSIONS AND RECOMMENDATIONS
Conclusiois
104. Based on the results of he present investigation and the 1988
study by Gilbert, the first, and possibly strongest, conclusion which can be
drawn is that the subject computer-controlled microwave oven system works
safely and reliably for rapid water content determination. The microwave
system dries soil specimens and obtains accurate water contents typically
within a time frame of 10 to 15 min and therefore will eliminate time lag
problems associated with monitoring compacted fill with the conventional oven.
Therefore, it would be highly advantageous to use this microwave equipment in
Corps field projects for compaction control. Tremendous economic advantages
could be gained in terms of construction problems avoided and enhanced safety
of the resulting compacted structure. The system has been tested intensively
in a laboratory environment and has had considerable use in field environments
and has performed well in both situations. Some "shake down" problems were
revealed in the field use of the system, but that was, in part, the intent of
introducing the system to the field. No serious problems were encountered in
field use, and nothing that could not be accommodated.
105. Specific conclusions from the present investigation which are
believed warranted are:
a. Samples of earth-rock mixtures large enough to be statisti-cally representative of a compacted fill would generally betoo large for use in the microwave oven system.
b. The saturated surface dry water content of stone and gravelaggregates is small compared with the range of water contentover which clays can exist. A saturated surface dry watercontent for several gravel aggregates was determined to beabout 3 percent.
C. If the water content of the clay fraction of an earth-rock
mixture is known and if the gravel content is known, thenaccurate water contents of the mixture may be computed byformula from water content of the clay fraction.
d. Rock particles smaller than about 1 in. in size do not explodein the microwave oven syste. Measures may, however, be Lakento minimize the danger of exploding particles such as reducedpower after the first stage of drying or explosion proofcontainers.
e. The microwave oven system was successfully used withoutsoftware modification on:
65

(1) Clean gravels and earth-rock mixtures.
(2) Materials containing iron compounds.
(3) Dredged materials.
(4) Fly ash.
(5) Calcite rich soils.
f. Any material containing 50-percent or more sand and/or gravelshould be dried to a constant weight in the microwave ovensystem (a horizontal mass-time slope).
g. The system will not dry gypsum rich soils to the conventionaloven (600 C) water content because of the dehydrationcharacteristics of the material.
h. Peat may be successfully dried in the microwave system usingsoftware modified to prevent overheating.
i. Organic soils with loss on ignition contents up to about15 percent may be dried as inorganic clay with essentially noloss in water content accuracy.
j. Certain tropical soils (latosol soils rich in halloysite) maybe microwave energy resistant. Special software to dry suchsoils was prepared by modifying the existing software to applyhigher power levels during the last stage of microwave drying.
k. Adequate wet specimen mass must be used when drying soils ofhigh water content, either organic or inorganic.
1. Preliminary reports indicate thet the computer-controlledmicrowave system performs very satisfactorily at project sitesand field situations.
Raw data for all tests performed in this investigation are shown in
Appendix H.
Recommendation
106. From consideration of all data acquired during investigation of
microwave drying of soil, it may appear that more than rapid water content
information is available from the microwave oven s stem. This information, if
available, may be extremely useful to enhance monitoring of compacted earth
fills.
107. A material property probably as significant for proper compaction
control as water content is soil composition. If, for example, material for
pla':ement is being taken from a borrow area that consists of several soil
types occurring in layers of variable thickness, then compaction control is
made difficult because random and unavoidable mixing in the borrow area will
result in many soils with different optimum water contents. Under field
66
conditions where large volumes of soil are being placed, real-time water
content and soil compaction information are essential because if 24 hr or more
are required to determine that a layer/lift is unacceptable, then that layer
may be buried under several feet of subsequently placed and compacted material
when the determination is made. An automated method to precisely identify and
classify soil is needed because very often, soils with distinctly different
compositions and compaction characteristics will not be visually distinguish-
able from each other. While a very experienced inspector may be able to use
field visual classification techniques to visually identify similar materials
with distinctly different compaction characteristics, a less experienced
person may not recognize such differences, and problems with compaction will
result. In this period when the volume of earthwork being done by the USACE
has diminished, the probability of inspectors with less than desired
experience is growing, and the need for an automatic device to field classify
soils with respect to their compaction performance as a substitute for this
lack of experience is increasing.
108. The "family of curves" method was devised to deal with the problem
of variable soil composition with two-point compaction as a way to identify a
material in question and its compaction characteristics. However, the family
of curves method with two-point compaction may require several trial and error
compaction specimens for each material in question, and its use does not
always result in proper material and curve identification. Material
composition has been correlated with certain soil classification parameters
such as liquid limit and plasticity index, but these parameters are difficult
to obtain in the field, require long periods of time, and are labor intensive.
For example, the precise determination of a field water content may require
24 hr, but Atterberg limits to precisely identify and classify a material may
require several days. A quick and easy method to identify material com-
position in the field is needed. If the material composition can be iden-
tified, then its optimum water content can likely be determined from a "family
of curves" site calibration.
109. It appears highly likely that with certain hardware and software
modifications, it may be possible to obtain indices from soil microwave drying
characteristics which correlate to certain material classification properties,
such as Atterberg limits. For example, soils with different plasticity
indices appear to exhibit unique dehydration versus time and temperature
versus time "signatures." It is believed that features from these two
67
"signatures" may be mathematically isolated, identified, and correlated with
Atterberg limits.
110. Figure 13 shows the dehydration relationship of materials of dif-
ferent plasticity indices dried in the microwave oven. From this figure, the
different shapes may be seen along with the systematic variation in PI.
Probability is high that parameters may be devised to correlate curve change
with PI. Another dimension which may strengthen the correlation is the
quantification and correlation of the temperature versus time relationship.
For example, Figure 14 shows temperature rise with time for four materials, a
nonplastic sand (PI - 0 percent), two medium plasticity clays (PI - 48 and
54 percent), and a specimen of highly plastic montmorillonite
(PI - 643 percent). The temperature of the nonplastic sand appears to level
off rapidly with time as the conventional oven water content is reached.
Temperature of the two medium plasticity clays increases more sharply than
that of the sand as the conventional oven temperature is reached, but
temperature slope of the highly plastic montmorillonite is high and increasing
at an increasing rate as conventional oven water content is reached. The
indication is that there is a definite relationship between shape of the
temperature time curve and plasticity characteristics of the material under
test.
111. Modification of the microwave system to remotely sense (without
contact) specimen temperature would be necessary, and software modification to
analyze dehydration and temperature change data would be required as well.
However, if successful, estimates of Atterberg limits/material properties
would be output along with water content in real time.
112. Real-time material classification indices would significantly
enhance the capability to monitor compacted fill. For this reason, it will be
recommended that the microwave drying research be extended in the attempt to
identify material classification characteristics.
68

0
10
20 - SFBM P1=45
30 - AQUAGEL PI=643
040 -BBC P1=22
50-BANDING -
SAND
60
70 -SN
80
90
10 0 1--L I 10 10 20 30 40 50 60 70 80 90 100
t/t f, %0
Figure 13. Normalized water content versus time for
soils of different PT
69

240
200
160 _ _
0
0
120 LEGEND_
o EABPL GRAY CLAYo LONG. LAKE CLAY
40 A MONTMORILLUONITE0*E.*,A CONVENTIONAL OVEN WATER CONTENT
0 _ _
100
W 00
~60
zU- 40_____ ____ __ _ _
U.0
Ir 20
00 200 400 600 800 1,000 1,200 1,400 1,600
TIME IN OVEN, SECFigure 14. Water content and temperature versus time in
microwave oven (from Gilbert 1974)
70

REFERENCES
American Society for Testing and Materials. 1983. "The Chemistry andTechnology of Gypsum," STP 861, R. A. Kuntze, editor, pp 48-56.
. 1988. "Standard Method for Laboratory Determination of Water(Moisture) Content of Soil, Rock, and Soil Aggregate Mixtures," D2216-8.
Gilbert, P. A. 1974 (Aug). "Feasibility Study - Microwave Oven Used forRapid Determination of Water Contents, Evaluation of Soil Mechanics Equip-ment," Report 13, US Army Engineer Waterways Experiment Station, Vicksburg,MS.
. 1988 (Nov). "Computer Controlled Microwave Oven System for RapidWater Content Determination," Technical Report GL-88-21, US Army EngineerWaterways Experiment Station, Vicksburg, MS.
Grim, R. E. 1968. Clay Mineralogy, McGraw-Hill Book Company, New York,pp 522.
Hansen, W. C., and Offutt, J. S. 1969. "Gypsum and Anhydrite in PortlandCement," United States Gypsum, Chicago, IL,
Mitchell, J. K. 1976. Fundamentals of Soil Behavior, John Wiley and Sons,Inc., New York.
Nutting, P. C. 1943. "Some Standard Thermal Dehydration Curves of Minerals,"Professional Paper 197-E, United States Department of the Interior, UnitedStates Printing Office, Washington, DC.
Phillips, Bruce R, 1986 (Sep). "Geotechnical Investigation for Direct Courseand Related Events, Report 2," Technical Report SL-86-18, US Army EngineerWaterways Experiment Station, Vicksburg, MS.
Strohm, W. E., Jr., and Torrey, V. H., III. 1982 (Mar). "Analysis of FieldCompaction Data, DeGray Dam, Caddo River, Arkansas," Miscellaneous PaperGL-82-4, US Army Engineer Waterways Experiment Station, Vicksburg, MS.
Tateishi, H. 1967 (Jul). "Basic Engineering Characteristics of High-MoistureTropical Soils," Proceedings of the WASHO Conference, 12 July 1967, Honolulu,HI.
Troxell, G. E., and Davis, H. E. 1956. Composition and Properties ofConcrete, McGraw-Hill Book Company, Inc., New York.
US Army Engineer Waterways Experiment Station. 1955 (Feb). "Tests on anAbsorptive Aggregate to Study Effect of Absorption and Gradation on Voids inCompacted Bituminous Paving Mix," Miscellaneous Paper No. 4-118, Vicksburg,MS.
_ _ .1956 (Feb). "Cooperative Study of Bulk Impregnated SpecificGravels," Miscellaneous Paper No. 4-152, Vicksburg, MS.
1960 (Apr). Technical Memorandum No. 3-357, Vicksburg, MS.
US Army Corps of Engineers. 1970 (Nov). "Laboratory Soil Testing," EM 1110-2-1906, Washington, DC.
71

1
APPENDIX A
DATA FROM YATESVILLE LAKE PROJECT
AND GALLIPOLIS LOCK SYSTEM

Table Al
Water Content Comparison Data from Yatesville Lake
Proj ec t
Microwave Water Conventional Oven Predicted WaterContent Water Content Content
(%) (%) (%)
15.21 15.70 15.3313.32 13.26 13.4415.58 15.62 15.6914.14 14.14 14.2615.69 15.43 15.8013.43 13.36 13.5512.97 13.36 13.1010.76 10.89 10.9019.32 19.30 19.4124.68 24.51 24.7414.75 14.97 14.8713.28 13.58 13.4013.26 13.12 13.3815.03 15.39 15.1414.90 15.10 15.0219.23 19.35 19.3215.36 14.90 15.4712.04 12.07 12.1715.06 14.60 15.1711.76 11.74 11.8915.99 16.30 16.1012.98 13.00 13.1118.62 19.20 18.7213.31 13.21 13.4318.41 18.20 18.5113.67 13.70 13.7915.79 16.10 15.9011.84 11.50 11.9717.75 18.00 17.8514.62 14.90 14.7411.62 11.40 11.7514.97 15.20 15.0912.27 12.20 12.4012.25 12.40 12.3811.73 11.60 11.8611.04 11.20 11.1810.87 11.10 11.0116.23 16.10 16.3413.76 13.70 13.8812.43 12.47 12.5613.02 13.11 13.1516.62 17.09 16.73
(Continued)
A-3

Table Al (Continued)
Microwave Water Conventional Oven Predicted WaterContent Water Content Content
(%) (%) (%)
17.06 17.29 17.1616.14 15.93 16.2515.34 15.51 15.4514.96 14.88 15.0814.28 14.28 14.4014.15 14.23 14.2712.07 12.09 12.2018.93 18.83 19.0216.92 16.91 17.0218.04 18.07 18.1417.41 17.42 17.5114.20 14.30 14.3211.11 11.36 11.2517.73 18.17 17.8315.65 15.65 15.7616.49 16.90 16.6014.28 14.25 14.4015.53 15.94 15.6413.73 13.72 13.8512.77 12.98 12.9012.78 13.02 12.9116.31 16.29 16.4213.04 12.89 13.1715.33 15.57 15.4413.25 13.45 13.3715.39 16.01 15.5012.52 12.58 12.6512.12 12.20 12.2510.85 11.10 10.9914.45 14.58 14.5712.66 12.83 12.7921.19 21.26 21.2718.11 18.59 18.2117.88 19.10 17.9817.64 17.90 17.7417.20 17.90 17.3014.40 14.67 14.5222.60 22.71 22.6819.69 19.57 19.7820.13 20.65 20.2217.88 17.98 17.9822.08 22.35 22.1617.89 17.92 17.99
(Continued)
A-4

Table Al (Continued)
Microwave Water Conventional Oven Predicted WaterContent Water Content Content
(%) (%) (%)20.45 20.44 20.5416.47 16.44 16.5817.57 17.52 17.6714.17 14.43 14.2917.24 17.21 17.3415.11 15.19 15.2217.06 17.46 17.1613.90 14.13 14.0218.20 18.29 18.3013.54 13.62 13.6616.04 16.34 16.1513.79 13.97 13.9120.08 20.48 20.1718.03 18.03 18.1317.33 17.86 17.4314.49 14.62 14.6120.59 20.79 20.6816.80 16.97 16.9113.09 13.17 13.2112.83 12.80 12.965.91 6.03 6.0719.42 19.30 19.5116.68 16.78 16.7915.86 16.34 15.9713.91 14.12 14.0317.72 17.79 17.8215.42 15.62 J5.536.33 6.43 6.495.02 5.07 5.195.02 5.17 5.1917.81 18.25 17.9115.52 15.82 15.6315.68 16.00 15.7913.49 13.88 13.616.61 7.00 6.7717.24 17.81 17.3415.54 15.59 15.65
11.55 11.20 11.6815.34 15.67 15.4515.17 15.28 15.285.93 6.17 6.0914.70 14.99 14.8219.32 19.29 19.41
14.64 14.57 14.76
(Continued)
A-5

Table Al (Continued)
Microwave Water Conventional Oven Predicted WaterContent Water Content Content
(%) (%) (%)
5.53 5.79 5.6916.98 17.50 17.0815.56 15.31 15.6718.53 18.66 18.6316.31 16.33 16.4220.23 20.59 20.3218.47 18.61 18.575.40 5.40 5.575.23 5.70 5.40
15.46 15.55 15.5715.27 15.34 15.384.15 4.16 4.33
16.79 16.82 16.9015.34 15.33 15.4514.37 14.29 14.4912.71 12.74 12.8416.61 17.30 16.7215.58 15.56 15.694.32 4.46 4.495.66 5.79 5.8216.51 16.69 16.6214.19 14.19 14.316.56 6.59 6.7215.48 16.06 15.5915.50 15.63 15.6115.42 15.75 15.5313.67 13.95 13.795.29 5.50 5.4615.99 15.88 16.1014.25 14.22 14.3717.38 17.14 17.4814.24 14.38 14.364.53 4.39 4.704.93 5.21 5.105.37 5.08 5.54
13.94 13.82 14.0613.86 13.88 13.9814.00 15.00 14.1213.80 13.88 13.9215.64 15.78 15.7514.75 14.75 14.873.71 3.80 3.88
22.79 22.94 22.8619.96 19.73 20.055.31 5.48 5.48
(Continued)
A-6

Table Al (Continued)
Microwave Water Conventional Oven Predicted Water
Content Water Content Content
(%) (%) (%)
18.55 18.77 18.65
17.39 17.35 17.49
19.08 19.02 19.17
14.99 15.07 15.10
16.87 17.02 16.98
16.26 16.47 16.374.78 4.82 4.95
18.16 18.83 18.2613.22 13.46 13.3415.24 15.23 15.3513.16 13.36 13.28
16.09 17.00 16.2014.41 14.61 14.53
5.10 5.15 5.27
3.72 4.09 3.89
14.70 14.80 14.82
14.69 14.65 14.81
15.38 15.73 15.49
15.85 15.93 15.96
15.16 15.26 15.27
14.36 14.19 14.484.04 4.12 4.21
18.96 18.87 19.0517.45 17.53 17.555.15 5.17 5.32
20.82 21.01 20.9017.52 17.65 17.62
18.78 18.87 18.88
15.43 15.51 15.54
19.04 10.36 19.1318.59 18.52 18.69
6.63 6.68 6.79
19.23 19.78 19.32
14.80 14.83 14.925.08 5.20 5.2515.92 16.03 16.0314.19 14.31 14.31
20.64 20.70 20.7318.37 18.55 18.475.93 6.07 6.09
16.20 16.72 16.31
14.64 15.19 14.76
20.11 20.74 20.20
17.49 17.41 17.59
8.10 8.30 8.25
(Continued)
A-7

Table Al (Continued)
Microwave Water Conventional Oven Predicted WaterContent Water Content Content
(%) (%) (%)
17.04 17.30 17.1416.36 16.32 16.4716.94 16.60 17.0417.51 17.62 17.615.71 5.83 5.8716.16 16.37 16.2714.45 14.42 14.5716.28 15.91 16.3914.48 14.67 14.604.60 4.50 4.7716.55 16.73 16.6614.49 14.41 14.6115.97 16.04 16.0814.07 14.61 14.196.05 6.12 6.21
17.82 18.09 17.9217.25 17.20 17.3516.50 16.54 16.6114.64 14.91 14.764.85 4.87 5.02
17.14 17.13 17.2413.59 14.20 13.716.50 6.76 6.66
18.48 18.13 18.5814.56 14.58 14.685.87 5.99 6.0314.26 14.37 14.3813.86 13.84 13.9814.70 14.91 14.8212.99 12.99 13.125.59 5.75 5.75
14.35 14.53 14.4713.28 13.30 13.4014.97 14.78 15.0913.38 13.88 13.505.57 5.63 5.73
13.39 13.53 13.5113.77 13.79 13.8914.12 14.38 14.2411.53 11.59 11.665.81 5.59 5.9713.98 14.14 14.1014.05 14.08 14.175.27 5.34 5.44
13.86 14.57 13.98
(Continued)
A-8

Table Al (Continued)Microwave Water Conventional Oven Predicted Water
Content Water Content Content(%) (%) (%)12.60 12.86 12.7314.20 14.13 14.3211.99 12.09 12.1213.14 13.40 13.2612.63 12.77 12.7615.76 15.67 15.8714.75 14.98 14.876.08 6.15 6.2416.00 16.38 16.1114.66 14.82 14.7813.24 13.93 13.3612.30 12.66 12.435,76 5.86 5.9213.86 13.88 13.9812.61 13.02 12.7415.55 15.73 15.6613.58 13.57 13.706.33 6.42 6.4914.24 14.33 14.3612,34 12.48 12.474.97 5.16 5.1413.35 14.03 13.4711.87 12.16 12.004.33 4.49 4.5012.74 12.89 12.8711.96 12.15 12.0914.06 14.50 14.1812.23 12.23 12.3613.28 14.24 13.4011.75 12.08 11.885.52 5.57 5.686.46 6.49 6.6212.93 13.58 13.0612.12 12.45 12.255.64 5.94 5.8014.97 14.97 15.0912.71 12.79 12.8411.77 12.16 11.9012.25 12.57 12.3812.79 13.33 12.9212.52 12.71 12.6516.04 15.85 16.1513.78 13.88 13.905.38 5.56 5.5512.31 12.77 12.44
(Continued)
A-9

Table Al (Continued)
Microwave Water Conventional Oven Predicted WaterContent Water Content Content
(%) (%) (%)11.19 11.72 11.3213.51 14.00 13.6312.33 12.42 12.464.33 4.35 4.50
15.96 15.99 16.0714.39 14.33 14.5114.53 15.00 14.6513.00 13.12 13.1313.65 14.88 13.7713.27 13.48 13.396.60 6.53 6.765.22 5.33 5.39
14.87 15.40 14.9913.36 13.42 13.4813.79 14.46 13.9113.03 13.12 13.166.41 6.79 6.57
14.19 14.67 14.3113.36 13.62 13.4815.67 15.68 15.7813.34 13.32 13.464.77 4.89 4.9413.66 13.66 13.7811.98 12.14 12.1113.97 14.07 14.0912.25 12.27 12.3816.00 16.45 16.1114.17 14.22 14.295.18 5.30 5.35
15.58 16.30 15.6914.23 14.41 14.3512.81 12.91 12.9418.42 17.22 18.526.15 6.36 6.314.85 4.86 5.026.07 6.30 6.23
18.80 18.70 18.9016.89 16.93 17.004.59 4.78 4.76
15.66 15.71 15.7713.37 13.53 13.4914.29 14.08 14.4112.99 13.08 13.124.47 4.77 4.6415.22 15.44 15.33
(Continued)
A-10

Table Al (Concluded)
Microwave Water Conventional Oven Predicted WaterContent Water Content Content
(%) (%) (%)14.31 14.36 14.435.44 5.56 5.60
17.00 17.03 17.1015.33 15.06 15.445.30 5.47 5.47
15.91 16.09 16.0213.00 13.13 13.135.30 5.20 5.4715.56 16.33 15.6713.87 13.92 13.994.98 4.98 5.15
14.72 15.77 14.8414.01 14.47 14.1316.09 16.21 16.2015.00 15.52 15.11
A-I1

Table A2
Water Content Comparison Data from Gallipolis Lock
Repair
Microwave Water Conventional Oven Predicted WaterContent Water Content Content
(%) (%) (%)
13.40 13.90 13.5912.80 13.30 12.9910.70 11.10 10.9114.90 15.40 15.0815.20 14.90 15.3712.60 12.40 12.7919.80 19.90 19.9419.00 19.50 19.1516.30 16.70 16.4714.60 14.70 14.7814.50 15.10 14.6816.10 16.60 16.2713.70 13.60 13.8.12.20 12.60 12.4014.00 14.60 14.1816.00 16.40 16.1714.70 15.10 14.8812.80 13.00 12.9914.60 15.00 14.7814.40 14.70 14.5812.00 12.50 12.2013.40 13.90 13.5912.80 13.30 12.9910.70 11.10 10.9114.90 15.40 15.0815.00 15.20 15.1812.40 12.60 12.5913.00 13.30 13.1914.90 15.10 15.0817.40 17.80 17.5616.90 17.10 17.0614.40 14.40 14.5811.90 12.20 12.1011.50 11.80 11.7013.40 13.90 13.5917.40 17.50 17.5616.20 16.80 16.3718.70 18.90 18.8515.-0 15.80 15.8713.90 14.30 14.0816.10 16.50 16.2714.90 15.00 15.0812.70 13.00 12.8923.00 23.70 23.1217.90 18.80 18.06
(Continued)
A-12

Table A2 (Continued)
Microwave Water Conventional Oven Predicted WaterContent Water Content Content
(%) (%) (%)18.30 18.80 18.4519.50 19.50 19.6517.80 18.20 17.9619.30 19.50 19.4518.70 18.50 18.8517.30 17.30 17.4616.60 16.40 16.7615.50 15.30 15.6715.20 15.60 15.3716.20 16.70 16.3718.90 18.60 19.0522.40 22.30 22.5321.10 21.50 21.2318.20 18.30 18.3520.70 21.20 20.8423.10 23.90 23.2217.80 18.10 17.9618.00 18.20 18.1618.00 17.50 18.1615.50 15.60 15.6723.30 23.60 23.4219.80 20.00 19.9423.00 22.90 23.1220.60 20.00 20.7418.00 18.10 18.1616.40 16.60 16.5717.40 17.70 17.5617.90 17.90 18.0619.00 19.40 19.1513.50 13.70 13.6913.40 13.70 13.5913.30 13.80 13.4911.10 11.40 11.3015.30 15.30 15.4713.30 13.60 13.4911.70 11.80 11.9014.40 14.20 14.5813.70 14.00 13.8815.20 15.50 15.3716.80 16.60 16.9615.60 16.10 15.7713.80 14.00 13.9813.30 13.30 13.4913.20 13.30 13.3914.30 14.50 14.48
(Continued)
A-13

Table A2 (Continued)
Microwave Water Conventional Oven Predicted WaterContent Water Content Content
(%) (%) (%)13.90 13.70 14.0813.40 13.60 13.5915.40 15.50 15.5714.60 14.70 14.7815.00 15.20 15.1814.30 14.50 14.48J1.70 11.80 11.9016.40 16.30 16.5716.70 16.90 16.8615.30 15.50 15.4717.20 17.00 17.3615.50 15.80 15.6714.40 14.40 14.5812.90 12.80 13.0912.70 12.90 12.8914.50 14.80 14.6815.50 15.70 15.6715.00 15.50 15.1813.00 13.40 13.1913.70 13.70 13.8813.40 13.60 13.5916.10 16.20 16.2716.00 15.60 16.1714.70 14.90 14.8813.20 13.40 13.3917.50 17.30 17.6616.70 16.90 16.8615.40 15.60 15.5715.50 15.70 15.6714.00 14.30 14.1812.50 12.80 12.6915.00 14.70 15.1814.00 14.20 14.1812.00 12,20 12.2015.60 15.70 15.7714.90 14.80 15.0812.80 12.60 12.9915.00 15.*60 15.1814.30 14.80 14.4812.40 12.20 12.5918.50 17.80 18.6516.90 17.10 17.0615.50 15.90 15.6711.90 11.70 12.1011.60 11.80 11.80
(Continued)
A-14

Table A2 (Continued)
Microwave Water Conventional Oven Predicted WaterContent Water Content Content
(%) (%) (%)
14.00 14.30 14.1814.20 14.50 14.3813.70 13.90 13.8814.90 15.10 15.0816.20 16.50 16.3715.00 15.50 15.1813.50 13.90 13.6912.50 12.80 12.6914.30 14.60 14.4813.20 14.00 13.3919.50 19.40 19.6517.70 18.20 17.8615.30 15.50 15.4714.90 14.60 15.0814.60 14.70 14.7812.40 12.10 12.5916.80 17.10 16.9612.40 12.90 12.5914.80 15.60 14.9819.10 19.80 19.2519.40 19.70 19.5517.30 17.10 17.4616.20 15.70 16.3715.80 16.30 15.9713.00 13.40 13.1915.80 15.80 15.9716.30 16.80 16.4714.30 14.50 14.4814.70 15.30 14.8813.90 14.00 14.0811.80 12.00 12.0014.60 14.40 14.7815.70 15.70 15.8713.20 13.40 13.3914.40 13.80 14.5813.40 13.90 13.5911.50 12.10 11.7013.70 14.20 13.8813.80 14.10 13.9812.00 12.40 12.2014.40 14.70 14.5812.80 13.20 12.9916.70 16.30 16.8614.20 14.40 14.3812.10 12.60 12.30
(Continued)
A-15

Table A2 (Continued)
Microwave Water Conventional Oven Predicted WaterContent Water Content Content
(%) (M) (%)
17.50 18.10 17.6614.50 14.80 14.6812.50 12.40 12.6915.10 15.30 15.2814.30 14.50 14.4812.10 12.50 12.3015.10 15.50 15.2814.20 14.00 14.3812.70 12.90 12.8922.20 22.60 22.3319.60 19.50 19.7418.20 18.40 18.3514.60 13.90 14.7813.40 13.50 13.E9f 11.00 10.80 11.2016.80 17.20 16.9615.50 15.70 15.6713.70 13.80 13.8815.30 15.50 15.4713.90 13.20 14.0812.90 12.80 13.0914.30 14.90 14.4813.90 14.00 14.0811.60 11.70 11.8018.60 18.60 18.7518.20 18.20 18.3515.60 16.90 15.7716.30 16.00 16.4714.40 14.60 14.5811.90 11.80 12.1016.90 16.90 17.0613.30 13.30 13.4911.20 11.50 11.40
16.50 16.40 16.6715.50 15.70 15.6713.30 13.40 13.49
17.10 17.60 17.2614.80 15.00 14.9812.40 12.50 12.5915.80 16.00 15.9715.50 15.80 15.6713.20 13.10 13.3915.90 16.20 16.0716.50 16.60 16.6713.80 13.80 13.98
(Continued)
A-16
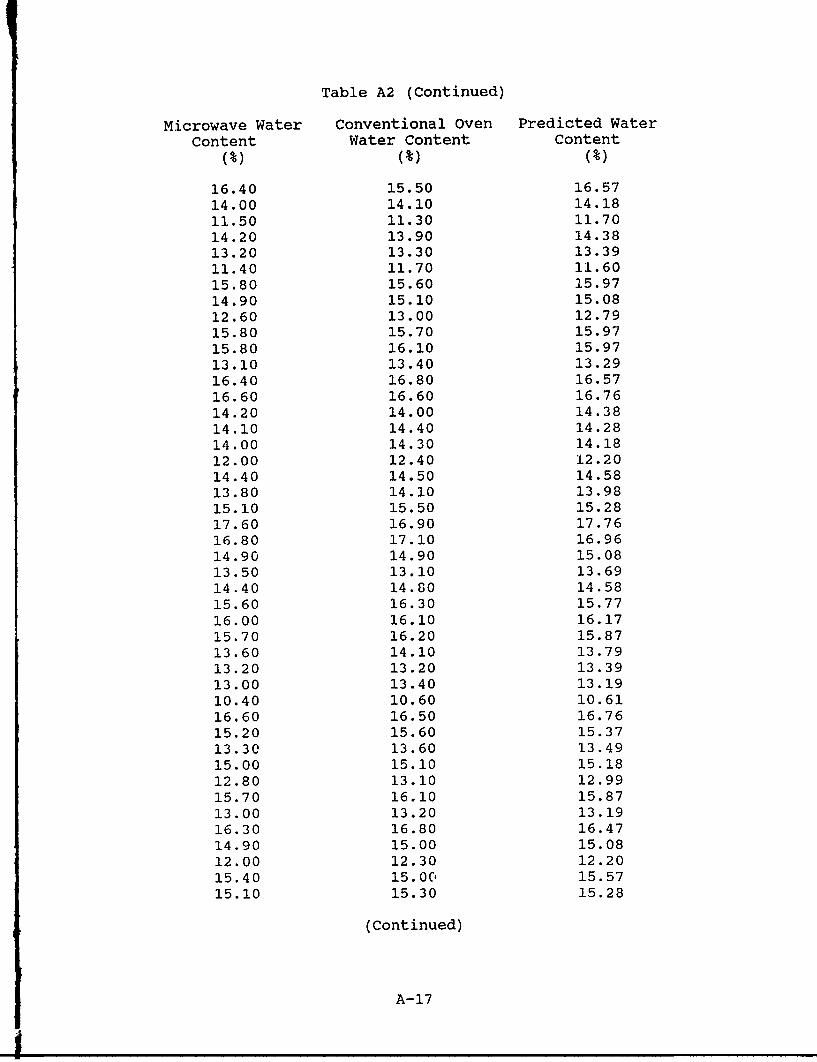
Table A2 (Continued)
Microwave Water Conventional Oven Predicted WaterContent Water Content Content
(%) (%) (%)
16.40 15.50 16.5714.00 14.10 14.1811.50 11.30 11.7014.20 13.90 14.3813.20 13.30 13.3911.40 11.70 11.6015.80 15.60 15.9714.90 15.10 15.0812.60 13.00 12.7915.80 15.70 15.9715.80 16.10 15.9713.10 13.40 13.2916.40 16.80 16.5716.60 16.60 16.7614.20 14.00 14.3814.10 14.40 14.2814.00 14.30 14.1812.00 12.40 12.2014.40 14.50 14.5813.80 14.10 13.9815.10 15.50 15.2817.60 16.90 17.7616.80 17.10 16.9614.90 14.90 15.0813.50 13.10 13.6914.40 14.80 14.5815.60 16.30 15.7716.00 16.10 16.1715.70 16.20 15.8713.60 14.10 13.7913.20 13.20 13.3913.00 13.40 13.1910.40 10.60 10.6116.60 16.50 16.7615.20 15.60 15.3713.30 13.60 13.4915.00 15.10 15.1812.80 13.10 12.9915.70 16.10 15.8713.00 13.20 13.1916.30 16.80 16.4714.90 15.00 15.0812.00 12.30 12.2015.40 15.00 15.5715.10 15.30 15.28
(Continued)
A-17

Table A2 (Concluded)
Microwave Water Conventional Oven Predicted Water
Content Water Content Content
(%) (%) (%)
12.90 12.40 13.09
14.40 14.70 14.58
14.20 14.20 14.38
11.90 11.30 12.10
14.20 14.00 14.38
13.40 13.90 13.59
11.80 11.90 12.00
14.00 14.50 14.18
12.10 12.60 12.30
15.10 15.00 15.28
13.70 14.00 13.88
11.20 11.60 11.40
14.40 14.30 14.58
14.00 13.90 14.18
11.40 11.90 11.60
17.70 17.80 17.86
16.10 16.40 16.27
13.80 14.20 13.98
13.90 13.70 14.08
14.60 14.90 14.78
13.10 13.30 13.29
11.20 11.70 11.40
16.20 16.50 16.37
14.60 14.90 14.78
12.20 12.60 12.40
12.60 12.90 12.79
13.90 14.20 14.08
14.40 14.60 14.58
15.30 15.50 15.47
14.60 14.80 14.78
12.00 12.20 12.20
A-18

APPENDIX B
EVALUATION OF US ARMY ENGINEER WATERWAYSEXPERIMENT STATION MICROWAVE OVEN SYSTEM
BY YATESVILLE LAKE PROJECT PERSONNEL

4
CEORH-CD-YBC19 September 1988
SUBJECT: Using a Microwave Oven to Measure Soil Moisture at Yatesville LakeProject
I. Background. From 28 April to 9 September 1988, a microwave oven wasused to measure the moisture content of soil at the Yatesville Lake Project.At the same time, a conventional oven was used to determine field and one-point moisture content. Throughout this experiment, the microwave wasdesignated the "rapid moisture-detection device," while the conventionaloven remained the primary method of field control for determining moistureand dry density.
2. Subjective Evaluation. A comparative statistical analysis of theresults of this experiment is being conducted by WES. The impression ofthose who used the microwave method, however, is that it proved to be anadequate field control for both pervious and impervious material. Thedifferences in the results obtained using the microwave and the conventionaloven appear to be within the tolerance normally associated with smallvariations between samples. Such variation- appear to be more pronounced inrocky or shaley material because it's difficult to select identical sampleswith respect to rock content. With-respect to clean sand, however, testresults suggest that there is virtually no difference between the microwaveand conventional-oven methods. Except for obvious errors, discussed below,the difference between these methods was generally less than 0.5 percent.
3. Problem Areas. During the early tests it was noticed that themicrowave's breakers stayed cool while the soil sample was being heated.Because of this difference in temperature, moisture condensed on the tall,vertical sides of the beaker and was visible even though the computerindicated that the sample and beaker were oven-dry. This problem was solvedby using shallow dishes with sloping sides as sample containers.
For reasons that remain unexplained, the system occasionally loses track ofthe moisture content. When this happens the error is easily detected andthe results easily corrected, and so construction work isn't significantlyaffected. Similar problems with another prototype in operation atGallipolis were traced to a loose pedestal mount, but "i check of the unit atYatesville showed that the pedestal mount was secure. The dusty conditionsfound at any soils lab, including the lab at Yatesvillc, are now thought tobe the predominant cause.
A third problem area concerns the retention, during testing, of materialscontaining shale particles. Occasionally these particles exploded with aforce sufficient to eject portions of sample from the sample container.Tests were salvaged by carefully sweeping the loose particles from the

microwave and weighing the recovered sample. However, this isn't considered
an appropriate solution.
4. Recommendations
a. Recommended Sample Size. Because our experienced materialstechnician determined that the recommended 100- to 200-gram sample size wastoo small, the sample size was increased to about 500 grams. Subsequenttesting confirmed that a sample this size reduces the errors associated withobtaining a representative sample--particularly in rocky material. Wetherefore recommend adoption of the 500-gram sample size as the newrecommemded size for tests using microwave methods.
b. Preparation and Sample Selection. As in any sample selection, thesampling process itself must be performed carefully. Accordingly, to ensureaccurate results using a microwave, prepare one-point and field materialproperly using appropriate methods for selecting representative samples.
c. Dust-Proofing. Dust-proof microwave components to ensure reliablelong-term operation.
d. Modifications or Additions. Suitably modify or supplement thesample container, or perhaps provide a "shale cycle" at reduced power, toeither preclude or effectively contain exploding shale particles.
KENNETH E. ~1 EM MResident Engineer

APPENDIX C
DEHYDRATION CHARACTERISTIC TABLES OF SOME MINERALS

Table Cl
Weight Ratios for Materials Showing Slight
Variations at Different Temperatures
Tempera-ture, OQ - Q S A M R D L
50 1.00544 1.0560 1.0408 1.2020 1.0832 1.0825 1.1690100 1.00468 1.0415 1.0375 1.1666 1.0458 1.0475 1.1332150 1.00402 1.0341 1.0290 1.1356 1.0388 1.0406 1.1150200 1.00345 1.0297 1.0161 1.1100 1.0333 1.0356 1.1024300 1.00251 1.0215 1 0077 1.0730 1.0283 1.0272 1.0816
400 1.00180 1.0135 1.0039 1.0484 1.0242 1.0192 1.0620500 1.00120 1.0058 1.0020 1.0260 1.0122 1.0110 1.0420600 1.00072 1.0021 1.0009 1.0160 1.0076 1.0050 1.0220700 1.00032 1.0006 1.0003 1.0080 1.0045 1.0021 1.0116
Note: Q - Powdered quartz and felspar, anhydrous crystalline-minerals.S = Amorphous silica, dried silica gel.A - Volcanic ash, amorphous glasses.M A-,iorphous material having the composition of montmorillonite.R - Isotropi silica resolve remaining after extraction of bases from
bentonite,D - Diatoms.L - Synthetic magnesium silicate, "Magnesol."

Table C2
Weight Ratios for Hydrous Oxides and Zeolites
Tempera- Ature A2 H H2 0 S T C P
50 1,365 1.575 1.277 1.530 1.0871 1.1790 1.1686 1.265 1.1972100 1.268 1.430 1.236 1.422 1.0813 1.1535 1.1200 1.226 1.1797150 1.203 1,354 1.217 1.321 1.0615 1.1424 1.0795 1.163 1.1160200 1.168 1.303 1.199 1.244 1.0393 1.1332 1.0582 1.114 1.0965300 1.103 1.233 1.163 1.150 1.0130 1.1030 1.0374 1.062 1.0596
400 1.0610 1.167 1.095 1.086 1.0058 1.0700 1.0272 1.0341 1.0315500 1.0242 1.131 1.028 1.047 1.0039 1.0507 1.0183 1.0164 1.0240600 1.0150 1.025 1.015 1.023 1.0027 1.0370 1.0100 1.0056 1.0220700 1.0052 1.003 1.005 1.008 1.0011 1.0166 1.0038 1.0000 1.0010
Note: A,, A2 - Allophanes (from Kentucky).
H1 , H2 - Aluminum Hydroxide.
0 - Mexican Opal.S - Sepiolite (from Asia minor).T - Ptilolite (from Utah).
C - Chabazite (from Oregon).P - Phillipsite (from Victoria, Australia).

Table C3
Weight Ratios for Hydrous Oxides and Related Silicates
Tempera- Ature, °C G D L T B I R F
50 1.089 1.545 1.167 1.134 1.122 1.465 1.0765 1.1010 1.1035100 1.086 1.529 -- 1.128 -- -- 1.0552 1.0736 1.1035150 1.083 1.525 -- 1.120 1.115 -- 1.0413 1.0684 1.1035200 1.077 1.345 1.165 1.096 1.112 1.460 1.0354 1.0674 1.1035250 1.069 1.150 -- 1.040 1.100 1.458 1.0317 1.0684 1.1035
300 1.055 1.105 -- 1.014 1.050 1.430 1.0275 1.0684 1.1010350 1.031 1.090 1.163 1.008 1.015 1.080 1.0080 1.0660 1.0712400 1.014 1.084 1.162 -- 1.010 1.030 1.0042 1.0544 1.0408450 1.006 1.079 1.160 1.004 -- -- 1.0038 1.0250 1.0245500 1.003 1.027 1.015 1.002 -- 1.010 1.0030 1.0064 1.0142600 1.001 1.003 1.005 -- l.04 -- 1.0019 1.0002 1.0033
Note: A, - Analcime (from Wyoming).G - Gibbsite.D - Diaspore (from Rolla, Missouri).L - Limonite (from Avery, North Carolina).,T - Geothite.B - Brucite (from Nevada),I - Inesite (from Quinault, Washington).R - Rectorite (from Hot springs, Arkansas).1 - Dufrenite (from Cherokee County, Alabama).

P40 - t t4 z?4 4 1 - I 4f Cj. 4- %,oN '.L 4 0
040
P4 C
poc c r-CY r- 4 - . U- - ' 0 - . 0
Ci r- 4r4 -4HH H! H- - 0 0 0 0
4444 4 .01 t 4 %D (4 -4 H- Ln HD 0t HH4 t'AH -- 4 t- H H H H 0 0 0
4)
-4V ))V H raa ON %. r-- % c HY H Ln m. CI0 0 %D) %' 0 1 u~) tCu~ l 0 Cli 0 \J H 0 0
ca 0- - -H -4H-4 A H r- 0 0 0 0 0 0
a) 04 4- )
E- 4) L trH''0 N '.oc %0 %0 %D Ln 4n4 0 - -.,- . U -4HHH4 H H 0 00 0 0 0 0D 0
0)
4. C.$4rcJ. 0 'L ~ 0 .
In4 11 1'' 0. r n 4 U-) H4 H HJ 00 WIV -4O -4H-HH0-4 -4- 0 0 0 0 0 0 co0
0ciic oN) 0'. r, H0 4, (ON r ' -4 ~ (4p
V) '.oo'o.o ) 4 r-4 C)iH 0 0 4 dH) r- HHHH H- H 4 0 00C 00 0u
HHHH HY HN 0 0n (Y 'D m m 4 0 0 0.4
HHHHH~* Hr HO Hr. -r)1- -4 -4 U C
cice~jiin ci .0 ' a 4 N L4 000 .~4
< r HHHHHLr 00 0 00 000 0
in 4 ia n N4H 0 0 0 0 -r-4 4
4 HHHH 001 r l)- 0 0 0 0 00pppppp
r-HH4H-4HOl 0 0 0 0 0 000 44 444 44 4
92) 00000 in) 0 in) 0 V) 000 0OOO) O 0 i n NO N% inN 0- in 0 4
a p r- 4 4 in in in in '0 .0 N0

Table C5
Weight Ratios for Montmorjllonites
Tempera-ture_ S C B Y T U 0 F
100 1.0860 1.0483 1.0552 1.0492 1.1090 1.0635 1.0555 1.1290200 1.0610 1.0449 1.0408 1.0449 1.0815 1.0585 1.0470 1.0870300 1.0555 1.0437 1.0380 1.0424 1.0784 1.0551 1.0408 1.0555400 1.0500 1.0426 1.0356 1.0398 1.0753 1.0518 1.0348 1.0316
500 1.0444 1.0411 1.0326 1.0372 1.0715 1.0484 1.0234 1.0154550 1.0395 1.0340 1.0243 1.0320 1.0650 1.0462 1.0108 1.0118600 1.0225 1.0122 1.0122 1.0130 1.0400 1.0316 1.0058 1.0092700 1.0014 1.0015 1.0020 1.0013 1.0030 1.0020 1.0020 1.0045
Note: S - Pure bentonitic montmorillonite (from Polksville, Mississippi).C - High potash bentonite (from Suifu, China).B - High potash bentonite (from High Bridge, Kentucky).Y.- High sodium bentonite (from Upton, Wyoming).
T - Bentonite (from Whitewright, Texas).U - Bentonite (fropm Upton, Utah).0 - Fuller's Earth (from Olmstead, Illinois).F - Fuller's Earth (from Florida).

Table C6
Weight Ratios for the Montmorillonite Group
Tempera-ture, °C B C R N H I T
50 1.148 1.145 1.182 1.1.86 1.188 1.083 1.113100 1.120 1.134 1.139 1.080 1.174 1.069 1.085150 1.107 1.12' 1.1.3 1.059 1.169 1.065 1.077200 1.100 1.119 1.117 1.053 1.166 1.062 1.070300 1.093 1.105 1.109 1.048 1.157 1.056 1.070350 1.089 1.097 1.104 1.046 1.151 1.050 1.069
400 1.084 1.090 1.096 1.039 1.145 1.034 1.067450 1.067 1.083 1.072 1.017 1.138 1.019 1.065500 1.036 1.064 1.029 1.009 1.029 1.010 1.061550 1.020 1.034 1.017 1.006 1.C17 1.005 1.055600 1.011 1.018 1.011 1.003 1.01.1 1.002 1.045700 1.003 1.004 1.003 1.000 1.003 1.000 1.011
Note: B - Beidellite (from Pontotoc, Mississippi),G - Beidellite (from West Chester, Pennsylvania),R - Beidellite (from Utah).N - Nontronite (from Santa Rita, New Mexico).H - Halloysite (from Liege, Belgium).I -. Illite.T - Saponite (from Hector, California).

Table C7
Weight Ratios for Chlorites and Related Silicates
Tempera-ture, °G L N C P K V G
50 1.196 1.168 1.151 1.142 1.133 1.14. 1.107 1.068l00 1.188 1.165 1.150 1.139 1.130 1.121 1.074 1.048150 1.184 1.164 1.149 1.138 1.128 1.114 1.062 1.048200 1.181 1.163 1.148 1.137 1.127 1.085 1.058 1.045300 1.178 1.161 1.146 1.136 1.125 1.077 1.052 1.042400 1.175 1.159 1.145 1.134 1.122 1.054 1.050 1.033
500 1.172 1.158 1.140 1.132 1.120 1.025 1.030 1.015550 1.170 1.152 1.066 1.080 1.119 1.020 1.033 1.009600 1.161 1.074 1.033 1.069 1.060 1.015 1.027 1.005650 1.080 1.064 1.030 1.059 1.012 1.006 1.022 1.002700 1.015 1.058 1.027 1.047 1.003 1.001 1.020 1.000800 1.000 1.043 1.013 1.017 1.000 1.000 1.010 1.000
Note: S - Serpentine.L - Clinochlore (from Chester County, Pennsylvania).
N - Penninite (from Paradise Range, Nevada).C = Chlorite (from Danville, Virginia).P - Picrolite (from Baltimore, Maryland).K - Paligorskite )from Mcntana).V = Vermiculite (from North Carolina).G - Glauconite (from Lyons Wharf, Maryland).

Table C8
Weight Ratios for Micas
Tempera-ture, °C P L N T R S M B
100 ?.0014 1.0000 1.0000 1.0000 1.0030 1.0000 1.0000 1.0000200 1.0014 0.9989 1.0000 1.0000 1.0018 1.0000 0.9998 1.0000300 1.0000 0.9978 1.0000 1.0000 1.0007 1.0000 0.9945 1.0000400 1.0000 0.9969 1.0000 1.0000 1.0000 1.0000 0.9935 1.0000500 0.9980 0.9955 0.9921 1.0000 1.0000 1.0000 0.9908 1.0000
600 0.9850 0.9912 0.9921 1.0000 1.0000 0.9980 0.9846 1.0000700 0.9595 0.9739 0.9921 1.0000 1.0000 0.9880 0.9805 0.9983800 0.9496 0.9705 0.9921 0.9925 0.9997 0.9675 0.9805 0.9885900 0.9486 0.9705 0.9800 0.9572 0.9936 0.9630 0.9800 0.9787
1000 0.9486 0.9705 0.9460 0.9552 0.9788 0.9630 0.9750 0.9765
Note: P - Pyrophyllite (from Hemp, North Carolina).L - Lepidolite (from Manotoba).N - TaenioliLe (from Magnet Cone, Arkansas).T - Talc.R - Tremolite asbestos (from Baltimore, Maryland).S - Sericite (from Prince Rupert, British Columbia).M - Biotite (from Philadelphia, Pennsylvania).B - Beryl (from Warren Depot, Maine).

Table C9
Weight Ratios for Carbonates
Tempera-ture, °C C D M H N
50 1.000 1.000 1.000 1.000 1.000100 1.000 1.000 1.000 1.000 0.825150 1.000 1.000 1.000 1.000 0.736200 1.000 1.000 1.000 0.998 0.691250 1.000 1.000 1.000 0.900 0.661
300 1.000 1.000 1.000 0.837 0.643400 1.000 1.000 0.975 0.467 0.330500 1.000 0.956 0.540 0.445 0.310600 0.995 0.528 0.508 0.435 0.300700 0.552 0.528 0.508 0.433 0.300
Note: C - Calcite.D - Dolomite (from Cockeysville, Maryland).M - Magnesite (from Cote St. Paul, Quebec).H - Hydromagnesite (from Luna, New Mexico).N - Nesquehonite (Synthetic).

APPENDIX D
INTERNATIONAL BUSINESS MACHINES VERSIONOF MICROWAVE CONTROL PROGRAMFOR INORGANIC SOIL DRYING

4 COLOR 7, 1: CLS5 INPUT "HIT RETURN TO CONTINUE"; E$8 OUT &H303, &H809 OUT &H300, 010 WO " 0: TW = 0: W = 0: WN = 0: F2% = 0: TT = 020 CLS30 OUT &H300, 5640 REM FOR J = 1 TO 1000: NEXT J: REM DELAY50 PRINT "MICROWAVE OVEN PROGRAM"60 PRINT "INITIALIZING:STANDBY"
65 REM ON ERROR GOTO 505067 OPEN "COM1:600,E,7,1,CS" FOR RANDOM AS #171 GOSUB 600072 DIM A$(100): REM DIMENSION A$76 GOSUB 500078 IF FLAG = 1 THEN GOTO 10080 FOR J = 1 TO 5000: NEXT J: REM DELAY90 PRINT #1, "P": REM SCALE POWER ON100 FOR J = 1 TO 15000: NEXT J: REM DELAY105 IF FLAG <> 1 THEN GOTO 72110 PRINT #1, "R": REM RESET SCALE120 FOR J = 1 TO 5000: NEXT J: REM DELAY140 GOSUB 8000: REM READ ZERO150 IF F <> 0 THEN GOTO 110160 CLS170 PRINT "PLACE TARE ON SCALE"180 INPUT "PRESS ANY KEY AND RETURN"; E$190 IF E$ = "" THEN 180195 FOR J = 1 TO 1000: NEXT J200 GOSUB 8000: REM GO AND READ TARE210 TW = W220 TARE = (INT(TW * 100)) / 100230 CLS240 PRINT "FILL TARE WITH 100-200"250 PRINT "GRAMS OF MOIST SOIL, PLACE"260 INPUT "ON PAN, PRESS ANY KEY AND RETURN"; E$270 IF E$ = "" THEN 260275 FOR J = I TO 1000: NEXT J280 GOSUB 8000: REM READ INITIAL WEIGHT292 IF F2% = 0 GOTO 300295 OPEN "LPT1:" FOR OUTPUT AS #3296 IF F2% = 1 THEN GOSUB 7000297 PRINT #3, "TARE WEIGHT = "; TARE300 WXYZ = W305 PRINT "TARE WEIGHT = "; TARE
D-3

310 WETW = (INT(WXYZ * 100)) / 100320 PRINT "WET WEIGHT = "; WETW323 IF F2% = 0 GOTO 340325 PRINT #3, "WET WEIGHT = "; WETW328 REM IF F2%=I THEN GOSUB 7100340 CL = 16: T = 0: NI = 24: RS = 56350 OUT &H300, CL: FOR J = 1 TO 1000: NEXT J360 OUT &H300, RS: FOR J = 1 TO 1000: NEXT J370 OUT &H300, T: FOR J = 1 TO 1000: NEXT J380 OUT &H300, RS: FOR J = 1 TO 1000: NEXT J390 FOR K = 1 TO 4400 OUT &H300, NI: FOR J = 1 TO 1000: NEXT J410 OUT &H300, RS: FOR J = 1 TO 1000: NEXT J420 NEXT K430 INPUT "CLOSE DOOR, PRESS ANY KEY AND RETURN"; E$440 IF E$ = "" THEN 430443 CLS445 GOSUB 7095450 GOSUB 8000460 ABCD = W470 OFFSET = WXYZ - ABCD480 TUVW = ABCD + OFFSET500 SR = 32: RS = 56510 OUT &H300, SR: FOR J = 1 TO 1000: NEXT J520 OUT &H300, RS: FOR J = 1 TO 1000: NEXT J530 L = 0540 N = 1550 GO = 0560 TI = TIMER570 X = TIMER - TI: IF X < 30 THEN 570580 IF N = 1 THEN WO = TUVW590 GOSUB 2000: REM GET WEIGHT600 WN = W610 G = ((WO - TW) ^ 2 - (WN - TW) ^ 2) /60620 WC = ((TUVW - WN) / (WN - TW)) * 100630 G = (INT(G * 10000)) / 10000640 WN = (INT(WN * 100)) / 100650 WC = (INT(WC * 1000)) / 1000651 TT = TT + X652 ET = TT653 IF F2% = 0 THEN GOTO 660654 PRINT #3, USING " ####"; ET;655 PRINT #3, USING " ####"; TT;656 PRINT #3, USING " ###.#"; WN;657 PRINT #3, USING " ###.##"; WC660 PRINT USING " ####"; ET;662 PRINT USING " ####"; TT;
D-4

664 PRINT USING " ###.#"; WN;666 PRINT USING " ###.##"; WC670 N = N + I680 WO = WN700 IF G < GO AND L = 1 THEN GOTO 820710 IF G >= GO THEN GO = G: GOTO 560720 IF G < GO THEN L = 1: GOTO 560820 TI = TIMER830 X = TIMER - TI: IF X < 30 THEN 830840 WO = WN850 GOSUB 2000860 WN = W870 WC = ((TUVW - WN) / (WN - TW)) * 100880 DW = (TUVW - TW) * (1 / (WN - TW) - (1 / (WO - TW)))890 DW = (INT(DW * 10000001)) / 1000000!900 WN = (INT(WN * 100)) / 100910 WC = (INT(WC * 1000)) / 1000911 TT = TT + X912 ET = TT913 IF F2% = 0 THEN GOTO 920914 PRINT #3, USING " ####"; ET;915 PRINT #3, USING " ####"; TT;916 PRINT #3, USING " ###.#"; WN;917 PRINT #3, USING " ###.##"; We920 PRINT USING , ####"; ET;922 PRINT USING , ####"; TT;924 PRINT USING ' ###.#"; WN;926 PRINT USING " ###.##"; WC930 IF DW > .02 THEN 820940 MW = 56577!: SP = 8: RS = 56950 OUT &H300, SP: FOR J = 1 TO 1000: NEXT J960 OUT &H300, RS: FOR J = 1 TO 1000: NEXT J970 WO = WN980 TI = TIMER990 X = TIMER - TI: IF X < 30 THEN 990995 ET = ET + X1000 OUT &H300, SR: FOR J = 1 TO 1000: NEXT J1010 OUT &H300, RS: FOR J = 1 TO 1000: NEXT J1020 TI = TIMER1030 X = TIMER - TI: IF X < 30 THEN 10301035 ET = ET + X1040 GOSUB 90001050 WN = W1060 WC = ((TUVW - WN) / (WN - TW)) * 1001070 DW (TUVW - TW) * (1 / (WN - TW) - (I / (WO - TW)))1080 DW = (INT(DW * 1000000!)) / 1000000!
D-5

1090 WN = (INT(WN * 100)) / 1001100 WC = (INT(WC * 1000)) / 10001101 TT = TT + X1102 IF F2% = 0 THEN GOTO 11101104 PRINT #3, USING " ####"; ET;1105 PRINT #3, USING " ####"; TT;1106 PRINT #3, USING " ###.#"; WN;1107 PRINT #3, USING " ###.##"; WC1110 PRINT USING " ####"; ET;1112 PRINT USING " ####"; TT;1114 PRINT USING " ###.#"; WN;1116 PRINT USING " ###.##"; WC1120 IF DW > Fl THEN GOTO 9701130 SP = 8: RS = 561140 OUT &H300, SP: FOR J = 1 TO 1000: NEXT J1150 OUT &H300, RS: FOR J = 1 TO 1000: NEXT J1160 TI = TIMER1170 X = TIMER - TI: IF X < 180 THEN 11701180 GOSUB 80001190 WN = W1200 FOR K = 1 TO 251210 OUT &H300, CL: FOR J = 1 TO 1000: NEXT J1220 OUT &H300, RS: FOR J = 1 TO 1000: NEXT J1230 NEXT K1240 Z = ((TUVW- WN) / (WN - TW)) * 1001250 Z = (INT(Z * 100) / 100)1252 IF F2% = 0 THEN GOTO 12691253 PRINT #3, USING " ####"; ET + 180;1254 PRINT #3, USING " ####"; TT;1255 PRINT #3, USING " ###.#"; WN;1256 PRINT #3, USING " ###.##"; Z1257 PRINT USING " ####"; ET + 180;1258 PRINT USING " ####"; TT;1259 PRINT USING " ###.#"; WN;1260 PRINT USING " ###.##"; Z
1263 PRINT #3, "WATER CONTENT ="; Z; "%"1264 PRINT #3, "FINAL WEIGHT =" ; WN; "G"1269 PRINT "WATER CONTENT ="; Z; "%"
1270 PRINT "FINAL WEIGHT ="; WN; "G"1280 FOR J = 1 TO 5000: NEXT J1290 MW = 56577!: CL = 16: RS = 561300 OUT &H300, CL: FOR J = 1 TO 1000: NEXT J1310 OUT &H300, RS: FOR J = 1 TO 1000: NEXT J1320 PRINT #1, "P": REM SCALE POWER OFF1330 PRINT "TEST IS OVER!"1340 PRINT "REMOVE CONTAINER"
D-6

1360 PRINT "CAUTION!-CONTAINER IS HOT"1365 CLOSE #31366 CLOSE #11367 INPUT "PRESS RETURN TO RESET FOR NEXT TEST"; E$1368 GOTO 101370 END2000 REM SUBROUTINE TO READ THE SCALE2003 MW = 56577!: SP = 8: RS = 562005 OUT &H300, SP: FOR J = 1 TO 1000: NEXT J2007 OUT &H300, RS: FOR J = 1 TO 1000: NEXT J2020 PRINT #1, "Q": FOR J = 1 TO 500: NEXT J2040 LINE INPUT #1, A$(3)2050 IF A$(3) = "" THEN 20402070 IF A$(3) = CHR$(103) THEN A$(3) = CHR$(71)2080 B$ = LEFT$(A$(3), 2)2090 DT$ = MID$(A$(3), 5, 11)2100 IF B$ = "US" THEN GOTO 20202105 F = VAL(DT$)2110 W = 1! * F2113 SR = 32: RS = 562115 OUT &H300, SR: FOR J = 1 TO 1000: NEXT J2117 OUT &H300, RS: FOR J = 1 TO 1000: NEXT J2120 RETURN5000 PRINT #1, "Q": FOR J = 1 TO 250: NEXT J5020 FOR I = 1 TO 1005021 A = INP(&H3F8): FOR J = 1 TO 100: NEXT J: IF A <> 10AND A <> 255 AND A <> 0 THEN FLAG = 1: LINE INPUT #1,A$(2): GOTO 50505023 NEXT I5030 FLAG = 05050 RETURN6000 REM OPERATOR INPUT6010 INPUT "PLEASE INPUT DATE OF TEST"; D$6020 INPUT "WHAT IS THE PROJECT NUMBER?"; P$6030 INPUT "WHAT IS THE JOB NUMBER?"; J$6040 INPUT "IS THIS A CLEAN SAND?"; I$6045 Fl = .0026050 IF I$ = "Y" THEN Fl = 0!: GOTO 60806060 IF I$ <> "N" THEN GOTO 60406080 INPUT "ARE YOU USING A PRINTER?"; I$6085 F2% = 06090 IF I$ = "Y" THEN F2% = 1: GOTO 61106100 IF I$ <> "N" THEN GOTO 60806110 RETURN7000 REM HEADER INFO7010 PRINT #3, " MICROWAVE OVEN"
D-7

7020 PRINT #3, " WATER CONTENT DETERMINATION"7030 PRINT #3, "DATE: "; D$7040 PRINT #3, "PROJECT NO: "; P$7050 PRINT #3, "JOB NUMBER: "; J$7065 REM HEADER INFO7070 PRINT " MICROWAVE OVEN"7075 PRINT " WATER CONTENT DETERMINATION"7077 PRINT "DATE: "; D$7080 PRINT "PROJECT NO: "; P$7085 PRINT "JOB NUMBER: "; J$7090 RETURN7095 IF F2% = 0 THEN GOTO 72007100 PRINT #3, " ELAPSED DRYING WEIGHT
WATER"7110 PRINT #3, "TIME (SEC) TIME (SEC) (G)
CONTENT (%)"7120 PRINT #3, "
7130 PRINT #3, USING " ###"; ZERO;7132 PRINT #3, USING " ###"; ZERO;7134 PRINT #3, USING " ###.#"; WETW;7136 PRINT #3, USING " ###.##"; ZERO7200 PRINT " ELAPSED DRYING WEIGHT
WATER"7210 PRINT "TIME (SEC) TIME (SEC) (G)CONTENT (%)"
7220 PRINT "It
7225 ZERO = 07230 PRINT USING " ###"; ZERO;7232 PRINT USING " ###'; ZERO;7234 PRINT USING " ###.#"; WETW;7236 PRINT USING " ###.##"; ZERO7240 RETURN8000 REM SUBROUTINE TO READ THE SCALE8010 FOR J = 1 TO 5000: NEXT J3020 PRINT #1, "Q": FOR J = 1 TO 500: NEXT J8040 LINE INPUT #1, A$(2)8050 IF A$(2) =" " THEN 80408070 IF A$(2) = CHR$(103) THEN A$(2) = CHR$(71)8080 B$ = LEFT$(A$(2), 2)8100 IF B$ = "US" THEN GOTO 80208102 DT$ = MID$(A$(2), 5, 11)8105 F = VAL(DT$)8110 W = F8120 RETURN
D-8

9000 REM SUBROUTINE TO READ THE SCALE9003 MW = 56577!: SP = 8: RS = 569005 OUT &H300, SP: FOR J = 1 TO 1000: NEXT J9007 OUT &H300, RS: FOR J = 1 TO 1000: NEXT J9020 PRINT #1, "Q": FOR J = 1 TO 500: NEXT J9040 LINE INPUT #1, A$(4)9050 IF A$(4) = I'l THEN 90409070 IF A$(4) = CHR$(103) THEN A$(I) =CHR$(71)
9080 B$ =LEFT$(A$(4), 2)9090 DT$ =MID$(A$(4), 5, 11)9100 IF B$ = "IUS"I GOTO 90209105 F = VAL(DT$)9110 W = 1! * F9120 RETURN
D-9

APPENDIX E
INTERNATIONAL BUSINESS MACHINES VERSIONOF MICROWAVE CONTROL PROGRAM
FOR DRYING PEAT
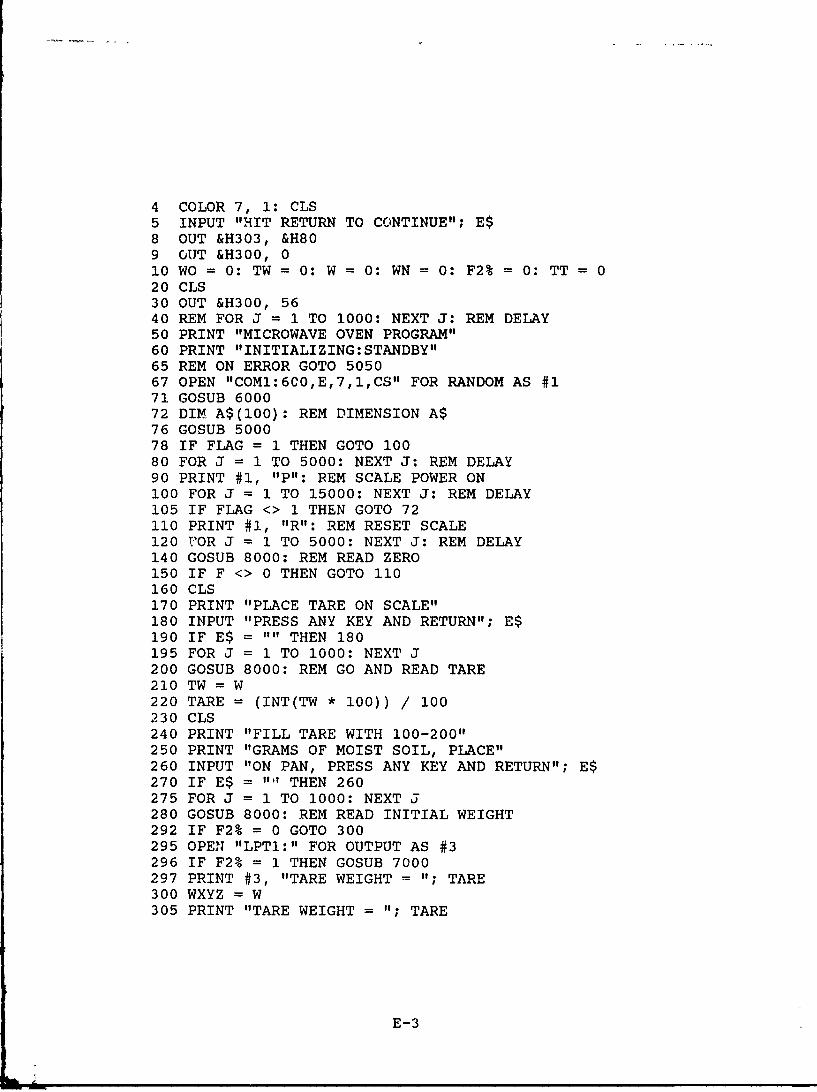
4 COLOR 7, 1: CLS5 INPUT "HIT RETURN TO CONTINUE"; E$8 OUT &H303, &H809 OUT &H300, 010 WO = 0: TW = 0: W = 0: WN = 0: F2% = 0: TT = 020 CLS30 OUT &H300, 5640 REM FOR J = 1 TO 1000: NEXT J: REM DELAY50 PRINT "MICROWAVE OVEN PROGRAM"60 PRINT "INITIALIZING:STANDBY"65 REM ON ERROR GOTO 505067 OPEN "COM1:6C0,E,7,1,CS" FOR RANDOM AS #171 GOSUB 600072 DIM A$(100): REM DIMENSION A$76 GOSUB 500078 IF FLAG = 1 THEN GOTO 10080 FOR J = 1 TO 5000: NEXT J: REM DELAY90 PRINT #1, "P": REM SCALE POWER ON100 FOR J = 1 TO 15000: NEXT J: REM DELAY105 IF FLAG <> 1 THEN GOTO 72110 PRINT #1, "R": REM RESET SCALE120 FOR J = 1 TO 5000: NEXT J: REM DELAY140 GOSUB 8000: REM READ ZERO150 IF F <> 0 THEN GOTO 110160 CLS170 PRINT "PLACE TARE ON SCALE"180 INPUT "PRESS ANY KEY AND RETURN"; E$190 IF E$ = "" THEN 180195 FOR J = 1 TO 1000: NEXT J200 GOSUB 8000: REM GO AND READ TARE210 TW = W220 TARE = (INT(TW * 100)) / 100230 CLS240 PRINT "FILL TARE WITH 100-200"250 PRINT "GRAMS OF MOIST SOIL, PLACE"260 INPUT "ON PAN, PRESS ANY KEY AND RETURN"; E$270 IF E$ = "' THEN 260275 FOR J = 1 TO 1000: NEXT J280 GOSUB 8000: REM READ INITIAL WEIGHT292 IF F2% = 0 GOTO 300295 OPEN "LPT1:" FOR OUTPUT AS #3296 IF F2% = 1 THEN GOSUB 7000297 PRINT #3, "TARE WEIGHT = "; TARE300 WXYZ = W
305 PRINT "TARE WEIGHT = "; TARE
E-3

310 WETW = (INT(WXYZ * 100)) / 100320 PRINT "WET WEIGHT = "; WETW322 IF F2% = 0 GOTO 340325 PRINT #3, "WET WEIGHT = "; WETW327 REM IF F2%=I THEN GOSUB 7100340 CL = 16: T = 0: NI = 24: RS = 56350 OUT &H300, CL: FOR J = 1 TO 1000: NEXT J360 OUT &H300, RS: FOR J = 1 TO 1000: NEXT J370 OUT &H300, T: FOR J = 1 TO 1000: NEXT J380 OUT &H300, RS: FOR J = 1 TO 1000: NEXT J390 FOR K = 1 TO 4400 OUT &H300, NI: FOR J = 1 TO 1000: NEXT J410 OUT &H300, RS: FOR J = 1 TO 1000: NEXT J420 NEXT K430 INPUT "CLOSE DOOR, PRESS ANY KEY AND RETURN"; E$440 IF E$ = "" THEN 430443 CLS445 GOSUB 7095450 GOSUB 8000460 ABCD = W470 OFFSET = WXYZ - ABCD480 TUVW = ABCD + OFFSET500 SR = 32: RS = 56510 OUT &H300, SR: FOR J = 1 TO 1000: NEXT J520 OUT &H300, RS: FOR J = 1 TO 1000: NEXT J530 WO = TUVW560 TI = TIMER570 X = TIMER - TI: IF X < 30 THEN 570590 GOSUB 2000: REM GET WEIGHT600 WN = W620 WC = ((TUVW - WN) / (WN - TW)) * 100630 DW = (TUVW - TW) * (1 / (WN - TW) - (1 / (WO - TW)))640 WN = (INT(WN * 100)) / 100650 WC = (INT(WC * 1000)) / 1000651 TT = TT + X652 ET = TT653 IF F2% = 0 THEN GOTO 660654 PRINT #3, USING " ####"; ET;655 PRINT #3, USING " ####"; TT;656 PRINT #3, USING " ###.#"; WN;657 PRINT #3, USING " ###.##"; WC660 PRINT USING " ####"; ET;662 PRINT USING " ####"; TT;664 PRINT USING " #.#"; WN;666 PRINT USING " ###.##"; WC668 WO = WN
E-4

670 IF DW < .1 THEN GOTO 560680 WO = WN820 TI = TIMER830 X =TIMER - TI: IF X < 30 THEN 830840 WO = WN850 GOSUB 2000860 WN = W870 WC = ((TUVW - WN) / (WN - TW)) * 100880 DW = (TUVW - TW) * (1 / (WN - TW) - (1 /(WO -TW)))
890 DW = (INT(DW # 1000000!)) / 1000000!900 WN = (INT(WN * 100)) /100910 WC = (INT(WC * 1000)) /1000911 TT = TT + X912 ET = TT913 IF F2% = 0 THEN GOTO 920914 PRINT #3, USING "####"; ET;915 PRINT #3, USING "####"; TT;916 PRINT #3, USING '# .#;WN;
917 PRINT #3, USING " #.#;WO920 PRINT USING "####"; ET;922 PRINT USING ####" TT;924 PRINT USING ###.#"; WN;926 PRINT USING "###.##"; WC930 IF DW > .08 THEN 820940 MW = 565772: SP = 8: RS = 56950 OUT &H300, SP: FOR J 1 TO 1000: NEXT J960 OUT &H300, RS: FOR J =1 TO 1000: NEXT J970 WO = WN980 TI = TIMER990 X = TIMER - TI: IF X < 30 THEN 990995 ET = ET + X1000 OUT &H300, SR: FOR J = 1 TO 1000: NEXT J1010 OUT &H300, RS: FOR J = 1 TO 1000: NEXT J1020 TI = TIMER1030 X = TIMER - TI: IF X < 30 THEN 10301035 ET = ET + X1040 GOSUB 90001050 WN = W1060 WC = ((TUVW - W11) / (WN - TW)) * 1001070 DW = (TUVW - TW) * (1 / (WN -TW) - (1 /(WO -TW))
J'080 DW = (INT(DW * 1000000!)) /1000000!1090 WN = (INT(WN * 100)) /1001100 We = (INT(WC * 1000)) /10001101 TT = TT + X1102 IF F2% =- 0 THEN GOTO 11101104 PRINT #3, USING "####"; ET;
E-5

1105 PRINT #3, USING " ####"; TT;1106 PRINT #3, USING " ###.#"; WN;1107 PRINT #3, USING " ###.##"; WC1110 PRINT USING " ####"; ET;1112 PRINT USING " ####"; TT;1114 PRINT USING " ###.#"; WN;1116 PRINT USING " ###.##"; WC1120 IF DW > Fl THEN GOTO 9701130 SP = 8: RS = 561140 OUT &H300, SP: FOR J = 1 TO 1000: NEXT J1150 OUT &H300, RS: FOR J = 1 TO 1000: NEXT J1160 TI = TIMER1170 X = TIMER - TI: IF X < 180 THEN 11701180 GOSUB 80001190 WN = W1200 FOR K = 1 TO 251210 OUT &H300, CL: FOR J = 1 TO 1000: NEXT J1220 OUT &H300, RS: FOR J = 1 TO 1000: NEXT J1230 NEXT K1240 Z = ((TUVW - WN) / (WN - TW)) * 1001250 Z = (INT(Z * 100) / 100)1252 IF F2% = 0 THEN GOTO 12651255 PRINT #3, "WATER CONTENT ="; Z; "%"1260 PRINT #3, "FINAL WEIGHT =11; WN; "G"1265 PRINT "WATER CONTENT ="; Z; "%"
1270 PRINT "FINAL WEIGHT ="; WN; "G"1280 FOR J = 1 TO 5000: NEXT J1290 MW = 56577!: CL = 16: RS = 561300 OUT &H300, CL: FOR J = 1 TO 1000: NEXT J1310 OUT &H300, RS: FOR J = 1 TO 1000: NEXT J1320 PRINT #1, "P": REM SCALE POWER OFF1330 PRINT "TEST IS OVER!"1340 PRINT "REMOVE CONTAINER"1360 PRINT "CAUTION!-CONTAINER IS HOT"1365 CLOSE #31366 CLOSE #11367 INPUT "PRESS RETURN TO RESET FOR NEXT TEST"; E$1368 GOTO 101370 END2000 REM SUBROUTINE TO READ THE SCALE2003 MW = 56577!: SP = 8: RS = 562005 OUT &H300, SP: FOR J = 1 TO 1000: NEXT J2007 OUT &H300, RS: FOR J = 1 TO 1000: NEXT J2020 PRINT #1, "Q": FOR J = 1 TO 500: NEXT J2040 LINE INPUT #1, A$(3)2050 IF A$(3) = "" THEN 2040
E-6

2070 IF A$(3) = CHR$(103) THEN A$(3) = CHR$(71)2080 B$ = LEFT$(A$(3), 2).:090 DT$ = MID$(A$(3), 5, 11)2100 IF B$ = "US" THEN GOTO 20202105 F = VAL(DT$)2110 W = 1! * F2113 SR = 32: RS = 562115 OUT &H300, SR: FOR J = 1 TO 1000: NEXT J2117 OUT &H300, RS: FOR J = 1 TO 1000: NEXT J2120 RETURN5000 PRINT #1, "Q": FOR J = 1 TO 250: NEXT J5020 FOR I = 1 TO 1005021 A = INP(&H3F8): FOR J = 1 TO 100: NEXT J: IF A <> 10AND A <> 255 AND A <> 0 THEN FLAG = 1: LINE INPUT #1,A$(2): GOTO 50505023 NEXT I5030 FLAG = 05050 RETURN6000 REM OPERATOR INPUT6010 INPUT "PLEASE INPUT DATE OF TEST"; D$6020 INPUT "WHAT IS THE PROJECT NUMBER?"; P$6030 INPUT "WHAT IS THE JOB NUMBER?"; J$6045 Fl = .056080 INPUT "ARE YOU USING A PRINTER?"; I$6085 F2% = 06090 IF I$ = "Y" THEN F2% = 1: GOTO 61106100 IF I$ <> "N" THEN GOTO 60806110 RETURN7000 REM HEADER INFO7010 PRINT #3, " MICROWAVE OVEN"7020 PRINT #3, " WATER CONTENT DETERMINATION"7030 PRINT #3, "DATE: "; D$7040 PRINT #3, "PROJECT NO: "; P$7050 PRINT #3, "JOB NUMBER: "; J$7065 REM HEADER INFO7070 PRINT " MICROWAVE OVEN"7075 PRINT " WATER CONTENT DETERMINATION"7077 PRINT "DATE: "; D$7080 PRINT "PROJECT 1O: "; P$7085 PRINT "JOB NUMBER: "; J$7090 RETURN7095 IF F2% = 0 THEN GOTO 72007100 PRINT #3, " ELAPSED DRYING WEIGHT
WATER"7110 PRINT #3, "TIME (SEC) TIME (SEC) (G)
CONTENT (%)"
E-7

7120 PRINT #3, "NI
7130 PRINT #3, USING " ###"; ZERO;7132 PRINT #2, USING " ###"; ZERO;
7134 PRINT #3, USING " ###.#"; WETW;7136 PRINT 3, USING " ###.##"; ZERO7200 PRINT " ELAPSED DRYING WEIGHT
WATER"7210 PRINT "TIME (SEC) TIME (SEC) (G)CONTENT (%)"
7220 PRINT "
7225 ZERO = 07230 PRINT USING " ###"; ZERO;7232 PRINT USING " # #"; ZERO;7234 PRINT USING " ###.#"; WETW;7236 PRINT USING " ###.##"; ZERO7240 RETURN8000 REM SUBROUTINE TO READ THE SCALE8010 FOR J = 1 TO 5000: NEXT J8020 PRINT fl, "Q": FOR J = 1 TO 500: NEXT J8040 LINE INPUT #1, A$(2)8050 IF A$(2) = " " THEN 80408070 IF A$(2) = CHR$(103) THEN A$(2) = CHR$(71)8080 B$ = LEFT$(A$(2), 2)8100 IF B$ = "US" THEN GOTO 80203102 DT$ = MID$(A$(2), 5, 11)8105 F = VAL(DT$)8110 W = F8120 RETURN9000 REM SUBROUTINE TO READ THE SCALE9003 MW = 56577!: SP = 8: RS = 569005 OUT &H300, SP: FOR J = 1 TO 1000: NEXT J9007 OUT &H300, RS: FOR J = 1 TO 1000: NEXT J9020 PRINT #1, "Q": FOR J = 1 TO 500: NEXT J9040 LINE INPUT #1, A$(4)9050 IF A$(4) = "" THEN 90409070 IF A$(4) = CHR$(103) THEN A$(I) = CHR$(71)9080 B$ = LEFT$(A$(4), 2)9090 DT$ = MID$(A$(4), 5, 11)9100 IF B$ = "US" GOTO 90209105 F = VAL(DT$)9110 W = 1! * F9120 RETURN
E-8

APPENDIX F
INTERNATIONAL BUSINESS MACHINESVERSION OF MICROWAVE SYSTEM CONTROL PROGRAM
FOR DRYING MICROWAVE RESISTANT SOILS

4 COLOR 7, 1: CLO5 INPUT "HIT RETURN TO CONTINUE"; E$8 OUT &H303, &H809 OUT &H300, 010 WO = 0: TW = 0: W = 0: WN = 0: F2% = 0: TT = 020 CLS30 OUT &H300, 5640 REM FOR J = 1 TO 1000: NEXT J: REM DELAY50 PRINT "MICROWAVE OVEN PROGRAM"60 PRINT "INITIALIZING:STANDBY"65 REM ON ERROR GOTO 505067 OPEN "COM1:600,E,7,1,CS" FOR RANDOM AS #171 GOSUB 600072 DIM A$(100): REM DIMENSION A$76 GOSUB 500078 IF FLAG = 1 THEN GOTO 10080 FOR J = I TO 5000: NEXT J: REM DELAY90 PRINT #1, "P": REM SCALE POWER ON100 FOR J = 1 TO 15000: NEXT J: REM DELAY105 IF FLAG <> I THEN GOTO 72110 PRINT #1, "R"': REM RESET SCALE120 FOR J = 1 TO 5000: NEXT J: REM DELAY140 GOSUB 8000: REM READ ZERO150 IF F <> 0 THEN GOTO 110160 CLS170 PRINT "PLACE TARE ON SCALE"180 INPUT "PRESS ANY KEY AND RETURN"; E$190 IF E$ = "" THEN 180195 FOR J = 1 TO 1000: NEXT J200 GOSUB 8000: REM GO AND READ TARE210 TW = W220 TARE = (INT(TW * 100)) / 100230 CLS240 PRINT "FILL TARE WITH 100-200"250 PRINT "GRAMS OF MOIST SOIL, PLACE"260 INPUT "ON PAN, PRESS ANY KEY AND RETURN"; E$270 IF E$ = "" THEN 260275 FOR J = 1 TO 1000: NEXT J280 GOSUB 8000: REM READ INITIAL WEIGHT292 IF F2% = 0 GOTO 300295 OPEN "LPT1:" FOR OUTPUT AS #3296 IF F2% = 1 THEN GOSUB 7000297 PRINT #3, "TARE WEIGHT = "; TARE300 WXYZ = W305 PRINT "TARE WEIGHT = "; TARE310 WETW = (INT(WXYZ * 100)) / 100
F-3
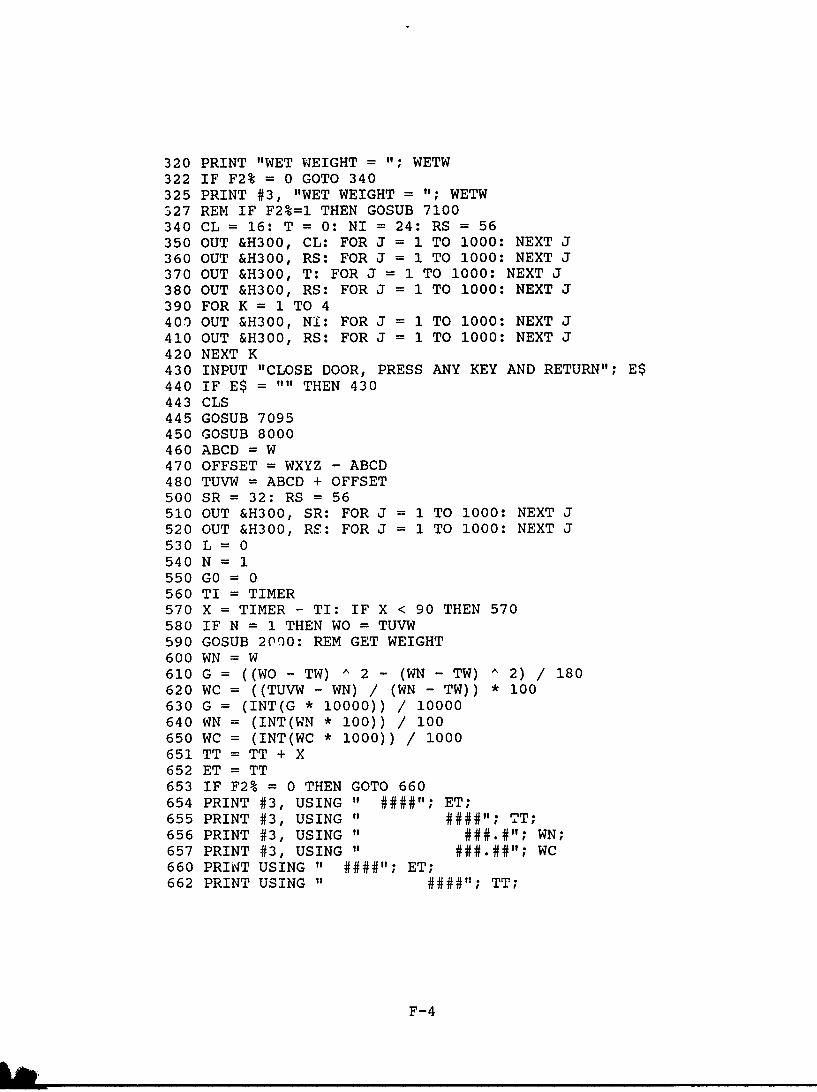
320 PRINT "WET WEIGHT = "; WETW322 IF F2% = 0 GOTO 340325 PRINT #3, "WET WEIGHT = "; WETW327 REM IF F2%=I THEN GOSUB 7100340 CL = 16: T = 0: NI = 24: RS = 56350 OUT &H300, CL: FOR J = 1 TO 1000: NEXT J360 OUT &H300, RS: FOR J = 1 TO 1000: NEXT J370 OUT &H300, T: FOR J = 1 TO 1000: NEXT J380 OUT &H300, RS: FOR J = 1 TO 1000: NEXT J390 FOR K = 1 TO 4400 OUT &H300, NI: FOR J = 1 TO 1000: NEXT J410 OUT &H300, RS: FOR J = 1 TO 1000: NEXT J420 NEXT K430 INPUT "CLOSE DOOR, PRESS ANY KEY AND RETURN"; E$440 IF E$ = "" THEN 430443 CLS445 GOSUB 7095450 GOSUB 8000460 ABCD = W470 OFFSET = WXYZ - ABCD480 TUVW = ABCD + OFFSET500 SR = 32: RS = 56510 OUT &H300, SR: FOR J = 1 TO 1000: NEXT J520 OUT &H300, RS: FOR J = 1 TO 1000: NEXT J530 L = 0540 N = 1550 GO 0560 TI = TIMER570 X = TIMER - TI: IF X < 90 THEN 570580 IF N = 1 THEN WO = TUVW590 GOSUB 2000: REM GET WEIGHT600 WN = W610 G = ((WO - TW) ^ 2 - (WN - TW) ^ 2) / 180620 WC = ((TUVW - WN) / (WN - TW)) * 100630 G = (INT(G * 10000)) / 10000640 WN = (INT(WN * 100)) / 100650 WC = (INT(WC * 1000)) / 1000651 TT = TT + X652 ET = TT653 IF F2% = 0 THEN GOTO 660654 PRINT #3, USING " ####"; ET;655 PRINT #3, USING " ####"; TT;656 PRINT #3, USING " ###.#"; WN;657 PRINT #3, USING " ###.##"; WC660 PRINT USING " ####"; ET;662 PRINT USING " ####"; TT;
F-4

664 PRINT USING " ###.#"; WN;666 PRINT USING " ###.##"; WC670 N N + 1680 WO = WN700 IF G < GO AND L = 1 THEN GOTO 820710 IF G >= GO THEN GO = G: GOTO 560720 IF G < GO THEN L = 1: GOTO 560820 TI = TIMER830 X TIMER - TI: IF X < 90 THEN 830840 WO = WN850 GOSUB 2000860 WN = W870 WC = ((TUVW - WN) / (WN - TW)) * 100880 DW = (TUVW - TW) * (1 / (WN - TW) - (I / (WO - TW)))890 DW = (INT(DW * 1000000!)) / 1000000!900 WN = (INT(WN * 100)) / 100910 WC = (INT(WC * 1000)) / 1000911 TT = TT + X912 ET = TT913 IF F2% = 0 THEN GOTO 920914 PRINT #3, USING " ####"; ET;915 PRINT #3, USING " ####"; TT;916 PRINT #3, USING " ###.#"; WN;917 PRINT #3, USING " ###.##"; WC920 PRINT USING " ####"; ET;922 PRINT USING " ####"; TT;924 PRINT USING " ###.#"; WN;926 PRINT USING " ###.##"; WC930 IF DW > .02 THEN 820940 MW = 56577!: SP = 8: RS = 56950 OUT &H300, SP: FOR J = 1 TO 1000: NEXT J960 OUT &H300, RS: FOR J = 1 TO 1000 NEXT J970 WO = WN980 TI = TIMER990 X = TIMER - TI: IF X < 30 THEN 990995 ET = ET + X1000 OUT &H300, SR: FOR J = 1 TO 1000: NEXT J1010 OUT &H300, RS: FOR J = 1 TO 1000: NEXT J1020 TI = TIMER1030 X = TIMER - TI: IF X < 90 THEN 10301035 ET = ET + X1040 GOSUB 90001050 WN = W1060 WC = ((TUVW - WN) / (WN - TW)) * 1001070 DW = (TUVW - TW) * (1 / (WN - TW) - (1 / (WO - TW)))1080 DW = (INT(DW * 1000000!)) / 1000000!
F-5
ha

1090 WN = (INT(WN * 100)) / 1001100 WC = (INT(WC * 1000)) / 10001101 TT = TT + X1102 IF F2% = 0 THEN GOTO 11101104 PRINT #3, USING " ####"; ET;1105 PRINT #3, USING " ####"; TT;1106 PRINT #3, USING " ###.#"; WN;1107 PRINT #3, USING " ###.##"; WC1110 PRINT USING " ####"; ET;1112 PRINT USING " ####"; TT;1114 PRINT USING " ###.#"; WN;1116 PRINT USING " ###.##"; WC1120 IF DW > Fl THEN GOTO 9701130 SP = 8: RS = 561140 OUT &H300, SP: FOR J = 1 TO 1000: NEXT J1150 OUT &H300, RS: FOR J = 1 TO 1000: NEXT J1160 TI = TIMER1170 X = TIMER - TI: IF X < 180 THEN 11701180 GOSUB 80001190 WN = W1200 FOR K = 1 TO 251210 OUT &H300, CL: FOR J = 1 TO 1000: NEXT J1220 OUT &H300, RS: FOR J = 1 TO 1000: NEXT J1230 NEXT K1240 Z = ((TUVW - WN) / (WN - TW)) * 1001250 Z = (INT(Z * 100) / 100)1252 IF F2% = 0 THEN GOTO 12651255 PRINT #3, "WATER CONTENT ="; Z; "%"
1260 PRINT #3, "FINAL WEIGHT ="; WN; "G"1265 PRINT "WATER CONTENT =" ; Z; "%"
1270 PRINT "FINAL WEIGHT ="; WN; "G"1280 FOR J = 1 TO 5000: NEXT J1290 MW = 56577!: CL = 16: RS = 561300 OUT &H300, CL: FOR J = 1 TO 1000: NEXT J1310 OUT &H300, RS: FOR J = 1 TO 1000: NEXT J1320 PRINT #1, "P": REM SCALE POWER OFF1330 PRINT "TEST IS OVER!"1340 PRINT "REMOVE CONTAINER"1360 PRINT "CAUTION!-CONTAINER IS HOT"1365 CLOSE #31366 CLOSE #11367 INPUT "PRESS RETURN TO RESET FOR NEXT TEST"; E$1368 GOTO 101370 END2000 REM SUBROUTINE TO READ THE SCALE2003 MW = 56577!: SP = 8: RS = 56
F-6

2005 OUT &H300, SP: FOR J = 1 TO 1000: NEXT J2007 OUT &H300, RS: FOR J = 1 TO 1000: NEXT J2020 PRINT #1, "Q": FOR J = 1 TO 500: NEXT J2040 LINE INPUT #1, A$(3)2050 IF A$(3) = "" THEN 20402070 IF A$(3) = CHR$(103) THEN A$(3) = CHR$(71)2080 B$ = LEFT$(A$(3), 2)2090 DT$ = MID$(A$(3), 5, 13)2100 IF B$ = "US" THEN GOTO 20202105 F = VAL(DT$)2110 W = 1! * F2113 SR = 32: RS = 562115 OUT &H300, SR: FOR J = 1 TO 1000: NEXT J2117 OUT &H300, RS: FOR J = 1 TO 1000: NEXT J2120 RETURN5000 PRINT #1, "Q": FOR J = 1 TO 250: NEXT J5020 FOR I = 1 TO 1005021 A = INP(&H3F8): FOR J = 1 TO 100: NEXT J: IF A <> 10AND A <> 255 AND A <> 0 THEN FLAG = 1: LINE INPUT #1,A$(2): GOTO 50505023 NEXT I5030 FLAG = 05050 RETURN6000 REM OPERATOR INPUT6010 INPUT "PLEASE INPUT DATE OF TEST"; D$6020 INPUT "WHAT IS THE PROJECT NUMBER?"; P$6030 INPUT "WHAT IS THE JOB NUMBER?"; J$6040 INPUT "IS THIS A CLEAN SAND?"; I$6045 Fl = .026050 IF I$ = "Y" THEN Fl = 0!: GOTO 60806060 IF I$ <> "N" THEN GOTO 60406080 INPUT "ARE YOU USING A PRINTER?"; I$6085 F2% = 06090 IF I$ = "Y" THEN F2% = 1: GOTO 61106100 IF I$ <> "N" THEN GOTO 60806110 RETURN7000 REM HEADER INFO7010 PRINT #3, " MICROWAVE OVEN"7020 PRINT #3, " WATER CONTENT DETERMINATION"7030 PRINT #3, "DATE: "; D$7040 PRINT #3, "PROJECT NO: "; P$7050 PRINT #3, "JOB NUMBER: "; J$7065 REM HEADER INFO7070 PRINT " MICROWAVE OVEN"7075 PRINT " WATER CONTENT DETERMINATION"7077 PRINT "DATE: "; D$
F-7

7080 PRINT "PROJECT NO: "; P$7085 PRINT "JOB NUMBER: "; J$7090 RETURN7095 IF F2% = 0 THEN GOTO 72007100 PRINT #3, " ELAPSED DRYING WEIGHT
WATER"7110 PRINT #3, "TIME (SEC) TIME (SEC) (G)
CONTENT (%)"7120 PRINT #3, "
7130 PRINT #3, USING It ###"; ZERO;7132 PRINT #3, USING " ###" ; ZERO;7134 PRINT #3, USING " ###.#"; WETW;7136 PRINT #3, USING " ###.##"; ZERO
7200 PRINT " ELAPSED DRYING WEIGHT
7210 PRINT "TIME (SEC) TIME (SEC) (G)CONTENT (%)"
7220 PRINT ",,
7225 ZERO = 07230 PRINT USING " ###"; ZERO;7232 PRINT USING " ###"; ZERO;7234 PRINT USING " ###.#"; WETW;7236 PRINT USING " ###.##"; ZERO7240 RETURN8000 REM SUBROUTINE TO READ THE SCALE8010 FOR J = 1 TO 5000: NEXT J8020 PRINT #1, "Q": FOR J = 1 TO 500: NEXT J8040 LINE INPUT #1, A$(2)8050 IF A$(2) = " " THEN 80408070 IF A$(2) = CHR$(103) THEN A$(2) = CHR$(71)8080 B$ = LEFT$(A$(2), 2)8100 IF B$ = "US" THEN GOTO 80208102 DT$ = MID$(A$(2), 5, 11)8105 F = VAL(DT$)8110 W = F8120 RETURN9000 REM SUBROUTINE TO READ THE SCALE9003 MW = 56577!: SP = 8: RS = 569005 OUT &H300, SP: FOR J = 1 TO 1000: NEXT J9007 OUT &H300, RS: FOR J = 1 TO 1000: NEXT J9020 PRINT #1, "Q": FOR J = 1 TO 500: NEXT J9040 LINE INPUT #1, A$(4)9050 IF A$(4) = "" THEN 9040
F-8
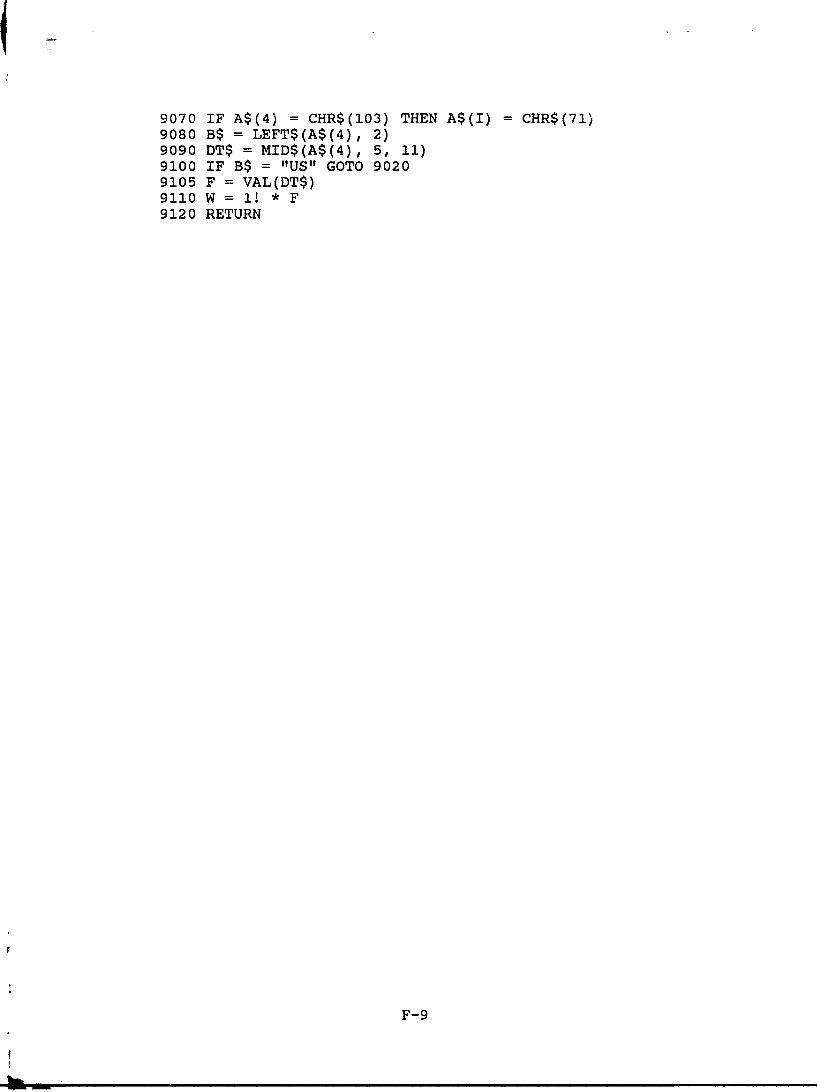
9070 IF A$(4) =CHR$(103) THEN A$(I) =CHR$(71)
9080 B$ LEFT$(A$(4), 2)9090 DT$ =MID$(A$(4), 5, 11)9100 IF B$ = "US" GOTO 90209105 F = VAL(DT$)9110 W = 1! * F9120 RETURN
F-9

f
APPENDIX G
ENHANCED VERSION OF COMMODORE 64 CONTROL PROGRAMFOR INORGANIC SOIL DRYING
Abb

4 PRINT "(CLR)"5 INPUT "HIT RETURN TO CONTINUE"; E$8 POKE 808, 39: POKE 809, 25410 WO=0: TW=0: W=O: WN=0: F2%=0: TT=020 PRINT " (CLR)"30 GOSUB 300040 FOR J=l TO 1000: NEXT J: REM DELAY50 PRINT "MICROWAVE OVEN PROGRAM"60 PRINT "INITIALIZING:STANDBY"70 OPEN 2, 2, 0, CHR$(7+32)+CHR$(32+64)71 GOSUB 600072 DIM A$(17): REM DIMENSION A$76 GOSUB 500078 IF FLAG=I THEN GOTO 10080 FOR J=l TO 100: NEXT J: REM DELAY90 PRINT #2, "P": REM SCALE POWER ON100 FOR J=l TO 500: NEXT J: REM DELAY110 PRINT #2, "R": REM RESET SCALE120 FOR J=l TO 100: NEXT J: REM DELAY140 GOSUB 8000: REM READ ZERO150 IF F <> 0 THEN GOTO 110160 PRINT "(CLR)"170 PRINT "PLACE TARE ON SCALE"180 INPUT "PRESS ANY KEY AND RETURN"; E$190 IF E$="" THEN 180200 GOSUB 8000: REM GO AND READ TARE210 TW=W220 TARE=(INT(TW*100))/100230 PRINT "{CLR)"240 PRINT "FILL TARE WITH 100-200"250 PRINT "GRAMS OF MOIST SOIL, PLACE"260 INPUT "ON PAN, PRESS ANY KEY AND RETURN"; E$270 IF E$="" THEN 260275 FOR J=l TO 500: NEXT J280 GOSUB 8000: REM READ INITIAL WEIGHT292 IF F2%=0 GOTO 300295 OPEN 4,4296 IF F2%=I THEN GOSUB 7000297 REM PRINT #4, "TARE WEIGHT="; TARE300 WXYZ=W305 PRINT "TARE WEIGHT="; TARE310 WETW=(INT(WXYZ*100))/100320 PRINT "WET WEIGHT="; WETW322 IF F2%=0 GOTO 330324 PRINT #4, CHR$(16); CHR$(52); CHR$(49);325 PRINT #4, " Wet Weight + Tare (g): "; WETW: PRINT #4,
G-3

326 IF DD$="Y'' THEN PRINT #3, "DENSITY SPECIMEN VOLUME INCUBIC FEET="; VVV327 IF DD$="Y" THEN PRINT #3, "DENSITY SPECIMEN WETWEIGHT IN GRAMS ="; WWW328 REM IF F2%=I THEN GOSUB 7100340 MW=56577: CL=16: T=0: NI=24: RS=56350 POKE MW, CL: FOR J=l TO 100: NEXT J360 POKE MW, RS: FOR J=l TO 100: NEXT J370 POKE MW, T: FOR J=l TO 100: NEXT J380 POKE MW, RS: FOR J=l TO 100: NEXT J390 FOR K=I TO 4400 POKE MW, NI: FOR J=l TO 100: NEXT J410 POKE MW, RS: FOR J=l TO 100: NEXT J423 NEXT K430 INPUT "CLOSE DOOR, PRESS ANY KEY AND RETURN"; E$440 IF E$="" THEN 430443 PRINT "(CLR)"445 GOSUB 7095450 GOSUB 8000460 ABCD=W470 OFFSET=WXYZ-ABCD480 TUVW=ABCD+OFFSET500 MW=56577: SR=32: RS=56510 POKE MW, SR: FOR J=l TO 100: NEXT J520 POKE MW, RS: FOR J=l TO 100: NEXT J530 L=0540 N=I550 GO=0560 TI$="000000"570 X=VAL(TI$): IF X<30 THEN 570580 IF N=I THEN WO=TUVW590 GOSUB 2000: REM GET WEIGHT600 WN=W610 G=((WO-TW)^2-(WN-TW)^2)/60620 WC=((TUVW--WN)/(WN-TW) ) *100630 G=(INT(G*10000))/10000640 WN=(INT(WN*100) )/100650 WC=(INT(WC*1000))/1000651 TT=TT+VAL(TI$)652 ET=TT653 IF F2%=O THEN GOTO 660654 PRINT #4, " "; ET; CHR$(16); CHR$(49); CHR$(53);TT; CHR$(16); CHR$(50); CHR$(57); WN;655 PRINT #4, CHR$(16); CHR$(52); CHR$(54); WC660 PRINT TT; TAB(16); WN; TAB(30); WC670 N=N+I
G-4

680 WO=WN700 IF G<GO AND L=1l THEN GOTO 820710 IF G>=G0 THEN GO=G: GOTO 560720 IF G<GO THEN L=1l: GOTO 560820 TI$="000000"830 X=VAL(TI$): IF X<30 THEN 830840 W0=WN850 GOSUB 2000860 WN=W870 WC=( (TUVW-WN)/ (WN-TW) )*100880 DW=(TUVW-TW) *(1/(WN-TW)-(1/(WO-TW)))890 DW=(INT(DW*1000000!) )/1000000!900 WN=(INT(WN*100) )/100910 WC=(INT(WC*1000) )/1000911 TT=TT+VAL(TI$)912 ET=TT913 IF F2%=0 THEN GOTO 920915 PRINT #4, " ti; ET; CHR$(16); CHR$(49); CHR$(53);TT;CHR$(16); CHR$(50); CHR$(57); WN;916 PRINT #4, CHR$(16); CHR$(52); CHR$(54); WC920 PRINT TT; TAB(16); WN; TAB(30); WC930 IF DW>.02 THEN 820940 MW=56577!: SP=8: RS=56950 POKE MW, SP: FOR J=1 TO 100: NEXT J960 POKE MW, RS: FOR J=l TO 100: NEXT J970 WO=WN980 TI$="0M0j00t '990 X=VAL(TI$): IF X<30 THEN 990995 ET=ET+X1000 POKE MW, SR: FOR J=1 TO 100: NEXT J1010 POKE MW, RS: FOR J=l TO 100: NEXT J1020 TI$ '1000000111030 X=VAL(TI$): IF X<30 THEN 10301035 ET = ET+X1040 GOSUB 90001050 WN=W1060 WC=( (TUVW-WN)/ (WN-TW) )*1001070 DW=(TUVW-TW) * (/(WN-TW) -(l/(WO-TW)))1080 DW=(INT(DW*1000000!) )/1000000!1090 WN=(INT(WN*100) )/1001100 WC=(INT(WC*1000) )/10001101 TT=TT+VAL(TI$)1102 IF F2%=0 THEN GOTO 11101 1 05 P R INT # 4";ET;CHR4(16)CHR$(49)CHR$(53);TT;CHR$(16)CHR$(50)CHR$(57) ;WN;
G-5
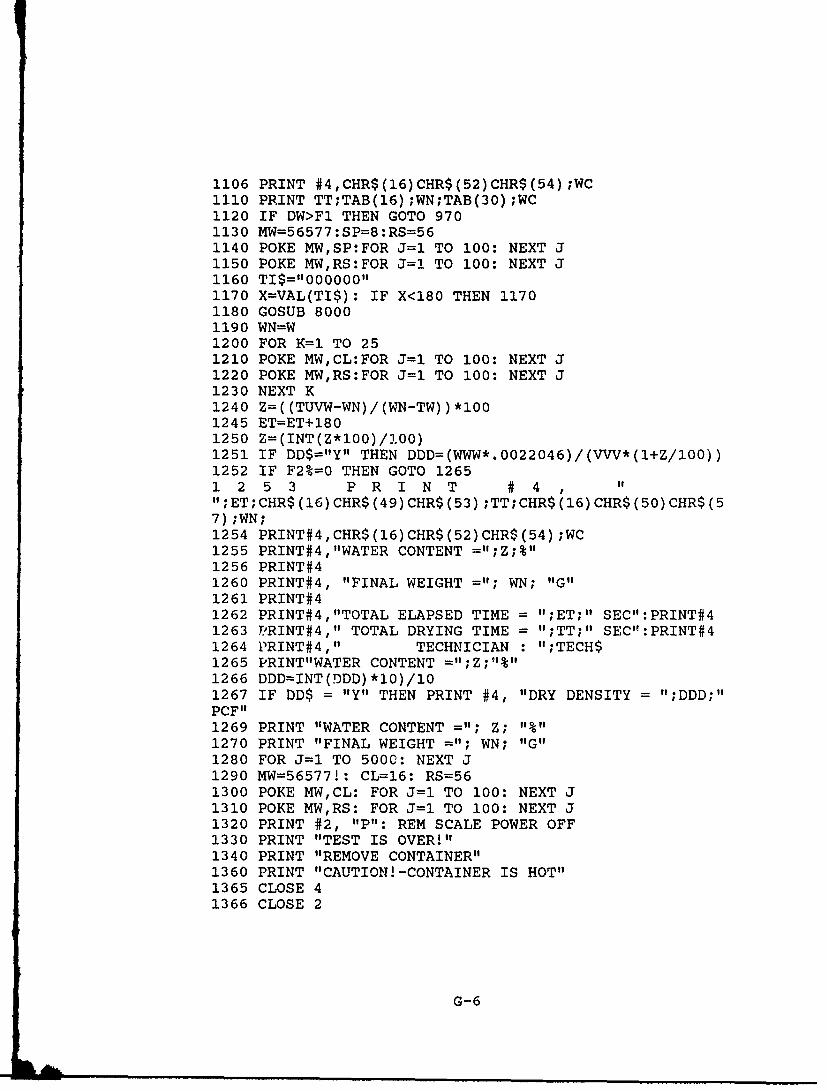
1106 PRINT #4,CHR$(16)CHR$(52)CHR$(54);WC1110 PRINT TT;TAB(16) ;WN;TAB(30) ;WC1120 IF DW>FI THEN GOTO 9701130 MW=56577:SP=8:RS=561140 POKE MW,SP:FOR J=l TO 100: NEXT J1150 POKE MW,RS:FOR J=! TO 100: NEXT J1160 TI$="000000 ''
1170 X=VAL(TI$): IF X<180 THEN 11701180 GOSUB 80001190 WN=W1200 FOR K=1 TO 251210 POKE MW,CL:FOR J=l TO 100: NEXT J1220 POKE MW,RS:FOR J=l TO 100: NEXT J1230 NEXT K1240 Z= ((TUVW-WN) / (WN-TW)) *i001245 ET=ET+1801250 Z=(INT(Z*100)/100)1251 IF DD$="Y" THEN DDD=(WWW*.0022046)/(VVV*(I+Z/100))1252 IF F2%=0 THEN GOTO 12651 2 5 3 P R I N T # 4,";ET;CHR$ (16) CHR$(49) CHR$(53) ;TT;CHR$(16) CHR$(50) CHR$(57) ;WN;1254 PRINT#4,CHR$(16)CHR$(52)CHR$(54) ;WC1255 PRINT#4,"WATER CONTENT =";Z;%"1256 PRINT#41260 PRINT#4, "FINAL WEIGHT ="; WN; "G"1261 PRINT#41262 PRINT#4,"TOTAL ELAPSED TIME = ";ET;" SEC":PRINT#41263 PRINT#4," TOTAL DRYING TIME = ";TT;" SEC":PRINT#41264 PRINT#4," TECHNICIAN : ";TECH$1265 PRINT"WATER CONTENT =" ;Z ;"%"1266 DDD=INT(DDD)*10)/101267 IF DD$ = "Y" THEN PRINT #4, "DRY DENSITY =";DDD;"PCF"1269 PRINT "WATER CONTENT =" ; Z; "1%111270 PRINT "FINAL WEIGHT ="; WN; "G"1280 FOR J=l TO 5000: NEXT J1290 MW=56577!: CL=16: RS=561300 POKE MW,CL: FOR J=l TO 100: NEXT J1310 POKE MW,RS: FOR J=l TO 100: NEXT J1320 PRINT #2, "P": REM SCALE POWER OFF1330 PRINT "TEST IS OVER!"1340 PRINT "REMOVE CONTAINER"1360 PRINT "CAUTION!-CONTAINER IS HOT"1365 CLOSE 41366 CLOSE 2
G-6

-F
1367 INPUT "PRESS RETURN TO RESET FOR NEXT TEST"; E$1368 GOTO 101370 END2000 REM SUBROUTINE TO READ THE SCALE2003 MW=56577!: SP=8: RS=562005 POKE MW,SP: FOR J=l TO 100: NEXT J2007 POKE MW,RS: FOR J=l TO 100: NEXT J2020 PRINT #2, "Q": FOR J=l TO 500: NEXT J2030 FOR J=l TO 172040 GET #2,A$(J)2050 IF A$(J)="''' THEN 20402060 NEXT J2070 IF A$(J)=CHR$(103) THEN A$(3) = CHR$(71)2080 B$=A$(1)+A$(2)2 0 9 0DT$=A$(5)+A$(6)+A$(7)+A$(8)+A$(9)+A$(10)+A$(11)+A$(12)+A$(13)2100 IF B$="US" THEN GOTO 20202105 F=VAL(DT$)2110 W=1! * F2113 MW=56577: SR=32: RS=562115 POKE MW,SR: FOR J=l TO 100: NEXT J2117 POKE MW,RS: FOR J=l TO 100: NEXT J2120 RETURN3000 REM SUBROUTINE TO INITIALIZE3010 REM I/O PORT FOR MICROWAVE3020 REM OVEN CONTROL3030 Y=PEEK(56579)3040 Y=Y OR 563050 POKE 56579,Y3060 POKE 56579,563070 POKE 56579,83080 FOR J=l TO 100: NEXT J3090 POKE 56577,563100 RETURN5000 PRINT #2, "Q": FOR J=l TO 50: NEXT J5010 FOR J=l TO 175020 GET#2,A$(J)5030 IF A$(J)<>"" THEN FLAG=I5040 NEXT J5050 RETURN6000 REM OPERATOR INPUT6002 INPUT "WHAT IS THE DISTRICT: "; DS$6010 INPUT "WHAT IS THE DATE: "; D$6020 INPUT "WHAT IS THE PROJECT: "; P$6022 INPUT "WHAT IS THE CONTRACT: "; CTR$
G-7
A-.A..

6030 INPUT "WHAT IS THE LOCATION: "; LO$6035 INPUT "WHAT IS THE TIME: "; TM$6037 INPUT "WHAT IS THE SAMPLE NO.: "; SN$6038 INPUT "WHAT IS THE CLASSIFICATION: "; CL$6039 INPUT "TECHNICIAN: "; TECH$6040 INPUT "IS THIS A CLEAN SAND?"; $6045 FI=.0026050 IF I$="Y" THEN F1=0!: GOTO 60806060 IF I$<>"N" THEN GOTO 60406080 INPUT "ARE YOU USING A PRINTER?"; I$6085 F2%=06090 IF I$="Y" THEN F2%=I: GOTO 61106100 IF I$<>"N" THEN GOTO 60806110 INPUT "WANT TO COMPUTE DRY DENSITY?"; DD$6112 IF DD$="Y" THEN INPUT "ENTER DENSITY SPECIMEN VOLUMEIN CUBIC FEET: ", VVV6115 IF DD$="Y" THEN INPUT "ENTER DENSITY SPECIMEN WETWEIGHT IN GRAMS: ", WWW6120 IF DD$<>"N" AND DD$<>"Y" THEN GOTO 61106130 RETURN7000 REM HEADER INFO7010 PRINT#4," MICROWAVEOVEN" : PRINT#47020 PRINT#4," WATER CONTENTDETERMINATION" : PRINT#47022 PRINT#4," DISTRICT. ";DS$7024 PRINT#4,CHR$(16)CHR$(50)CHR$(57) ;"PROJECT: "P$;7025 PRINT#4,CHR$(16)CHR$(53)CHR$(52) ;"CONTRACT:";CTR$: PRINT#47027 PRINT#4," LOCATION: ";LO$;7030 PRINT#4,CHR$(16)CHR$(51)CHR$(50);"DATA: "D$7032 PRINT#4,CHR$(16)CHR$(53)CHR$(50) ;"TIME: "TM$:PRINT#47035 PRINT#4," SAMPLE NO.: ";SN$;7040 PRINT#4,CHR$(16)CHR$(50)CHR$(50) ;"CLASSIFICATION:" ;CL$ ;7050 PRINT#4,CHR$(16)CHR$(52)CHR$(55) ;"TARE WEIGHT (G):";TARE7065 REM HEADER INFO7070 PRINT" MICROWAVE OVEN"7075 PRINT" WATER CONTENT DETERMINATION"7077 PRINT"DATE: "; D$7080 PRINT"PROJECT NO: "; P$7085 PRINT"JOB NUMBER: "' J$7090 RETURNq7095 IF F2%00 THEN GOTC 7200
G-8
Li"

7100 PRINT#4, " ELAPSED DRYING WEIGHTWATER"
7110 PRINT#4, "TIME (SEC) TIME (SEC) (G)CONTENT (%)"
7120 PRINT#4, "it
7129 PRINT#4, 0 0"';7 1 3 0PRINT#4,CHR$(16)CHR$(50)CHR$57) ;WETW;CHR$(16)CHR$(52)CHR$ (54) " 0"7200 PRINT"TOTAL TIME WET WEIGHT WATER"7210 PRINT" SEC G
7220 PRINT" "7230 PRINT " 0";TAB(16) ;WETW;TAB(31) ;"0"
7240 RETURN8000 REM SUBROUTINE TO READ THE SCALE8010 FOR J=l TO 17:GET #2,A$(J) :NEXT J8020 PRINT #2, "Q": FOR J=l TO 500: NEXT J8030 FOR J=l TO 178040 GET #2,A$(J)8050 IF A$(J)=" " THEN 80408060 NEXT J8070 IF A$(I)=CHR$(103) THEN A$(I)=CHR$(71)8080 B$=A$(i)+A$(2)8 0 9 0DT$=A$(5)+A$(6)+A$(7)+A$(8)+A$(9)+A$(10)+A$(11)+A$(12)+A$(13)8100 IF B$="US" THEN GOTO 8020
8105 F=VAL(DT$)8110 W=F8120 RETURN9000 REM SUBROUTINE TO READ THE SCALE9003 MW=56577!: SP=8: RS=569005 POKE MW,SP: FOR J=l TO 100: NEXT J9007 POKE MW,RS: FOR J=l TO 100: NEXT J9020 PRINT #2, "Q": FOR J=l TO 500: NEXT J9030 FOR J=l TO 179040 GET #2,A$(J)9050 IF A$(J)="" THEN 90409060 NEXT J9070 IF A$(I)=CHR$(103) THEN A$(I)=CHR$(71)9080 B$=A$(I)+A$(2)
G-9

9 0 9 0DT$=A$(5)+A$(6)+A$(7)+A$(8) A$(9)+A$(10)+A$(11)+A$(12)+A$(13)9100 IF B$="US" GOTO 90209105 F=VAL(DT$)9110 W=!*F9120 RETURN
G-10

APPENDlX H
DATA TABLES
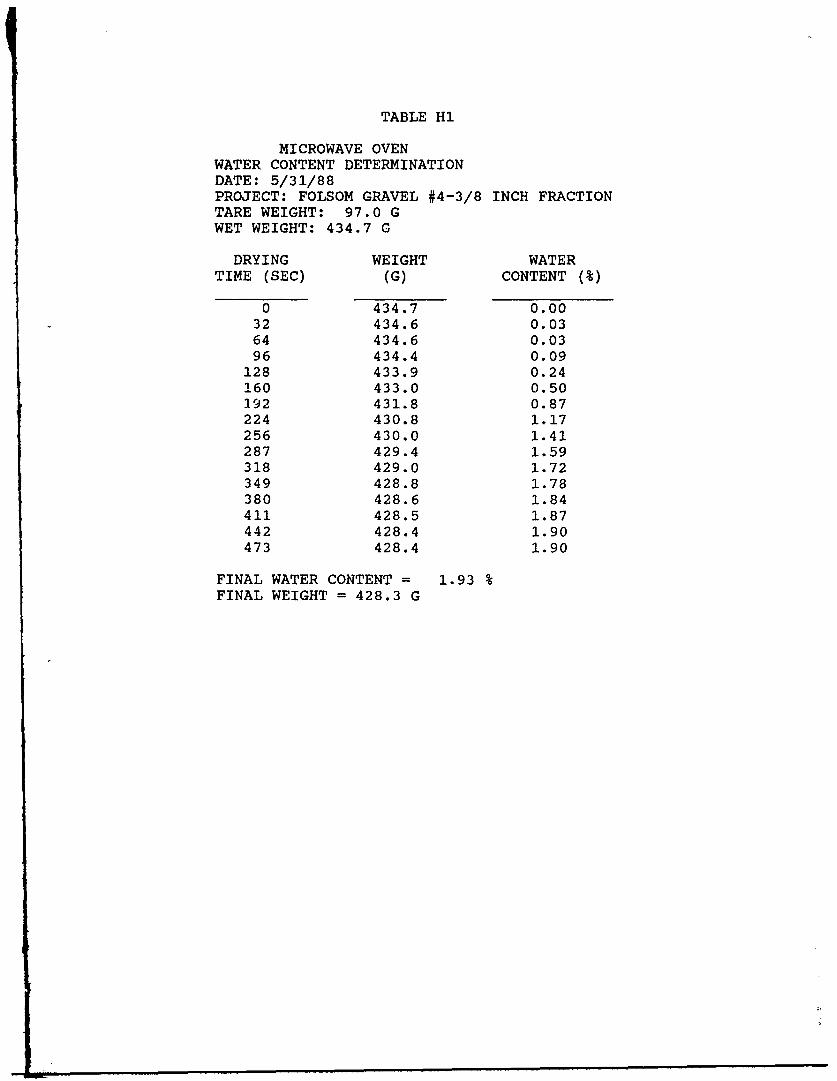
TABLE HI
MICROWAVE OVENWATER CONTENT DETERMINATIONDATE: 5/31/88PROJECT: FOLSOM GRAVEL #4-3/8 INCH FRACTIONTARE WEIGHT: 97.0 GWET WEIGHT: 434.7 G
DRYING WEIGHT WATERTIME (SEC) (G) CONTENT (%)
0 434.7 0.0032 434.6 0.0364 434.6 0.0396 434.4 0.09
128 433.9 0.24160 433.0 0.50192 431.8 0.87224 430.8 1.17256 430.0 1.41287 429.4 1.59318 429.0 1.72349 428.8 1.78380 428.6 1.84411 428.5 1.87442 428.4 1.90473 428.4 1.90
FINAL WATER CONTENT = 1.93 %FINAL WEIGHT = 428.3 G
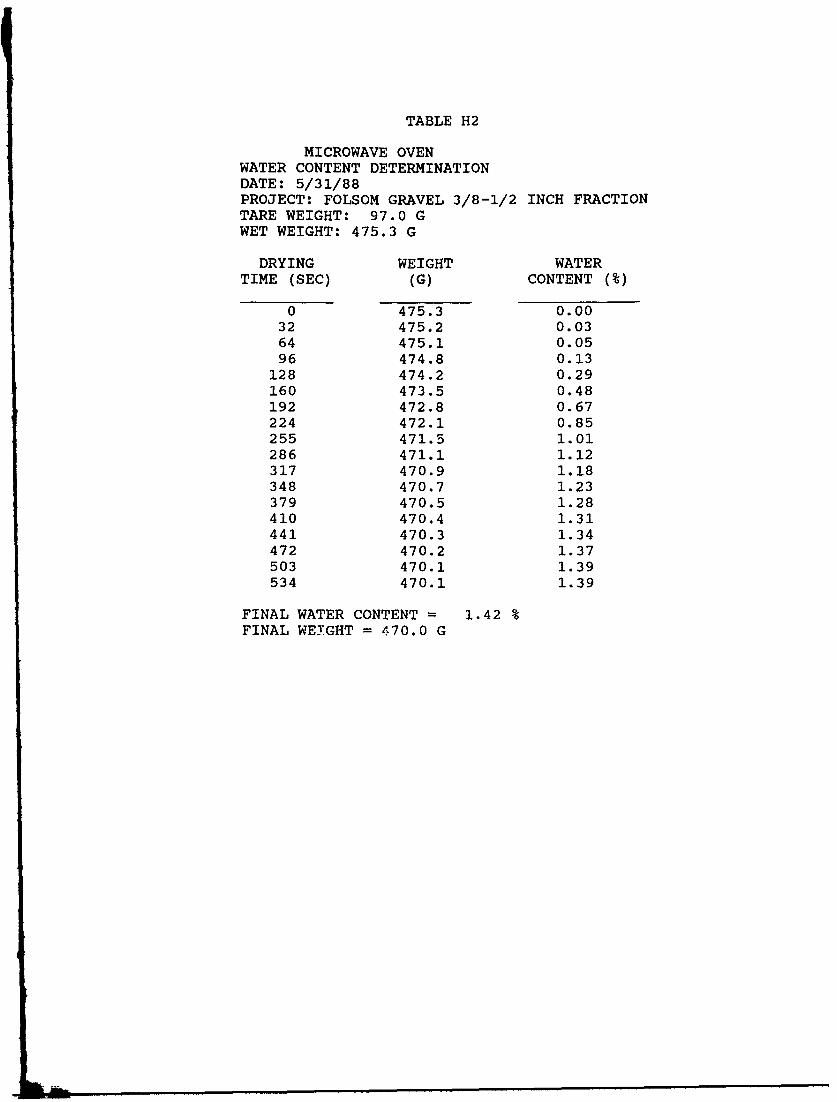
TABLE H2
MICROWAVE OVENWATER CONTENT DETERMINATIONDATE: 5/31/88PROJECT: FOLSOM GRAVEL 3/8-1/2 INCH FRACTIONTARE WEIGHT: 97.0 GWET WEIGHT: 475.3 G
DRYING WEIGHT WATERTIME (SEC) (G) CONTENT (%)
0 475.3 0.0032 475.2 0.0364 475.1 0.0596 474.8 0.13
128 474.2 0.29160 473.5 0.48192 472.8 0.67224 472.1 0.85255 471.5 1.01286 471.1 1.12317 470.9 1.18348 470.7 1.23379 470.5 1.28410 470.4 1.31441 470.3 1.34472 470.2 1.37503 470.1 1.39534 470.1 1.39
FINAL WATER CONTENT = 1.42 %FINAL WEIGHT = 470.0 G
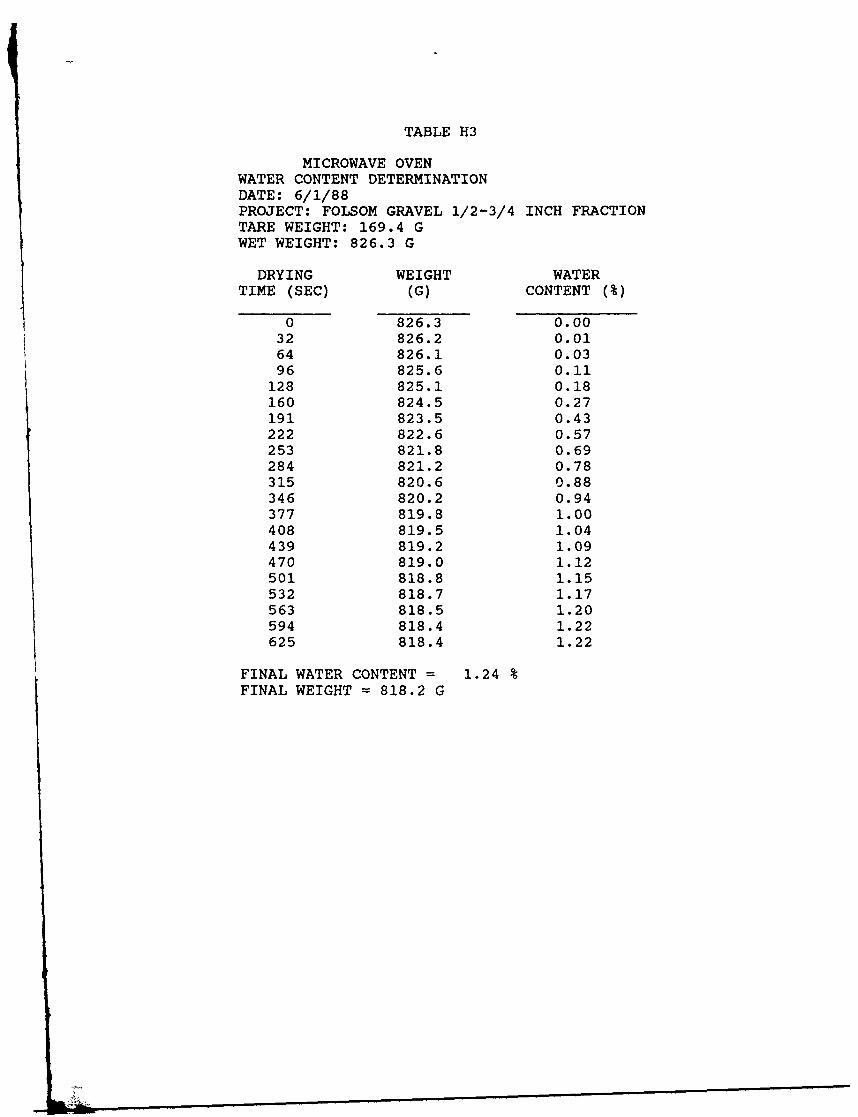
TABLE H3
MICROWAVE OVENWATER CONTENT DETERMINATIONDATE: 6/1/88PROJECT: FOLSOM GRAVEL 1/2-3/4 INCH FRACTIONTARE WEIGHT: 169.4 GWET WEIGHT: 826.3 G
DRYING WEIGHT WATERTIME (SEC) (G) CONTENT (%)
0 826.3 0.0032 826.2 0.0164 826.1 0.0396 825.6 0.11128 825.1 0.18160 824.5 0.27191 823.5 0.43222 822.6 0.57253 821.8 0.69284 821.2 0.78315 820.6 0.88346 820.2 0.94377 819.8 1.00408 819.5 1.04439 819.2 1.09470 819.0 1.12501 818.8 1.15532 818.7 1.17563 818.5 1.20594 818.4 1.22625 818.4 1.22
FINAL WATER CONTENT = 1.24 %FINAL WEIGHT = 818.2 G

TABLE H4
MICROWAVE OVENWATER CONTENT DETERMINATIONDATE: 6/1/88PROJECT: FOLSOM GRAVEL 3/4-1 INCH FRACTIONTARE WEIGHT: 169.4 GWET WEIGHT: 886.7 G
DRYING WEIGHT WATERTIME (SEC) (G) CONTENT (%)
0 886.7 0.0032 886.6 0.0164 886.4 0.0496 885.9 0.11
128 884.9 0.25160 883.7 0.42192 882.4 0.60224 881.4 0.74256 880.6 0.86288 880.0 0.94319 879.0 1.09350 878.5 1.16381 878.1 1.21412 877.8 1.26443 877.6 1.28474 877.5 1.30505 877.3 1.33536 877.2 1.34567 877.1 1.36598 877.0 1.37629 877.0 1.37
FINAL WATER CONTENT = 1.38 %FINAL WEIGHT = 876.9 G

TABLE H5
MICROWAVE OVENWATER CONTENT DETERMINATIONDATE: 6/16/88PROJECT: FOLSOM GRAVEL 1-1.5 INCH FRACTIONTARE WEIGHT: 169.4 GWET WEIGHT: 887.9 G
DRYING WEIGHT WATERTIME (SEC) (G) CONTENT (%)
0 887.9 0.0032 887.9 0.0064 887.8 0.0196 887.5 0.05128 887.2 0.10160 886.8 0.15192 886.4 0.21224 886.0 0.26256 885.6 0.32287 885.2 0.38318 885.0 0.41349 884.9 0.42380 884.7 0.45411 884.6 0.46442 884.5 0.47473 884.4 0.49504 884.3 0.50535 884.2 0.52566 884.2 0.52
FINAL WATER CONTENT = 0.53 %FINAL WEIGHT = 884.1 G

TABLE H6
MICROWAVE OVENWATER CONTENT DETERMINATIONDATE: 6/8/88PROJECT: WARREN COUNTY PEA GRAVELTARE WEIGHT: 158.1 GWET WEIGHT: 470.6 G
DRYING WEIGHT WATERTIME (SEC) (G) CONTENT (%)
0 470.6 0.0032 470.5 0.0364 470.4 0.0696 470.4 0.06128 470.3 0.10159 470.1 0.16190 469.9 0.22221 469.6 0.32252 469.2 0.45283 468.7 0.61314 468.1 0.81345 467.5 1.00376 466.9 1.20407 466.4 1.36438 465.8 1.56469 465.3 1.73500 464.9 1.86531 464.5 1.99562 464.2 2.09593 463.9 2.19624 463.6 2.29655 463.4 2.36686 463.2 2.42717 463.0 2.49748 462.8 2.56779 462.7 2.59810 462.6 2.63841 462.5 2.66872 462.5 2.66
FINAL WATER CONTENT = 2.69 %FINAL WEIGHT = 462.4 G

TABLE H7
MICROWAVE OVENWATER CONTENT DETERMINATIONDATE: 6/23.88PROJECT: WARREN COUNTY RED CLAY GRAVELTARE WEIGHT: 142.2 GWET WEIGHT: 559.5 G
DRYING WEIGHT WATERTIME (SEC) (G) CONTENT (%)
0 559.5 0.0032 559.5 0.0064 559.3 0.0596 558.9 0.14
128 557.5 0.48160 554.4 1.24192 551.1 2.05224 548.4 2.73256 546.2 3.29288 544.5 3.73319 543.1 4.09350 542.0 4.38381 541.1 4.61412 540.4 4.80443 539.9 4.93474 539.5 5.03505 539.2 5.11536 539.0 5,17567 538.9 5.19598 538.8 5.22629 538.7 5.24660 538.6 5.27691 538.6 5.27
FINAL WATER CONTENT 5.27 %FINAL WEIGHT = 538.6 G

TABLE H8
MICROWAVE OVENWATER CONTENT DETERMINATIONDATE: 6/24/88PROJECT: WARNER ROBBINS AFB / GEORGIA RED CLAYTARE WEIGHT: 59.1 GWET WEIGHT: 224.3 G
DRYING WEIGHT WATERTIME (SEC) (G) CONTENT (%)
0 224.3 0.0032 224.1 0.1264 222.7 0.9896 218.4 3.70128 214.7 6.17160 211.4 8.47192 208.6 10.50224 206.3 12.23255 204.7 13.46286 203.6 14.32317 202.8 14.96348 202.3 15.36379 201.9 15.69410 201.8 15.77441 201.7 15.85472 201.6 15.93503 201.6 15.93
FINAL WATER CONTENT = 15.92 %FINAL WEIGHT = 201.6 G

TABLE H9
MICROWAVE OVENWATER CONTENT DETERMINATIONDATE: 9/7/88PROJECT: NPD MATERIAL STATION 30+04.7 ON CLTARE WEIGHT: 129.1 GWET WEIGHT: 433.1 G
DRYING WEIGHT WATERTIME (SEC) (G) CONTENT (%)
0 433.1 0.0030 433.1 0.0060 433.0 0.0390 432.4 0.23
120 429.3 1.26150 423.6 3.22180 417.7 5.34210 411.9 7.50240 406.4 9.63270 400.9 11.85300 395.7 14.03330 390.7 16.21361 385.8 18.43391 381.4 20.49421 377.2 22.53451 373.4 24.44481 370.3 26.04511 367.5 27.52541 365.0 28.87571 363.0 29.97601 361.2 30.98631 359.7 31.83661 358.6 32.46691 357.8 32.92721 357.3 33.22751 356.9 33.45781 356.5 33.69811 356.3 33.80
FINAL WATER CONTENT = 33.92 %FINAL WEIGHT = 356.1 G

ITABLE H10
MICROWAVE OVENWATER CONTENT DETERMINATIONDATE: 9/7/88PROJECT: NPD MATERIAL STATION 24+21.2 ON CLTARE WEIGHT: 140.7 GWET WEIGHT: 451.1 G
DRYING WEIGHT WATERTIME (SEC) (G) CONTENT (%)
0 451.1 0.0030 451.1 0.0060 451.0 0.0390 450.6 0.16
120 447.8 1.07150 442.2 2.95180 436.1 5.08210 430.3 7.18240 424.5 9.37270 418.9 11.57300 413.5 13.78330 408.3 15.99361 403.3 18.19391 398.6 20.35421 394.2 22.44451 390.1 24.45481 386.6 26.22511 383.6 27.78541 381.1 29.11571 378.9 30.30601 377.0 31.34631 375.5 32.18661 374.2 32.92691 373.3 33.43721 372.7 33.78751 372.2 34.07781 371.9 34.24
FINAL WATER CONTENT = 34.47 %FINAL WEIGHT = 371.5 G
I

TABLE HIl
MICROWAVE OVENWATER CONTENT DETERMINATIONDATE: 9/7/88PROJECT: NPD MATERIAL STATION 11.02TARE WEIGHT: 129.1 GWET WEIGHT: 401.4 G
DRYING WEIGHT WATERTIME (SEC) (G) CONTENT (%)
0 401.4 0.0030 401.4 0.0060 401.4 0.0090 401.0 0.15
120 397.4 1.49150 391.5 3.77180 385.7 6.12210 379.9 8.57240 374.3 11.05270 368.9 13.55300 363.5 16.17330 358.3 18.80361 353.3 21.45391 348.6 24.05421 344.1 26.65451 340.0 29.11481 336.4 31.35511 333.2 33.41541 330.5 35.20571 328.3 36.70601 326.5 37.94631 325.0 39.00661 323.8 39.86691 322.9 40.51721 322.3 40.94751 321.8 41.31-81 321.5 41.53811 321.2 41.75841 321.0 41.90
FINAL WATER CONTENT = 42.04 %FINAL WEIGHT = 320.8 G

TABLE H12
MICROWAVE OVENWATER CONTENT DETERMINATIONDATE: 9/7/88PROJECT: NPD MATERIAL STATION 11.02TARE WEIGHT: 142.2 GWET WEIGHT: 433.4 G
DRYING WEIGHT WATERTIME (SEC) (G) CONTENT (%)
0 433.4 0.0030 433.3 0.0360 433.2 0.0790 433.0 0.14
120 429.9 1.22150 424.3 3.22180 418.5 5.39210 412.2 7.85240 407.0 9.97270 401.5 12.30300 396.1 14.69330 390.9 17.09361 385.8 19.54391 380.9 21.99421 376.3 24.39451 372.0 26.72481 368.1 28.91511 364.5 30.99541 361.6 32.72571 359.2 34.19601 357.2 35.44631 355.5 36.52661 354.1 37.42691 353.0 38.19721 352.- 38.60751 351.9 38.93781 351.4 39.20811 351.1 39.40
FINAL WATER CONTENT = 39.53 %FINAL WEIGHT = 350.9 G

TABLE H13
MICROWAVE OVENWATER CONTENT DETERMINATIONDATE: 9/9/88PROJECT: 50% PEA GRAVEL AND PULLOUT CLAYTARE WEIGHT: 149.7 GWET WEIGHT: 481.9 G
DRYING WEIGHT WATERTIME (SEC) (G) CONTENT (%)
0 481.9 0.0030 481.8 0.0360 481.4 0.1590 478.6 1.00120 473.5 2.59150 467.5 4.53180 461.6 6.51210 456.1 3.42240 451.2 10.18270 447.2 11.66300 443.9 12.92330 441.1 14.00361 438.9 14.87391 437.3 15.51421 436.1 15.99451 435.4 16.27481 435.0 16.44511 434.7 16.56541 434.5 16.64571 434.4 16.68601 434.3 16.73631 434.2 16.77F-1 434.1 16.816 1 434.0 16.85721 434.0 16.85
FINAL WATER CONTENT = 16.88 %FINAL WEIGHT = 433.9 G

TABLE H14
MICROWAVE OVENWATER CONTENT DETERMINATIONDATE: ?/23/88PROJECT: 50% SAND AND PULLOUT CLAYTARE WEIGHT: 101.6 GWET WEIGHT: 262.9 G
DRYING WEIGHT WATERTIME (SEC) (G) CONTENT (%)
0 262.9 0.0030 262.8 0.0660 261.0 1.1990 256.6 4.06120 251.9 7.32150 254.9 10.25180 244.6 12.80210 242.0 14.89240 240.0 16.55270 238.4 17.91300 237.3 18.86330 236.5 19.57361 235.9 20.10391 235.6 20.37421 235.3 20.64451 235.2 20.73481 235.1 20.82511 235.0 20.91541 234.9 21.00571 234.9 21.00
FINAL WATER CONTENT = 21.90 %FINAL WEIGHT = 234.9 G
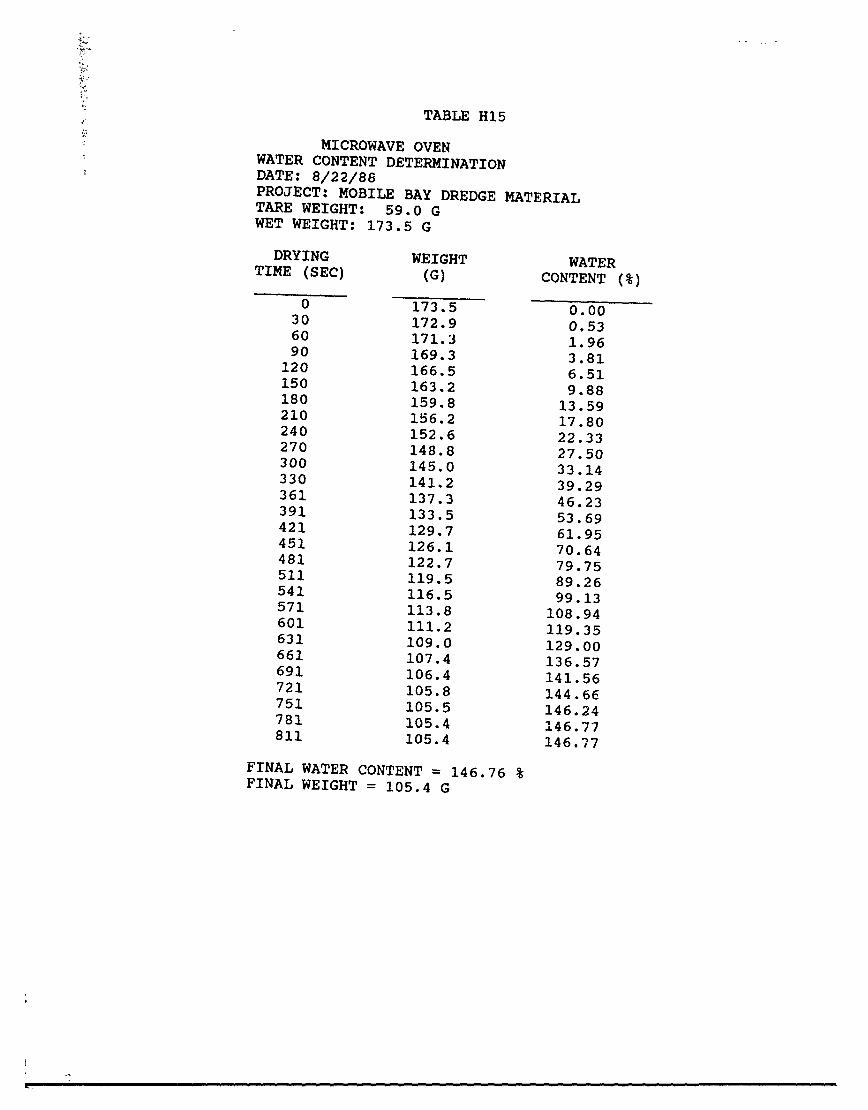
TABLE H15
MICROWAVE OVENWATER CONTENT DETERMINATIONDATE: 8/22/88PROJECT: MOBILE BAY DREDGE MATERIALTARE WEIGHT: 59.0 GWET WEIGHT: 173.5 G
DRYING WEIGHT WATERTIME (SEC) (G) CONTENT (%)
0 173.5 0.0030 172.9 0.5360 171.3 1.9690 169.3 3.81
120 166.5 6.51150 163.2 9.88180 159.8 13.59210 156.2 17.80240 152.6 22.33270 148.8 27.50300 145.0 33.14330 141.2 39.29361 137.3 46.23391 133.5 53.69421 129.7 61.95451 126.1 70.64481 122.7 79.75511 119.5 89.26541 116.5 99.13571 113.8 108.94601 111.2 119.35631 109.0 129.00661 107.4 136.57691 106.4 141.56721 105.8 144.66751 105.5 146.24781 105.4 146.77811 105.4 146.77
FINAL WATER CONTENT = 146.76FINAL WEIGHT = 105.4 G

TABLE H16
MICROWAVE OVENWATER CONTENT DETERMINATIONDATE: 8/24/88PROJECT: PASCAGOULA RIVER DREDGE MATERIALTARE WEIGHT: 96.9 GWET WEIGHT: 224.7 G
DRYING WEIGHT WATERTIME (SEC) (G) CONTENT (%)
0 224.7 0.0030 224.4 0.2360 223.5 0.9590 222.5 1.75
120 220.6 3.31150 218.4 5.18180 216.0 7.30210 213.4 9.70240 210.6 12.40270 207.8 15.24300 204.9 18.33330 201.9 21.71361 198.8 25.42391 195.6 29.48421 192.3 33.96451 188.9 25.91481 185.4 44.41511 181.7 50.71541 178.0 57.58571 174.3 65.12601 170.6 73.40631 166.8 82.83661 163.0 93.34691 159.3 104.81721 155.7 117.35751 152.2 131.10781 148.9 145.77811 145.8 161.35841 142.7 179.04871 140.2 195.15901 137.8 212.47931 136.2 225.19961 135.3 232.81991 134.8 237.20
1022 134.5 239.891052 134.3 241.711082 134.2 242.631112 134.2 242.63
FINAL WATER CONTENT = 242.62FINAL WEIGHT = 134.2 G

TABLE H17
MICROWAVE OVENWATER CONTENT DETERMINATIONDATE: 6/16/88PROJECT: FLY ASH-AIR DRYTARE WEIGHT: 167.2 GWET WEIGHT: 311.1 G
DRYING WEIGHT WATERTIME (SEC) (G) CONTENT (%)
0 311.1 0.0032 311.1 0.0064 311.1 0.0096 311.0 0.07128 311.0 0.07160 311.0 0.07192 311.0 0.07223 311.0 0.07
FINAL WATER CONTENT 0.06 %FINAL WEIGHT = 311.0 G

TABLE H18
MICROWAVE OVENWATER CONTENT DETERMINATIONDATE: 6/22/88PROJECT: FLY ASH TESTED IMMEDIATELY AFTER MIXINGTARE WEIGHT: 97.4 GWET WEIGHT: 270.8 G
DRYING WEIGHT WATERTIME (SEC) (G) CONTENT (%)
0 270.8 0.0032 270.8 0.0064 270.6 0.1296 270.2 0.35
128 268.1 1.58160 266.0 2.85192 264.4 3.83224 263.1 4.65255 262.3 5.15286 261.7 5.54317 261.2 5.86348 260.8 6.12379 260.5 6.32410 260.2 6.51441 259.9 6.71472 259.7 6.84503 259.5 6.97534 259.3 7.10565 259.1 7.24596 258.9 7.37627 258.7 7.50658 258.6 7.57689 258.4 7.70720 258.3 7.77751 258.2 7.847C2 258.1 7.90813 258.0 7.97844 257.9 8.04875 257.9 8.04
FINAL WATER CONTENT = 8.10 %FINAL WEIGHT = 257.8 G
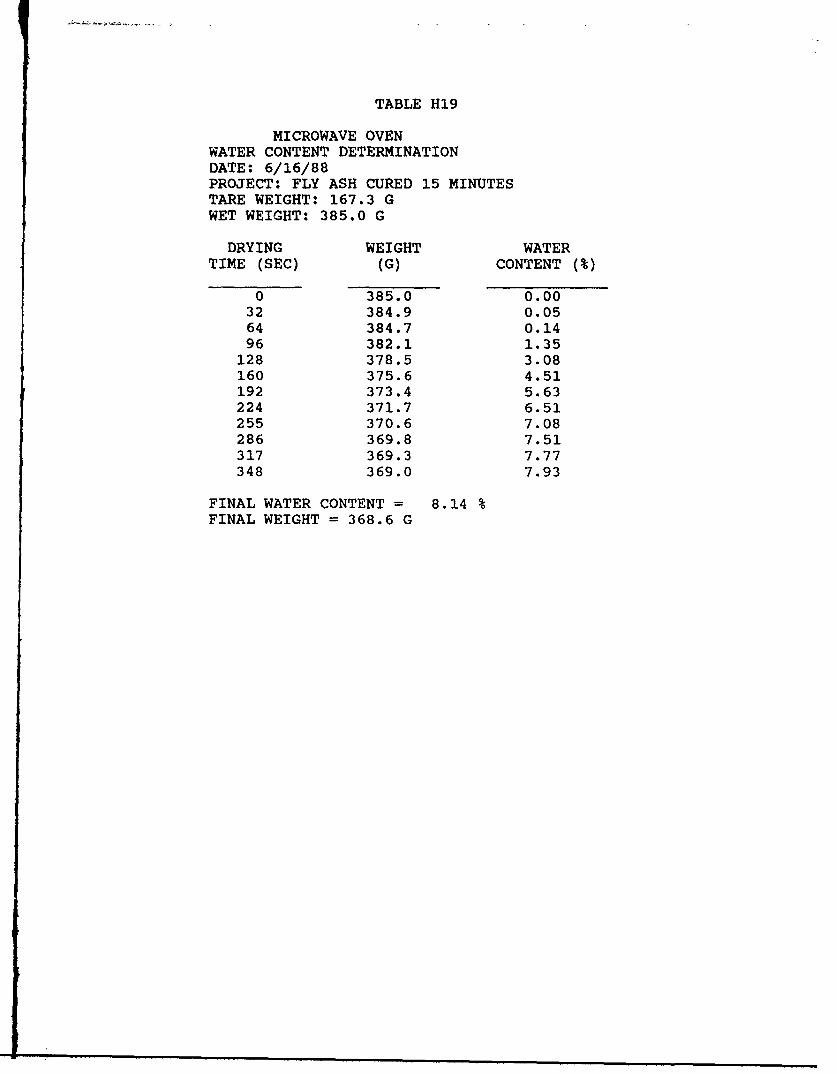
TABLE H19
MICROWAVE OVENWATER CONTENT DETERMINATIONDATE: 6/16/88PROJECT: FLY ASH CURED 15 MINUTESTARE WEIGHT: 167.3 GWET WEIGHT: 385.0 G
DRYING WEIGHT WATERTIME (SEC) (G) CONTENT (%)
0 385.0 0.0032 384.9 0.0564 384.7 0.1496 382.1 1.35128 378.5 3.08160 375.6 4.51192 373.4 5.63224 371.7 6.51255 370.6 7.08286 369.8 7.51317 369.3 7.77348 369.0 7.93
FINAL WATER CONTENT = 8.14 %FINAL WEIGHT = 368.6 G

TABLE H20
MICROWAVE OVENWATER CONTENT DETERMINATIONDATE: 6/24/88PROJECT: FLY ASH CURED 2 DAYSTARE WEIGHT: 97.5 GWET WEIGHT: 316.4 G
DRYING WEIGHT WATERTIME (SEC) (G) CONTENT (%)
0 316.4 0.0032 316.2 0.0964 316.1 0.1496 315.3 0.50
128 312.8 1.67160 310.7 2.67192 309.2 3.40223 308.4 3.79254 307.8 4.09285 307.2 4.39316 306.6 4.69347 306.2 4.89378 305.7 5.14409 305.3 5.34440 304.9 5.54471 304.6 5.70502 304.3 5.85533 304.0 6.00564 303.7 6.16595 303.5 6.26626 303.2 6.42657 303.0 6.52688 302.8 6.62719 302.6 6.73750 302.5 6.78781 302.3 6.88812 302.2 6.94843 302.1 6.99874 302.0 7.04905 301.9 7.09936 301.8 7.15967 301.7 7.20998 301.6 7.251029 301.6 7.25
FINAL WATER CONTENT = 7.30 %FINAL WEIGHT = 301.5 G

TABLE H21
MICROWAVE OVENWATER CONTENT DETERMINATIONDATE: 6/22/88PROJECT: FLY ASH CURED 4.5 DAYSTARE WEIGHT: 140.0 GWET WEIGHT: 370.4 G
DRYING WEIGHT WATERTIME (SEC) (G) CONTENT (%)0 370.4 0.00
32 370.3 0.0464 370.1 0.1396 368.8 0.70
128 366.0 1.95160 363.7 2.99192 362.0 3.78224 360.8 4.37255 359.9 4.77286 359.2 5.11317 358.6 5.40348 358.1 5.64379 357.7 5.83
FINAL WATER CONTENT 6.07 %FINAL WEIGHT = 357.2 G

TABLE H22
MICROWAVE OVENWATER CONTENT DETERMINATIONDATE: 7/20/88PROJECT: DIRECT COURSE GYPSUM RICH SOILTARE WEIGHT: 97.2 GWET WEIGHT: 368.8 G
DRYING WEIGHT WATERTIME (SEC) (G) CONTENT (%)
0 368.8 0.0030 368.8 0.0060 368.5 0.1390 367.7 0.49
120 366.2 1.16150 364.6 1.88180 363.1 2.58210 361.7 3.23240 360.4 3.84270 359.1 4.46300 358.1 4.95330 357.2 5.39361 356.3 5.83391 355.4 6.27421 354.5 6.72451 353.8 7.07481 353.0 7.48511 352.2 7.89541 351.5 8.25571 350.8 8.61601 350.2 8.93631 349.5 9.29661 348.9 9.61691 348.3 9.93721 347.7 10.25751 347.2 10.52781 346.7 10.78811 346.2 11.06841 345.7 11.33871 345.3 11.55901 344.8 11.82931 344.4 12.04961 344.1 12.21
FINAL WATER CONTENT = 12.48 %FINAL WEIGHT = 343.6 G
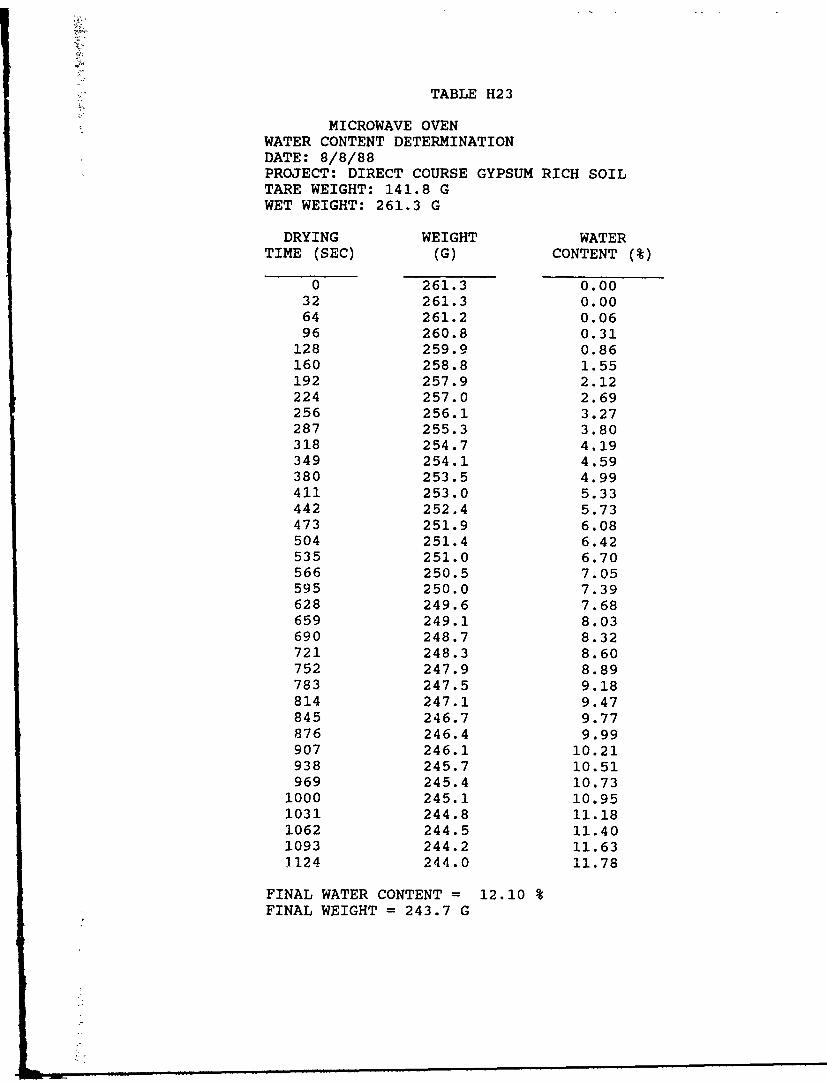
TABLE H23
MICROWAVE OVENWATER CONTENT DETERMINATIONDATE: 8/8/88PROJECT: DIRECT COURSE GYPSUM RICH SOILTARE WEIGHT: 141.8 GWET WEIGHT: 261.3 G
DRYING WEIGHT WATERTIME (SEC) (G) CONTENT (%)
0 261.3 0.0032 261.3 0.0064 261.2 0.0696 260.8 0.31
128 259.9 0.86160 258.8 1.55192 257.9 2.12224 257.0 2.69256 256.1 3.27287 255.3 3.80318 254.7 4.19349 254.1 4.59380 253.5 4.99411 253.0 5.33442 252.4 5.73473 251.9 6.08504 251.4 6.42535 251.0 6.70566 250.5 7.05595 250.0 7.39628 249.6 7.68659 249.1 8.03690 248.7 8.32721 248.3 8.60752 247.9 8.89783 247.5 9.18814 247.1 9.47845 246.7 9.77876 246.4 9.99907 246.1 10.21938 245.7 10.51969 245.4 10.73
1000 245.1 10.951031 244.8 11.181062 244.5 11.401093 244.2 11.631124 244.0 11.78
FINAL WATER CONTENT = 12.10 %FINAL WEIGHT = 243.7 G

TABLE H24
MICROWAVE OVENWATER CONTENT DETERMINATIONDATE: 7/29/88PROJECT: CERRILLOS SOIL #1TARE WEIGHT: 99.3 GWET WEIGHT: 310.5 G
DRYING WEIGHT WATERTIME (SEC) (G) CONTENT (%)
0 310.5 0.0032 310.4 0.0564 309.8 0.3396 305.3 2.53
128 299.6 5.44160 294.4 8.25192 289.9 10.81224 285.9 13.18256 282.8 15.10287 280.3 16.68318 278.5 17.86349 277.0 18.85380 275.9 19.5S411 275.2 20.07442 274.6 20.48473 274.2 20.75504 273.9 20.96535 273.6 21.17566 273.4 21.31
FINAL WATER CONTENT = 21.37 %FINAL WEIGHT = 273.4 G
I

TABLE H25
MICROWAVE OVENWATER CONTENT DETERMINATIONDATE: 7/28/88PROJECT: CERRILLOS SOIL #2TARE WEIGHT: 101.6 GWET WEIGHT: 345.7 G
DRYING WEIGHT WATERTIME (SEC) (G) CONTENT (%)
0 345.7 0.0032 345.6 0.0464 344.6 0.4596 349.9 2.01128 335.0 4.58160 329.2 7.25192 323.8 9.85224 318.9 12.33256 314.6 14.60288 310.8 16.68320 307.6 18.50351 305.3 19.83382 303.5 20.90413 302.1 21.75444 301.1 22.35475 300.3 22.85506 299.7 23.22
6537 299.3 23.47568 299.0 23.66
FINAL WATER CONTENT 23.00 %FINAL WEIGHT 78.0 G

ITABLE H26
MICROWAVE OVENWATER CONTENT DETERMINATIONDATE: 7/29/88PROJECT: CERRILLOS SOIL #3TARE WEIGHT: 101.6 GWET WEIGHT: 327.8 G
DRYING WEIGHT WATERTIME (SEC) (G) CONTENT (%)
0 327.8 0.0032 327.8 0.0064 326.8 0.4496 322.8 2.26128 318.0 4.53160 312.7 7.15192 308.0 9.59224 303.9 11.81256 300.4 17.78287 297.7 15.35318 295.6 16.60349 294.0 17.57380 292.7 18.37411 291.8 18.93442 291.1 19.37473 290.6 19.68504 290.2 19.94535 289.9 20.23
FINAL WATER CONTENT = 20.31 %FINAL WEIGHT = 289.6 G

TABLE H27
MICROWAVE OVENWATER CONTENT DETERMINATIONDATE: 7/28/88PROJECT: CERRILLOS SOIL #4TARE WEIGHT: 98.2 GWET WEIGHT: 293.9 G
DRYING WEIGHT WATERTIME (SEC) (G) CONTENT (%)
0 293.9 0.0032 293.9 0.0064 293.7 0.1096 290.0 2.03
128 284.4 5.10160 279.0 8.24192 274.0 11.32224 269.6 14.18256 265.7 16.83288 262.4 19.18320 259.7 21.18351 257.6 22.77382 256.0 24.02413 254.8 24.97444 253.9 25.69475 253.3 26.18506 252.9 26.50537 252.6 26.75568 252.4 26.91
FINAL WATER CONTENT = 27.07 %FINAL WEIGHT = 252.2 G

TABLE H28
MICROWAVE OVENWATER CONTENT DETERMINATIONDATE: 7/28/88PROJECT: CERRILLOS SOIL #5TARE WEIGHT: 99.3 GWET WEIGHT: 310.8 G
DRYING WEIGHT WATERTIME (SEC) (G) CONTENT (%)
0 310.8 0.0032 310.8 0.0064 310.4 0.1996 306.0 2.32128 300.3 5.22160 294.9 8.13192 290.1 10.85224 285.9 13.34256 282.3 15.57288 279.2 17.57319 276.9 19.09350 275.1 20.31381 273.7 21.27412 272.5 22.11443 271.7 22.68474 271.1 23.11505 270.6 23.47536 270.3 23.68576 270.1 23.83
FINAL WATER CONTENT = 23.97 %FINAL WEIGHT = 269.9 G

TABLE H29
MICROWAVE OVENWATER CONTENT DETERMINATIONDATE: 7/28/88PROJECT: CERRILLOS SOIL #6TARE WEIGHT: 97.0 GWET WEIGHT: 309.8 G
DRYING WEIGHT WATERTIME (SEC) (G) CONTENT (%)
0 309.8 0.0032 309.7 0.0564 308.9 0.4296 304.6 2.50128 299.0 5.35160 293.6 8.24192 288.6 11.06224 284.3 13.61256 280.6 15.90288 277.6 17.83319 275.3 19.35350 273.6 20.50381 272.3 21.39412 271.2 22.16443 270.4 22.72474 269.8 23.15505 269.3 23.50536 269.0 23.72567 268.7 23.94598 268.5 24.08
FINAL WATER CONTENT = 24.15 %FINAL WEIGHT = 268.4 G

TABLE H30
MICROWAVE OVENWATER CONTENT DETERMINATIONDATE: 7/29/88PROJECT: CERRILLOS SOIL #7TARE WEIGHT: 97.0 GWET WEIGHT: 310.5 G
DRYING WEIGHT WATERTIME (SEC) (G) CONTENT (%)
0 310.5 0.0032 310.5 0.0064 310.3 0.0996 305.8 2.25128 300.4 4.97160 295.6 7 50192 291.4 9.82224 287.9 11.84256 285.0 13.56287 283.0 14.78318 281.4 15.78349 280.2 16.54380 279.3 17.11411 278.5 17.63442 278.0 17.95473 277.6 18.22504 277.3 18.41
FINAL WATER CONTENT = 18.47 %FINAL WEIGHT = 277.2 G

TABLE H31
MICROWAVE OVENWATER CONTENT DETERMINATIONDATE: 7/28/88PROJECT: CERRILLOS SOIL #8TARE WEIGHT: 97.3 GWET WEIGHT: 307.8 G
DRYING WEIGHT WATERTIME (SEC) (G) CONTENT (%)
0 307.8 0.0032 307.7 0.0564 307.4 0.2096 302.6 2.53128 296.9 5.46160 291.8 8.23192 287.4 10.74224 283.7 12.94256 280.6 14.85287 278.4 16.24318 276.6 17.41349 275.3 18.27380 274.2 19.00411 273.4 19.55442 272.9 19.89473 272.5 20.16504 272.3 20.30
FINAL WATER CONTENT = 20.43 %FINAL WEIGHT = 272.1 G

TABLE H32
MICROWAVE OVENWATER CONTENT DETERMINATIONDATE: 7/29/88PROJECT: CERRILLOS SOIL #9TARE WEIGHT: 98.3 GWET WEIGHT: 319.9 G
DRYING WEIGHT WATERTIME (SEC) (G) CONTENT (%)
0 319.9 0.0032 319.9 0.0064 319.8 0.0596 316.4 1.60
128 310.4 4.48160 304.5 7.47192 298.9 10.47224 293.8 13.35256 289.2 16.08288 285.3 18.50320 282.0 20.63352 279.3 22.43383 277.3 23.79414 275.7 24.92445 274.6 25.69476 273.7 26.34507 273.1 26.77538 272.6 27.14569 272.3 27.36600 272.1 27.50
FINAL WATER CONTENT = 27.57 %FINAL WEIGHT = 272.0 G
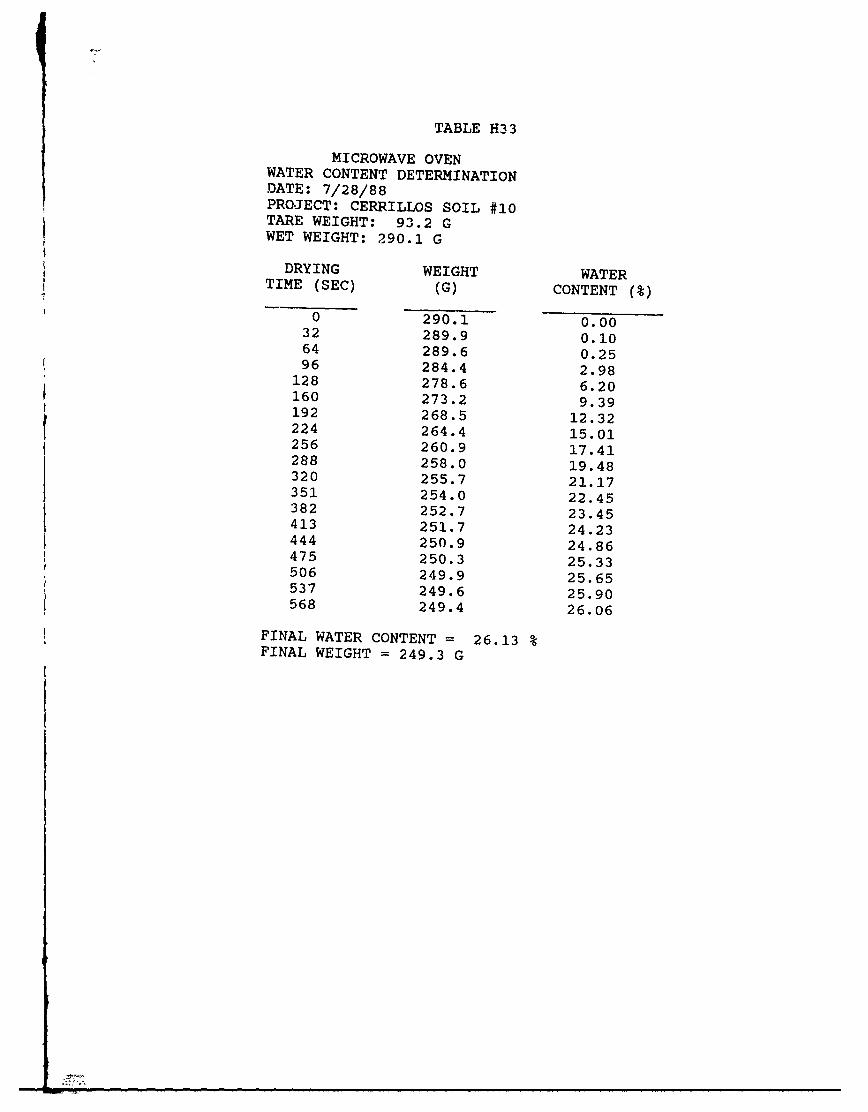
TABLE H33
MICROWAVE OVENWATER CONTENT DETERMINATIONDATE: 7/28/88PROJECT: CERRILLOS SOIL #10TARE WEIGHT: 93.2 GWET WEIGHT: 290.1 G
DRYING WEIGHT WATERTIME (SEC) (G) CONTENT (%)
0 290.1 0.0032 289.9 0.1064 289.6 0.2596 284.4 2.98
128 278.6 6.20160 273.2 9.39192 268.5 12.32224 264.4 15.01256 260.9 17.41288 258.0 19.48
320 255.7 21.17351 254.0 22.45382 252.7 23.45413 251.7 24.23444 250.9 24.86475 250.3 25.33506 249.9 25.65537 249.6 25.90568 249.4 26.06
FINAL WATER CONTENT = 26.13 %FINAL WEIGHT = 249.3 G
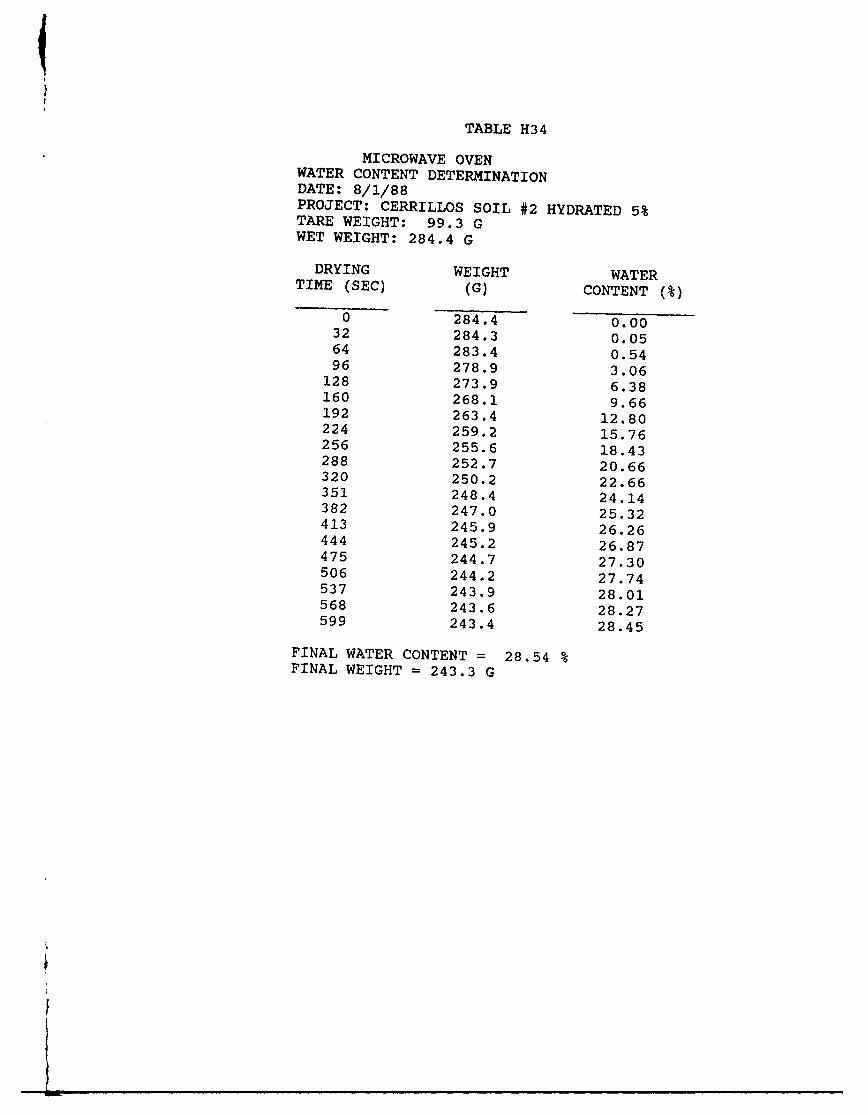
TABLE H34
MICROWAVE OVENWATER CONTENT DETERMINATIONDATE: 8/1/88PROJECT: CERRILLOS SOIL #2 HYDRATED 5%TARE WEIGHT: 99.3 GWET WEIGHT: 284.4 G
DRYING WEIGHT WATERTIME (SEC) (G) CONTENT (%)
0 284.4 0.0032 284.3 0.0564 283.4 0.5496 278.9 3.06
128 273.9 6.38160 268.1 9.66192 263.4 12.80224 259.2 15.76256 255.6 18.43288 252.7 20.66320 250.2 22.66351 248.4 24.14382 247.0 25.32413 245.9 26.26444 245.2 26.87475 244.7 27.30506 244.2 27.74537 243.9 28.01568 243.6 28.27599 243.4 28.45
FINAL WATER CONTENT = 28.54 %FINAL WEIGHT = 243.3 G
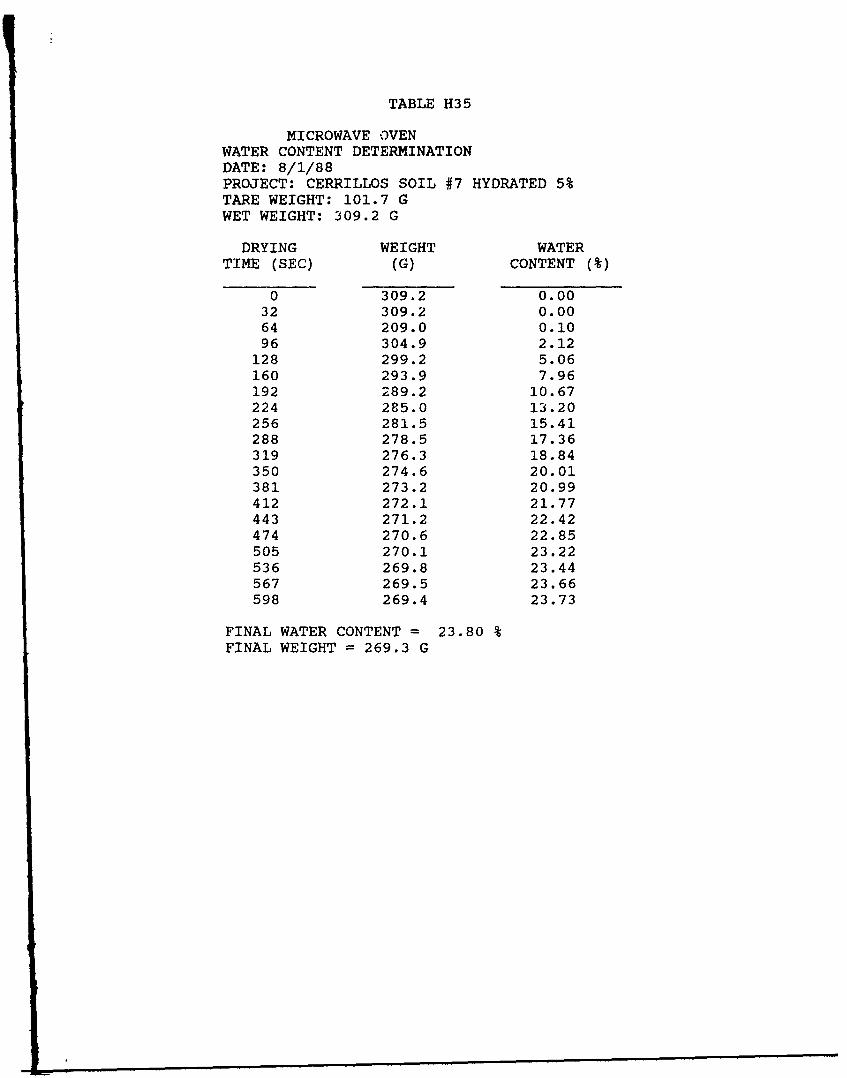
TABLE H35
MICROWAVE OVENWATER CONTENT DETERMINATIONDATE: 8/1/88PROJECT: CERRILLOS SOIL #7 HYDRATED 5%TARE WEIGHT: 101.7 GWET WEIGHT: 309.2 G
DRYING WEIGHT WATERTIME (SEC) (G) CONTENT (%)
0 309.2 0.0032 309.2 0.0064 209.0 0.1096 304.9 2.12
128 299.2 5.06160 293.9 7.96192 289.2 10.67224 285.0 13.20256 281.5 15.41288 278.5 17.36319 276.3 18.84350 274.6 20.01381 273.2 20.99412 272.1 21.77443 271.2 22.42474 270.6 22.85505 270.1 23.22536 269.8 23.44567 269.5 23.66598 269.4 23.73
FINAL WATER CONTENT = 23.80 %FINAL WEIGHT = 269.3 G

TABLE H36
MICROWAVE OVENWATER CONTENT DETERMINATIONDATE: 8/2/88PROJECT: CERRILLOS SOIL #2 DEHYDRATED 5%TARE WEIGHT: 98.3 GWET WEIGHT: 300.1 G
DRYING WEIGHT WATERTIME (SEC) (G) CONTENT (%)
0 300.1 0.0032 3.0 0.0564 299.1 0.5096 293.9 3.17
128 288.6 6.04160 284.0 8.67192 280.2 10.94224 277.1 12.86255 274.8 14.33286 273.1 15.45317 271.8 16.31348 270.8 16.99379 270.1 17.46410 269.6 17.81441 269.2 18.08472 268.9 18.29503 268.7 18.43
FINAL WATER CONTENT = 18.56 %FINAL WEIGHT = 268.5 G

TABLE H37
MICROWAVE OVENWATER CONTENT DETERMINATIONDATE: 8/2/88PROJECT: CERRILLOS SOIL #7 DEHYDRATED 5%TARE WEIGHT: 101.6 GWET WEIGHT: 282.6 G
DRYING WEIGHT WATERTIME (SEC) (G) CONTENT (%)
0 282.6 0.0032 282.5 0.0564 281.6 0.5696 276.7 3.37128 272.1 6.16160 268.2 8.64192 265.2 10.64223 263.1 12.07254 261.5 13.19285 260.3 14.05316 259.4 14.70347 258.8 15.14378 258.3 15.51409 258.0 15.73440 257.8 15.88
FINAL WATER CONTENT = 15.95 %FINAL WEIGHT = 257.7 G

TABLE H38
MICROWAVE OVENWATER CONTENT DETERMINATIONDATE: 8/5/88PROJECT: DAVIS POND BROWN PEAT (LARGER SAMPLE)TARE WEIGHT: 157.0 GWET WEIGHT: 354.8 G
DRYING WEIGHT WATERTIME (SEC) (G) CONTENT (%)
0 354.8 0.0030 354-i 0.0060 354.8 0.0090 354.6 0.10
120 354.2 0.30150 353.1 0.87180 349.7 2.65210 344.7 5.38240 339.6 8.32270 334.4 11.50300 329.3 14.80330 324.2 18.30361 319.2 21.95391 314.1 25.91421 309.1 30.05451 304.1 34.47481 299.1 39.20511 294.2 44.17541 289.2 49.62571 284.4 55.26601 279.5 61.47631 274.7 68.05661 269.9 75.20691 265.2 82.81721 260.4 91.29751 255.7 100.40781 251.1 110.20811 246.5 121.00841 241.9 132.98871 237.4 146.02901 233.0 160.26931 228.6 176.26961 224.2 194.35991 219.9 214.47
1021 215.5 238.121052 211.1 265.621082 207.1 294.811112 203.2 328.141142 199.9 361.07
(continued)

TABLE H38 (concluded)
DRYING WEIGHT WATERTIME (SEC) (G) CONTENT (%)
1172 196.9 395.741202 194.3 430.291232 191.9 466.761262 189.8 503.051292 188.1 536.011322 186.9 561.541352 185.8 586.801382 185.0 606.431412 184.3 624.541442 183.7 640.821472 183.1 657.851502 182.6 672.661532 182.2 684.921562 181.9 694.381592 181.6 704.061622 181.3 713.991652 181.0 724.171682 180.8 731.091712 180.5 741.701743 180.3 748.931773 180.1 756.281803 180.0 760.00
FINAL WATER CONTENT = 771.36 %FINAL WEIGHT = 179.7 G

TABLE H39
MICROWAVE OVENWATER CONTENT DETERMINATIONDATE: 8/5/88PROJECT: DAVIS POND BROWN PEAT (SMALL SAMPLE SIZE)TARE WEIGHT: 97.3 GWET WEIGHT: 175.7 G
DRYING WEIGHT WATERTIME (SEC) (G) CONTENT (%)
0 175.7 0.0030 175.6 0.1360 175.2 0.6490 173.2 3.29
120 169.1 9.19150 164.8 16.15180 160.6 23.85210 156.4 32.66240 152.3 42.54270 148.1 54.33300 144.0 67.88330 139.9 84.04361 135.8 103.64391 132.1 125.29421 128.9 149.10451 126.0 173.17481 123.2 202.70511 120.9 232.20541 118.8 246.65571 117.2 293.97601 115.8 323.78631 114.7 350.57661 113.8 375.15691 113.0 399.60721 112.3 422.67751 111.8 440.69781 111.3 460.00811 113.9 476.47841 110.5 493.94871 110.1 512.50901 109.8 527.20931 109.5 542.62961 109.3 553.33991 109.1 564.41
1022 108.9 575.861052 108.7 587.721082 108.5 600.001112 108.3 612.731142 108.2 619.27
(continued)
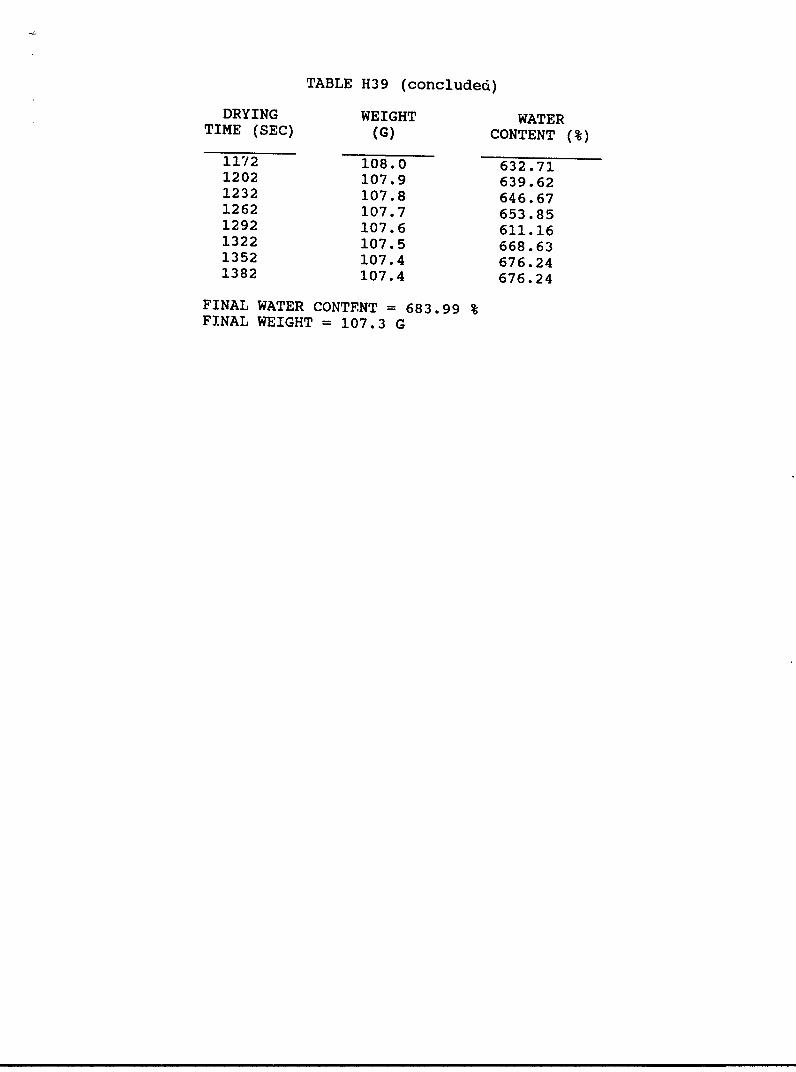
TABLE H39 (concluded)
DRYING WEIGHT WATERTIME (SEC) (G) CONTENT (%)
1172 108.0 632.711202 107.9 639.621232 107.8 646.671262 107.7 653.851292 107.6 611.161322 107.5 668.631352 107.4 676.241382 107.4 676.24
FINAL WATER CONTENT = 683.99 %FINAL WEIGHT = 107.3 G

TABLE H40
MICROWAVE OVENWATER CONTENT DETERMINATIONDATE: 8/3/88PROJECT: DAVIS POND BROWN PEATTARE WEIGHT: 98.2 GWET WEIGHT: 233.0 G
DRYING WEIGHT WATERTIME (SEC) (G) CONTENT (%)
0 233.0 0.0032 232.9 0.0764 232.8 0.1596 231.8 0.90
128 227.5 4.25160 221.7 9.15192 215.9 14.53224 210.2 20.36256 204.6 26.69288 199.0 33.73320 193.8 41.00352 188.6 49.12384 183.5 58.03416 178.6 67.66448 173.9 78.07480 169.3 89.59512 164.9 102.10544 160.6 116.03576 156.4 131.62608 152.1 150.09640 147.8 171.77672 143.5 197.57704 139.5 226.39736 136.0 256.61768 132.9 288.47800 .30.2 321.25832 127.6 358.50864 125.4 395.59896 123.6 430.71928 122.2 461.67960 121.1 488.65992 120.3 509.95
1024 119.5 532.861056 118.9 551.21108 118 .4 567.331120 117.9 584.261152 117.6 594.841184 117.1 613.231216 116.8 624.73
(continued)

TABLE H40 (concluded)
DRYING WEIGHT WATERTIME (SEC) (G) CONTENT (%)
1248 116.6 632.611279 116.2 648.891310 116.0 657.301341 115.8 665.091372 115.6 674.711403 115.4 683.721434 115.4 688.30
FINAL WATER CONTENT = 697.63 %FINAL WEIGHT = 115.1 G

TABLE H41
MICROWAVE OVENWATER CONTENT DETERMINATIONDATE: 9/26/88PROJECT: DAVIS POND BROWN PEATTARE WEIGHT: 141.7 GWET WEIGHT: 386.1 G
DRYING WEIGHT WATERTIME (SEC) (G) CONTENT (%)
0 386.1 0.0030 386.1 0.0060 386.0 0.0490 385.8 0.12
120 385.1 0.41150 383.9 0.91180 382.1 1.66210 378.7 3.12240 373.6 5.39270 368.0 8.00300 362.5 10.69331 357.0 13.52361 351.4 16.55391 345.9 19.69421 340.5 22.94451 335.0 26.43481 329.5 30.14511 324.1 33.99541 318.8 38.00571 313.4 42.34601 308.0 46.96631 302.7 51.80661 297.4 56.97691 292.2 62.39721 286.9 68.32751 281.7 74.57781 276.6 81.17811 271.4 88.43841 266.3 96.15871 261.2 104.52901 256.2 113.45931 251.2 123.20961 246.2 133.88991 241.3 145.381022 236.4 158.081052 231.5 172.161082 226.7 187.561112 221.9 204.741142 216.8 225.43
(continued)

TABLE H41 (concluded)
DRYING WEIGHT WATERTIME (SEC) (G) CONTENT (%)
1172 212.1 247.161202 207.3 272.561232 202.8 300.001262 198.4 331.041292 194.5 362.881322 191.1 394.741352 188.0 427.861382 185.3 460.551412 182.9 493.201442 180.8 525.061472 179.1 553.471502 177.7 578.891532 176.5 602.301562 175.6 620.941592 174.8 638.371622 174.1 654.321652 173.5 668.551683 173.0 680.831713 172.6 690.941743 172.2 701.311773 171.9 709.271803 171.5 720.131833 171.3 725.671863 171.1 731.291923 170.7 742.761953 1.70.6 745.67
FINAL WATER CONTENT = 754.54 %FINAL WEIGHT = 170.3 G

TABLE H42
MICROWAVE OVENWATER CONTENT DETERMINATIONDATE: 7/25/88PROJECT: DAVIS POND BLACK PEAT (8%/5%)TARE WEIGHT: 97.0 GWET WEIGHT: 215.4 G
DRYING WEIGHT WATERTIME (SEC) (G) CONTENT (%)
0 215.4 0.0032 215.3 0.0864 215.1 0.2596 213.3 1.80128 208.1 6.57160 202.3 12.44192 196.7 18.76224 191.1 25.82256 185.6 33.63287 180.8 41.29318 176.3 49.31349 i71.7 58.50380 167.1 68.90411 162.5 80.76442 158.1 93.78473 154.0 107.72504 150.3 122.14535 147.0 136.80566 143.8 152.99597 141.1 168.48628 138.3 186.68659 135.9 204.37690 133.6 223.50721 131.6 242.20752 130.0 258.79783 128.6 274.68814 127.4 289.47845 126.4 302.72876 125.5 315.44907 124.7 3,.7.44938 124.1 336.90969 123.5 346.79
1000 122.9 357.141031 122.5 364.311062 122.1 371.711093 121.7 379.351124 121.4 385.241155 121.1 391.291186 120.8 397.48
(continued)

TABLE H42 (concluded)
DRYING WEIGHT WATERTIME (SEC) (G) CONTENT (%)
1217 120.5 403.831248 120.4 405.98
FINAL WATER CONTENT = 412.55 %FINAL WEIGHT = 120.1 G

TABLE H43
MICROWAVE OVENWATER CONTENT DETERMINATIONDATE: 7/20/88PROJECT: DAVIS POND BLACK PEAT (8%/5%)TARE WEIGHT: 140.1 GWET WEIGHT: 297.9 G
DRYING WEIGHT WATERTIME (SEC) (G) CONTENT (%)
0 297.9 0.0032 297.9 0.0064 297.8 0.0696 297.2 0.44128 294.8 2.00160 289.3 5.76192 283.5 10.04224 277.8 14.60256 272.1 19.55288 266.5 24.84319 261.6 29.88350 256.8 35.22381 252.1 40.89412 247.4 47.06443 242.8 53.65474 238.2 60.86505 233.6 68.77536 228.9 77.70567 224.3 87.41598 219.6 98.49629 214.8 111.24660 210.1 125.43691 205.6 140.92722 201.3 157.84753 197.3 175.87784 193.6 194.95815 190.2 214.97846 187.2 235.03877 184.3 257.01908 181.9 277.51939 179.9 296.48970 178.3 313.0Q1001 176.9 328.801032 175.8 342.021063 174.8 354.761094 173.9 366.861125 173.2 376.741156 172.6 385.541187 172.0 394.67
(continued)

TABLE H43 (concluded)
DRYING WEIGHT WATERTIME (SEC) (G) CONTENT (%)
1218 171.6 400.951249 171.1 409.031280 170.8 414.01
FINAL WATER CONTENT = 422.51 %FINAL WEIGHT = 170.3 G

TABLE H44
MICROWAVE OVENWATER CONTENT DETERMINATIONDATE: 7/19/88
PROJECT: DAVIS POND BLACK PEAT (8%/5%)TARE WEIGHT: 97.4 GWET WEIGHT: 197.1 G
DRYING WEIGHT WATERTIME (SEC) (G) CONTENT (%)
0 197.1 0.0032 197.0 0.1064 169.7 0.4096 195.3 1.84128 191.6 5.84160 186.8 11.52192 181.8 18.13224 177.0 25.25256 172.3 33.11287 168.1 41.02318 164.2 49.25349 160.3 58.51380 156.4 68.98411 152.7 80.29442 149.0 93.22473 145.4 107.71504 141.9 124.04535 138.5 142.58566 135.3 163.06597 132.3 185.67628 129.7 208.67659 127.7 229.04690 125.9 249.82721 124.5 267.90752 123.4 283.46783 122.4 298.80814 121.6 311.98845 120.8 326.07876 120.2 337.28907 119.6 349.10938 119.1 359.45969 118.6 370.281000 118.2 379.331031 117.8 388.731062 117.5 396.021093 117.1 406.091124 116.9 411.28
FINAL WATER CONTENT = 419.27 %FINAL WEIGHT = 116.6 G
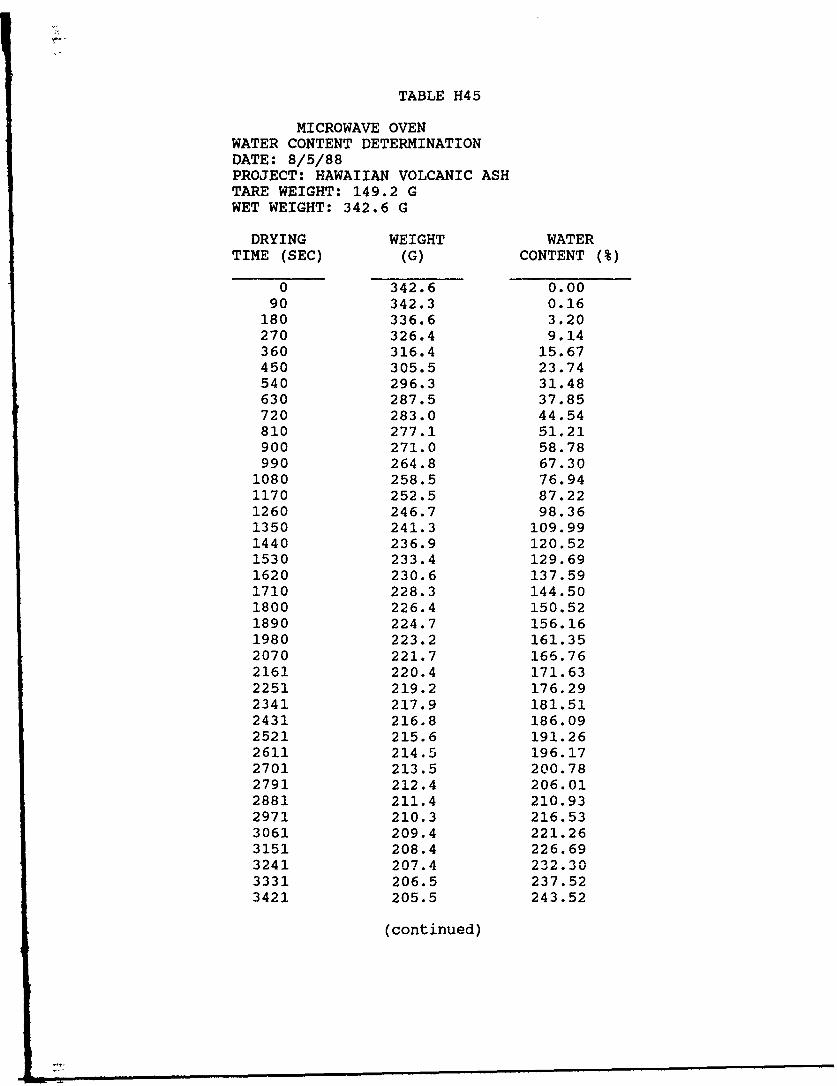
TABLE H45
MICROWAVE OVENWATER CONTENT DETERMINATIONDATE: 8/5/88PROJECT: HAWAIIAN VOLCANIC ASHTARE WEIGHT: 149.2 GWET WEIGHT: 342.6 G
DRYING WEIGHT WATERTIME (SEC) (G) CONTENT (%)
0 342.6 0.0090 342.3 0.16
180 336.6 3.20270 326.4 9.14360 316.4 15.67450 305.5 23.74540 296.3 31.48630 287.5 37.85720 283.0 44.54810 277.1 51.21900 271.0 58.78990 264.8 67.30
1080 258.5 76.941170 252.5 87.221260 246.7 98.361350 241.3 109.991440 236.9 120.521530 233.4 129.691620 230.6 137.591710 228.3 144.501800 226.4 150.521890 224.7 156.161980 223.2 161.352070 221.7 166.762161 220.4 171.632251 219.2 176.292341 217.9 181.512431 216.8 186.092521 215.6 191.262611 214.5 196.172701 213.5 200.782791 212.4 206.012881 211.4 210.932971 210.3 216.533061 209.4 221.263151 208.4 226.693241 207.4 232.303331 206.5 237.523421 205.5 243.52
(continued)

TABLE H45 (concluded)
DRYING WEIGHT WATERTIME (SEC) (G) CONTENT (%)
3511 204.7 248.473601 203.8 254.213691 203.1 258.813781 202.4 263.533871 201.8 267.683961 201.3 271.214051 200.7 275.534141 200.3 278.474231 199.9 281.464321 199.5 284.494411 199.2 286.804501 198.9 289.134591 198.7 290.714681 198.4 293.094771 198.3 293.894861 198.1 295.504951 198.0 296.315041 197.8 297.945131 197.8 297.94
FINAL WATER CONTENT = 298.76 %FINAL WEIGHT = 197.7 G

TABLE H46
MICROWAVE OVENWATER CONTENT DETERMINATIONDATE: 7/8/88PROJECT: HAWAIIAN VOLCANIC ASHTARE WEIGHT: 93.1 GWET WEIGHT: 213.6 G
DRYING WEIGHT WATERTIME (SEC) (G) CONTENT (%)
0 213.6 0.00102 213.5 0.08204 212.6 0.84306 208.5 4.42408 203.5 9.15510 199.1 13.68612 194.6 18.72714 189.3 25.26816 184.4 31.98918 180.1 38.511020 176.1 45.181122 172.8 51.571124 169.7 57.311326 167.2 62.621428 164.9 67.831530 162.8 72.881632 161.0 77.47"734 159.4 81.751836 157.9 65.961938 156.6 89.762040 155.3 93.732142 154.1 97.542244 153.0 101.172346 152.0 104.582448 151.0 108.122550 150.1 111.402652 149.3 114.412754 148.4 117.902856 147.7 120.692958 146.9 123.983060 146.1 127.363162 145.4 130.403264 144.7 133.533366 144.1 136.273468 143.4 139.563570 142.8 142.453672 142.1 145.923774 141.5 148.973876 140.8 152.62
(continued)

TABLE H46 (concluded)
DRYING WEIGHT WATERTIME (SEC) (G) CONTENT (%)
3978 140.2 155.844080 139.5 159.704182 138.9 163.104284 138.6 166.594386 137.6 170.794488 137.0 174.494590 136.4 178.294692 135.8 182.204794 135.2 186.224896 134.6 190.364998 134.1 193.905100 133.5 198.275202 133.1 201.255304 132.6 205.065406 132.1 208.975508 131.7 212.185610 131.3 215.455712 130.8 219.635814 130.4 323.065916 130.1 325.676018 129.7 229.236120 129.4 231.966222 129.0 235.656324 128.7 238.486426 128.5 240.406527 128.1 244.296623 127.8 247.266729 127.6 249.276830 127.4 251.316931 127.1 254.417032 126.9 256.517133 126.7 258.637234 126.5 260.787335 126.4 261.867436 126.2 254.057537 126.1 265.157638 125.9 267.387739 125.8 268.507840 125.7 269.637941 125.6 270.778042 125.5 271.918143 125.4 273.078244 125.4 273.07
FINAL WATER CONTENT = 274.22 %FINAL WEIGHT = 125.3 G

TABLE H47
MICROWAVE OVENWATER CONTENT DETERMINATIONDATE: 7/22/88PROJECT: HAWAIIAN VOLCANIC ASHTARE WEIGHT: 129.2 GWET WEIGHT: 309.9 G
DRYING WEIGHT WATERTIME (SEC) (G) CONTENT (%)
0 309.9 0.00102 309.8 0.05204 309.3 0.33306 302.1 4.51408 294.4 9.38510 287.8 13.93612 281.4 18.73714 275.7 23.34816 270.5 27.88918 265.9 32.191020 261.5 36.581122 257.5 40.841224 253.8 45.021326 250.2 49.341428 246.7 53.791530 243.0 58.791632 239.1 64.421734 234.7 71.281836 230.0 79.261938 225.4 87.842040 221.0 96.842142 217.2 105.342244 213.9 113.342346 211.2 120.362448 209.0 126.442550 207.2 131.672652 205.6 136.522754 204.3 140.612856 203.0 144.852958 201.8 148.903060 200.8 152.373162 199.7 156.313264 198.7 160.003366 197.8 163.413468 196.9 166.913570 196.0 170.513672 195.2 173.793774 194.4 177.153876 193.5 181.03
(continued)

TABLE H47 (concluded)
DRYING WEIGHT WATERTIME (SEC) (G) CONTENT (%)
3978 192.7 184.574080 191.9 188.204182 191.1 191.924284 190.3 195.744386 189.5 199.674488 188.8 203.194590 188.0 207.314692 187.2 211.554794 186.5 215.364896 185.8 219.264998 185.0 223.845100 184.4 227.355202 183.6 232.175304 183.0 235.875406 182.3 240.305508 181.7 244.195610 181.1 248.175712 180.5 252.245814 180.0 255.715916 179.5 259.246018 179.1 262.126120 178.7 265.056222 178.3 268.026324 177.9 271.056426 177.6 273.356528 177,3 275.676630 177.0 278.036732 176.8 279.626833 176.5 282.036934 176.3 283.657035 176.1 285.297136 175.9 286.947237 175.8 287.777338 175.6 289.447439 175.5 290.287540 175.4 291.137641 175.4 291.13
FINAL WATER CONTENT = 291.97 %FINAL WEIGHT = 175.3 G

TABLE H48
MICROWAVE OVENWATER CONTENT DETERMINATIONDATE: 6/21/88PROJECT: HAWAIIAN VOLCANIC ASHTARE WEIGHT: 97.4 GWET WEIGHT: 207.8 G
DRYING WEIGHT WATERTIME (SEC) (G) CONTENT (%)
0 207.8 0.0032 207.7 0.0964 207.7 0.09128 206.6 1.10159 204.1 3.47190 202.0 5.54221 200.1 7.50252 198.2 9.52283 196.2 11.74314 194.2 14.05345 192.0 16.70376 189.7 19.61407 187.5 22.53438 185.4 25.45469 183.3 28.52500 181.5 31.27531 179.9 33.82562 178.4 36.30593 176.9 38.87624 175.5 41.36655 174.1 43.94686 172.8 46.42717 171.7 48.59748 170.6 50.82779 169.5 53.12810 168.6 55.06841 167.6 57.26872 166.8 59.08903 165.9 61.17934 165.3 62.83965 164.4 64.78996 163.7 66.51
1027 163.0 68.291058 162.3 70.111089 161.6 71.961120 161.0 71.961151 160.3 75.521213 159.1 78.931244 158.5 80.69
(continued)

TABLE H46 (continued)
DRYING WEIGHT WATERTIME (SEC) (G) CONTENT (%)
1275 158.0 82.181306 157.5 83.691337 156.9 P5.551368 156.4 87.121339 155.9 88.721430 155.4 90.341461 154.9 92.151492 154.4 93.681523 154.0 95.051554 153.3 96.791585 153.0 98.561616 152.6 100.001678 151.7 103.311709 151.3 104.821740 150.9 106.361771 150.1 109.491833 149.7 111.091864 149.4 112.311895 149.0 113.951926 148.6 115.621957 148.3 116.89'088 147.9 118.612119 147.6 119.922050 147.2 121.692081 146.9 123.032112 146.6 124.392143 146.2 126.232174 145.9 127.632205 145.6 129.052236 145.3 130.482267 145.0 131.932298 144.6 133.902329 144.3 135.392360 144.0 136.912391 143.7 138.442422 143.4 140.002453 143.1 141.572484 142.8 143.172515 142.5 144.792546 142.2 146.432577 141.9 148.092606 141.6 149.772639 141.3 151.482670 141.0 153.212701 140.7 154.962732 140.4 156.77
(continued)

TABLE H48 (continued)
DRYING WEIGHT WATERTIME (SEC) (G) CONTENT (%)
2763 140.1 158.552794 139.8 160.382825 139.5 162.232856 139.3 163.482887 139.0 165.382918 138.7 167.312949 138.4 169.272980 138.1 171.253011 137.9 172.593042 137.6 174.633073 137.4 176.003104 137.1 178.093135 136.9 179.493166 136.6 181.633197 136.4 183.083228 136.1 185.273259 135.9 186.753290 135.7 188.253321 135.4 190.533352 135.2 192.063383 135.0 193.623414 134.8 195.193445 134.6 196.773476 134.4 198.383507 134.2 200.003538 134.0 201.643569 133.8 203.303600 133.6 204.973631 133.4 206.673662 133.2 208.383693 133.0 210.113724 132.9 210.993755 132.7 212.753786 132.5 214.533817 132.3 216.333848 132.2 217.243879 132.0 219.073910 131.8 220.933941 131.7 221.87
3972 131.5 223.754003 131.4 224.734034 131.2 226.624065 131.1 227.604096 130.*9 229.554127 130.8 230.544158 130.7 231.5:j
(continued)

TABLE H48 (concluded)
DRYING WEIGHT WATERTIME (SEC) (G) CONTENT (%)
4189 130.5 233.534220 130.4 234.544251 130.3 235.564282 130.1 237.614313 130.0 238.654344 129.9 239.694375, 129.8 240.744406 129.6 242.864437 129.5 243.934468 129.4 245.004498 129.8 246.084530 129.2 247.174561 129.0 249.374592 129.0 249.37
FINAL WATER CONTENT = 251.59 %FINAL WEIGHT = 128.8 G

TABLE H49
MICROWAVE OVENWATER CONTENT DETERMINATIONDATE: 6/17/88PROJECT: HAWAIIAN VOLCANIC ASHTARE WEIGHT: 59.1 GWET WEIGHT: 150.0 G
DRYING WEIGHT WATERTIME (SEC) (G) CONTENT (%)
0 150.0 0.0032 149.9 0.1164 149.8 0.2296 149.3 0.78
128 146.8 3.65160 143.3 7.96192 140.4 11.81224 137.9 15.35256 135.5 18.98288 133.1 22.84320 131.0 26.42352 129.1 29.86384 127.5 32.89416 126.2 35.47448 125.0 37.94480 123.8 40.49512 122.7 42.92544 121.7 45.21576 120.6 47.80608 119.6 50.25640 118.8 52.26671 118.0 54.33702 117.3 56.19733 116.7 57.81764 116.1 59.47795 115.5 61.17826 114.9 62.90857 114.4 64.38888 113.8 66.18919 113.4 67.40950 112.9 68.96981 112.4 70.541012 111.9 72.161043 111.4 73.801074 111.0 75.141105 110.6 76.501136 110.1 78.241167 109.7 79.641198 109.3 81.07
(continued)

TABLE H49 (continued)
DRYING WEIGHT WATERTIME (SEC) (G) CONTENT (%)
1229 108.8 82.901260 108.4 84.381291 108.0 85.891322 107.6 87.421353 107.1 89.381384 106.7 90.971415 106.3 92.581446 105.8 94.651477 105.4 96.331508 105.0 98.041539 104.5 100.221570 104.1 102.001601 103.7 103.811632 103.2 106.121663 102.8 108.011694 102.4 109.931725 101.9 112.381756 101.5 114,391787 101.1 116.431818 100.7 118.511849 100.3 120.631880 99.9 122.791911 99.6 124.441942 99.2 126.681973 98.9 128.392004 98.5 130.712035 98.3 131.892066 97.9 134.282097 97.7 135.492128 97.3 137.962159 97.1 139.212190 96.8 121.112221 96.5 143.052252 96.2 145.012283 96.0 146.342314 95.7 148.362345 95.5 149.732376 95.2 151.802404 95.0 153.202438 94.7 155.342469 94.5 156.782500 94.3 158.242531 95.1 159.712562 93.8 161.962593 93.6 163.482624 93.4 165.01
(continued)

TABLE H49 (continued)
DRYING WEIGHT WATERTIME (SEC) (G) CONTENT (%)
2655 93.2 166.582686 93.0 169.142717 92.8 169.732748 92.6 171.342779 92.4 172.972810 92.3 173.792841 92.1 175.452872 91.9 177.:L32903 91.7 178.332934 91.5 180.552965 91.4 181.422996 91.2 183.183027 91.0 184.953058 90.9 185.853089 90.7 187.663120 90.6 188.573151 90.4 190.413132 90.3 191.353213 90.1 193.233244 90.0 194.173275 89.8 196.093306 89.7 197.063337 89.5 199.013368 89.4 200.003399 89.3 200.993430 89.1 203.003461 89.0 204.013492 88.9 205.033523 88.7 207.093554 83.6 208.133585 r%.5 209.183616 88.1 211.303647 88.2 212.373678 88.1 213.453709 88.0 214.533740 87.9 215.623771 87.7 217.833802 87.6 218.953833 87.5 220.073864 87.3 222.343895 87.2 223.493926 87.1 224.643957 87.0 225.813988 86.9 226.984019 86.8 228.164050 86.7 229.35
(continued)

TABLE H49 (concluded)
DRYING WEIGHT WATERTIME (SEC' (G) CONTENT (%)
4081 86.6 230.544112 86.2 231.754143 86.4 232.974174 86.3 234.194205 86.2 235.424236 86.1 236.674267 86.0 237.924298 85.9 239.184329 85.8 240.454360 85.7 241.734391 85.6 243.024422 85.6 243.02
FINAL WATER CONTENT = 245.62 %FINAL WEIGHT = 85.4 G
[..