computer-based data acquisition and processing in a ... · pdf filecomputer-based data...
TRANSCRIPT

Computer-based data acquisition and processing in a technical investigation department
N. J. Durley-Boot & J. R. Maguire Technical Investigation Department, Lloyd’s Register, UK
Abstract
This paper provides a snapshot of the current work of the Technical Investigation Department (TID) of Lloyd’s Register EMEA, focusing on how computer-based tools have been integrated to collect, process and analyse data. There are three main parts to the paper: (1) description of the data acquisition and processing systems – both traditional analogue and more modern digital systems; (2) discussion of the analysis techniques – categorised into spreadsheets, signal processing, and engineering design and predictive analysis; (3) example combinations on jobs – in both marine and non-marine industries. The paper concludes with a look ahead to developments foreseen in the coming years. Keywords: data, acquisition, processing, technical, investigation.
1 Introduction
Since its formation in 1947, Lloyd’s Register EMEA’s Technical Investigations Department (TID) has been invited to investigate a wide range of engineering problems across the marine, land-based industrial and off-shore oil and gas industries (Carlton and Bantham [1]). The experience gained from these investigations has been used to develop new and innovative measurement and analysis techniques alongside more orthodox technologies. The department’s accumulated experience and contemporary measurement toolkit allows TID to offer services for an extensive range of investigations. This paper looks at the data acquisition and processing tools and the analysis techniques available. Through a series of case studies, the paper demonstrates how a technical investigation department can combine measurement, analysis,
Computational Methods and Experimental Measurements XV 509
www.witpress.com, ISSN 1743-355X (on-line) WIT Transactions on Modelling and Simulation, Vol 51, © 2011 WIT Press
doi:10.2495/CMEM110451

experience and professional engineering judgment to deliver high quality results, enabling sound management decisions.
2 Data acquisition and processing
Accurate data acquisition and processing techniques are vital to an investigation department. Investigators must always attempt to identify and understand the prime cause of failures or unexpected performance before deciding on corrective action and this would, in most cases, be impossible without accurate measurement data. TID has an extensive range of measurement equipment allowing the department to react to a wide range of circumstances and to adapt to clients requirements on an individual basis. A brief overview of some of the principal equipment used by TID is given below.
2.1 Core digital system
National Instrument’s NI/CDAQ multi-channel chassis system with various modules and sensors provides the core of the department’s digital data acquisition capabilities. This PC based system enables the department to perform a variety of sensor measurements including: - acceleration; - velocity; - displacement; - frequency; - pressure; - force; - inclination.
Measurements are controlled using LabView SignalExpress and in-house developed MatLab scripts which provide software flexibility through user-defined loggings, analysis and visualisation. More sophisticated processing techniques are dealt with under the “Analysis Techniques” section later.
2.2 Still/video images
The use of low-light digital cameras allows the department to record observations and measurements. These records can then be referenced and referred to when recommending remedial action. One such application is that of propeller observations. Historically, propeller observations were performed by inserting a viewing window into the hull. This method required a period of dry-docking and specialist work which was expensive to the client. With improvements in technology TID is now able to offer propeller observations to clients without dramatically affecting the ships’ schedule. The use of a borescope coupled with a low-light digital camera means that just a
510 Computational Methods and Experimental Measurements XV
www.witpress.com, ISSN 1743-355X (on-line) WIT Transactions on Modelling and Simulation, Vol 51, © 2011 WIT Press

small hole of the order of 15mm diameter in the ship’s hull is required to obtain observations. This technique also allows TID to refer back to the observation when performing analysis, resulting in a more informative investigation. Example images obtained from this method can be seen in Figure 1.
Figure 1: Propeller observations, showing tip cavitation.
The video images can be synchronised with vibration and pressure measurements to aid the understanding of propeller cavitation and its influence on ship structural vibration.
2.3 Acoustic emission systems
Acoustic emission monitoring can be used for leak and crack detection (Rogers [2]). It is sensitive to the propagation of growing cracks and provides information on growth rate under service loading conditions thereby guiding inspection and repair work for cost effective maintenance.
Figure 2: Tubular ‘K’ joint instrumented with acoustic emission sensors and strain gauges undergoing fatigue testing.
Figure 3: An acoustic emissions sensor attached to a sub-sea node joint.
Computational Methods and Experimental Measurements XV 511
www.witpress.com, ISSN 1743-355X (on-line) WIT Transactions on Modelling and Simulation, Vol 51, © 2011 WIT Press

2.4 Impact testing kit
Hammer test equipment as shown in Figures 4 and 5 can be used to determine the natural frequencies of structures and components. The excitation signal from the hammer, and the response signals from the accelerometers attached to the structure, are acquired in the time domain by digital data acquisition equipment. These signals are then converted by Fast Fourier Transform (FFT) into the frequency domain, which yields the power spectral densities. The power spectrum response can then be divided by the power spectrum excitation to produce the Frequency Response Function (FRF) which contains the natural frequencies of the structure. Mode shapes and damping values can also be extracted from a series of FRF’s.
Figure 4: Instrumented sledgehammer. Figure 5: Seismic accelerometers.
2.5 Telemetry systems
Telemetry systems can be used to transfer data from rotating devices. Two typical applications for such equipment are for measuring propeller blade strains, and for monitoring the operating strain distribution across the teeth of a gear wheel. Figures 6 and 7 shows typical installations in each case.
2.6 Portable measurement devices
TID use a range of portable measurement equipment, allowing investigators to be flexible in their investigations. These devices normally supplement other measurement techniques, and can offer instant data analysis. The results from
512 Computational Methods and Experimental Measurements XV
www.witpress.com, ISSN 1743-355X (on-line) WIT Transactions on Modelling and Simulation, Vol 51, © 2011 WIT Press
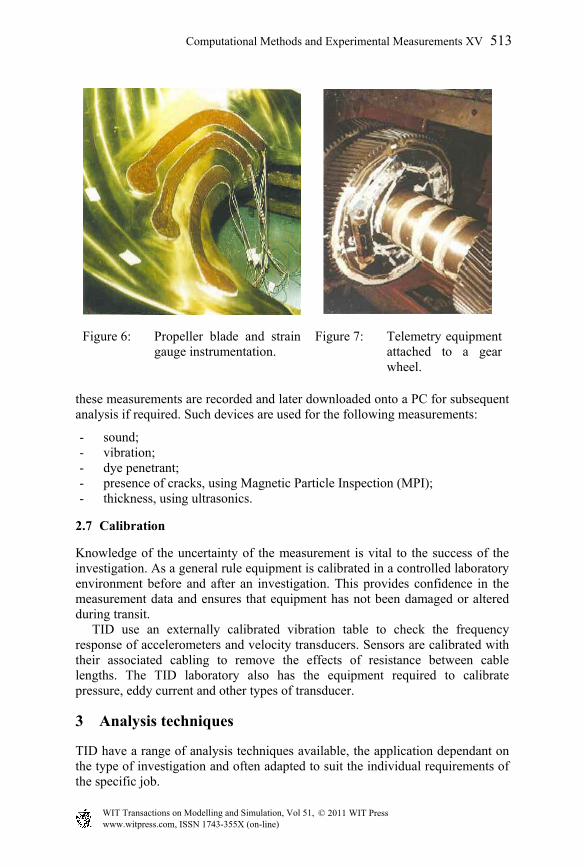
Figure 6: Propeller blade and strain gauge instrumentation.
Figure 7: Telemetry equipment attached to a gear wheel.
these measurements are recorded and later downloaded onto a PC for subsequent analysis if required. Such devices are used for the following measurements:
- sound; - vibration; - dye penetrant; - presence of cracks, using Magnetic Particle Inspection (MPI); - thickness, using ultrasonics.
2.7 Calibration
Knowledge of the uncertainty of the measurement is vital to the success of the investigation. As a general rule equipment is calibrated in a controlled laboratory environment before and after an investigation. This provides confidence in the measurement data and ensures that equipment has not been damaged or altered during transit. TID use an externally calibrated vibration table to check the frequency response of accelerometers and velocity transducers. Sensors are calibrated with their associated cabling to remove the effects of resistance between cable lengths. The TID laboratory also has the equipment required to calibrate pressure, eddy current and other types of transducer.
3 Analysis techniques
TID have a range of analysis techniques available, the application dependant on the type of investigation and often adapted to suit the individual requirements of the specific job.
Computational Methods and Experimental Measurements XV 513
www.witpress.com, ISSN 1743-355X (on-line) WIT Transactions on Modelling and Simulation, Vol 51, © 2011 WIT Press

3.1 Spreadsheets
Spreadsheets remain a popular method for manipulating and visualizing data. A commercial spreadsheet application (Microsoft Excel) provides a tool for performing simple statistical analysis, Fourier Transforms and can also offer a platform for more complex programming in Visual Basic.
3.2 Signal processing
TID uses a variety of post-processing tools including standard commercial and custom products. MATLAB is used as the primary software for off-line signal processing. MATLAB is a high-level technical computing language used for algorithm development, data visualization, data analysis, and numeric computation. TID has the capability to develop its own code and are able to perform the following types of analysis: - statistics; - time domain; - frequency domain; - JTFA (joint time frequency analysis); - wavelets and filtering; - 2D and 3D graphical presentation; - modal analysis.
3.3 Engineering design and predictive analysis
Anticipating and designing problems out at an early stage is an effective risk management strategy and can prove to be extremely cost effective. TID are able to perform analytical studies in conjunction with model tests in order to identify potential problems at the early stages of ship design or with major conversions. TID undertake domain specific analysis including: - propeller hydrodynamics; - ship performance; - shafting systems analysis; - diesel engine and performance; - gear tooth load distribution.
TID’s general purpose analysis tools include: - sound and noise analysis; - fatigue and crack growth analysis; - finite element analysis [FEA]; - computational fluid dynamics [CFD].
514 Computational Methods and Experimental Measurements XV
www.witpress.com, ISSN 1743-355X (on-line) WIT Transactions on Modelling and Simulation, Vol 51, © 2011 WIT Press

Computational Fluid Dynamics provides a useful approach for enhancing understanding and helping to identify optimal solutions for various engineering problems. Figure 8 shows the predicted velocity of the inflow to the propeller after the addition of a vortex generator (Figure 9) to the side of the hull. The results were used to minimise cavitation from the propeller and thus reduce ship structural vibration.
Figure 8: CFD results showing the effect of the vortex generator on inflow to the propeller.
Figure 9: Vortex generator.
4 Example case studies
This section contains three case studies that demonstrate how TID has utilised the computer based data acquisition and processing equipment discussed within this paper. The combination of instrumentation and analysis techniques with sound engineering judgement has provided tailored solutions to specific problems.
4.1 Shaft alignment
When specifying the initial alignment conditions of propulsion shafting, considerations that need to be addressed include: - the self weight of the shaft; - the overhung propeller and its associated operational loads; - gear tooth load distribution; - main engine main bearing loads; - the flexibility and loading of the ship’s structure.
In this investigation TID were asked to determine the cause of the shaft misalignment of a bulk carrier when loaded, and to make recommendations for future operation (Lloyd’s Register [3]). TID measured the existing alignment using a combination of jacking and strain gauge techniques.
Computational Methods and Experimental Measurements XV 515
www.witpress.com, ISSN 1743-355X (on-line) WIT Transactions on Modelling and Simulation, Vol 51, © 2011 WIT Press
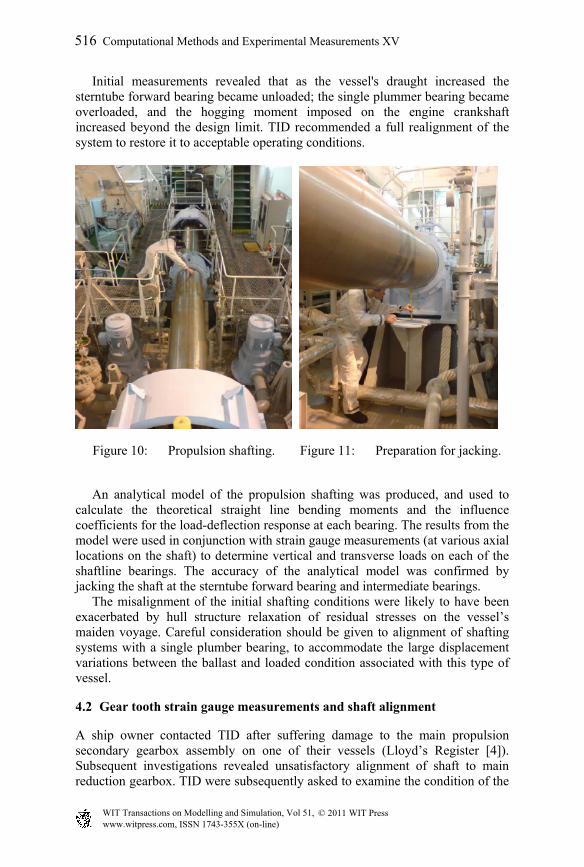
Initial measurements revealed that as the vessel's draught increased the sterntube forward bearing became unloaded; the single plummer bearing became overloaded, and the hogging moment imposed on the engine crankshaft increased beyond the design limit. TID recommended a full realignment of the system to restore it to acceptable operating conditions.
Figure 10: Propulsion shafting. Figure 11: Preparation for jacking.
An analytical model of the propulsion shafting was produced, and used to calculate the theoretical straight line bending moments and the influence coefficients for the load-deflection response at each bearing. The results from the model were used in conjunction with strain gauge measurements (at various axial locations on the shaft) to determine vertical and transverse loads on each of the shaftline bearings. The accuracy of the analytical model was confirmed by jacking the shaft at the sterntube forward bearing and intermediate bearings. The misalignment of the initial shafting conditions were likely to have been exacerbated by hull structure relaxation of residual stresses on the vessel’s maiden voyage. Careful consideration should be given to alignment of shafting systems with a single plumber bearing, to accommodate the large displacement variations between the ballast and loaded condition associated with this type of vessel.
4.2 Gear tooth strain gauge measurements and shaft alignment
A ship owner contacted TID after suffering damage to the main propulsion secondary gearbox assembly on one of their vessels (Lloyd’s Register [4]). Subsequent investigations revealed unsatisfactory alignment of shaft to main reduction gearbox. TID were subsequently asked to examine the condition of the
516 Computational Methods and Experimental Measurements XV
www.witpress.com, ISSN 1743-355X (on-line) WIT Transactions on Modelling and Simulation, Vol 51, © 2011 WIT Press
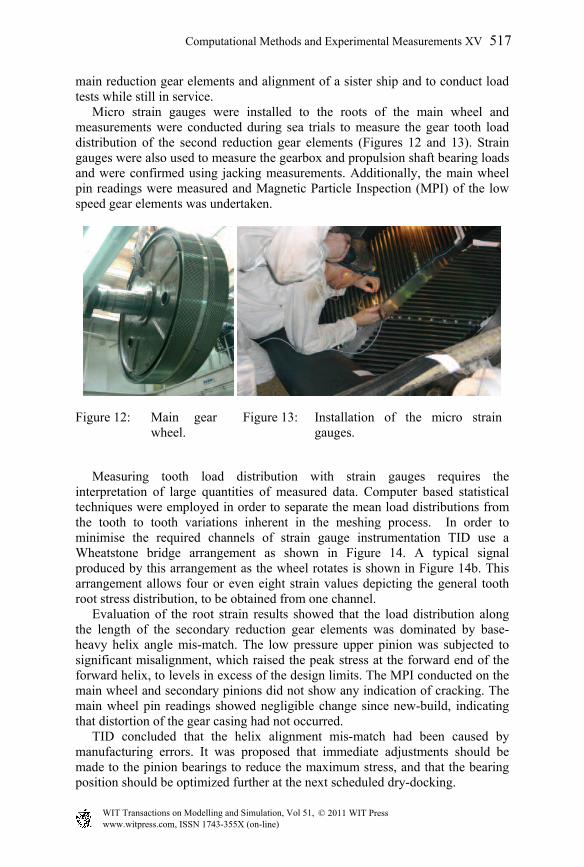
main reduction gear elements and alignment of a sister ship and to conduct load tests while still in service. Micro strain gauges were installed to the roots of the main wheel and measurements were conducted during sea trials to measure the gear tooth load distribution of the second reduction gear elements (Figures 12 and 13). Strain gauges were also used to measure the gearbox and propulsion shaft bearing loads and were confirmed using jacking measurements. Additionally, the main wheel pin readings were measured and Magnetic Particle Inspection (MPI) of the low speed gear elements was undertaken.
Figure 12: Main gear wheel.
Figure 13: Installation of the micro strain gauges.
Measuring tooth load distribution with strain gauges requires the interpretation of large quantities of measured data. Computer based statistical techniques were employed in order to separate the mean load distributions from the tooth to tooth variations inherent in the meshing process. In order to minimise the required channels of strain gauge instrumentation TID use a Wheatstone bridge arrangement as shown in Figure 14. A typical signal produced by this arrangement as the wheel rotates is shown in Figure 14b. This arrangement allows four or even eight strain values depicting the general tooth root stress distribution, to be obtained from one channel. Evaluation of the root strain results showed that the load distribution along the length of the secondary reduction gear elements was dominated by base-heavy helix angle mis-match. The low pressure upper pinion was subjected to significant misalignment, which raised the peak stress at the forward end of the forward helix, to levels in excess of the design limits. The MPI conducted on the main wheel and secondary pinions did not show any indication of cracking. The main wheel pin readings showed negligible change since new-build, indicating that distortion of the gear casing had not occurred. TID concluded that the helix alignment mis-match had been caused by manufacturing errors. It was proposed that immediate adjustments should be made to the pinion bearings to reduce the maximum stress, and that the bearing position should be optimized further at the next scheduled dry-docking.
Computational Methods and Experimental Measurements XV 517
www.witpress.com, ISSN 1743-355X (on-line) WIT Transactions on Modelling and Simulation, Vol 51, © 2011 WIT Press

Figure 14: Gear tooth strain measurements.
4.3 Leak testing by acoustic emission methods
In this case TID was asked to consider the feasibility of leak monitoring an offshore oil production manifold, using acoustic emission techniques similar to those previously used for fatigue crack detection and monitoring (Rogers [2]). The numerous control valves and interconnecting spool-pieces in the manifold represented numerous possibilities for leakage, which might not be evident until appreciable loss has occurred. Environmental regulations and public perception make leak detection by acoustic emissions an attractive option, especially during initial start up and early operation periods. TID was able to study a manifold to determine the most economic arrangement of sensors to detect leaks in high risk locations. It was concluded that eight acoustic emission sensors, distributed around the central valve block, and one sensor on each of the connecting hubs, would provide the required sensitivity for leak detection. The acoustic monitoring system sampled the root mean square signal level within octave frequency bands covering the range 10 kHz to 170 kHz. The measurements were relayed to the platform via a hard-wire digital communications link that was also used to supply power to the system. A sensor beacon would be actuated to indicate the existence of a possible leak at which
518 Computational Methods and Experimental Measurements XV
www.witpress.com, ISSN 1743-355X (on-line) WIT Transactions on Modelling and Simulation, Vol 51, © 2011 WIT Press
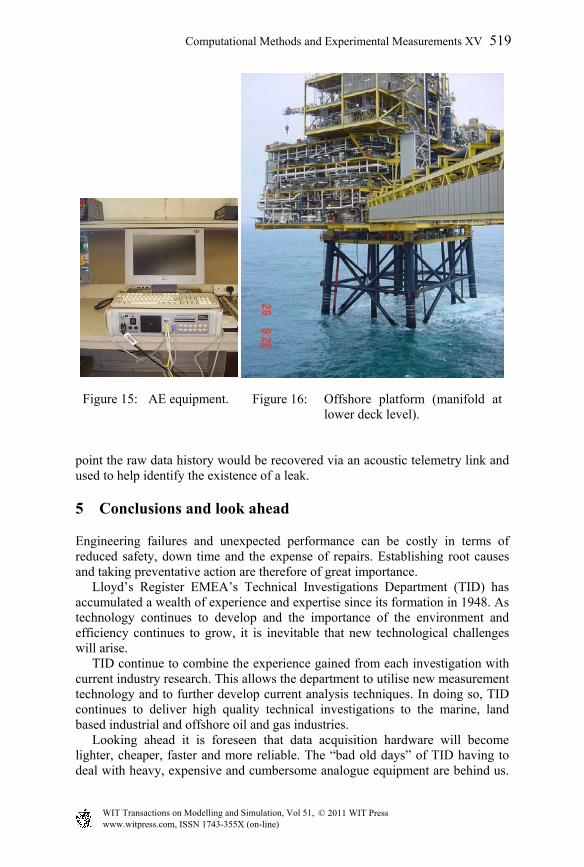
Figure 15: AE equipment. Figure 16: Offshore platform (manifold at lower deck level).
point the raw data history would be recovered via an acoustic telemetry link and used to help identify the existence of a leak.
5 Conclusions and look ahead
Engineering failures and unexpected performance can be costly in terms of reduced safety, down time and the expense of repairs. Establishing root causes and taking preventative action are therefore of great importance. Lloyd’s Register EMEA’s Technical Investigations Department (TID) has accumulated a wealth of experience and expertise since its formation in 1948. As technology continues to develop and the importance of the environment and efficiency continues to grow, it is inevitable that new technological challenges will arise. TID continue to combine the experience gained from each investigation with current industry research. This allows the department to utilise new measurement technology and to further develop current analysis techniques. In doing so, TID continues to deliver high quality technical investigations to the marine, land based industrial and offshore oil and gas industries. Looking ahead it is foreseen that data acquisition hardware will become lighter, cheaper, faster and more reliable. The “bad old days” of TID having to deal with heavy, expensive and cumbersome analogue equipment are behind us.
Computational Methods and Experimental Measurements XV 519
www.witpress.com, ISSN 1743-355X (on-line) WIT Transactions on Modelling and Simulation, Vol 51, © 2011 WIT Press

Processing and analysis techniques are not expected to change dramatically, but faster and more powerful analysis will enable techniques such as FEA, CFD and coupled fluid-structure-interaction (FSI) analysis to become more readily used as part of the investigation process. As always there will be no substitute for good people, adhering to proven procedures, within a supportive team.
References
[1] Carlton, J.S., Bantham I. “The Technical Investigation Department 50 Years of Operation”. Lloyd’s Register Technical Association, 1998.
[2] Rogers, L.M., “Structural and Engineering Monitoring by Acoustic Emission Methods – Fundamentals and Applications”. Lloyd’s Register Technical Association, pp. 5-25, 2001.
[3] Technical Matters, Lloyd’s Register EMEA, Issue 1, 1997-1998. [4] Technical Matters, Lloyd’s Register EMEA, Issue 3, 2009.
520 Computational Methods and Experimental Measurements XV
www.witpress.com, ISSN 1743-355X (on-line) WIT Transactions on Modelling and Simulation, Vol 51, © 2011 WIT Press