computer assisted identification of metabolites from ... · results and discussion for the...
TRANSCRIPT
AbstractThis Application Note demonstrates:• The use of the Agilent 1200 Rapid Resolution LC (RRLC) system for high resolution
separation of metabolites from an in-vitro metabolism experiment.• The use of the Agilent 6520 QTOF mass spectrometer for the acquisition of data
for computer assisted metabolite identification.• The use of the Agilent MassHunter Metabolite identification software for highly
productive identification of expected metabolites.• The results of the Metabolite ID data analysis for expected metabolites of the
pharmaceutical drug nefazodone
AuthorEdgar Nägele
Agilent Technologies
Waldbronn, Germany
Metabolite identification in drug discovery and drug development
Computer Assisted Identification ofMetabolites from Pharmaceutical DrugsPart 1: Identification of ExpectedMetabolites of NefazodoneIdentification of metabolites by the MassHunter Metabolite ID softwarefrom RRLC – QTOF MS data
Application Note
• Column: ZORBAX SB-C18, 2.1 x 150mm, 1.8 µm particle size.
Sample preparationStock solutions• Phosphate buffer 100 mM, pH 7.4
(81.8 mL 0.1 M Na2HPO4 + 18.2 mL 0.1M KH2PO4); 5 mM MgCl2
• Nefazodone hydrochloride 250 µM inphosphate buffer
• NADPH solution, 10 mg/mL phos-phate buffer
• Microsomal S9 preparation from ratliver, 20 mg protein/mL
Metabolite sampleDilute 25 µL of Nefazodone in 180 µLphosphate buffer in a 1.5 mL Eppendorfvial. Add 15 µL S9 preparation and 30 µL NADPH solution. Vortex andincubate for 1 h at 37°C. Stop thereaction by adding 750 µL ice coldacetonitrile and centrifuge at 14,000rpm for 15 minutes.
Remove the supernatant into a new1.5 mL Eppendorf vial and evaporate to dryness in a speedvac. Dissolve the remaining pellet in 250 µL HPLCsolvent A.
Control sampleDilute 25 µL of Nefazodone in 210 µLphosphate buffer in a 1.5 mL Eppendorfvial. Add 15 µL S9 preparation. Vortexand incubate for 1 h at 37 °C. Add 750 µL ice cold acetonitrile and cen-trifuge at 14,000 rpm for 15 minutes.
Remove the supernatant to a new 1.5 mL Eppendorf vial and evaporate to dryness in a speedvac. Dissolvethe remaining pellet in 250 µL HPLC
solvent A.
All chemicals and bio-reagents werepurchased from Sigma-Aldrich; HPLCsolvents (acetonitrile) were purchasedfrom Merck (Germany), and HPLCwater from Mallinckrodt-Baker.
MethodsHigh resolution RR LC methodThe Agilent 1200 Series binary pumpSL was operated under the followingconditions:Solvent A: Water + 0.1% formic
acid (FA),Solvent B: ACN + 0.1% FAFlow rate: 0.5 mL/minGradient: 0 min 5% B, 15 min 75% B
15.1 min 95% B16 min 95% B
Stop time: 16 minPost time: 10 min
The Agilent 1200 autosampler SL wasused to make injections of 1-10 µLsample with a 5 sec needle wash in50% methanol and the samples werecooled to 4 °C. The TCC was operatedat 60°C.
QTOF MS and MS/MS methodThe Agilent 6500 Series AccurateMass QTOF was operated in the 2GHzextended dynamic range mode withthe following acquisition parameters:Source: ESI in positive mode with
dual spray for reference mass solution (m/z 121.05087 and m/z 922.00979)
Drying gas flow: 10.0 L/minDry gas temperature: 300 ºCNebulizer: 45 psiMass range:100-1000Fragmentor: 200 VSkimmer: 60 VCapillary: 3500 VCollision energy: 30 VData depended MS/MS: 2 compounds
3 MS/MS spectraexclusion for 0.1 min
Data analysis method in the MetIDsoftwareThe first step in the analysis of thedata consists of a comparisonbetween the data file that contains themetabolite compounds (metabolitesample) and the data file that contains
Introduction
The examination of the metabolism ofnew pharmaceutical drug candidatesis an important step in the drug dis-covery and development process. Forthe evaluation of new technologiesthat improves the productivity in thisimportant area, well known com-pounds are used as benchmarks. Acompound that undergoes an exten-sive, well-documented metabolismand that can be used for this purposeis the pharmaceutical drugNefazodone1. To confirm the utility ofthe MassHunter MetID for the identifi-cation of possible metabolites, it hasbeen tested with this particular com-pound. The MassHunter MetID soft-ware uses the concept of multiplecooperative algorithms for the analy-sis of the QTOF MS and MS/MS dataas a strategy to produce a confidentoverall result that normalizes the influ-ence of a single algorithm2.This Application note Demonstratesthe use of the Agilent 1200 RRLC sys-tem and the Agilent 6500 SeriesAccurate Mass QTOF mass spectrom-eter for data acquisition from metabo-lism experiments, and the use of theMetID software for computer-assisteddata analysis. The results of the dataanalysis are discussed in detail forexamples of expected metabolites andunexpected metabolites3 from thepharmaceutical drug Nefazodone.
Experimental
Equipment• Agilent 1200 Series Rapid Resolution
LC system with binary pump SL anddegasser, high performanceautosampler SL (ALS SL) with ther-mostat, thermostated column com-partment (TCC) and Agilent 6500Series Accurate Mass QTOF massspectrometer.
2
Results and discussion
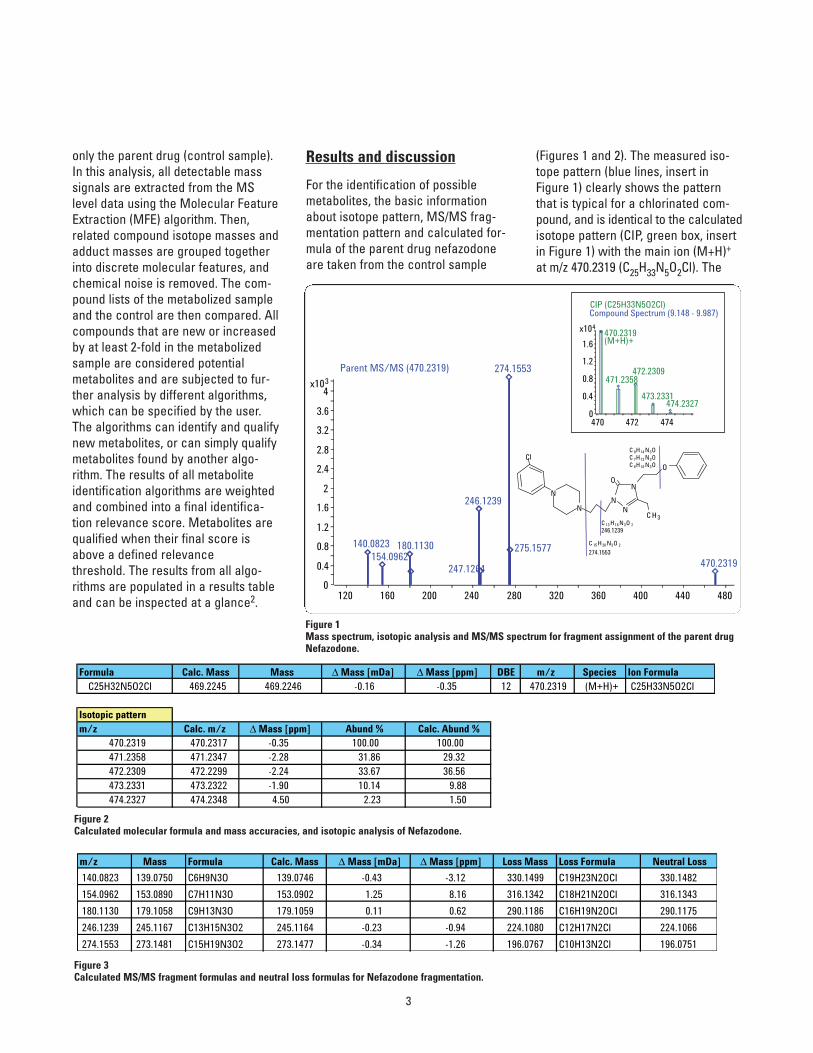
For the identification of possiblemetabolites, the basic informationabout isotope pattern, MS/MS frag-mentation pattern and calculated for-mula of the parent drug nefazodoneare taken from the control sample
(Figures 1 and 2). The measured iso-tope pattern (blue lines, insert inFigure 1) clearly shows the patternthat is typical for a chlorinated com-pound, and is identical to the calculatedisotope pattern (CIP, green box, insertin Figure 1) with the main ion (M+H)+
at m/z 470.2319 (C25H33N5O2Cl). The
only the parent drug (control sample).In this analysis, all detectable masssignals are extracted from the MSlevel data using the Molecular FeatureExtraction (MFE) algorithm. Then,related compound isotope masses andadduct masses are grouped togetherinto discrete molecular features, andchemical noise is removed. The com-pound lists of the metabolized sampleand the control are then compared. Allcompounds that are new or increasedby at least 2-fold in the metabolizedsample are considered potentialmetabolites and are subjected to fur-ther analysis by different algorithms,which can be specified by the user.The algorithms can identify and qualifynew metabolites, or can simply qualifymetabolites found by another algo-rithm. The results of all metaboliteidentification algorithms are weightedand combined into a final identifica-tion relevance score. Metabolites arequalified when their final score isabove a defined relevancethreshold. The results from all algo-rithms are populated in a results tableand can be inspected at a glance2.
3
120 160 200 240 280 320 360 400 440 480
3x10
0
0.4
0.8
1.2
1.6
2
2.4
2.8
3.2
3.6
4
140.0823154.0962
180.1130
246.1239
247.1264
274.1553
275.1577
470.2319
Parent MS/MS (470.2319)
470 472 474
4x10
0
0.4
0.8
1.2
1.6470.2319(M+H)+
471.2358472.2309
473.2331474.2327
CIP (C25H33N5O2Cl)Compound Spectrum (9.148 - 9.987)
NN
NO
C H3
N
N
OCl
C 13 H 16 N3O 2
246.1239
C 15 H 20 N3O 2
274.1553
C 9H 14 N3OC 7H 12 N3OC 6H 10 N3O
Figure 1Mass spectrum, isotopic analysis and MS/MS spectrum for fragment assignment of the parent drugNefazodone.
Formula Calc. Mass Mass Δ Mass [mDa] Δ Mass [ppm] DBE m/z Species Ion FormulaC25H32N5O2Cl 469.2245 469.2246 -0.16 -0.35 12 470.2319 (M+H)+ C25H33N5O2Cl
Isotopic patternm/z Calc. m/z Δ Mass [ppm] Abund % Calc. Abund %
470.2319 470.2317 -0.35 100.00 100.00471.2358 471.2347 -2.28 31.86 29.32472.2309 472.2299 -2.24 33.67 36.56473.2331 473.2322 -1.90 10.14 9.88474.2327 474.2348 4.50 2.23 1.50
Figure 2Calculated molecular formula and mass accuracies, and isotopic analysis of Nefazodone.
m/z Mass Formula Calc. Mass Δ Mass [mDa] Δ Mass [ppm] Loss Mass Loss Formula Neutral Loss
140.0823 139.0750 C6H9N3O 139.0746 -0.43 -3.12 330.1499 C19H23N2OCl 330.1482
154.0962 153.0890 C7H11N3O 153.0902 1.25 8.16 316.1342 C18H21N2OCl 316.1343
180.1130 179.1058 C9H13N3O 179.1059 0.11 0.62 290.1186 C16H19N2OCl 290.1175
246.1239 245.1167 C13H15N3O2 245.1164 -0.23 -0.94 224.1080 C12H17N2Cl 224.1066
274.1553 273.1481 C15H19N3O2 273.1477 -0.34 -1.26 196.0767 C10H13N2Cl 196.0751
Figure 3Calculated MS/MS fragment formulas and neutral loss formulas for Nefazodone fragmentation.
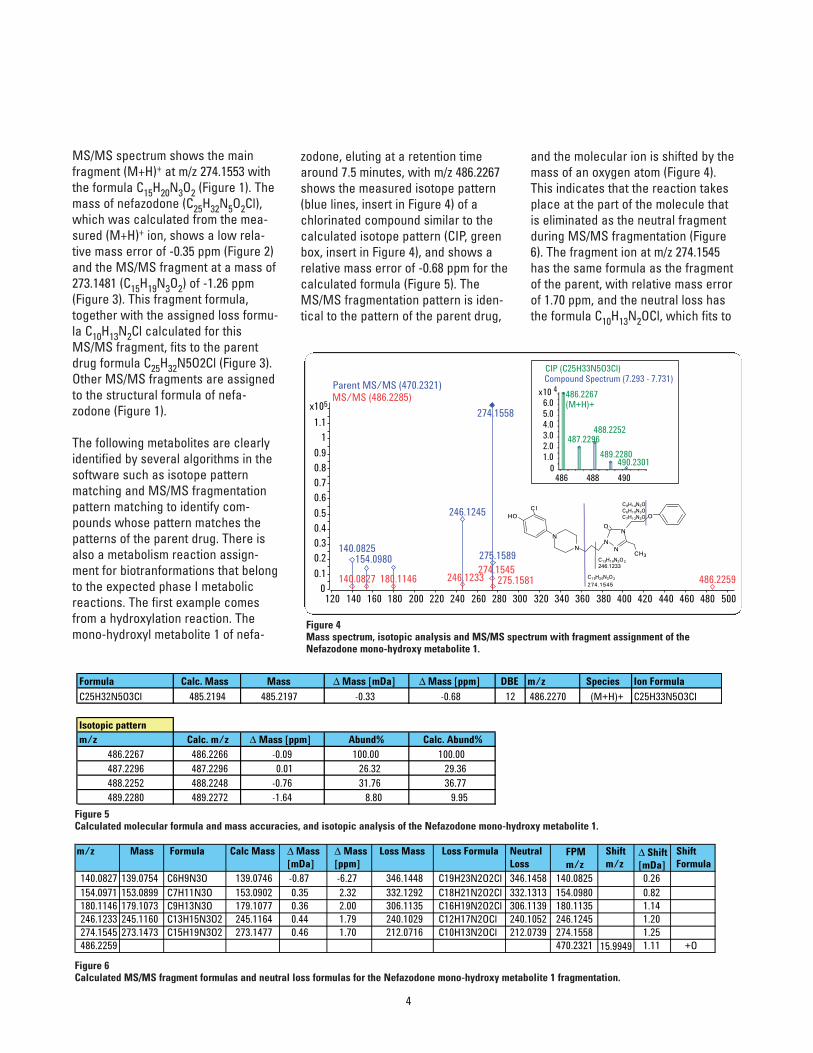
zodone, eluting at a retention timearound 7.5 minutes, with m/z 486.2267shows the measured isotope pattern(blue lines, insert in Figure 4) of achlorinated compound similar to thecalculated isotope pattern (CIP, greenbox, insert in Figure 4), and shows arelative mass error of -0.68 ppm for thecalculated formula (Figure 5). TheMS/MS fragmentation pattern is iden-tical to the pattern of the parent drug,
and the molecular ion is shifted by themass of an oxygen atom (Figure 4).This indicates that the reaction takesplace at the part of the molecule thatis eliminated as the neutral fragmentduring MS/MS fragmentation (Figure6). The fragment ion at m/z 274.1545has the same formula as the fragmentof the parent, with relative mass errorof 1.70 ppm, and the neutral loss hasthe formula C10H13N2OCl, which fits to
MS/MS spectrum shows the mainfragment (M+H)+ at m/z 274.1553 withthe formula C15H20N3O2 (Figure 1). Themass of nefazodone (C25H32N5O2Cl),which was calculated from the mea-sured (M+H)+ ion, shows a low rela-tive mass error of -0.35 ppm (Figure 2)and the MS/MS fragment at a mass of273.1481 (C15H19N3O2) of -1.26 ppm(Figure 3). This fragment formula,together with the assigned loss formu-la C10H13N2Cl calculated for thisMS/MS fragment, fits to the parentdrug formula C25H32N5O2Cl (Figure 3).Other MS/MS fragments are assignedto the structural formula of nefa-zodone (Figure 1).
The following metabolites are clearlyidentified by several algorithms in thesoftware such as isotope patternmatching and MS/MS fragmentationpattern matching to identify com-pounds whose pattern matches thepatterns of the parent drug. There isalso a metabolism reaction assign-ment for biotranformations that belongto the expected phase I metabolicreactions. The first example comesfrom a hydroxylation reaction. Themono-hydroxyl metabolite 1 of nefa-
4
120 140 160 180 200 220 240 260 280 300 320 340 360 380 400 420 440 460 480 500
5x10
0
0.1
0.2
0.3
0.4
0.5
0.6
0.7
0.8
0.9
1
1.1
140.0825154.0980
246.1245
274.1558
275.1589
140.0827 180.1146 246.1233274.1545
275.1581 486.2259
Parent MS/MS (470.2321)MS/MS (486.2285)
486 488 4900
1.02.03.04.05.06.0
486.2267(M+H)+
487.2296488.2252
489.2280490.2301
CIP (C25H33N5O3Cl)Compound Spectrum (7.293 - 7.731)
NN
NO
CH3
N
N
OCl
OH
C13H16N3O2
246.1233
C15H20N3O2
274.1545
C9H14N3OC6H10N3OC7H12N3O
4x10
Figure 4Mass spectrum, isotopic analysis and MS/MS spectrum with fragment assignment of theNefazodone mono-hydroxy metabolite 1.
Formula Calc. Mass Mass Δ Mass [mDa] Δ Mass [ppm] DBE m/z Species Ion Formula
C25H32N5O3Cl 485.2194 485.2197 -0.33 -0.68 12 486.2270 (M+H)+ C25H33N5O3Cl
Isotopic patternm/z Calc. m/z Δ Mass [ppm] Abund% Calc. Abund%
486.2267 486.2266 -0.09 100.00 100.00487.2296 487.2296 0.01 26.32 29.36488.2252 488.2248 -0.76 31.76 36.77489.2280 489.2272 -1.64 8.80 9.95
m/z Mass Formula Calc Mass Δ Mass [mDa]
Δ Mass[ppm]
Loss Mass Loss Formula Neutral Loss
FPM m/z
Shift m/z
Δ Shift [mDa]
Shift Formula
140.0827 139.0754 C6H9N3O 139.0746 -0.87 -6.27 346.1448 C19H23N2O2Cl 346.1458 140.0825 0.26154.0971 153.0899 C7H11N3O 153.0902 0.35 2.32 332.1292 C18H21N2O2Cl 332.1313 154.0980 0.82180.1146 179.1073 C9H13N3O 179.1077 0.36 2.00 306.1135 C16H19N2O2Cl 306.1139 180.1135 1.14246.1233 245.1160 C13H15N3O2 245.1164 0.44 1.79 240.1029 C12H17N2OCl 240.1052 246.1245 1.20274.1545 273.1473 C15H19N3O2 273.1477 0.46 1.70 212.0716 C10H13N2OCl 212.0739 274.1558 1.25486.2259 470.2321 15.9949 1.11 +O
Figure 6Calculated MS/MS fragment formulas and neutral loss formulas for the Nefazodone mono-hydroxy metabolite 1 fragmentation.
Figure 5Calculated molecular formula and mass accuracies, and isotopic analysis of the Nefazodone mono-hydroxy metabolite 1.
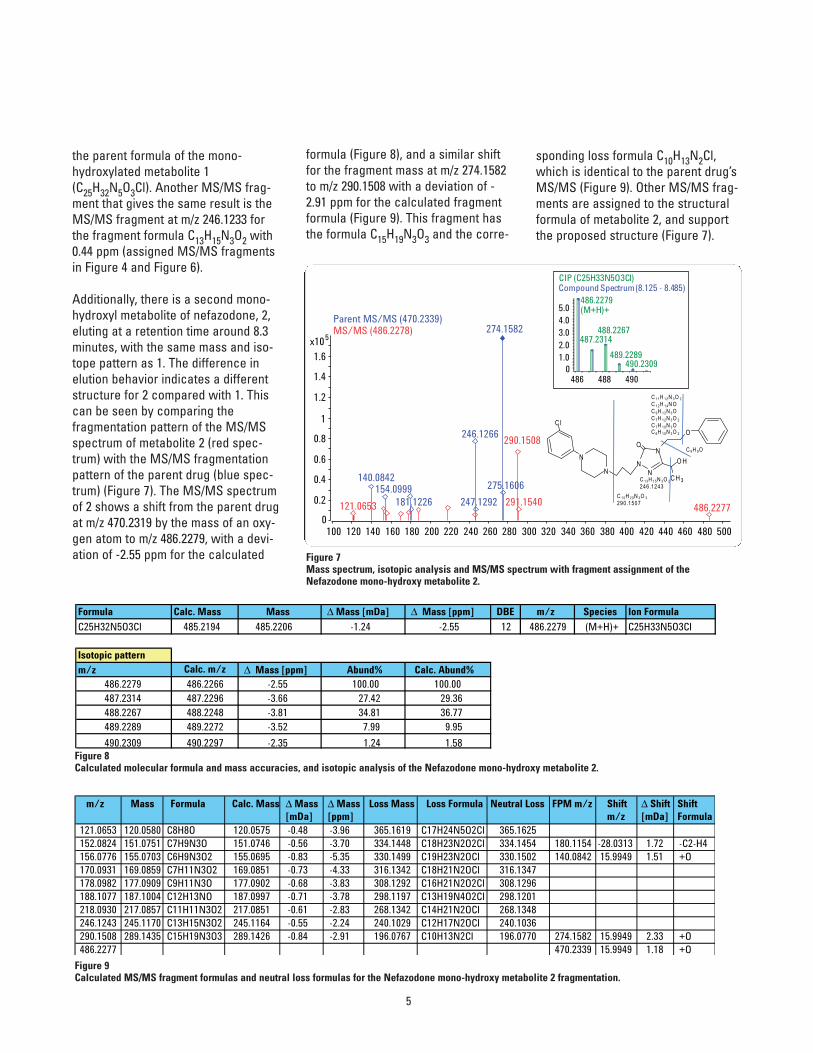
formula (Figure 8), and a similar shiftfor the fragment mass at m/z 274.1582to m/z 290.1508 with a deviation of -2.91 ppm for the calculated fragmentformula (Figure 9). This fragment hasthe formula C15H19N3O3 and the corre-
sponding loss formula C10H13N2Cl,which is identical to the parent drug’sMS/MS (Figure 9). Other MS/MS frag-ments are assigned to the structuralformula of metabolite 2, and supportthe proposed structure (Figure 7).
the parent formula of the mono-hydroxylated metabolite 1(C25H32N5O3Cl). Another MS/MS frag-ment that gives the same result is theMS/MS fragment at m/z 246.1233 forthe fragment formula C13H15N3O2 with0.44 ppm (assigned MS/MS fragmentsin Figure 4 and Figure 6).
Additionally, there is a second mono-hydroxyl metabolite of nefazodone, 2,eluting at a retention time around 8.3minutes, with the same mass and iso-tope pattern as 1. The difference inelution behavior indicates a differentstructure for 2 compared with 1. Thiscan be seen by comparing thefragmentation pattern of the MS/MSspectrum of metabolite 2 (red spec-trum) with the MS/MS fragmentationpattern of the parent drug (blue spec-trum) (Figure 7). The MS/MS spectrumof 2 shows a shift from the parent drugat m/z 470.2319 by the mass of an oxy-gen atom to m/z 486.2279, with a devi-ation of -2.55 ppm for the calculated
5
100 120 140 160 180 200 220 240 260 280 300 320 340 360 380 400 420 440 460 480 500
5x10
0
0.2
0.4
0.6
0.8
1
1.2
1.4
1.6
140.0842154.0999
181.1226
246.1266
247.1292
274.1582
275.1606
121.0653
290.1508
291.1540 486.2277
Parent MS/MS (470.2339)MS/MS (486.2278)
NN
NO
C H 3
N
N
OC l
O H
C 1 5H 2 0N 3O 3
290.1507
C 1 3H 1 5N 3O 2
246.1243
C 1 1H 1 2N 3O 2
C 1 2H 1 4N OC 9H 1 2N 3OC 7H 1 2N 3O 2
C 7H 1 0N 3OC 6H 1 0N 3O 2
C 8H 9O
486 488 4900
1.02.03.04.05.0
486.2279(M+H)+
487.2314488.2267
489.2289490.2309
CIP (C25H33N5O3Cl)Compound Spectrum (8.125 - 8.485)
Formula Calc. Mass Mass Δ Mass [mDa] Δ Mass [ppm] DBE m/z Species Ion Formula
C25H32N5O3Cl 485.2194 485.2206 -1.24 -2.55 12 486.2279 (M+H)+ C25H33N5O3Cl
Isotopic patternm/z Calc. m/z Δ Mass [ppm] Abund% Calc. Abund%
486.2279 486.2266 -2.55 100.00 100.00487.2314 487.2296 -3.66 27.42 29.36488.2267 488.2248 -3.81 34.81 36.77489.2289 489.2272 -3.52 7.99 9.95
490.2309 490.2297 -2.35 1.24 1.58
m/z Mass Formula Calc. Mass Δ Mass [mDa]
Δ Mass [ppm]
Loss Mass Loss Formula Neutral Loss FPM m/z Shift m/z
Δ Shift [mDa]
Shift Formula
121.0653 120.0580 C8H8O 120.0575 -0.48 -3.96 365.1619 C17H24N5O2Cl 365.1625152.0824 151.0751 C7H9N3O 151.0746 -0.56 -3.70 334.1448 C18H23N2O2Cl 334.1454 180.1154 -28.0313 1.72 -C2-H4156.0776 155.0703 C6H9N3O2 155.0695 -0.83 -5.35 330.1499 C19H23N2OCl 330.1502 140.0842 15.9949 1.51 +O170.0931 169.0859 C7H11N3O2 169.0851 -0.73 -4.33 316.1342 C18H21N2OCl 316.1347178.0982 177.0909 C9H11N3O 177.0902 -0.68 -3.83 308.1292 C16H21N2O2Cl 308.1296188.1077 187.1004 C12H13NO 187.0997 -0.71 -3.78 298.1197 C13H19N4O2Cl 298.1201218.0930 217.0857 C11H11N3O2 217.0851 -0.61 -2.83 268.1342 C14H21N2OCl 268.1348246.1243 245.1170 C13H15N3O2 245.1164 -0.55 -2.24 240.1029 C12H17N2OCl 240.1036290.1508 289.1435 C15H19N3O3 289.1426 -0.84 -2.91 196.0767 C10H13N2Cl 196.0770 274.1582 15.9949 2.33 +O486.2277 470.2339 15.9949 1.18 +O
Figure 9Calculated MS/MS fragment formulas and neutral loss formulas for the Nefazodone mono-hydroxy metabolite 2 fragmentation.
Figure 8Calculated molecular formula and mass accuracies, and isotopic analysis of the Nefazodone mono-hydroxy metabolite 2.
Figure 7Mass spectrum, isotopic analysis and MS/MS spectrum with fragment assignment of theNefazodone mono-hydroxy metabolite 2.
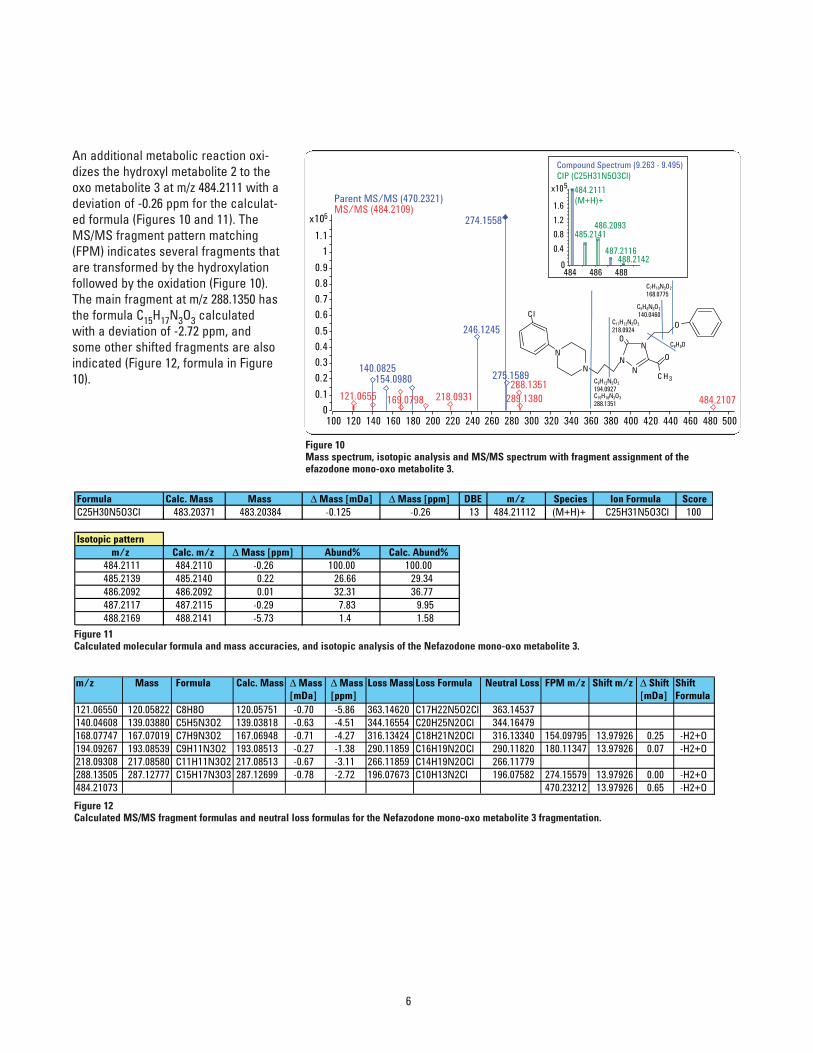
An additional metabolic reaction oxi-dizes the hydroxyl metabolite 2 to theoxo metabolite 3 at m/z 484.2111 with adeviation of -0.26 ppm for the calculat-ed formula (Figures 10 and 11). TheMS/MS fragment pattern matching(FPM) indicates several fragments thatare transformed by the hydroxylationfollowed by the oxidation (Figure 10).The main fragment at m/z 288.1350 hasthe formula C15H17N3O3 calculatedwith a deviation of -2.72 ppm, andsome other shifted fragments are alsoindicated (Figure 12, formula in Figure10).
6
100 120 140 160 180 200 220 240 260 280 300 320 340 360 380 400 420 440 460 480 500
5x10
0
0.1
0.2
0.3
0.4
0.5
0.6
0.7
0.8
0.9
1
1.1
140.0825154.0980
246.1245
274.1558
275.1589
121.0655 169.0798 218.0931288.1351
289.1380 484.2107
Parent MS/MS (470.2321)MS/MS (484.2109)
484 486 488
5x10
0
0.4
0.8
1.2
1.6
484.2111(M+H)+
485.2141486.2093
487.2116488.2142
CIP (C25H31N5O3Cl)Compound Spectrum (9.263 - 9.495)
NN
NO
C H 3
N
N
OC l
O
C15H18N3O3
288.1351
C11H12N3O2
218.0924
C7H10N3O2
168.0775
C8H9O
C5H6N3O2
140.0460
C9H12N3O2
194.0927
Formula Calc. Mass Mass Δ Mass [mDa] Δ Mass [ppm] DBE m/z Species Ion Formula ScoreC25H30N5O3Cl 483.20371 483.20384 -0.125 -0.26 13 484.21112 (M+H)+ C25H31N5O3Cl 100
Isotopic patternm/z Calc. m/z Δ Mass [ppm] Abund% Calc. Abund%
484.2111 484.2110 -0.26 100.00 100.00485.2139 485.2140 0.22 26.66 29.34486.2092 486.2092 0.01 32.31 36.77487.2117 487.2115 -0.29 7.83 9.95488.2169 488.2141 -5.73 1.4 1.58
m/z Mass Formula Calc. Mass Δ Mass [mDa]
Δ Mass [ppm]
Loss Mass Loss Formula Neutral Loss FPM m/z Shift m/z Δ Shift [mDa]
Shift Formula
121.06550 120.05822 C8H8O 120.05751 -0.70 -5.86 363.14620 C17H22N5O2Cl 363.14537140.04608 139.03880 C5H5N3O2 139.03818 -0.63 -4.51 344.16554 C20H25N2OCl 344.16479168.07747 167.07019 C7H9N3O2 167.06948 -0.71 -4.27 316.13424 C18H21N2OCl 316.13340 154.09795 13.97926 0.25 -H2+O194.09267 193.08539 C9H11N3O2 193.08513 -0.27 -1.38 290.11859 C16H19N2OCl 290.11820 180.11347 13.97926 0.07 -H2+O218.09308 217.08580 C11H11N3O2 217.08513 -0.67 -3.11 266.11859 C14H19N2OCl 266.11779288.13505 287.12777 C15H17N3O3 287.12699 -0.78 -2.72 196.07673 C10H13N2Cl 196.07582 274.15579 13.97926 0.00 -H2+O484.21073 470.23212 13.97926 0.65 -H2+O
Figure 12Calculated MS/MS fragment formulas and neutral loss formulas for the Nefazodone mono-oxo metabolite 3 fragmentation.
Figure 11Calculated molecular formula and mass accuracies, and isotopic analysis of the Nefazodone mono-oxo metabolite 3.
Figure 10Mass spectrum, isotopic analysis and MS/MS spectrum with fragment assignment of the efazodone mono-oxo metabolite 3.
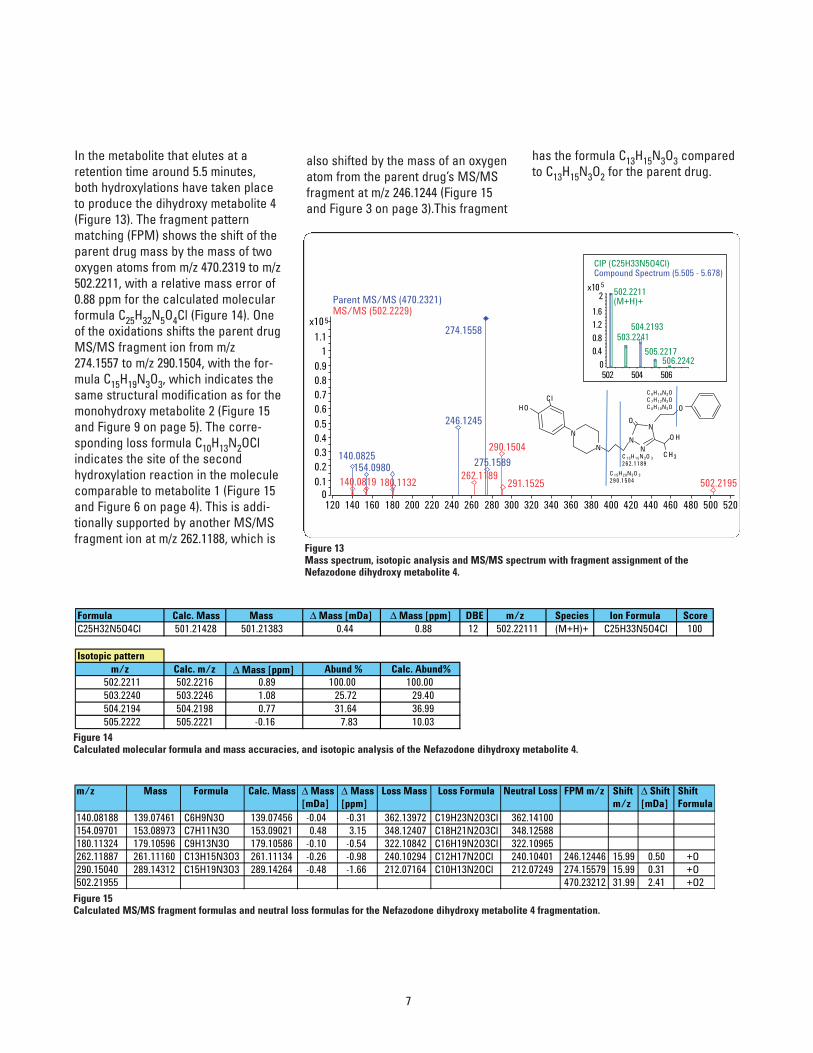
In the metabolite that elutes at aretention time around 5.5 minutes,both hydroxylations have taken placeto produce the dihydroxy metabolite 4(Figure 13). The fragment patternmatching (FPM) shows the shift of theparent drug mass by the mass of twooxygen atoms from m/z 470.2319 to m/z502.2211, with a relative mass error of0.88 ppm for the calculated molecularformula C25H32N5O4Cl (Figure 14). Oneof the oxidations shifts the parent drugMS/MS fragment ion from m/z274.1557 to m/z 290.1504, with the for-mula C15H19N3O3, which indicates thesame structural modification as for themonohydroxy metabolite 2 (Figure 15and Figure 9 on page 5). The corre-sponding loss formula C10H13N2OClindicates the site of the secondhydroxylation reaction in the moleculecomparable to metabolite 1 (Figure 15and Figure 6 on page 4). This is addi-tionally supported by another MS/MSfragment ion at m/z 262.1188, which is
7
120 140 160 180 200 220 240 260 280 300 320 340 360 380 400 420 440 460 480 500 520
5x10
00.1
0.20.30.40.5
0.60.70.80.9
11.1
140.0825154.0980
246.1245
274.1558
275.1589
140.0819 180.1132262.1189
290.1504
291.1525 502.2195
Parent MS/MS (470.2321)MS/MS (502.2229)
502 504 506
5x10
0
0.4
0.8
1.2
1.6
2 502.2211(M+H)+
503.2241504.2193
505.2217506.2242
CIP (C25H33N5O4Cl)Compound Spectrum (5.505 - 5.678)
NN
NO
C H 3
N
N
OC l
O H
OH
C 1 5H 2 0N3O 3
290.1504
C 1 3H 1 5N3O 3
262.1189
C 9H 1 4N3OC 7H 1 2N3OC 6H 1 0N3O
Formula Calc. Mass Mass Δ Mass [mDa] Δ Mass [ppm] DBE m/z Species Ion Formula ScoreC25H32N5O4Cl 501.21428 501.21383 0.44 0.88 12 502.22111 (M+H)+ C25H33N5O4Cl 100
Isotopic patternm/z Calc. m/z Δ Mass [ppm] Abund % Calc. Abund%
502.2211 502.2216 0.89 100.00 100.00503.2240 503.2246 1.08 25.72 29.40504.2194 504.2198 0.77 31.64 36.99505.2222 505.2221 -0.16 7.83 10.03
m/z Mass Formula Calc. Mass Δ Mass [mDa]
Δ Mass [ppm]
Loss Mass Loss Formula Neutral Loss FPM m/z Shift m/z
Δ Shift [mDa]
Shift Formula
140.08188 139.07461 C6H9N3O 139.07456 -0.04 -0.31 362.13972 C19H23N2O3Cl 362.14100154.09701 153.08973 C7H11N3O 153.09021 0.48 3.15 348.12407 C18H21N2O3Cl 348.12588180.11324 179.10596 C9H13N3O 179.10586 -0.10 -0.54 322.10842 C16H19N2O3Cl 322.10965262.11887 261.11160 C13H15N3O3 261.11134 -0.26 -0.98 240.10294 C12H17N2OCl 240.10401 246.12446 15.99 0.50 +O290.15040 289.14312 C15H19N3O3 289.14264 -0.48 -1.66 212.07164 C10H13N2OCl 212.07249 274.15579 15.99 0.31 +O502.21955 470.23212 31.99 2.41 +O2
Figure 15Calculated MS/MS fragment formulas and neutral loss formulas for the Nefazodone dihydroxy metabolite 4 fragmentation.
Figure 14Calculated molecular formula and mass accuracies, and isotopic analysis of the Nefazodone dihydroxy metabolite 4.
Figure 13Mass spectrum, isotopic analysis and MS/MS spectrum with fragment assignment of theNefazodone dihydroxy metabolite 4.
also shifted by the mass of an oxygenatom from the parent drug’s MS/MSfragment at m/z 246.1244 (Figure 15and Figure 3 on page 3).This fragment
has the formula C13H15N3O3 comparedto C13H15N3O2 for the parent drug.
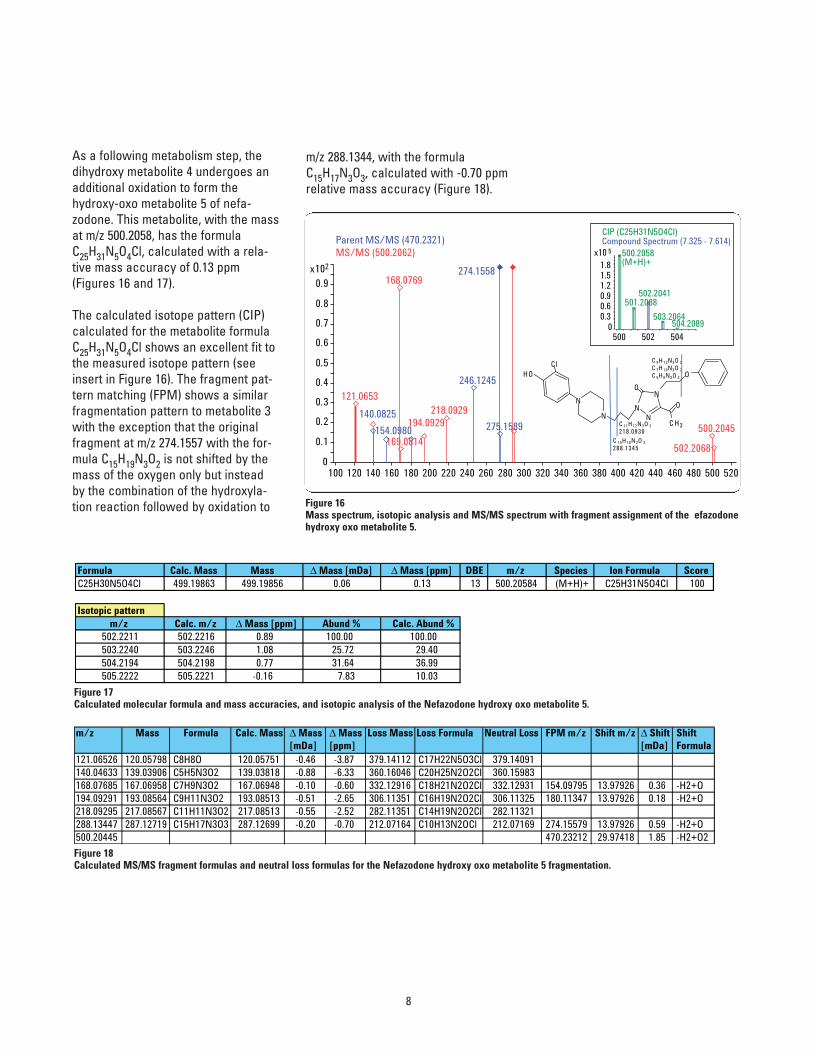
m/z 288.1344, with the formulaC15H17N3O3, calculated with -0.70 ppmrelative mass accuracy (Figure 18).
As a following metabolism step, thedihydroxy metabolite 4 undergoes anadditional oxidation to form thehydroxy-oxo metabolite 5 of nefa-zodone. This metabolite, with the massat m/z 500.2058, has the formulaC25H31N5O4Cl, calculated with a rela-tive mass accuracy of 0.13 ppm(Figures 16 and 17).
The calculated isotope pattern (CIP)calculated for the metabolite formulaC25H31N5O4Cl shows an excellent fit tothe measured isotope pattern (seeinsert in Figure 16). The fragment pat-tern matching (FPM) shows a similarfragmentation pattern to metabolite 3with the exception that the originalfragment at m/z 274.1557 with the for-mula C15H19N3O2 is not shifted by themass of the oxygen only but insteadby the combination of the hydroxyla-tion reaction followed by oxidation to
8
100 120 140 160 180 200 220 240 260 280 300 320 340 360 380 400 420 440 460 480 500 520
2x10
0
0.1
0.2
0.3
0.4
0.5
0.6
0.7
0.8
0.9
140.0825
154.0980
246.1245
274.1558
275.1589
121.0653
168.0769
169.0814
194.0929218.0929
500.2045
502.2068
Parent MS/MS (470.2321)MS/MS (500.2062)
500 502 504
5x10
00.30.60.91.21.51.8
500.2058(M+H)+
501.2088502.2041
503.2064504.2089
CIP (C25H31N5O4Cl)Compound Spectrum (7.325 - 7.614)
NN
NO
C H 3
N
N
OC l
O
OH
C 9H 1 2N3O 2
C 7H 1 0N3O 2
C 5H 6N3O 2
C 1 5H 1 8N3O 3
288.1345
C 1 1H 1 2N3O 3
218.0930
Formula Calc. Mass Mass Δ Mass [mDa] Δ Mass [ppm] DBE m/z Species Ion Formula ScoreC25H30N5O4Cl 499.19863 499.19856 0.06 0.13 13 500.20584 (M+H)+ C25H31N5O4Cl 100
Isotopic patternm/z Calc. m/z Δ Mass [ppm] Abund % Calc. Abund %
502.2211 502.2216 0.89 100.00 100.00503.2240 503.2246 1.08 25.72 29.40504.2194 504.2198 0.77 31.64 36.99505.2222 505.2221 -0.16 7.83 10.03
m/z Mass Formula Calc. Mass Δ Mass [mDa]
Δ Mass [ppm]
Loss Mass Loss Formula Neutral Loss FPM m/z Shift m/z Δ Shift [mDa]
Shift Formula
121.06526 120.05798 C8H8O 120.05751 -0.46 -3.87 379.14112 C17H22N5O3Cl 379.14091140.04633 139.03906 C5H5N3O2 139.03818 -0.88 -6.33 360.16046 C20H25N2O2Cl 360.15983168.07685 167.06958 C7H9N3O2 167.06948 -0.10 -0.60 332.12916 C18H21N2O2Cl 332.12931 154.09795 13.97926 0.36 -H2+O194.09291 193.08564 C9H11N3O2 193.08513 -0.51 -2.65 306.11351 C16H19N2O2Cl 306.11325 180.11347 13.97926 0.18 -H2+O218.09295 217.08567 C11H11N3O2 217.08513 -0.55 -2.52 282.11351 C14H19N2O2Cl 282.11321288.13447 287.12719 C15H17N3O3 287.12699 -0.20 -0.70 212.07164 C10H13N2OCl 212.07169 274.15579 13.97926 0.59 -H2+O500.20445 470.23212 29.97418 1.85 -H2+O2
Figure 18Calculated MS/MS fragment formulas and neutral loss formulas for the Nefazodone hydroxy oxo metabolite 5 fragmentation.
Figure 17Calculated molecular formula and mass accuracies, and isotopic analysis of the Nefazodone hydroxy oxo metabolite 5.
Figure 16Mass spectrum, isotopic analysis and MS/MS spectrum with fragment assignment of the efazodonehydroxy oxo metabolite 5.
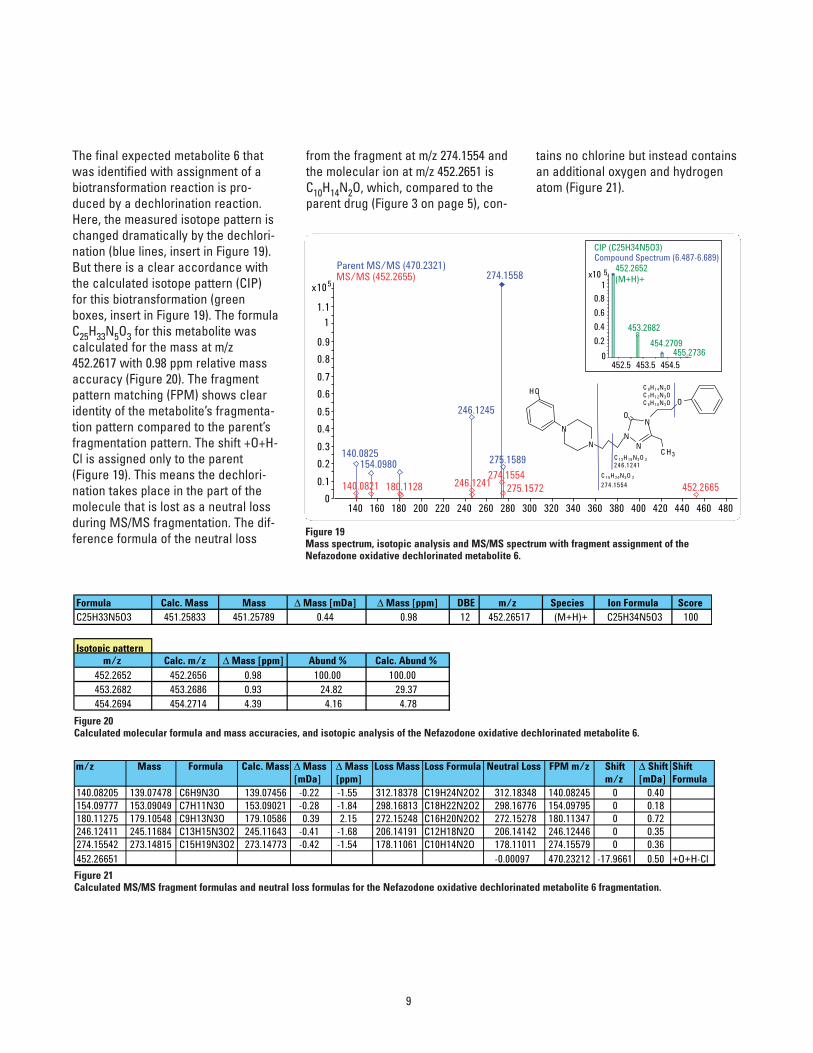
from the fragment at m/z 274.1554 andthe molecular ion at m/z 452.2651 isC10H14N2O, which, compared to theparent drug (Figure 3 on page 5), con-
tains no chlorine but instead containsan additional oxygen and hydrogenatom (Figure 21).
The final expected metabolite 6 thatwas identified with assignment of abiotransformation reaction is pro-duced by a dechlorination reaction.Here, the measured isotope pattern ischanged dramatically by the dechlori-nation (blue lines, insert in Figure 19).But there is a clear accordance withthe calculated isotope pattern (CIP)for this biotransformation (greenboxes, insert in Figure 19). The formulaC25H33N5O3 for this metabolite wascalculated for the mass at m/z452.2617 with 0.98 ppm relative massaccuracy (Figure 20). The fragmentpattern matching (FPM) shows clearidentity of the metabolite’s fragmenta-tion pattern compared to the parent’sfragmentation pattern. The shift +O+H-Cl is assigned only to the parent(Figure 19). This means the dechlori-nation takes place in the part of themolecule that is lost as a neutral lossduring MS/MS fragmentation. The dif-ference formula of the neutral loss
9
140 160 180 200 220 240 260 280 300 320 340 360 380 400 420 440 460 480
5x10
0
0.1
0.2
0.3
0.4
0.5
0.6
0.7
0.8
0.9
1
1.1
140.0825154.0980
246.1245
274.1558
275.1589
140.0821 180.1128 246.1241274.1554
275.1572 452.2665
Parent MS/MS (470.2321)MS/MS (452.2655)
452.5 453.5 454.5
5x10
0
0.2
0.4
0.6
0.8
1
452.2652(M+H)+
453.2682
454.2709455.2736
CIP (C25H34N5O3)Compound Spectrum (6.487-6.689)
C 1 3H 1 6N3O 2
246.1241
C 1 5H 2 0N3O 2
274.1554
NN
NO
C H 3
N
N
OOH C 9H 1 4N3O
C 7H 1 2N3OC 6H 1 0N3O
Formula Calc. Mass Mass Δ Mass [mDa] Δ Mass [ppm] DBE m/z Species Ion Formula ScoreC25H33N5O3 451.25833 451.25789 0.44 0.98 12 452.26517 (M+H)+ C25H34N5O3 100
Isotopic patternm/z Calc. m/z Δ Mass [ppm] Abund % Calc. Abund %
452.2652 452.2656 0.98 100.00 100.00453.2682 453.2686 0.93 24.82 29.37454.2694 454.2714 4.39 4.16 4.78
m/z Mass Formula Calc. Mass Δ Mass [mDa]
Δ Mass[ppm]
Loss Mass Loss Formula Neutral Loss FPM m/z Shift m/z
Δ Shift [mDa]
Shift Formula
140.08205 139.07478 C6H9N3O 139.07456 -0.22 -1.55 312.18378 C19H24N2O2 312.18348 140.08245 0 0.40154.09777 153.09049 C7H11N3O 153.09021 -0.28 -1.84 298.16813 C18H22N2O2 298.16776 154.09795 0 0.18180.11275 179.10548 C9H13N3O 179.10586 0.39 2.15 272.15248 C16H20N2O2 272.15278 180.11347 0 0.72246.12411 245.11684 C13H15N3O2 245.11643 -0.41 -1.68 206.14191 C12H18N2O 206.14142 246.12446 0 0.35274.15542 273.14815 C15H19N3O2 273.14773 -0.42 -1.54 178.11061 C10H14N2O 178.11011 274.15579 0 0.36452.26651 -0.00097 470.23212 -17.9661 0.50 +O+H-Cl
Figure 21Calculated MS/MS fragment formulas and neutral loss formulas for the Nefazodone oxidative dechlorinated metabolite 6 fragmentation.
Figure 20Calculated molecular formula and mass accuracies, and isotopic analysis of the Nefazodone oxidative dechlorinated metabolite 6.
Figure 19Mass spectrum, isotopic analysis and MS/MS spectrum with fragment assignment of theNefazodone oxidative dechlorinated metabolite 6.
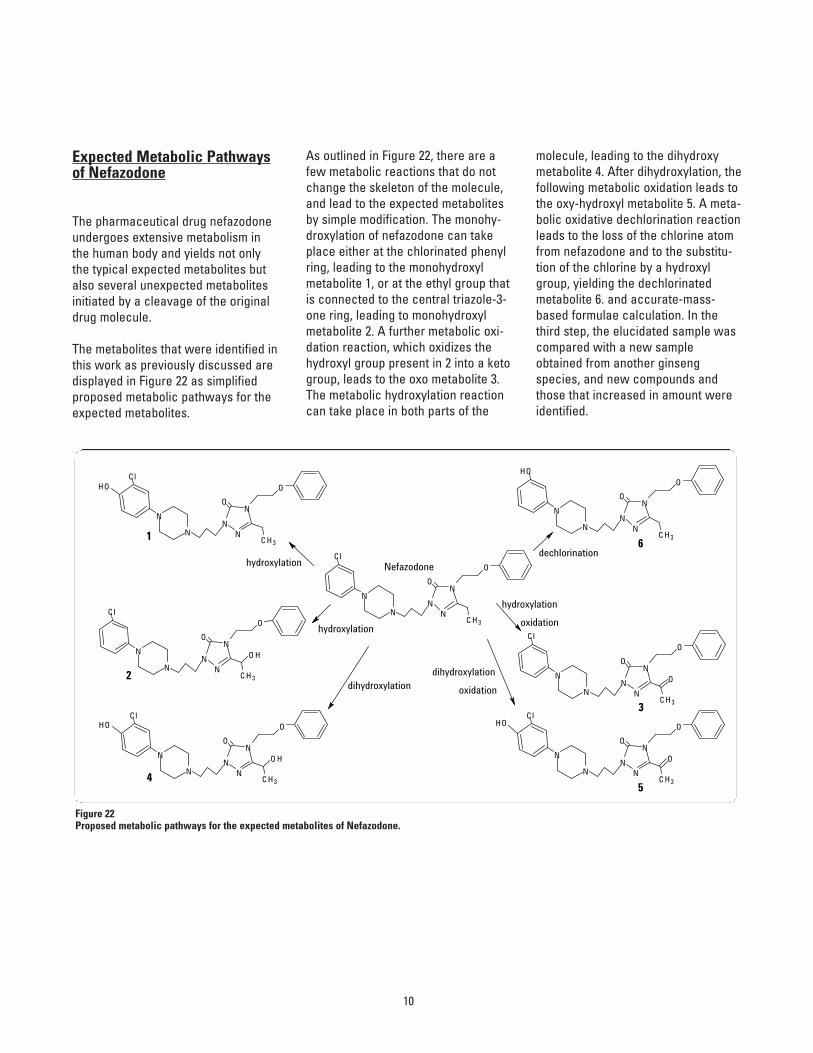
As outlined in Figure 22, there are afew metabolic reactions that do notchange the skeleton of the molecule,and lead to the expected metabolitesby simple modification. The monohy-droxylation of nefazodone can takeplace either at the chlorinated phenylring, leading to the monohydroxylmetabolite 1, or at the ethyl group thatis connected to the central triazole-3-one ring, leading to monohydroxylmetabolite 2. A further metabolic oxi-dation reaction, which oxidizes thehydroxyl group present in 2 into a ketogroup, leads to the oxo metabolite 3. The metabolic hydroxylation reactioncan take place in both parts of the
molecule, leading to the dihydroxymetabolite 4. After dihydroxylation, thefollowing metabolic oxidation leads tothe oxy-hydroxyl metabolite 5. A meta-bolic oxidative dechlorination reactionleads to the loss of the chlorine atomfrom nefazodone and to the substitu-tion of the chlorine by a hydroxylgroup, yielding the dechlorinatedmetabolite 6. and accurate-mass-based formulae calculation. In thethird step, the elucidated sample wascompared with a new sampleobtained from another ginsengspecies, and new compounds andthose that increased in amount wereidentified.
Expected Metabolic Pathwaysof Nefazodone
The pharmaceutical drug nefazodoneundergoes extensive metabolism inthe human body and yields not onlythe typical expected metabolites butalso several unexpected metabolitesinitiated by a cleavage of the originaldrug molecule.
The metabolites that were identified inthis work as previously discussed aredisplayed in Figure 22 as simplifiedproposed metabolic pathways for theexpected metabolites.
10
NN
NO
C H 3
N
N
OC l
NN
NO
C H 3
N
N
OC l
OH
NN
NO
C H 3
N
N
OC l
O H
NN
NO
C H 3
N
N
OOH
NN
NO
C H 3
N
N
OC l
O H
OH
NN
NO
C H 3
N
N
OC l
O
OH
NN
NO
C H 3
N
N
OC l
O
Nefazodone
hydroxylation
hydroxylation
oxidation
1
2
3
hydroxylation
45
6
dihydroxylation
oxidation
dechlorination
dihydroxylation
Figure 22Proposed metabolic pathways for the expected metabolites of Nefazodone.
References
1. Amit S. Kalgutkar, Mary E. Lame, JohnR. Soglia, Scott M. Peterman, NicholasDuczak, Jr., J. Am. Soc. MassSpectrom., 17, 363-375, 2006.
2.Edgar Naegele, Agilent ApplicationNote “An interwoven, multi-algorithmapproach for computer-assisted identification of drug metabolites”,Publication number 5989-7375EN, 2007.
3.Edgar Naegele, “Computer assistedidentification of metabolites frompharmaceutical drugs – Part II:Identification of non-expected meta-bolites of Nefazodone” Publicationnumber 5990-3607EN, 2009.
Conclusion
This work demonstrates the interpre-tation of the results produced by theMassHunter Metabolite Identification(MetID) software for the identificationof metabolites created by expectedbiotransformations. The assignment ofmetabolite structures by interpretationof information created from QTOFmass spectrometry data by variousalgorithms like isotope pattern mat-ching, MS/MS fragment pattern mat-ching and formula calculation basedon accurate mass measurement forMS and MS/MS is demonstrated. Thiswork is an example of the gain in pro-ductivity that can be achieved byusing the MetID software for the interpretation of QTOF data from metabolite identification experiments.
11
www.agilent.com/chem/metid
For Research Use Only. Not for use in diagnostic procedures.
This information is subject to change without notice.
© Agilent Technologies, Inc., 2009 Published March 1, 2009 Publication Number 5990-3606EN