computational sustainability - computing research ... · institute for computational sustainability...
TRANSCRIPT

Computational Sustainability
Carla P. Gomes Institute for Computational Sustainability
Computing and Information Science Cornell University
Role of Information Sciences and Engineering in Sustainability
RISES DC, Feb. 2011
Expeditions in Computing
(CISE)
Support:
The Institute for Computational Sustainability (ICS) Research Team
29 graduate students
24 undergrad. students
Expeditions in Computing
(CISE)
Support:
ICS members and collaborators for their many contributions towards the development of a vision for
research, education, and outreach activities in the new area of Computational Sustainability

3
Sustainability and Sustainable Development
The 1987 UN report, Our Common Future (Brundtland Report): !! Raised serious concerns about the State of the Planet. !! Introduced the notion of sustainability and sustainable
development:
Sustainable Development: development that meets the needs of the present without compromising the ability of future generations to meet their needs.
Gro Brundtland Norwegian
Prime Minister Chair of WCED
UN World Commission on Environment and Development,1987.

4
Follow-Up Reports: Intergovernmental Panel on Climate Change (IPCC 07) Global
Environment Outlook Report (GEO 07)
[Nobel Prize with Gore 2007] +130
countries
Global Warming
Erosion of Biodiversity Examples:
•!At the current rates of human destruction of natural ecosystems, 50% of all species of life on earth will be extinct in 100 years.
•!The biomass of fish is estimated to be 1/10 of what it was 50 years ago and is declining. Worm et al. (2006)
There are no major issues raised in Our Common Future for which the foreseeable trends are favourable.
Wilson, E.O. The Future of Life (2002) .

Safe Operating Boundaries: Crucial Biophysical Systems
5 Source: Planetary Boundaries: A Safe Operating Space for Humanity, Nature, 2009

Sustainability: Interlinked environment, economic, and social issues
Our Common Future recognized that environmental, economic and social issues are interlinked.
"The economy only exists in the context of societies,
and both society and economic activity are constrained by the earth s natural systems.
"A secure future depends upon the health of all 3 systems (environment, society, economy).
6
Sustainable Development encompasses balancing environmental, economic, and
societal needs.

7
Challenging Sustainability Problems Complex Dynamical Systems
Sustainability problems are unique in scale, impact, complexity, and richness:
Often involving multiple and highly interconnected components and players, in highly dynamic and uncertain environments.
ecosystems.noaa.gov
Smart Grid: Complex Digital Ecosystem
Natural Ecosystem
Offer challenges but also opportunities for the advancement of the state of the art in
computing and information science.

8
Computer scientists can — and should — play a key role in increasing the efficiency and effectiveness of the way we manage and allocate our natural resources, while enriching and transforming Computing and Information Science and related disciplines.
Computational Sustainability: Vision
We need critical mass in the new field of Computational Sustainability!!!

9
I Examples of Computational Sustainability problems
highlighting research themes II Our research themes III Building a community in Computational Sustainability IV Conclusions
Outline

10
E.g. Conservation and Biodiversity
I Environment
II Socio-Economic Systems
Sample of Computational Sustainability Problems
E.g. Poverty mapping and poverty reduction, and harvesting policies.
III Energy
E.g. Smart grid, Material discovery and Biofuels Farmers
Fuel distributors
Environmental impact
Consumers Energy crops
Non-energy crops
Social welfare
Food supply
Gasoline producers
Water quality
Soil quality
Local air pollution
Biodiversity
Energy market
Economic impact

11
Conservation and Biodiversity

Combatting Biodiversity Loss: Landscape Connectivity
Ideas from circuit theory for mapping critical linkages in complex landscapes
Brad McRae et al.
Connectivity for mountain in southern California. Blue - low current density (low densities of dispersing mountain lions); Yellow - movement bottlenecks, where connectivity is most vulnerable to hab destruction. Red - high current flow high priority areas for conservation or restoration.
With limited funding and constant threats of habitat loss how do we choose which habitats to protect so that landscapes will stay well-connected for
wild animal species?
Maintaining movement and connectivity across landscapes can help reduce inbreeding,
increase genetic diversity, and/or colonize new habitat.
Opportunities for new computational models integrating ecological and economic constraints.

Wildlife Corridors link core biological areas, allowing animal movement between areas. Typically: low budgets to implement corridors.
Example:
Goal: preserve grizzly bear populations in the U.S. Northern Rockies by creating wildlife corridors connecting 3 reserves:
Yellowstone National Park Glacier Park / Northern Continental Divide Salmon-Selway Ecosystem
Combatting Habit Loss and Fragmentation: Wildlife Corridors
cost suitability

14
Conservation and Biodiversity: Wildlife Corridors
Challenges in Constraint Reasoning and Optimization
Wildlife corridor design Computational problem " Connection Sub-graph Problem
Find a sub-graph of G that: contains the reserves; is fully connected; with cost below a given budget; and with maximum utility
Connection Sub-Graph - NP-Hard
Given a graph G with a set of reserves:
Connection Sub-graph Problem
Worst Case Result --- Real-world problems possess hidden structure that can be exploited allowing
scaling up of solutions.
Conrad, Dilkina, Gomes, van Hoeve, Sabharwal, Sutter; 2007-2010
Interdisciplinary Research Project:
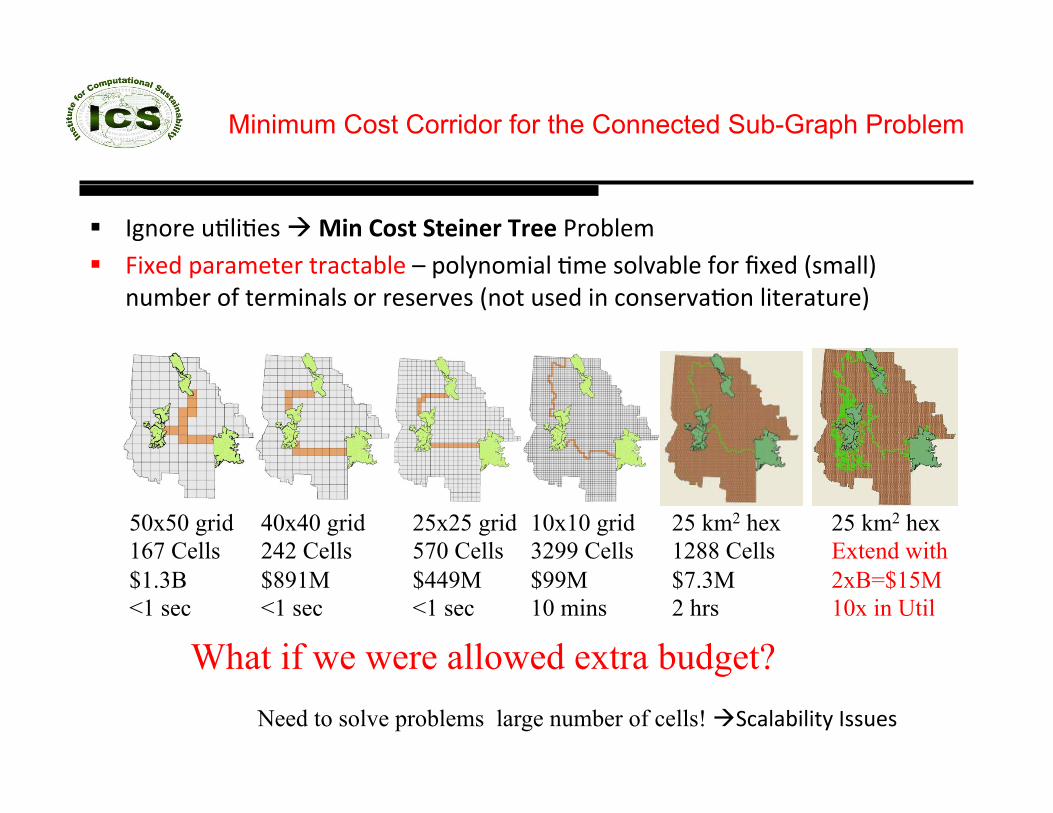
Minimum Cost Corridor for the Connected Sub-Graph Problem
!! !"#$%&'()*+)&,'"'!"#$%&'($)(*"#*+$,+**'-%$.*&/''!! 0+1&2'34%4/&5&%'5%4654.*&'7'3$*8#$/+4*')/&',$*94.*&':$%';1&2'<,/4**='#(/.&%'$:'5&%/+#4*,'$%'%&,&%9&,'<#$5'(,&2'+#'6$#,&%94)$#'*+5&%45(%&='
25 km2 hex 1288 Cells $7.3M 2 hrs
50x50 grid 167 Cells $1.3B <1 sec
40x40 grid 242 Cells $891M <1 sec
25x25 grid 570 Cells $449M <1 sec
10x10 grid 3299 Cells $99M 10 mins
25 km2 hex Extend with 2xB=$15M 10x in Util
What if we were allowed extra budget? Need to solve problems large number of cells! ">64*4.+*+58'!,,(&,''

Models Are Important!!!
Single Commodity Flow
Directed Steiner Tree
Captures Better the Connectedness Structure #!
Exponential Number of Constraints $!
Provides good upper bounds (discover good cuts with ML)$!
Quite compact (poly size)
Dilkina and Gomes 2010

Science of Computation - Understanding Structure: Typical Case Analysis and Identification of Critical Parameters
(Synthetic Instances)
How is hardness affected as the budget fraction is varied?
Problem evaluated on semi-structured graphs
m x m lattice / grid graph with k terminals Inspired by the conservation corridors problem
Place a terminal each on top-left and bottom-right Maximizes grid use
Place remaining terminals randomly Assign uniform random costs and utilities from {0, 1, !, 10}
Utility Gap (Optimally Extended Min cost/ Optimal)
Runtime
From 6x6 to 10x10 grid (100 parcels): 1000 instances per data-point;
Runtime for Optimal Solution
No reserves: pure optimization
3 reserves
3 reserves

Scaling up Solutions by Exploiting Structure
•!Synthetic generator / Typical Case Analysis •!Identification of Tractable Sub-problems •!Exploiting structure via Decomposition
Static/Dynamic Pruning •!Streamlining for Optimization •!New Encodings
5 km grid (12788 land parcels):
minimum cost solution
5 km grid (12788 land parcels):
+1% of min. cost
Glacier Park
Yellowstone
Salmon-Selway
Real world instance: Corridor for grizzly bears in the Northern Rockies, connecting:
Yellowstone Salmon-Selway Ecosystem Glacier Park
(12788 nodes)
Our approach allows us to handle large problems and reduce corridor cost dramatically (hundreds of millions of dollars)
compared to existing approaches while providing guarantees of optimality in terms of utility:
Optimal or within 1% of optimality for interesting budget levels.

Multiple Species
19
Grizzly Bear
Wolverines
Lynx
Collaborators: Michael K. Schwartz USDA Forest Service, Rocky Mountain Research Station Claire Montgomery Oregon State University
Identification of new problems to address multiple species: E.g. Steiner Multigraph Problem Upgrading Shortest Path Problem Dynamics and Game Theory : •! Study dynamics of interactions •! How to be fair??? •! What metrics?

Outreach and Education
20
Pedagogical Games Shortest path, Steiner trees, and much more about Computational Sustainability
Lots of undergrad/Meng students Having fun designing games for
A Travel Museum on Computational Sustainability
Edutainment Video Games for
middle school
Boynton Middle School Math Day
Effort led by David
Schneider
21
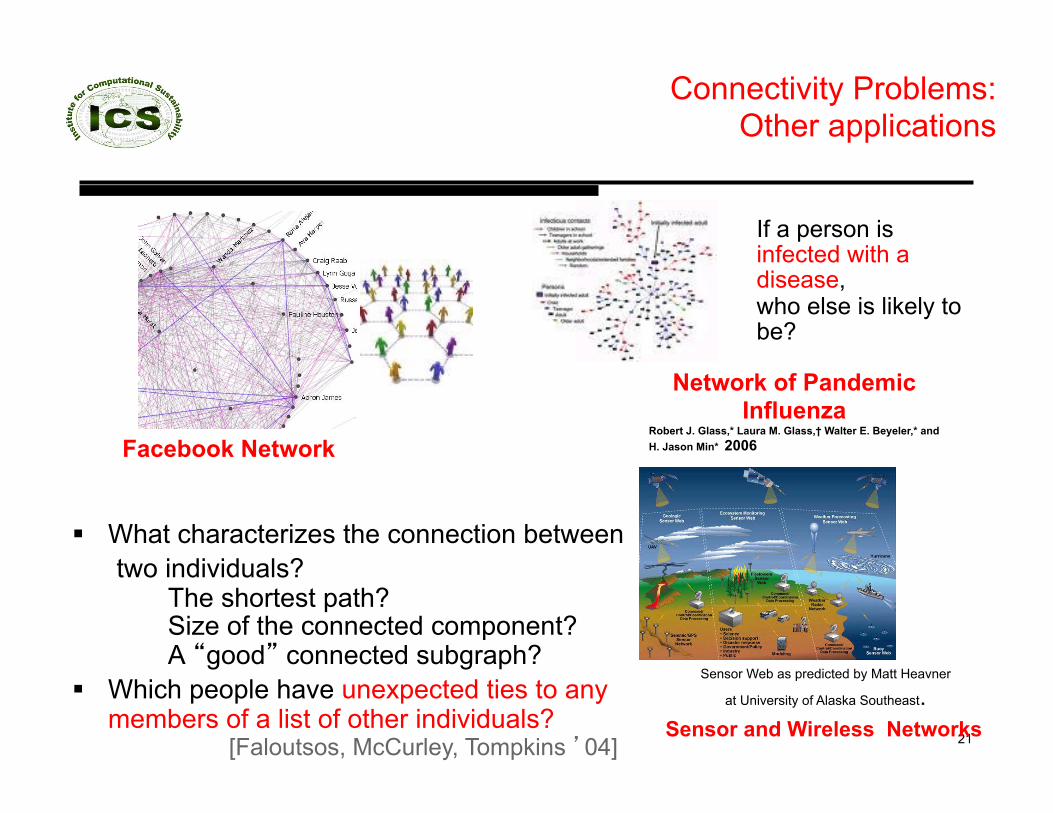
Connectivity Problems: Other applications
!! What characterizes the connection between two individuals?
The shortest path? Size of the connected component? A good connected subgraph?
!! Which people have unexpected ties to any members of a list of other individuals?
[Faloutsos, McCurley, Tompkins 04]
Network of Pandemic Influenza
Robert J. Glass,* Laura M. Glass,† Walter E. Beyeler,* and H. Jason Min* 2006 Facebook Network
If a person is infected with a disease, who else is likely to be?
Sensor Web as predicted by Matt Heavner
at University of Alaska Southeast. Sensor and Wireless Networks

22
Bird Conservation
Information Sciences D. Fink
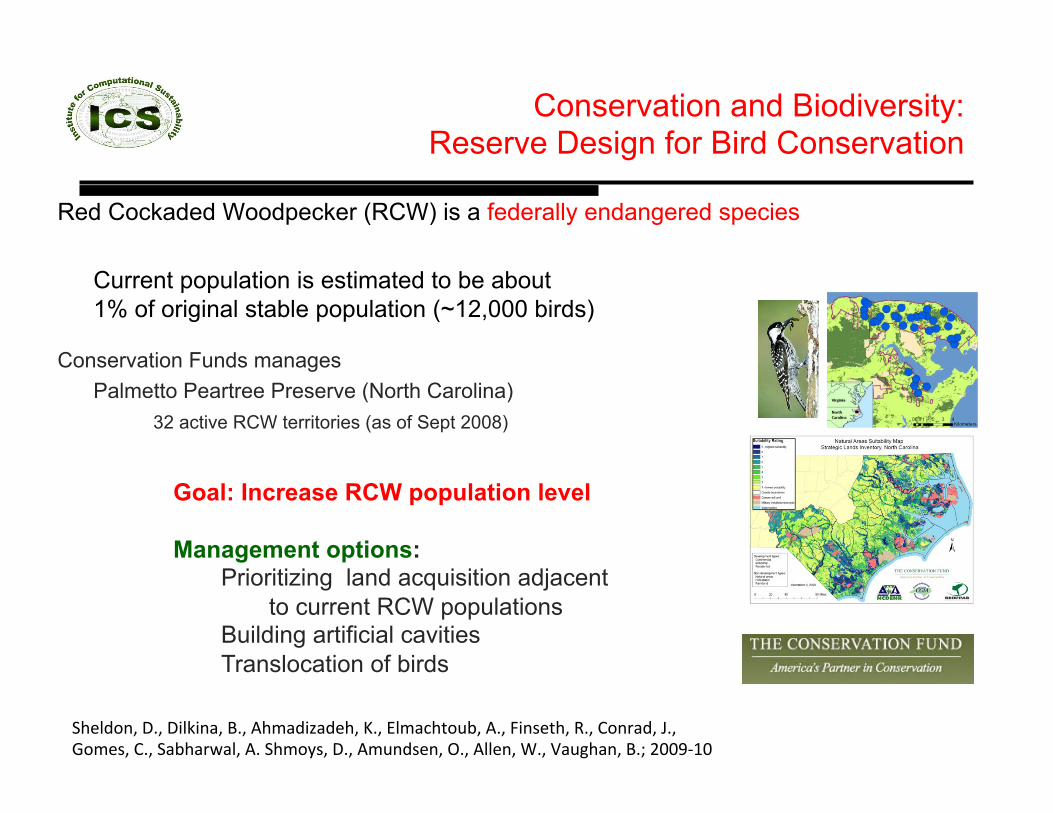
Red Cockaded Woodpecker (RCW) is a federally endangered species
Current population is estimated to be about 1% of original stable population (~12,000 birds)
Conservation Funds manages Palmetto Peartree Preserve (North Carolina) 32 active RCW territories (as of Sept 2008)
Conservation and Biodiversity: Reserve Design for Bird Conservation
>?&*2$#@'AB@'A+*C+#4@'DB@'E?/42+F42&?@'GB@'H*/46?5$(.@'EB@'0+#,&5?@'IB@'J$#%42@'KB@'L$/&,@'JB@'>4.?4%M4*@'EB'>?/$8,@'AB@'E/(#2,&#@'NB@'E**&#@'OB@'P4("?4#@'DBQ'RSSTUVS
Goal: Increase RCW population level Management options:
Prioritizing land acquisition adjacent to current RCW populations
Building artificial cavities Translocation of birds
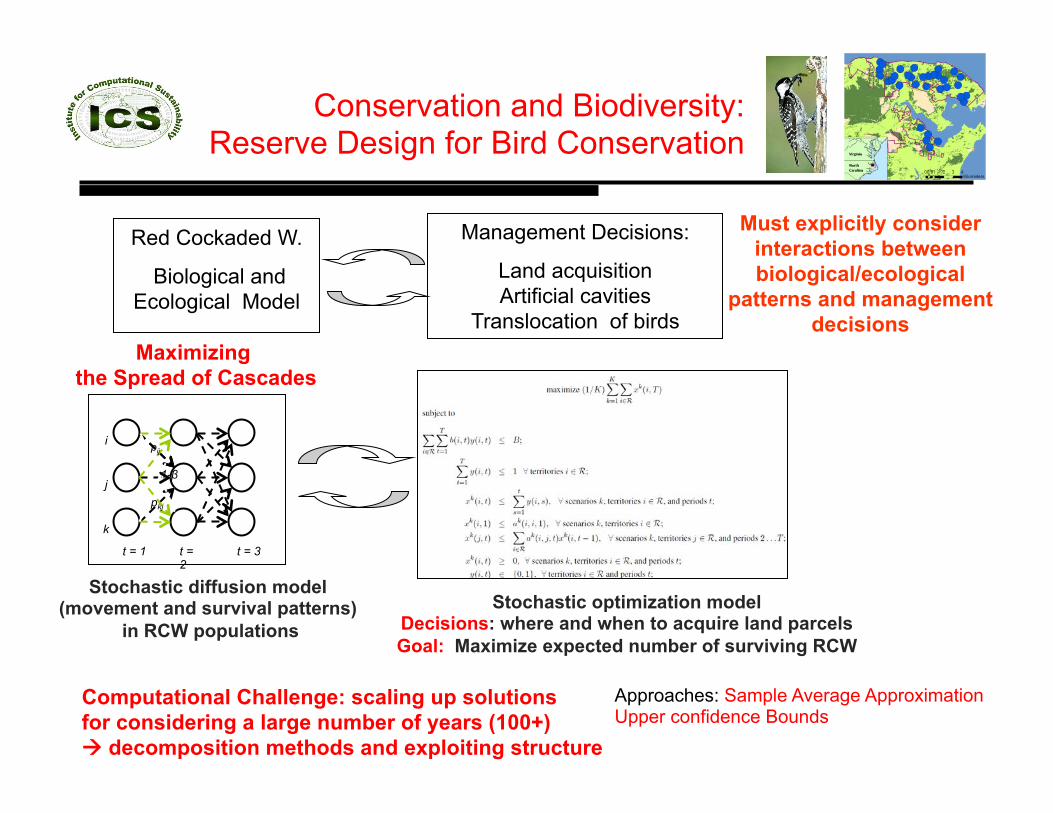
Computational Challenge: scaling up solutions for considering a large number of years (100+) "" decomposition methods and exploiting structure
Red Cockaded W.
Biological and Ecological Model
Management Decisions:
Land acquisition Artificial cavities
Translocation of birds
Must explicitly consider interactions between biological/ecological
patterns and management decisions
Conservation and Biodiversity: Reserve Design for Bird Conservation
i
j
k
pkj
pij
1-!
t = 1 t = 2
t = 3
Stochastic diffusion model (movement and survival patterns)
in RCW populations Stochastic optimization model
Decisions: where and when to acquire land parcels Goal: Maximize expected number of surviving RCW
Maximizing the Spread of Cascades
Approaches: Sample Average Approximation Upper confidence Bounds

Influencing Cascades in Networks: Other Examples
Maximizing or Minimizing spread
!! Business Networks: Technology adoption among friends/peers. !! Social Networks:
Spread of rumor/news/articles on Facebook, Twitter, or among blogs/websites.
Targeted-actions (e.g. marketing campaigns) can be chosen to maximize the spread of these
phenomena.
Maximize the spread Minimize the spread !! Epidemiology: Spread of disease
–! In human networks, or between networks of households, schools, major cities, etc.
–! In agriculture settings. !! Contamination: The spread of
toxins / pollutants within water networks.
!! Invasive species Mitigation strategies can be chosen to
minimize the spread of such phenomena.
Viral Marketing
[Domingos and Richardson, KDD 2001]
[Kempe, Kleinberg, and Tardos, KDD 2003] [Krause and Guestrin 2007]

26
Additional Levels of Complexity: Large-Scale Data Modeling, Stochasticity, Uncertainty,
•! How to estimate species distributions and habitat suitability
•! Movements and migrations; •! Understanding species interaction •! Climate change •! Stochasticity and Uncertainty
•! How to get the data?
•! Other factors (e.g., different models of land conservation (e.g., purchase, conservation easements, auctions) typically over different time periods).

27
How to estimate species distributions?
Eastern Phoebe Migration
Steven Philips, Miro Dudik & Rob Schapire
Maxent Information Sciences
D. I. MacKenzie, J. D. Nichols, G. B. Lachman, S. Droege, J. A. Royle, and C. A. Langtimm. 2002
K(#'W(@'O&#"UG&&#'O$#"@'I&.&664'X(56?+#,$#'<RSVS=B'
Kelling
Active research area bringing together machine and statistical learning:
H15&#,+$#'$:'N66(34#68UA&5&6)$#'/$2&*'$:'Y46C&#F+&'&5'4*B'RSSZ'

28
eBird: Citizen Science at the Cornell Lab. Of Ornithology
The Citizen Science project at the Lab of Ornithology at Cornell empowers everyone interested in birds — from research labs to backyards to remote
forests, anyone who counts birds – to contribute to research.
!! Increase scientific knowledge Gather meaningful data to answer large-scale research questions
!! Increase scientific literacy Enable participants to experience the process of scientific investigation and develop problem-solving skills
!! Increase conservation action Apply results to science-based conservation efforts
Examples of research and outreach outputs:
CLO: Track record of influencing
conservation science.
Online Research Kit The State of The Birds
-.*+$/0!$1"+2$&1'*+.34&#'$5+&6$6&+*$(73#$$8009000$:&;34&#'$

>3&6+&,'2+,5%+.()$#'Y$2&*,'B'
-4[&%#,'+#'D+%2'>3&6+&,'N66(%%&!
<3#2$%&.*+$
-$5&#)4*'\,&,U'•! H14/+#&'34[&%#,'$:'/+"%4)$#''•! !#:&%'+/3465,''$:6*+/45&'6?4#"&'•! Y&4,(%&'34[&%#,'$:'?4.+545'(,&4"&'
•! Y&4,(%&'3$3(*4)$#'5%,'
!&2*:$+*'=:(''&D+%2'
!*(*&+&:&>?$
!-@A)$B$C*6&(*$'*#'"#>$23(3$
-;;=++*#;*$&5$A#2">&$D=#4#>'<RSS]='
E3#$ )*F$ @*;$E=#$GF+$
Processing and Analysis Information Sciences
eBird

Citizen Science and HCI
""How to infer and factor in expertise level of observer?
""How to engage citizens? Ideally to the desired locations
"" Active Learning: where to sample next? How to reduce uncertainty & increase accuracy of species distribution models
US eBirdLocations
Sampling bias:
Highly concentrated data
XJ!'•! ^$$*,'5$',(33$%5'3(.*+6'&#"4"&/'4#2'2&6+,+$#'/4C+#"_'J$**&6)#"@'/$2&*+#"@'4#2'3%&,&#)#"'%&*&94#5'+#:$%/4)$#'9+4'(,4.*&'+#5&%:46&,Q''
•! J%$M2U,$(%6+#"'4#2'6+)F&#',6+&Q''•! J$/3(5&%'"4/&,'4#2'+#5&**+"'5(5$%+#"',8,5&/,Q''
•! Y$2&*,@'/&5?$2,'4#2'5$$*,':$%'2+,,&/+#4)$#'4#2'+#6%&4,+#"'$:'4M4%&#&,,'$:',(,54+#4.*&'3%46)6&,@'.&?49+$%,@'4#2'4`5(2&,B'
' More --- next talk by Bill Tomlinson
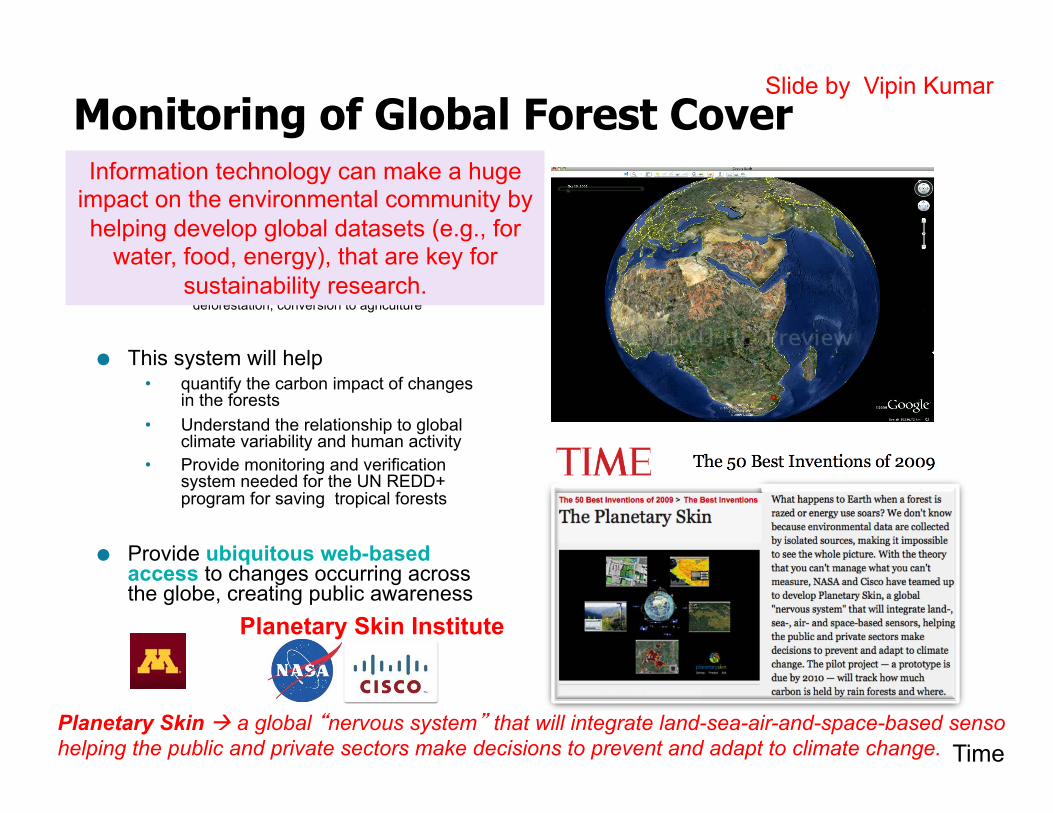
Monitoring of Global Forest Cover !! Automated Land change
Evaluation, Reporting and Tracking System (ALERT) •! Planetary Scale Information System for
assessment of disturbances in the global forest ecosystem: •! Forest fires, droughts, floods, logging/deforestation, conversion to agriculture
!! This system will help
•! quantify the carbon impact of changes in the forests
•! Understand the relationship to global climate variability and human activity
•! Provide monitoring and verification system needed for the UN REDD+ program for saving tropical forests
!! Provide ubiquitous web-based access to changes occurring across the globe, creating public awareness
Slide by Vipin Kumar
Planetary Skin ! a global nervous system that will integrate land-sea-air-and-space-based senso helping the public and private sectors make decisions to prevent and adapt to climate change. Time
Planetary Skin Institute
Information technology can make a huge impact on the environmental community by helping develop global datasets (e.g., for
water, food, energy), that are key for sustainability research.
aR'
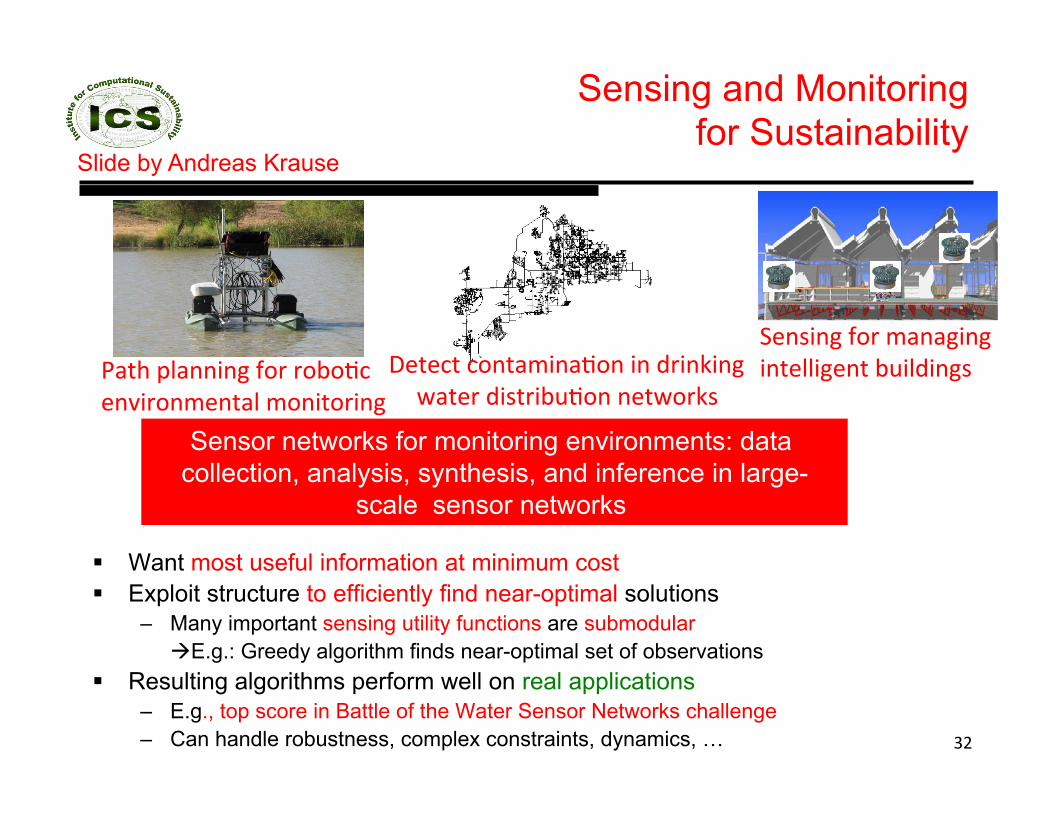
Sensing and Monitoring for Sustainability
!! Want most useful information at minimum cost !! Exploit structure to efficiently find near-optimal solutions
–! Many important sensing utility functions are submodular "E.g.: Greedy algorithm finds near-optimal set of observations
!! Resulting algorithms perform well on real applications –! E.g., top score in Battle of the Water Sensor Networks challenge –! Can handle robustness, complex constraints, dynamics, !
-45?'3*4##+#"':$%'%$.$)6'	+%$#/6*'/$#+5$%+#"'
>&#,+#"':$%'/4#4"+#"'+#5&**+"'.(+*2+#",'A&5&65'6$#54/+#4)$#'+#'2%+#C+#"''
M45&%'2+,5%+.()$#'#&5M$%C,'
Slide by Andreas Krause
Sensor networks for monitoring environments: data collection, analysis, synthesis, and inference in large-
scale sensor networks.

Understanding Species Interactions: Food Webs
!! Food webs who eats whom among species within their natural habitats –! Nodes – species –! Edges – feeding relationships
between the species Question how does Nature balance the abundance of different species? Can we predict the consequences of invasive alien species?
Can we predict the consequences of extinction due to biodiveristy loss?
33
Neo D. Martinez Pacific Ecoinformatics and Computational Ecology Lab
www.FoodWebs.org
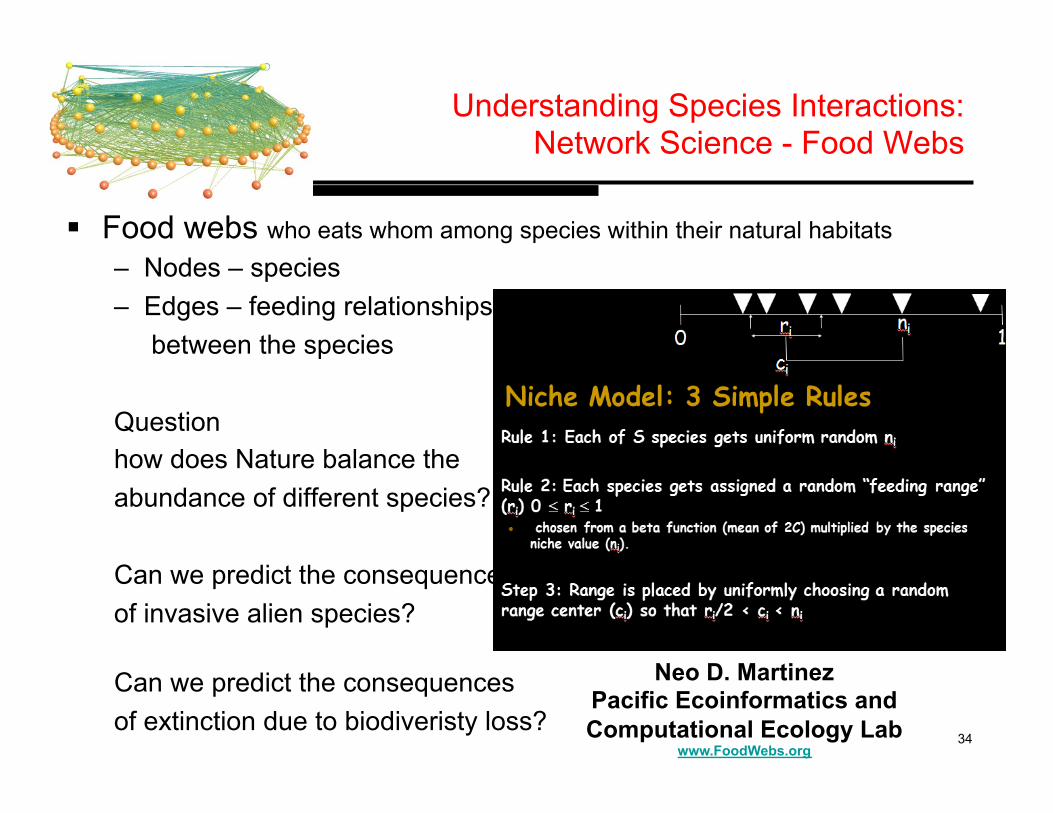
Understanding Species Interactions: Network Science - Food Webs
!! Food webs who eats whom among species within their natural habitats –! Nodes – species –! Edges – feeding relationships
between the species Question how does Nature balance the abundance of different species? Can we predict the consequences of invasive alien species?
Can we predict the consequences of extinction due to biodiveristy loss?
34
Neo D. Martinez Pacific Ecoinformatics and Computational Ecology Lab
www.FoodWebs.org

Understanding Species Interactions: Network Science - Food Webs
!! Food webs who eats whom among species within their natural habitats –! Nodes – species –! Edges – feeding relationships
between the species Question how does Nature balance the abundance of different species? Can we predict the consequences of invasive alien species?
Can we predict the consequences of extinction due to biodiveristy loss?
35
Neo D. Martinez Pacific Ecoinformatics and Computational Ecology Lab
www.FoodWebs.org
Network modeling, prediction, and optimization –
challenging research area when considering the dynamics of nodes.
Key to understanding coupled human-natural systems and allow
prediction of potential ecological and economic consequences of natural
and human-driven forces acting upon them.

Understanding Climate Change: A Data-Driven Approach
•!Climate change is the defining issue of our era •!Actionable predictive insights are required to inform policy •!Physics-based models are essential but not adequate
–! Models make relatively reliable predictions at global scale for ancillary variables such as temperature
–! But provide the least reliable predictions for variables that are crucial for impact assessment such as regional precipitation
Regional hydrology exhibits large variations among major IPCC model projections
Disagreement between IPCC models
Predictive Modeling Enable predictive modeling of typical and extreme behavior from multivariate spatio-temporal data
Relationship Mining Enable discovery of complex dependence structures: non-linear associations or long range spatial dependencies
Complex Networks Enable studying of collective behavior of interacting eco-climate systems
High Performance Computing Enable efficient large-scale spatio-temporal analytics on exascale HPC platforms with complex memory hierarchies
Transformative Computer Science Research •!Science Contributions
–! Data-guided uncertainty reduction by blending physics models and data analytics
–! A new understanding of the complex nature of the Earth system and mechanisms contributing to adverse consequences of climate change
•!Success Metric –! Inclusion of data-driven analysis as a standard part of climate
projections and impact assessment (e.g., for IPCC)
... data-intensive science [is] …a new, fourth paradigm for scientific exploration." - Jim Gray
Project aim: A new and transformative data-driven approach that complements physics-based models and improves prediction of the potential impacts of climate change
Lead PI: Vipin Kumar
37
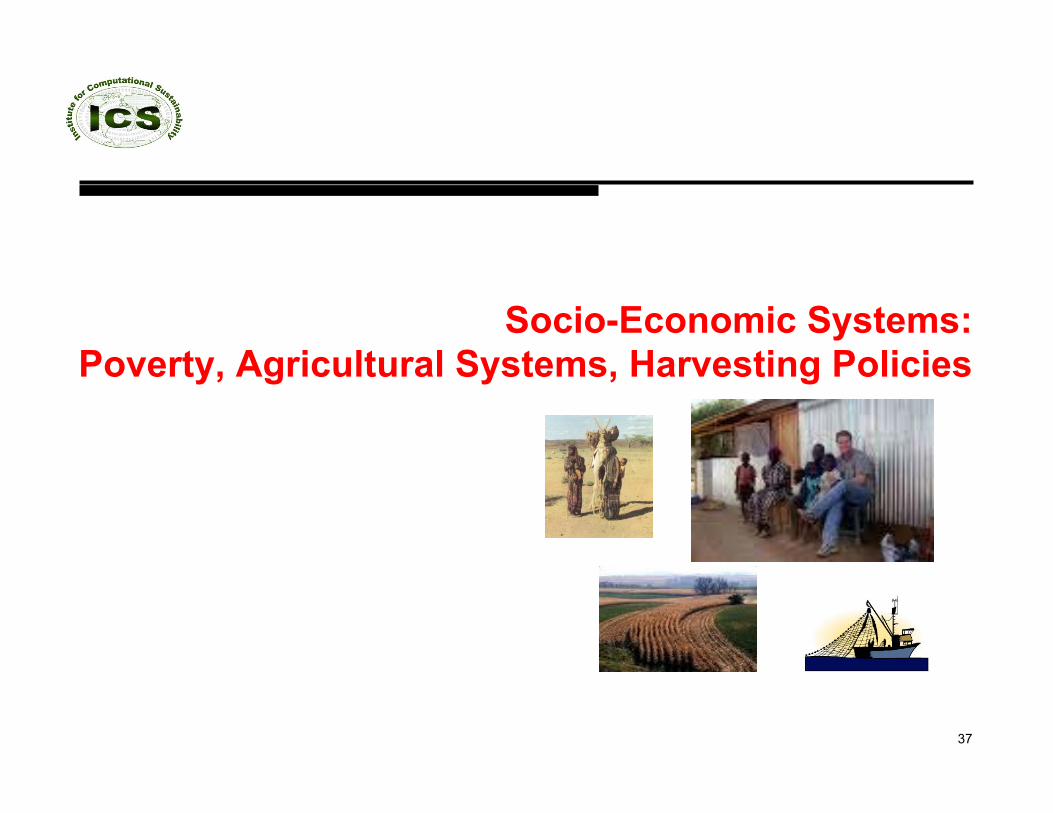
Socio-Economic Systems: Poverty, Agricultural Systems, Harvesting Policies

Poverty maps
Identifying the poor is the first essential step
H&.*+(?$63F'I$
U!'\,&'/(*)3*&'2454',&5,'5$'&,)/45&'4#2'/43'3$9&%58'34[&%#,'#$5'2+%&65*8'/&4,(%&2B'U!'Y46?+#&'*&4%#+#"'4#2'%&*45&2'/&5?$2,'64#'3&%/+5'/$%&'&b6+'(,&'$:'2454':%$/'94%+&2',$(%6&,'"'4#4*$"8'5$',3&6+&,'2+,5%+.()$#'.(5'*+[*&'%&,&4%6?'?4,'.&&#'2$#&B'
H14/3*&_'RSSR'\"4#24'3$9&%58'/43'''
J?%+,'D4%%&[''4#2'J$%&8'c4#"'

Targeting maps
Targeting the best response to reduce poverty ,3+>*4#>$63F'I$$''How to estimate the impact and marginal returns of different assets?
Poverty interventions need to be targeted to specific areas Asset-based investments have spatially-varying marginal returns
'
Policies for Poverty Reduction:
Which set of interventions to apply to each targeted area to maximize the poverty reduction, subject to resource constraints (e.g. budget))?
Challenging problems at the intersection of machine learning and optimization, applied economics and social science. J?%+,'D4%%&['4#2''J$%&8'c4#"'
Average marginal returns of different assets (Uganda)

AI for Development
40
Catastrophe Modeling for Rwandan Disease Surveillance
Can mobile phones be used as an early warning system for disease outbreaks? Bayesian anomaly detection algorithms A. Kapoor, N. Eagle, E. Horvitz
Spatiotemporal Diffusion of Contraceptive Norms
How do contraceptive norms spread through rural areas of the developing world? Spatiotemporal diffusion models have the potential to better evaluate the efficacy of HIV prevention techniques and inform policy decisions related to public health. – H. Yoshioka, N. Eagle
Many other exciting projects!!!!

41
Harvesting Policies Fishery Management

Natural Resource Management: Policies for harvesting renewable resources
!! The biomass of fish is estimated to be 1/10 of what it was 50 years ago and is declining (Worm et al. 2006).
!! The state of the world s marine fisheries is
alarming
!! Researchers believe that the collapse of the world s major fisheries is primarily the result of the mismanagement of fisheries (Clark 2006; Costello et al. 2008).
There is therefore a clear urgency of finding ways of defining policies for managing fisheries is a sustainable manner.
Over Harvesting

43
Natural Resource Management: Policies for harvesting renewable resources
Economy
Increasing Complexity: more complex models and multiple
species interactions
Example of a Biological Growth Function F(x): Logistic map: x t+1 = r xt (1 - xt), r is the growth rate
We are interested in identifying policy decisions (e.g. when to open/close a fishery ground over time).
Combinatorial optimization problems with an underlying dynamical model. Class of Computationally Hard Hybrid Dynamic Optimization Models
Clark 1976; Conrad 1999; Ang, Conrad, Just, 2009; Ermon , Conrad, Gomes and Selman 2010

An Application to the Pacific Halibut Fishery in Area 3A Regulated by International Pacific Halibut Commission (IPHC)
Pacific Halibut Fishery in Area 3A
Ermon , Conrad, Gomes and Selman UAI 2010
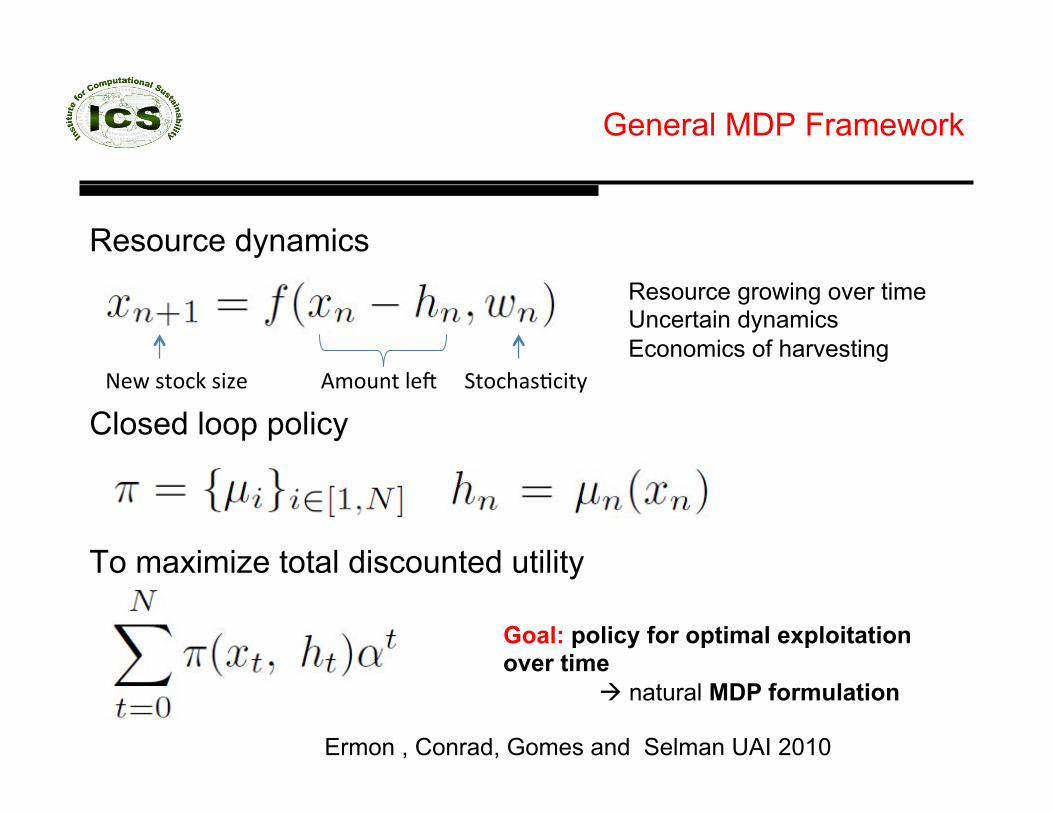
General MDP Framework
Resource dynamics Closed loop policy To maximize total discounted utility
E/$(#5'*&d'e&M',5$6C',+F&' >5$6?4,)6+58'
Goal: policy for optimal exploitation over time
" natural MDP formulation
Resource growing over time Uncertain dynamics Economics of harvesting
Ermon , Conrad, Gomes and Selman UAI 2010

Main result
!! Fixed costs and variable costs !! Concavity of the growth function !! Robust optimization framework (Worst-case for Nature)
'$,7*&+*6I$^?&'$3)/4*'3$*+68'+,'$:'>U,'583&B'
,'
>'
?4%9&,5'
"%$M5?'
•!'!:'5?&',5$6C'+,'"%&45&%'5?4#',@'?4%9&,5'2$M#'5$'>'•!'!:'5?&',5$6C'+,',/4**&%'5?4#',@'*&5'5?&',5$6C'"%$M''

The Pacific Halibut Fishery in Area 3A
!! Regulated by International Pacific Halibut Commission (IPHC)
Optimal policies for management of renewable resources using MDPs
Total Allowable Catch Policy " Constant Proportion Policy
"rate of fishing ~ 12.3% of estimated stock.
Our Result: Policies with periodic closures of a fishery can outperform Constant Proportion Policies
Ermon, Conrad, Gomes, Selman, UAI 2010

Markov Decision Processes (MDPs) to Model for many renewable resource allocation problems.
Renewable resources: forests and fisheries
Problems with a similar mathematical structure:
- Pollution management, - Invasive species control, - Supply chain management and - Inventory control, and many more.
General Approach to model renewable resources with complex dynamics!!!!
Optimal policies for management of renewable resources using MDPs Ermon, Conrad, Gomes, Selman, UAI 2010

%!Energy
Energy efficiency and renewable energy
49

Energy Efficiency
!! Global warming and climate change concerns have led to major changes in energy policy in many industrial countries.
!! There are tremendous opportunities to increase energy efficiency, such as through the design of control systems for smart buildings, smart grids, smart vehicles, data centers, etc.
–! For example, in the United States buildings consume 39% of the energy used nationwide and 70% of the electric energy used. Smart buildings

Data Centers
!! Environmental Protection Agency estimates data center capacity will grow 10% year in next decade
!! Data center costs "!increase 20% year (v.s. 6% for overall IT). "!Huge Inefficiencies - server utilization rarely exceeds 6% and facility
utilization as low as 50%. (McKinsey & Co Report 2008)
!! Co2 – carbon emissions of the world s data centers
& emissions of Argentina and the Netherlands (McKinsey & Co Report 2008)
51
Main reasons for companies to try to cut energy costs
The IT industry and academia are actively researching new ways of increasing energy efficiency ----- advanced power management hardware,
smart cooling systems , virtualization tools, dense server configurations, etc. But increasing energy efficiency is not the main path towards reducing carbon emissions
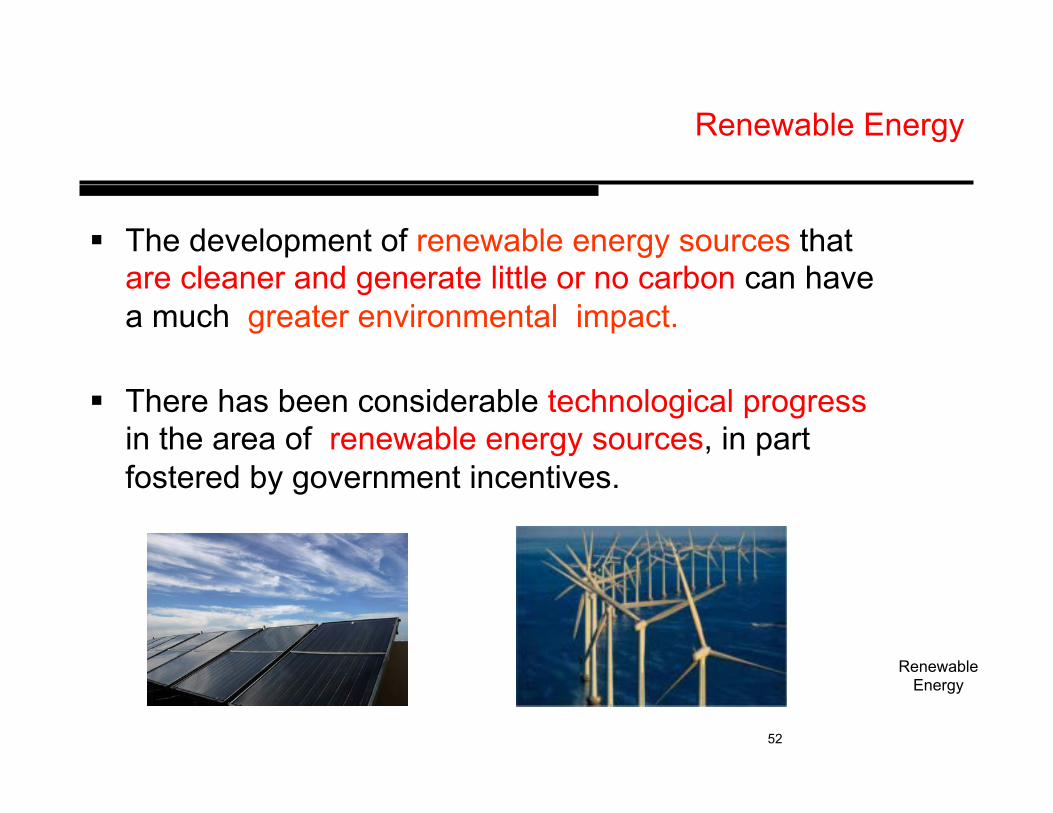
Renewable Energy
!! The development of renewable energy sources that are cleaner and generate little or no carbon can have a much greater environmental impact.
!! There has been considerable technological progress in the area of renewable energy sources, in part fostered by government incentives.
52
Renewable Energy
53
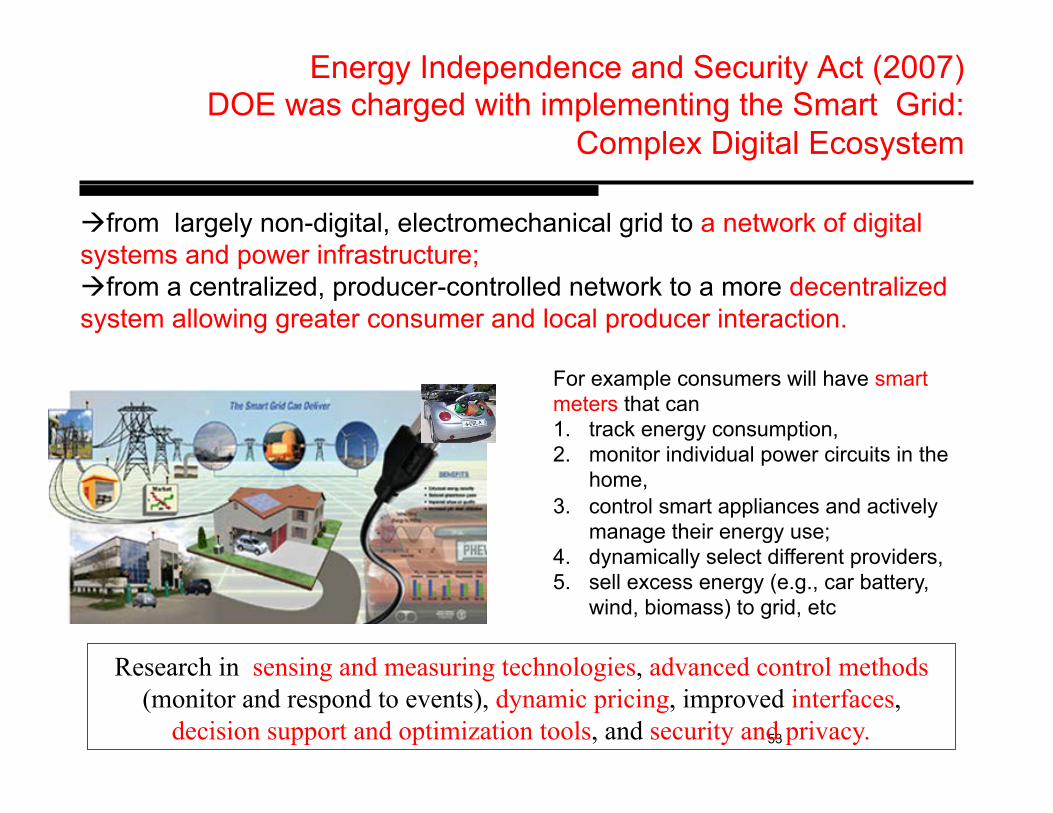
Energy Independence and Security Act (2007) DOE was charged with implementing the Smart Grid:
Complex Digital Ecosystem
For example consumers will have smart meters that can 1.! track energy consumption, 2.! monitor individual power circuits in the
home, 3.! control smart appliances and actively
manage their energy use; 4.! dynamically select different providers, 5.! sell excess energy (e.g., car battery,
wind, biomass) to grid, etc
"from largely non-digital, electromechanical grid to a network of digital systems and power infrastructure; "from a centralized, producer-controlled network to a more decentralized system allowing greater consumer and local producer interaction.
Research in sensing and measuring technologies, advanced control methods (monitor and respond to events), dynamic pricing, improved interfaces,
decision support and optimization tools, and security and privacy.

How to integrate the different sources into the smart grid ?
challenging dynamical problems!!!
What is the best mix of
energy generation technologies?
What is the best mix of storage technologies?
Where to locate renewable
energy plants?
Challenge of Managing the Power Grid: Balancing different supply and demand sources
US Power Grid
Total energy produced must be equal to the amount consumed by the system loads AT ALL TIMES:
Managing the Power Grid is a Balancing Act!!!
55
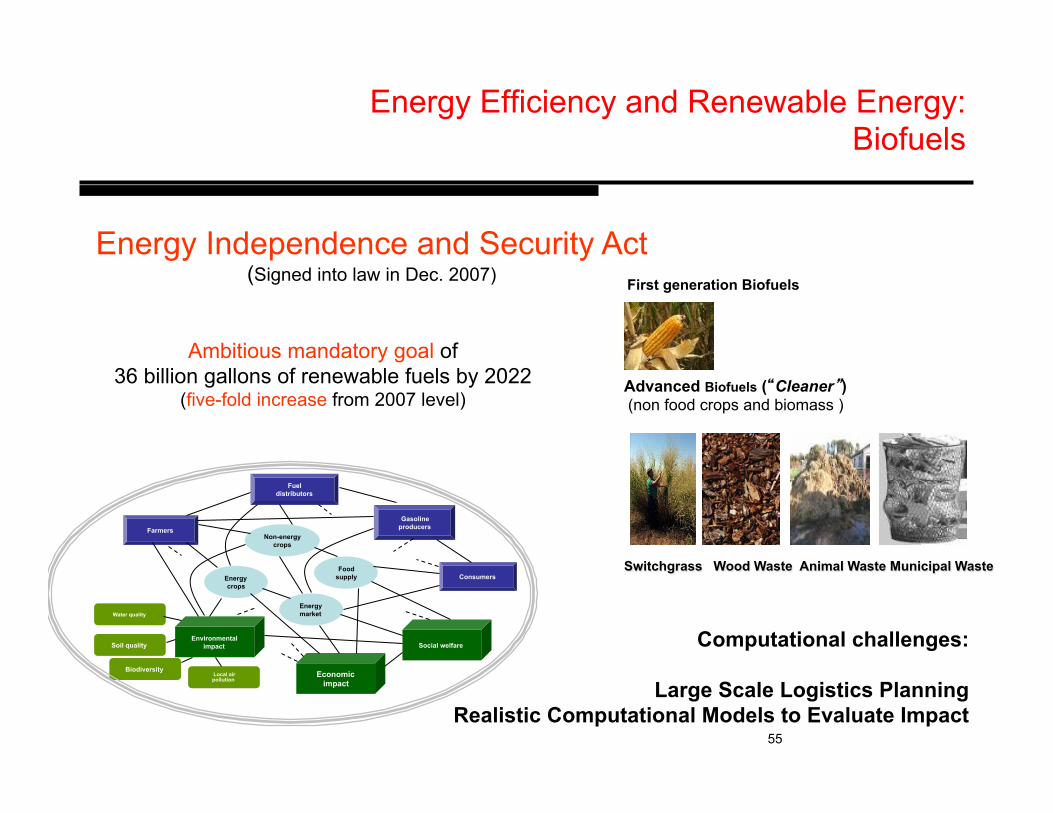
Ambitious mandatory goal of 36 billion gallons of renewable fuels by 2022
(five-fold increase from 2007 level)
Energy Independence and Security Act (Signed into law in Dec. 2007)
Farmers
Fuel distributors
Environmental impact
Consumers Energy crops
Non-energy crops
Social welfare
Food supply
Gasoline producers
Water quality
Soil quality
Local air pollution
Biodiversity
Energy market
Economic impact
Advanced Biofuels ( Cleaner ) (non food crops and biomass )
Switchgrass Wood Waste Animal Waste Municipal Waste
First generation Biofuels
Energy Efficiency and Renewable Energy: Biofuels
Computational challenges:
Large Scale Logistics Planning Realistic Computational Models to Evaluate Impact

56
Feedstock Map
Large Scale Stochastic Logistics Planning for Biofuels
Large-scale investment in new technology provides exciting logistical planning and optimization challenges and opportunities
Biomass Map
Potential biorefinery locations
Transportation Network (Roads, Rail, Marine)
Distribution Terminals and Inter-Modal Facilities to
Transfer Liquid Fuel
Resulting optimization models are beyond the scope of the current state of the art in several ways: - large-scale input; - stochastic nature (e.g.,feedstock
and demand) " new models to capture
uncertainty "!new stochastic
optimization algorithms;
- dynamics of evolution of demand and capacity

Farmers
Fuel distributors
Environmental impact
Consumers Energy crops
Non-energy crops
Social welfare
Food supply
Gasoline producers
Water quality
Soil quality
Local air pollution
Biodiversity
Energy market
Economic impact
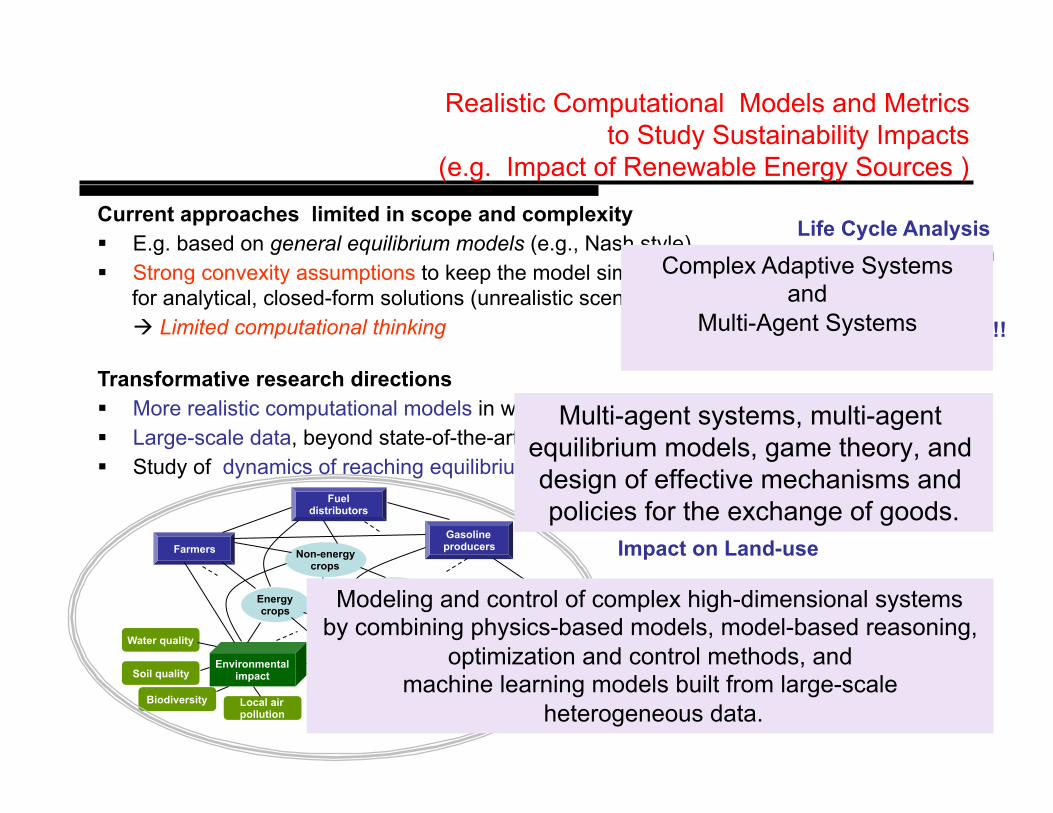
Current approaches limited in scope and complexity !! E.g. based on general equilibrium models (e.g., Nash style) !! Strong convexity assumptions to keep the model simple enough
for analytical, closed-form solutions (unrealistic scenarios) " Limited computational thinking
Transformative research directions !! More realistic computational models in which meaningful solutions can be computed !! Large-scale data, beyond state-of-the-art CS techniques !! Study of dynamics of reaching equilibrium — key for adaptive policy making!
Impact on Land-use Impact on food prices?
Realistic Computational Models and Metrics to Study Sustainability Impacts
(e.g. Impact of Renewable Energy Sources )
How to measure risks/ predict rare events?
Life Cycle Analysis General Equilibrium
Models
Models and Metrics!!!!!
Complex Adaptive Systems and
Multi-Agent Systems
Multi-agent systems, multi-agent equilibrium models, game theory, and design of effective mechanisms and policies for the exchange of goods.
deling and control of complex high-dimensional systems ombining physics-based models, model-based reasoning,
optimization and control methods, and machine learning models built from large-scale
heterogeneous data.
Farmers
Fuel distributors
Environmental impact
Consumers Energy crops
Non-energy crops
Social welfare
Food supply
Gasoline producers
Water quality
Soil quality
Local air pollution
Biodiversity
Energy market
Economic impact
Current approaches limited in scope and complexity !! E.g. based on general equilibrium models (e.g., Nash style) !! Strong convexity assumptions to keep the model simple enough
for analytical, closed-form solutions (unrealistic scenarios) " Limited computational thinking
Transformative research directions !! More realistic computational models in which meaningful solutions can be computed !! Large-scale data, beyond state-of-the-art CS techniques !! Study of dynamics of reaching equilibrium — key for adaptive policy making!
Impact on Land-use Impact on food prices?
Realistic Computational Models and Metrics to Study Sustainability Impacts
(e.g. Impact of Renewable Energy Sources )
How to measure risks/ predict rare events?
Life Cycle Analysis General Equilibrium
Models
Models and Metrics!!!!!
Complex Adaptive Systems and
Multi-Agent Systems
Multi-agent systems, multi-agent equilibrium models, game theory, and design of effective mechanisms and policies for the exchange of goods.
Modeling and control of complex high-dimensional systems by combining physics-based models, model-based reasoning,
optimization and control methods, and machine learning models built from large-scale
heterogeneous data.

59
The role of Experimental Research
Crop Soil Science Material Discovery
Agricultural Systems and GHG s emissions
60
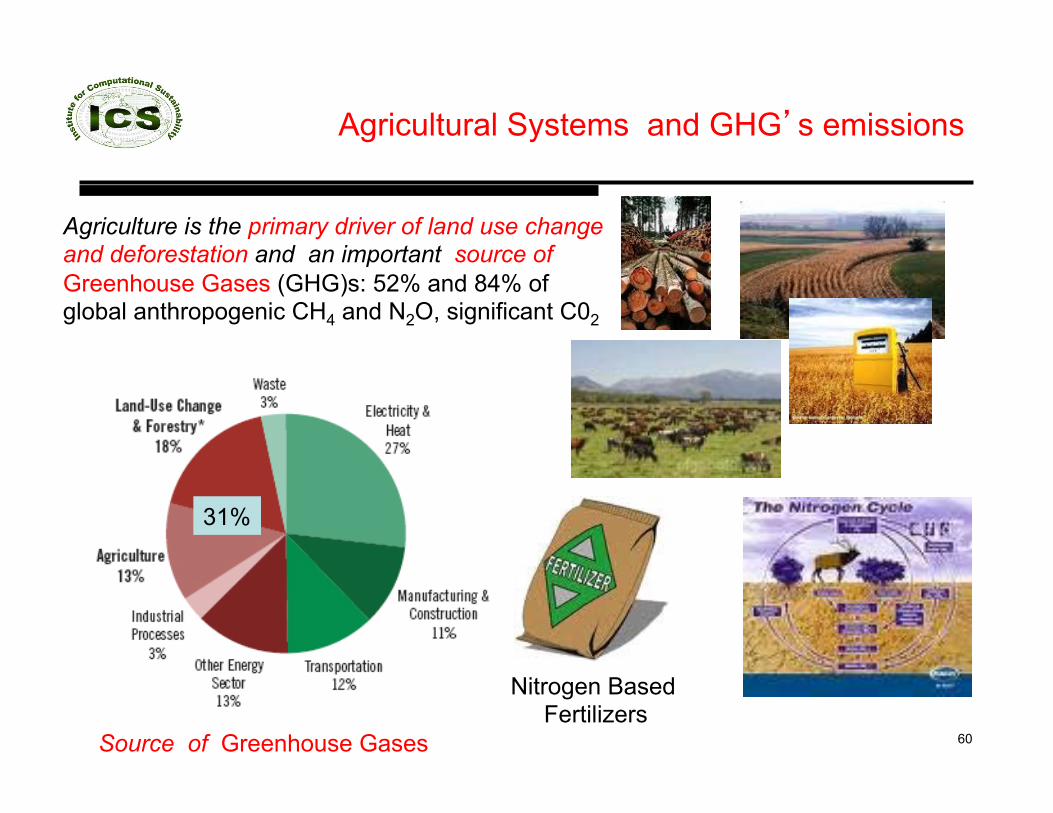
Agriculture is the primary driver of land use change and deforestation and an important source of Greenhouse Gases (GHG)s: 52% and 84% of global anthropogenic CH4 and N2O, significant C02
Nitrogen Based Fertilizers
31%
Source of Greenhouse Gases

Nitrogen Based Fertilizers
Nitrogen Cycle and Fertilizers
61
Spatial and temporal analysis of Nitrogen cycle
Study of fertilizers and design of Experiments
Collaborator Harold van Es
Dead Zone in Gulf of Mexico
Fertilizers have played a key role in the increase of food production but they key culprits in the production of greenhouse gases emissions creating dead zones
Townsend & Howarth (2010) Scientific American

Design of Scientific Experiments (4 Treatments: A,B,C,D)
Perfectly balanced 2.33
Below average Above average
Latin Square
Spatially Balanced Latin Square
!! Hybrid IP/CSP based –! Assignment formulation –! Packing formulation –! Different CSP models
!! SAT/ CSP based approach –! State of the art model for Latin Square + symmetry breaking by initializing first row and column (SBDD doesn t help; this is not a completion problem)
!! Local search based approach
These approaches do not scale up
max order 6
(Target number 30).

63
Science of Computation: Discovering patterns, laws, and hidden structure
in computational phenomena
Streamlining Constraint Reasoning
Discovery of structural properties across solutions (machine learning); Divide ( streamline ) the search space by imposing such additional properties.
Design of Scientific Experiments for Studying Fertilizers – Spatially Balanced Latin Squares Existence of SBLS – open problem in combinatorics
"!Streamlining "!Scaling up of solutions
Gomes and Sellmann 2003/2004
YES: XOR-Streamlining based on random parity constraints
(Valiant and Vazirani 1986, Unique SAT) Provable bounds for Counting and Sampling.
Gomes, Sabharwal, Selman, 2006
Discovery of Construction for SBLS for experimental design
LeBras, Perrault, Gomes, 2010
Stre
amlin
ing
by P
erm
utat
ion
of
Com
plet
e C
olum
ns o
f a
Cyc
lic L
atin
Squ
are
SBLS Order 35
Can we find an domain independent way of streamlining?
64
Material Discovery for Fuel Cell Technology

Material Discovery for Fuel Cell Technology
65
Goal of Material Discovery: –! Find new products –! Find product substitutes –! Understand material properties
Approach: Analysis of inorganic libraries
"Sputter 2 or 3 metals (or oxides) onto a silicon wafer (which produces a thin-film) "!Use x-ray diffraction to study crystallographic structure of the thin-film
"!Note: electromagnetic radiation experiments are very expensive!!
Example: study of platinum-tantulum library showed correlation between crystallographic phase and improved fuel cell oxidation catalysis (Gregoire et al 2010)
Fuel Cell
Applications
Ronan LeBras, Damoulas, John M. Gregoire, Sabharwal, Gomes, van Dover

Problem Definition
66
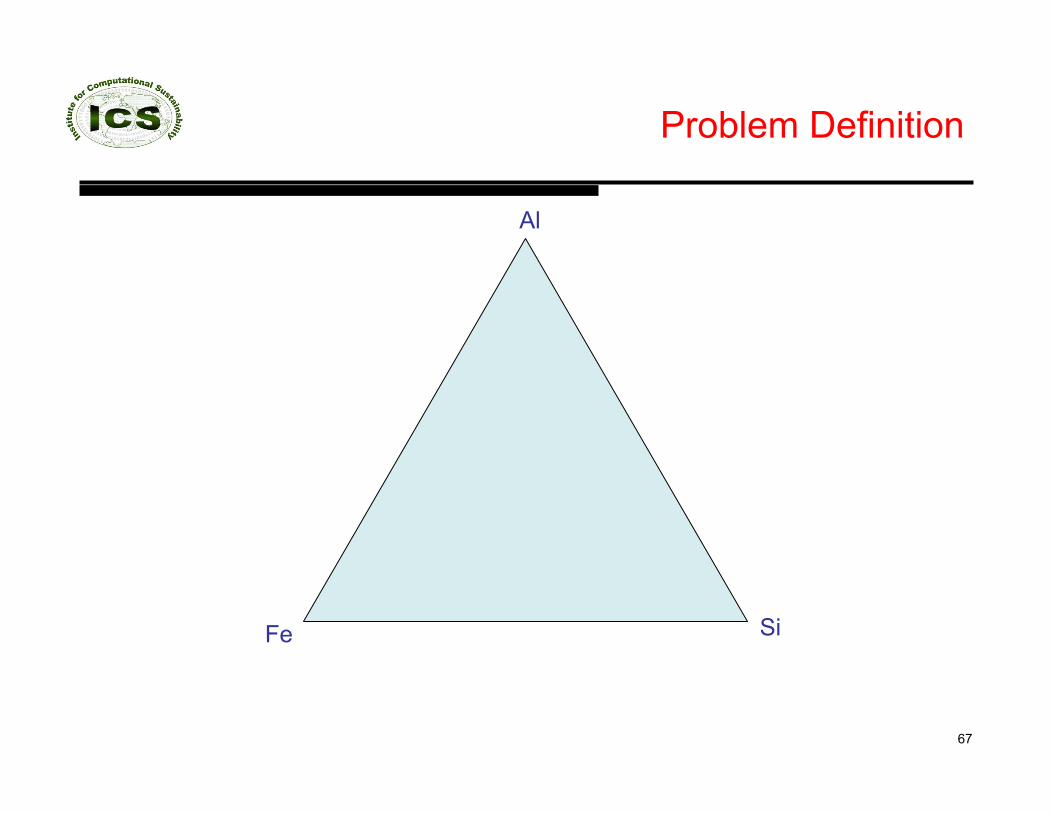
Problem Definition
67
Fe
Al
Si

Problem Definition
68
Fe
Al
Si
(38% Fe, 45% Al, 17% Si)

Problem Definition
69
Fe
Al
Si
(38% Fe, 45% Al, 17% Si)
[Source: Pyrotope, Sebastien Merkel]

Problem Definition
70
Fe
Al
Si
(38% Fe, 45% Al, 17% Si)
15 20 25 30 35 40 45 50 55 600
20
40
60
80
100
120

The Problem: Labeling Points with Phase(s)
71
Fe
Al
Si
15 20 25 30 35 40 45 50 55 600
20
40
60
80
100
120
15 20 25 30 35 40 45 50 55 600
20
40
60
80
100
120
INPUT:
Fe
Al
Si
15 20 25 30 35 40 45 50 55 600
20
40
60
80
100
120
15 20 25 30 35 40 45 50 55 600
20
40
60
80
100
120
15 20 25 30 35 40 45 50 55 60 650
10
20
30
40
50
60
70
pure phase regions
UNDERLYING PHYSICAL STRUCTURE:
Fe
Al
Si
Labeled regions
mixed phase region
mixed phase region
OUTPUT:
!!
!!+""
""
NP-hard

Synthesis of Constraint Reasoning and Machine Learning Approaches for
Material Discovery Standard Clustering Approaches: Based on pure Machine learning techniques + Good at providing a rough , data driven,
global picture + Can incorporate complex dependencies
and global similarity structure - Easily miss critical details (physical properties)
72
Two global alignment kernels for a ternary problem instance
Optimization Model
Constraint reasoning and optimization + Great at enforcing the detailed constraints + Can encode and capture the physics behind the process - Do not scale up
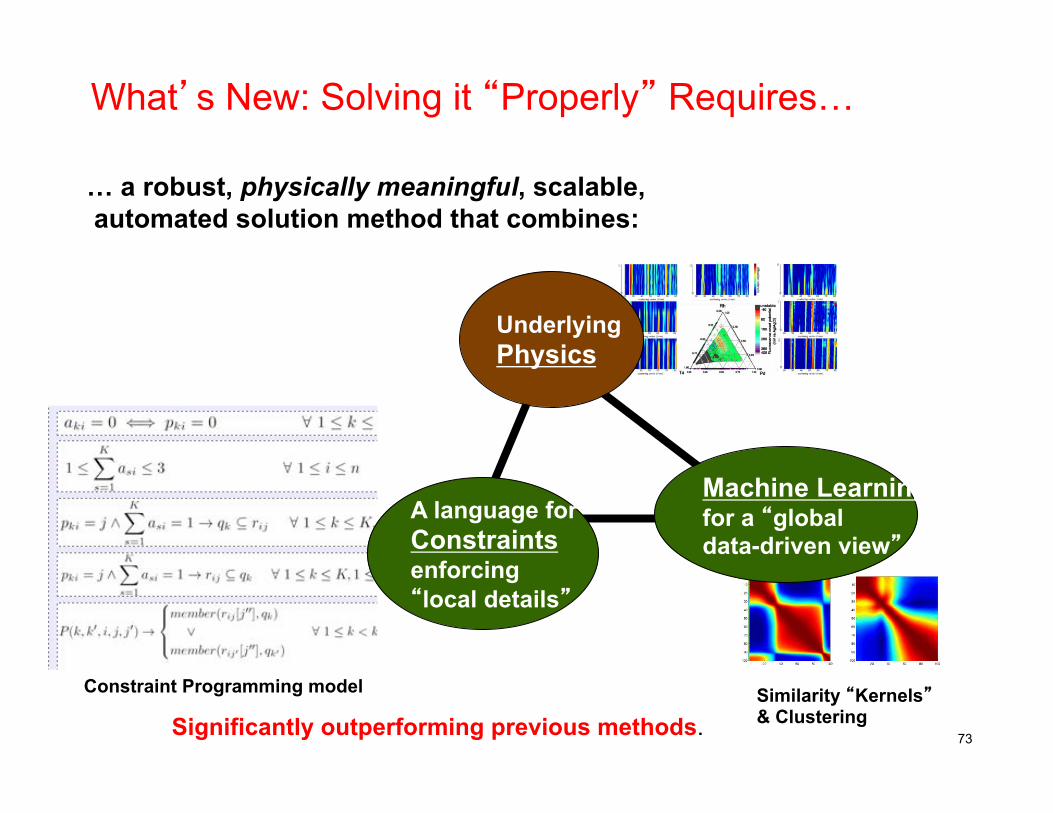
What s New: Solving it Properly Requires!
73
! a robust, physically meaningful, scalable, automated solution method that combines:
Similarity Kernels & Clustering
Machine Learning for a global data-driven view
Underlying Physics
A language for Constraints enforcing local details
Constraint Programming model
Significantly outperforming previous methods.

74
I Computational Sustainability II Examples of Computational Sustainability problems
highlighting research themes III Institute for Computational Sustainability
IV Building a community in Computational Sustainability V Conclusions
Outline
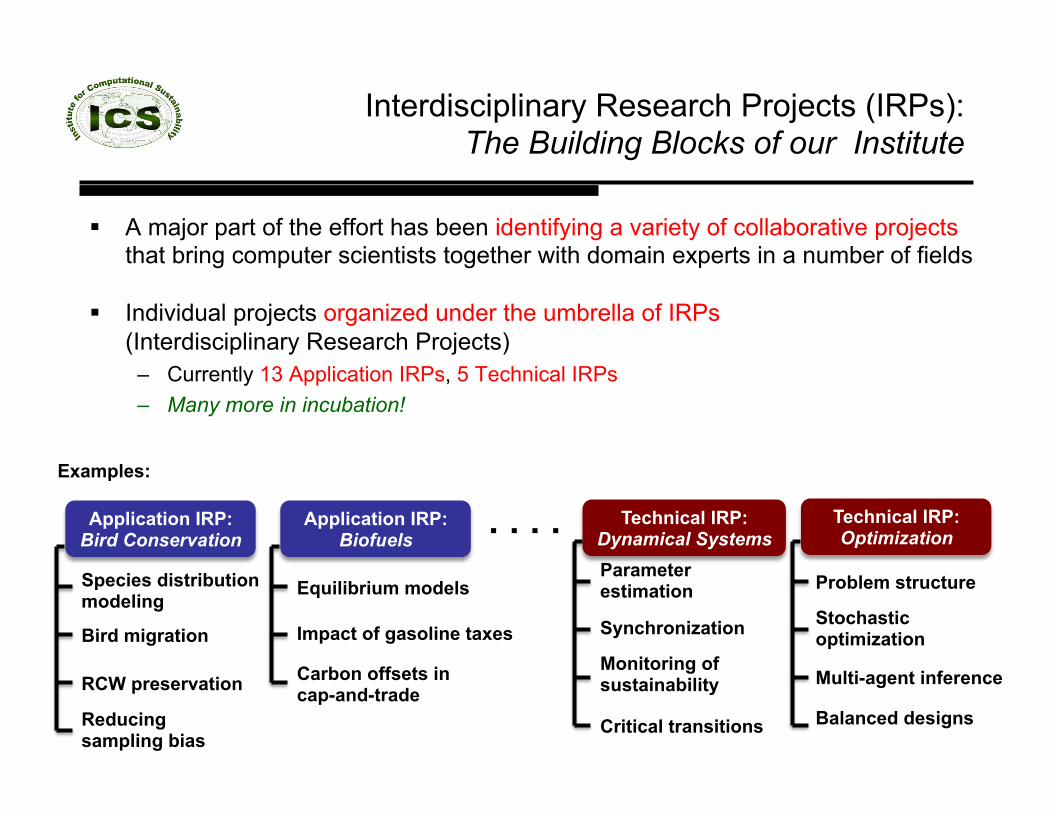
Interdisciplinary Research Projects (IRPs): The Building Blocks of our Institute
!! A major part of the effort has been identifying a variety of collaborative projects that bring computer scientists together with domain experts in a number of fields
!! Individual projects organized under the umbrella of IRPs (Interdisciplinary Research Projects)
–! Currently 13 Application IRPs, 5 Technical IRPs –! Many more in incubation!
Application IRP: Bird Conservation
Application IRP: Biofuels
Technical IRP: Dynamical Systems
Technical IRP: Optimization
Species distribution modeling
Bird migration
RCW preservation
Reducing sampling bias
Equilibrium models
Impact of gasoline taxes
Carbon offsets in cap-and-trade
. . . . Problem structure
Stochastic optimization
Multi-agent inference
Balanced designs
Parameter estimation
Synchronization
Monitoring of sustainability
Critical transitions
Examples:

IRP Name Researchers Collaborators Students
1. Reserve Selection and Wildlife Corridors
Conrad, Gomes, Sabharwal, Selman, Shmoys
Dilkina, Dimiduk, Drusvyatskiy
2.
Bird Conservation •!Species distribution •!Bird migration •!RCW preservation
Lab of O: Rosenberg, Webb TCF: Allen, Amundsen, Vaughan Cornell: Conrad, Damoulas, Gomes, Sabharwal, Shmoys OSU: Dietterich, Hutchinson, Sheldon, Wong
Lab of O: Farnsworth, Fink, Hames, Hochachka, Kelling, Wood Cornell: Hooker, Joachims, Riedewald
Ahmadizadeh, Castorena, Dilkina, Elmachtoub, Finseth
3. Fishery Management and Fish Preservation
Conrad, Gomes, Sabharwal, Selman, Yakubu, Zeeman
Jerald, Ziyadi Alam, Ermon, Haycraft, Li, Wiley
4. Disease Prevention in Dairy Cows
Damoulas, Ellner, Gomes, Sabharwal, Selman
Grohn, Cha Ahmadizadeh, LeBras, Prakash, Smith, Teose
5. Forest Fires Borradaile, Dietterich, Montgomery, Rusmevichientong, Shmoys, Wong
Ferst, Spencer, Gagnon, Houtman, Mark, Reynolds
Application IRPs
continued !

IRP Name Researchers Collaborators Students
6. Modeling Ecological Dynamics Ellner
Jones, Mao-Jones, Ritchie, King, Rohani, Ionides, Kendall, Reumann, Newman, Ferrari, Hooker
7. Biofuels •!Equilibrium models •!Cap-and-trade
Bento, Walker Anderson
Bergstrom, Cuvilliez, Kang, Klotz, Landry, Latza, Mayton, Patel, Roth, Stanislaus, Taranto, Weiz
8. Pastoral Systems in East Africa
Barrett, Gomes, Selman, Wong Kariuki, Leeuw, Smith Guo, Toth, Zhuo
9. Poverty Mitigation and Food Insecurity
Barrett, Damoulas, Gomes, Lentz, Naschold
Allen, Bell, Lang, Maxwell, McGlinchy, Murray
Dilkina, Guo, Harou, Lang
10. Invasive Species Conrad, Shmoys Dietterich,Gomes Hutchinson, Sheldon
Yang, Ermon, Spencer
11. Impact of Climate Change
Guckenheimer, Mahowald, Zeeman
Many colleagues in climate science
12. Stress/Environment Interactions Zeeman McCobb Gribizis
13. Material Discovery Damoulas, Gomes, Sabharwal Gregoire, van Dover LeBras
Application IRPs (continued )

78
IRP Name Researchers Collaborators Students
14.
Dynamical Systems •!Parameter estimation •!Synchronization •!Monitoring of sustainability
Guckenheimer, Strogatz, Zeeman Haiduc, Kuehn
15.
Network Science •!High dimensional data •!Sensor networks •!Dynamics & Sync
Gomes, Hopcroft, Selman, Strogatz Ermon, Sheldon
16. Bridging Constraint Reasoning and Machine Learning
Damoulas, Dietterich, Gomes, Sabharwal
Gregoire, van Dover LeBras
17.
Combinatorial Reasoning and Stochastic Optimization •!Problem structure •!Stochastic optimization •!Multi-agent inference •!Balanced designs
Gomes, Sabharwal, Selman, Shmoys, Sheldon
Malitski, Sellmann
Cheung, Dilkina, Ermon, Guo, Kroc, LeBras, Perrault, Ramanujan
18.
Large Scale Computing Paradigms for Massively Large Data Sets and Simulation-Intensive Studies •!Cloud computing
Gomes, Sabharwal, Selman
Ahmadizadeh, Dilkina, Kroc
Technical IRPs

79
Constraint Satisfaction and Optimization
Data and Uncertainty
Distributed Highly
Interconnected Components / Agents
Complexity levels in Computational Sustainability Problems
Dynamics
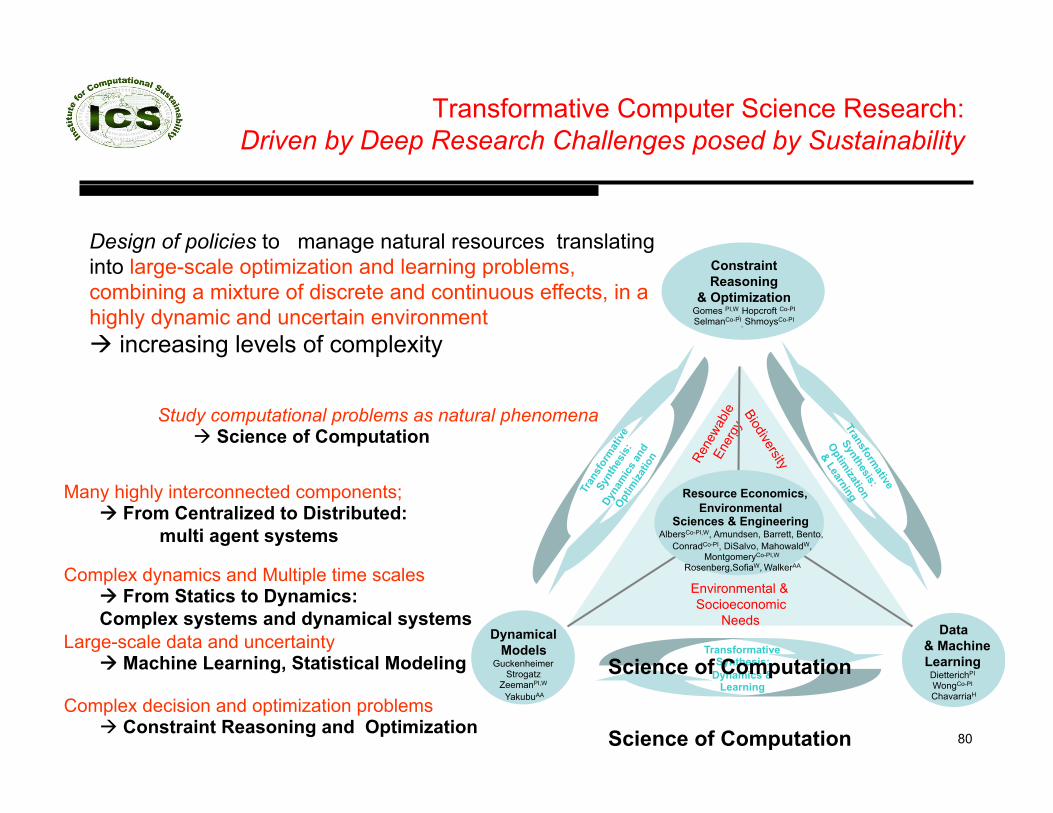
Study computational problems as natural phenomena " Science of Computation
Many highly interconnected components; "" From Centralized to Distributed: multi agent systems
Complex dynamics and Multiple scales "" From Statics to Dynamics: Complex systems and dynamical systems
Large-scale data and uncertainty "" Machine Learning, Statistical Modeling
Transformative Computer Science Research: Driven by Deep Research Challenges posed by Sustainability
Design of policies to manage natural resources translating into large-scale optimization and learning problems, combining a mixture of discrete and continuous effects, in a highly dynamic and uncertain environment " increasing levels of complexity
Complex decision and optimization problems " Constraint Reasoning and Optimization
80
Transformative Computer Science Research: Driven by Deep Research Challenges posed by Sustainability
Data & Machine
Learning DietterichPI
WongCo-PI
ChavarriaH
Environmental & Socioeconomic
Needs Dynamical
Models Guckenheimer
Strogatz
ZeemanPI,W
YakubuAA
Constraint Reasoning
& Optimization Gomes PI,W
, Hopcroft Co-PI
SelmanCo-PI, ShmoysCo-PI
Resource Economics, Environmental
Sciences & Engineering AlbersCo-PI,W, Amundsen, Barrett, Bento,
ConradCo-PI, DiSalvo, MahowaldW, MontgomeryCo-PI,W
Rosenberg,SofiaW, WalkerAA
Transformative Synthesis:
Dynamics & Learning
Science of Computation
Science of Computation
Study computational problems as natural phenomena " Science of Computation
Many highly interconnected components; "" From Centralized to Distributed: multi agent systems
Complex dynamics and Multiple time scales "" From Statics to Dynamics: Complex systems and dynamical systems
Large-scale data and uncertainty "" Machine Learning, Statistical Modeling
Complex decision and optimization problems " Constraint Reasoning and Optimization
Design of policies to manage natural resources translating into large-scale optimization and learning problems, combining a mixture of discrete and continuous effects, in a highly dynamic and uncertain environment " increasing levels of complexity
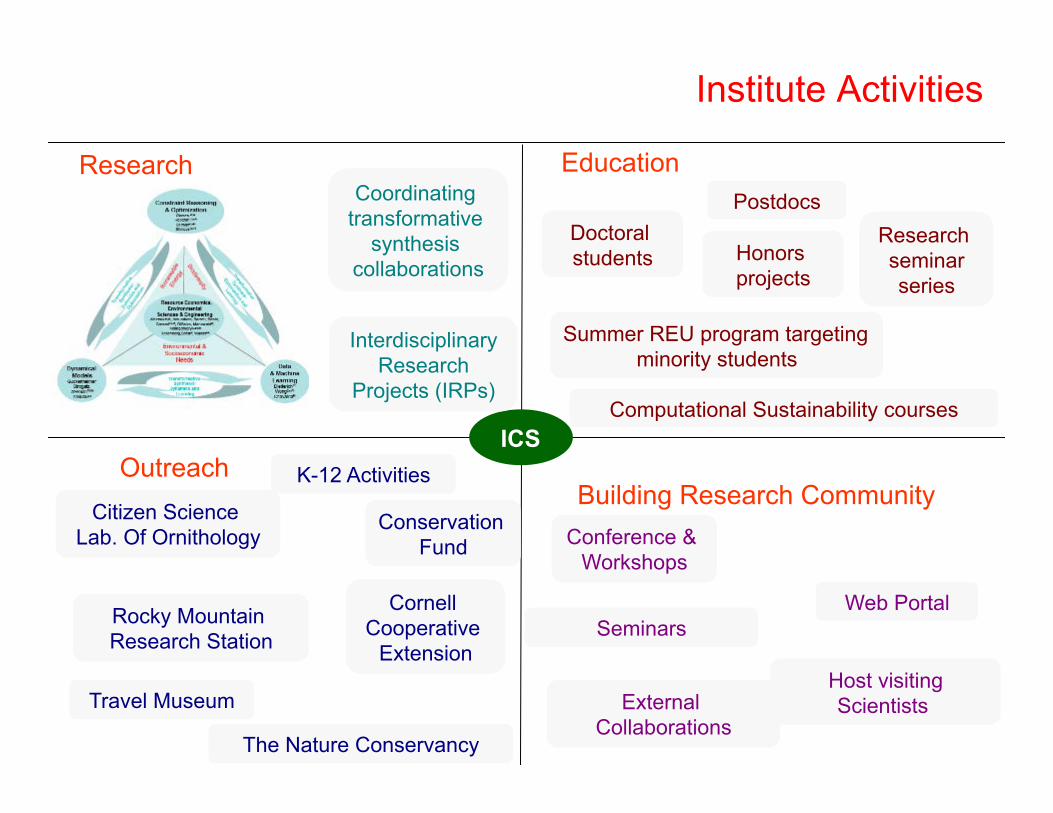
Institute Activities
ICS
Research Coordinating
transformative synthesis
collaborations
Interdisciplinary Research
Projects (IRPs)
Web Portal Seminars
Building Research Community
Host visiting Scientists
Conference & Workshops
External Collaborations
Summer REU program targeting minority students
Computational Sustainability courses
Research seminar series
Postdocs Doctoral students Honors
projects
Education
Cornell Cooperative
Extension
Citizen Science Lab. Of Ornithology
Outreach
Conservation Fund
Rocky Mountain Research Station
The Nature Conservancy
K-12 Activities
Travel Museum
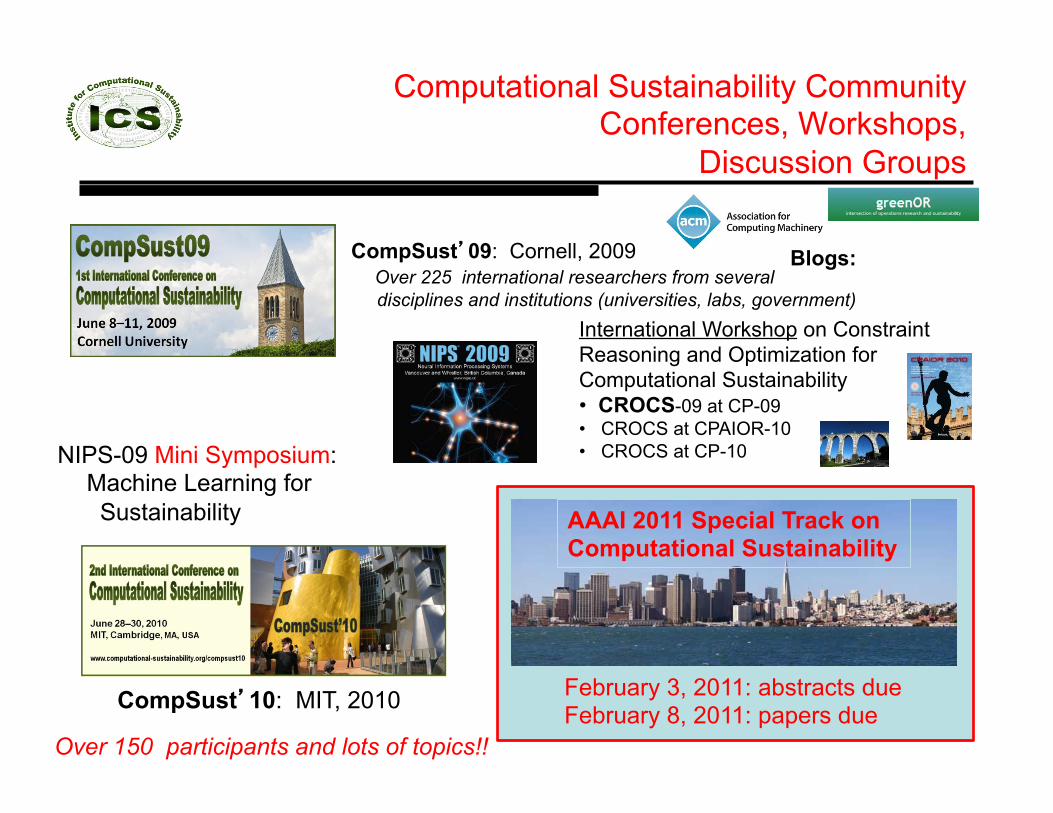
Computational Sustainability Community Conferences, Workshops,
Discussion Groups
CompSust 09: Cornell, 2009 Over 225 international researchers from several disciplines and institutions (universities, labs, government)
International Workshop on Constraint Reasoning and Optimization for Computational Sustainability •! CROCS-09 at CP-09 •! CROCS at CPAIOR-10 •! CROCS at CP-10 NIPS-09 Mini Symposium:
Machine Learning for Sustainability
Blogs:
Over 150 participants and lots of topics!!
CompSust 10: MIT, 2010
AAAI 2011 Special Track on Computational Sustainability
February 3, 2011: abstracts due February 8, 2011: papers due

Conclusions

Computational Sustainability
Interdisciplinary field that aims to apply techniques from computing and information science, and related fields (e.g., engineering, operations research, applied mathematics, and statistics ) for Sustainable Development.
84
Sustainable Development encompasses balancing environmental, economic, and societal needs.

85
Sustainability
Climate
Natural Resources
Social Factors
Human Factors
Education
Economic factors
Energy
Public Policy

Computational Sustainability attempt at a definition
86
Wide interdisciplinary field , encompassing disciplines as diverse as economics, sociology, environmental sciences and engineering , biology, crop and soil science, meteorology and atmospheric science.
Key challenge: to effectively and efficiently establish interdisciplinary collaborations – the level of interconnectedness of social, economic, and environmental issues
makes it really challenging!
Focus: Develop computational models, methods and tools for a broad range of sustainability related applications and task: from supporting decision making and policy analysis concerning the management and allocation of natural resources to the development of new sustainable techniques, products, practices, attitudes, and behaviors.

Computational Sustainability
87
Computer science and related fields
Sustainability fields
New challenging applications for Computer Science
Computational Thinking that will provide new insights into sustainability problems:
Analogy with Computational Biology
New methodologies In Computer Science New methodologies
In Sustainability fields

Summary
Computational Sustainability has great potential to advance the state of the art of computer science and related
disciplines with unique societal benefits!
88
Thank You!

89 From the Cloud Institute, NY
Why Computational Sustainability?
Thank you!

Computational Sustainability
Statistics
eScience
Networks &
Systems
HCI
Game Theory
Operations Research
Systems Eng.
Appl. Mathematics
AI
Alg. Theory
CompSust
Climate
Natural Resources
Social Factors
Human Factors
Education
Economic factors
Energy
Public Policy
90

91

Challenges Managing scientific data: coping with a multidisciplinary world
Table of Product Characteristics id Property name Value
MilkProd productsrep MilkA MilkProd quantity 10000 MilkProd validity date 10/06/2006
CheeseProd productsrep
Minas CheeseProd quantity 2000 CheeseProd validity date 12/02/2006 CheeseProd shape Circular
Slide by Claudia Bauzer Medeiros, 2010
Deluge of heterogeneous data from distributed noisy sensors: Need for Technical skills Socio-emotional skills Transcultural skills
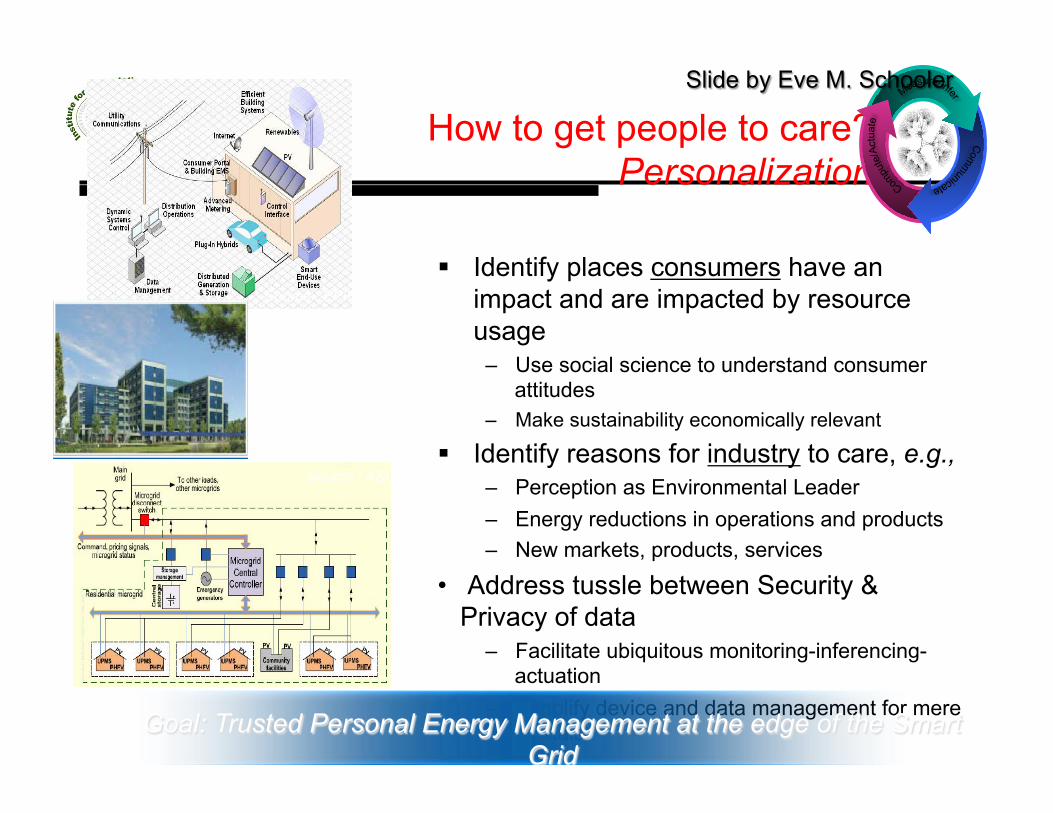
How to get people to care? Personalization
!! Identify places consumers have an
impact and are impacted by resource usage
–! Use social science to understand consumer attitudes
–! Make sustainability economically relevant
!! Identify reasons for industry to care, e.g., –! Perception as Environmental Leader –! Energy reductions in operations and products –! New markets, products, services
•! Address tussle between Security & Privacy of data
–! Facilitate ubiquitous monitoring-inferencing-actuation
–! Simplify device and data management for mere mortals
93
Goal: Trusted Personal Energy Management at the edge of the Smart Grid
Source : EPRI
Source : ASU
Slide by Eve M. Schooler
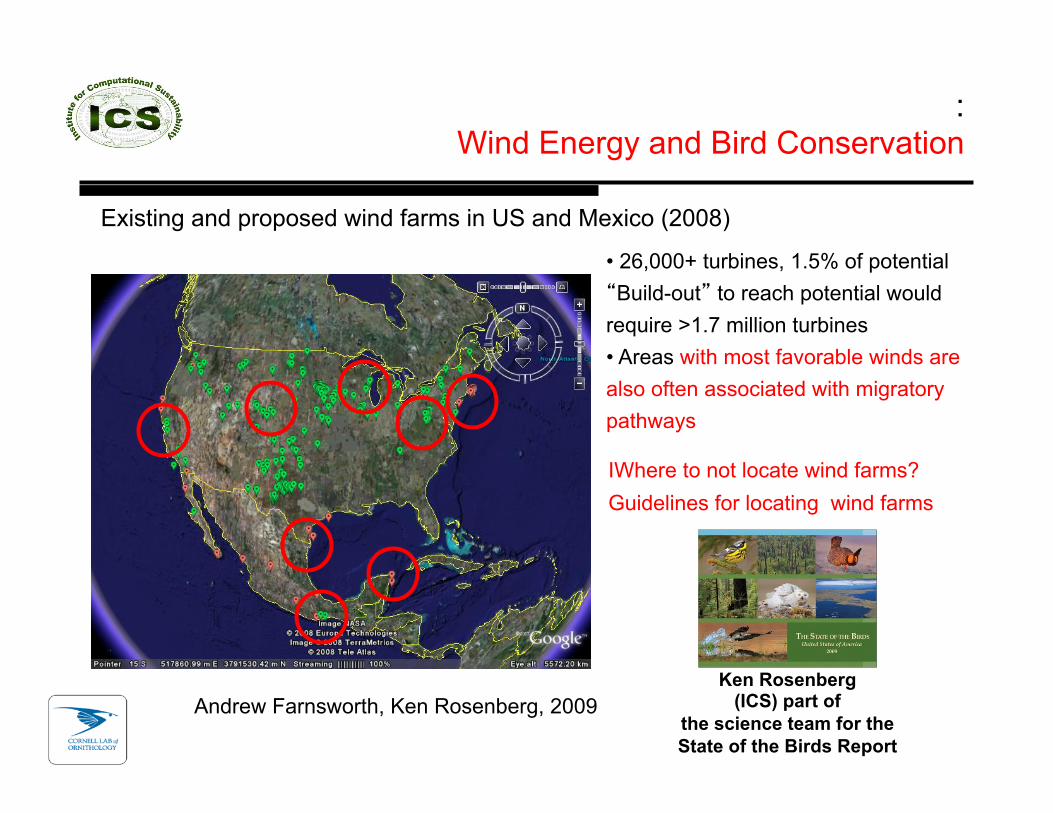
Existing and proposed wind farms in US and Mexico (2008)
•! 26,000+ turbines, 1.5% of potential Build-out to reach potential would
require >1.7 million turbines •! Areas with most favorable winds are also often associated with migratory pathways
Andrew Farnsworth, Ken Rosenberg, 2009
: Wind Energy and Bird Conservation
IWhere to not locate wind farms? Guidelines for locating wind farms
Ken Rosenberg (ICS) part of
the science team for the State of the Birds Report