compstat reporting the compstat process uses computer statistics (data) to: quantify a problem ...
TRANSCRIPT

CompStat ReportingCompStat Reporting
The CompStat process uses computer statistics (data) to:
Quantify a problem Chart a course of action (The SDIS Template)
The process involves: A cycle of periodic data analysis Adjustments to the course of action Group sharing, analysis, and planning

The SDIS TemplateThe SDIS Template
The template is a one page snapshot of the plan
One template is completed for each different data source
The template is updated after each data source is updated

SSelf-elf-DDirectedirected IImprovement mprovement SSystemystem
The SDIS template includes:
The target The data source Your data Feedback from your data Strategies to improve your data An execution plan

Critical Area of Need: ?????????? SDIS™ | Action
Name of School 2008-09
Critical Area of Need: ?????????? SDIS™ | Action
Name of School 2008-09Data
Execute
System-wide TargetSystem-wide Target
Feedback
Strategies
Baseline Assessments
Data Source
What is your data ? (State your goal)
What does your data tell you?
What are you going to do about it ?
Who? Does What? When?
School Goal:
Sub-Goal this Assessment Period: (Used when the school goal is not yet reached)

Target: To Decrease by 50% the To Decrease by 50% the Number of Students BP in MathNumber of Students BP in Math
Data Sources:
TCAP
Stanford Math
ThinkLink
AimsWeb

Critical Area of Need: Mathematics SDIS™ | Action
????? Elementary School 2008-09
Critical Area of Need: Mathematics SDIS™ | Action
????? Elementary School 2008-09 Data
Execute
System-wide TargetSystem-wide Target
Decrease by 50% the Decrease by 50% the number of students number of students
below proficient in mathbelow proficient in math
Feedback
Strategies
Baseline Assessments
2007-08 TCAP Data
2007-08 TCAP Math Subtest2007-08 TCAP Math Subtest
Grade BP P A Total
3456
Total BP = Total LP =
B/LP by Gender M = F =
Who? Does What? When?
School Goal: Involve ??? students scoring below and low proficient in Tier 2 or 3 intervention
1. Generate spreadsheets by grade indicating level of mastery for each student. Include columns to sort significant subgroups (eg. Gender, SWD)
2. Identify participants for Stanford Math and other interventions
3. Analyze data by subskill
4. Budget to procure resources and professional development to target skill areas of need
5. Design after-school tutorial and plan for use of extended contract personnel to address the deficient skill areas
Sub Goal this Assessment Period: To increase the number of target students in intervention from ?? To ??

Critical Area of Need: Mathematics SDIS™ | Action
????? Elementary School 2008-09
Critical Area of Need: Mathematics SDIS™ | Action
????? Elementary School 2008-09 Data
Execute
System-wide TargetSystem-wide Target
Decrease by 50% the Decrease by 50% the number of students number of students
below proficient in mathbelow proficient in math
Feedback
Strategies
Baseline Assessments
EPGY Stanford Math Reports
EPGY Stanford MathEPGY Stanford Math
Number of Target Students:Average Total Minutes:Average Number of Exercises:Average Percent Correct:Average Correct First Attempt:
Who? Does What? When?
School Goal - To ensure that target students participate in a minimum of 90 minutes of per week with a minimum average of 70% correct
1. Generate spreadsheets by grade indicating level of mastery for each student.
2. Identify participants for Stanford Math
3. Identify location(s) for student use of Stanford Math
4. Develop schedule to ensure 90 minutes per student each
5. Monitor student use and progress daily
6.Secure support when needed to trouble-shoot problems
Sub-Goal this Assessment Period: To increase from ?? minutes per week to ?? for target students

Critical Area of Need: Mathematics SDIS™ | Action
????? Elementary 2008-09
Critical Area of Need: Mathematics SDIS™ | Action
????? Elementary 2008-09 Data
Execute
System-wide TargetSystem-wide Target
Decrease by 50% the Decrease by 50% the number of students number of students
below proficient in Mathbelow proficient in Math
Feedback
Strategies
Baseline Assessments
Quarterly Thinklink Assessments
Math Formative Assessment 1
Grade NM P M Total
3456
Total Remaining bp
NM by Gender
Who? Does What? When?
School Goal: To decrease the number of students scoring NM from ?? to ??.
Sub-Goal this Assessment Period: To decrease the number of students scoring NM from ?? To ??

Critical Area of Need: Mathematics SDIS™ | Action
????? Elementary 2008-09
Critical Area of Need: Mathematics SDIS™ | Action
????? Elementary 2008-09 Data
Execute
System-wide TargetSystem-wide Target
Decrease by 50% the Decrease by 50% the number of students number of students
below proficient in Mathbelow proficient in Math
Feedback
Strategies
Baseline Assessments
AimsWeb Assessments (3)
Math Formative Assessment 1
Grade B M E
K123456
Total Remaining Below Benchmark
Below Benchmark by Gender
Who? Does What? When?
School Goal: To decrease the number of students scoring below the benchmark from ?? To ??.
Sub-Goal this Assessment Period: To decrease the number scoring below the benchmark from ?? To ??

Target: To Increase by 35% the To Increase by 35% the Number of Students Adv. in MathNumber of Students Adv. in Math
Data Sources:
TCAP
Stanford Math
ThinkLink

Critical Area of Need: Mathematics SDIS™ | Action
????????? Elementary 2008-09
Critical Area of Need: Mathematics SDIS™ | Action
????????? Elementary 2008-09Data
Execute
System-wideSystem-wide TargetTarget
Increase by 35% the Increase by 35% the number of 6number of 6thth grade grade
students scoring students scoring advanced in Mathadvanced in Math
Feedback
Strategies
Baseline Assessments
2007-08 TCAP Data
2007-08 TCAP Math Subtest 2007-08 TCAP Math Subtest
Grade P HP A Total
6
Total HP = Total A =
A/HP by Gender M = F =
1. Using student data spreadsheets, sort 6th graders by scale score to identify HP and A students.
2. Identify participants for Stanford Math and other enrichment activities
3. Analyze outcome data by subskill
4. Budget to procure resources and professional development to target skills for enrichment
5. Design after-school tutorial and plan for use of extended contract personnel to address these skills
Who? Does What? When?
School Goal: Involve ??? students scoring HP and A in enrichment activities
Sub Goal this Assessment Period Increase the number of students participating in math enrichment from ? to ?

Critical Area of Need: Mathematics SDIS™ | Action
????????? Elementary School 2008-09
Critical Area of Need: Mathematics SDIS™ | Action
????????? Elementary School 2008-09
Data
Execute
System-wide TargetSystem-wide Target
Increase by 35% the Increase by 35% the number of 6number of 6thth grade grade
students scoring students scoring advanced in mathadvanced in math
Feedback
Strategies
Baseline Assessments
EPGY Stanford Math Reports
EPGY Stanford MathEPGY Stanford Math
Number of Target Students:Average Total Minutes:Average Number of Exercises:Average Percent Correct:Average Correct First Attempt:
Who? Does What? When?
School Goal - To ensure that target students participate in a minimum of 90 minutes of per week with a minimum average of 90% correct
1. Use the 6th grade spreadsheet to sort for students scoring HP and A in math
2. Identify enrichment cohort for Stanford Math
3. Identify location(s) for student use of Stanford Math
4. Develop schedule to ensure 90 minutes per student each
5. Monitor student use and progress daily
6. Secure support when needed to trouble-shoot problems
Sub-Goal this Assessment Period: To increase usage from ? to ? minutes per week for enrichment students

Critical Area of Need: Mathematics SDIS™ | Action ???????? Elementary School 2008-09
Critical Area of Need: Mathematics SDIS™ | Action ???????? Elementary School 2008-09
Data
Execute
System-wide GoalSystem-wide Goal
Increase by 35% the Increase by 35% the number of 6number of 6thth grade grade
students scoring students scoring Advanced in MathAdvanced in Math
Feedback
Strategies
Baseline Assessments
Quarterly Thinklink Assessments
Math Formative Assessment 1 Grade NM P M Total
6
Total HP = Total A =
HP/A by Gender M = F=
Who? Does What? When?
School Goal: To increase the number of students scoring A from ?? to ??.
Sub-Goal this Assessment Period: To increase the number of students scoring A from ?? to ??.

Most Critical Area of Need: Climate and Culture SDIS™ | Action
Most Critical Area of Need: Climate and Culture SDIS™ | Action
Data
Execute
100% Implementation of the Uniform
Policy
Feedback
Strategies
Baseline Assessments
Office Referrals, Observation
1. Why are students not following the policy?
2. Why are staff/parents not assisting with the implementation?
3. Why is the policy difficult to enforce?
4. What can the administration do to better enforce the policy?
1. Reduce /eliminate uniform options
2. Ask faculty and staff to monitor
3. Develop clothes closet
4. Educate parents as to the importance of adhering to the policy and why it is in place
5. Implement parent/student contracts
Who?
Does What?
When ?
School Goal: 100% Implementation of the MCS Uniform Policy

Most Critical Area of Need: Climate and Culture SDIS™ | Action
Most Critical Area of Need: Climate and Culture SDIS™ | Action
Data
Execute
100% Implementation of the Cell Phone
Policy
Feedback
Strategies
Baseline Assessments
Office Referrals, Observation
1. Why are students not following the policy?
2. Why aren’t staff/parents helping with the implementation?
3. Why is the policy difficult to enforce?
4. What can the administration do to better enforce the policy?
1. Revisit longer confiscated hold time
2. Increase frequency of surprise classroom visits and random searches
3. Ask faculty and staff to monitor
4. Pilot use of cell phone jammers
5. Educate parents as to the importance of adhering to the policy and why it is in place
6. Use Parent Link to send home reinforcing messages
Who?
Does What?
When ?
School Goal: 100% Implementation of the MCS Cell Phone Policy

Most Critical Area of Need: Climate and Culture SDIS™ | Action
Most Critical Area of Need: Climate and Culture SDIS™ | Action
Data
Execute
100% Implementation
of the Student ID Protocol
Feedback
Strategies
Baseline Assessments
Office Referrals, Observation
1. Why do some students still not have their badges?
2. Why are staff/parents /admin not holding students accountable for having them?
3. Why is the policy difficult to enforce?
4. What can the administration do to better enforce the policy?
1. Ensure that all students have and are wearing ID badges
2. Collaborate with faculty and staff to develop a protocol for student non-compliance
3. Ask faculty and staff to monitor closely
4. Educate parents as to the importance of adhering to the policy and why it is in place
5. Implement parent/student contracts
Who?
Does What?
When ?
School Goal: 100% Implementation of the MCS Student ID Protocol

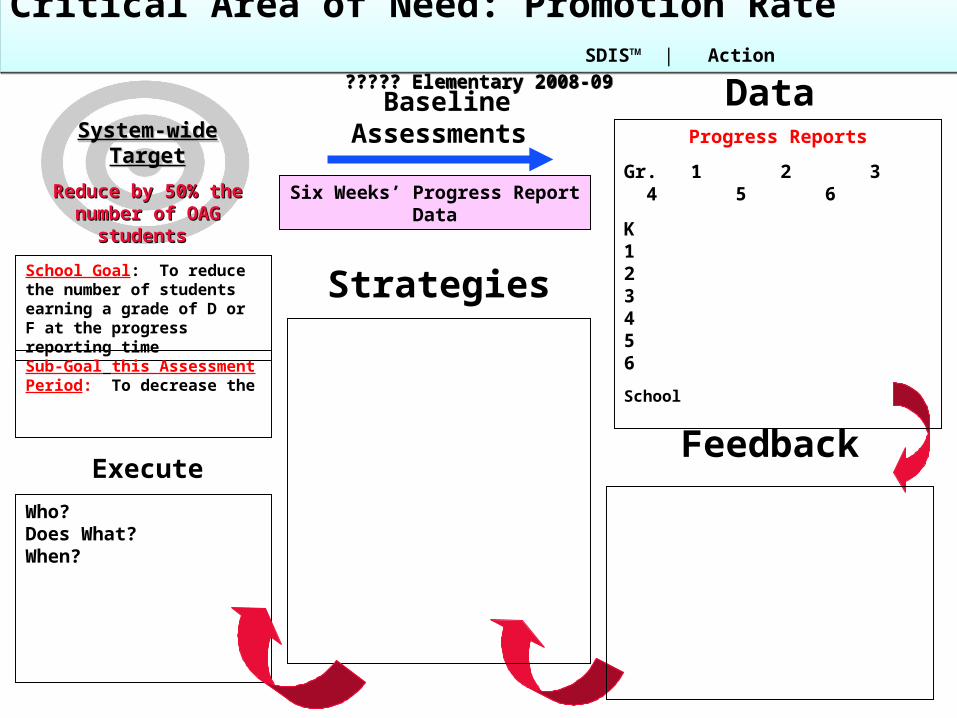
Critical Area of Need: Promotion Rate SDIS™ | Action
????? Elementary 2008-09
Critical Area of Need: Promotion Rate SDIS™ | Action
????? Elementary 2008-09 Data
Execute
System-wide TargetSystem-wide Target
Reduce by 50% the Reduce by 50% the number of OAG students number of OAG students
Feedback
Strategies
Baseline Assessments
August Data for the New School Year
Number Retained2007-08
K123456
Boys = Girls =
School
Who? Does What? When?
School Goal: To reduce the number of retained students from ??? To ???
Sub-Goal this Assessment Period: To decrease the
Critical Area of Need: Promotion Rate SDIS™ | Action
????? Elementary 2008-09
Critical Area of Need: Promotion Rate SDIS™ | Action
????? Elementary 2008-09 Data
Execute
System-wide TargetSystem-wide Target
Reduce by 50% the Reduce by 50% the number of OAG students number of OAG students
Feedback
Strategies
Baseline Assessments
Six Weeks’ Progress Report Data
Progress Reports
Gr. 1 2 3 4 5 6
K123456
School
Who? Does What? When?
School Goal: To reduce the number of students earning a grade of D or F at the progress reporting time
Sub-Goal this Assessment Period: To decrease the

Critical Area of Need: Promotion Rate SDIS™ | Action
????? Elementary 2008-09
Critical Area of Need: Promotion Rate SDIS™ | Action
????? Elementary 2008-09 Data
Execute
System-wide TargetSystem-wide Target
Reduce by 50% the Reduce by 50% the number of OAG students number of OAG students
Feedback
Strategies
Baseline Assessments
Six Weeks’ Report Card Data
Report Card Grades
Gr. 1 2 3 4 5 6
K123456
School
Who? Does What? When?
School Goal: To reduce the number of students earning a grade of D or each six weeks
Sub-Goal this Assessment Period: To decrease the

Critical Area of Need: Discipline SDIS™ | Action
????? Elementary 2008-09
Critical Area of Need: Discipline SDIS™ | Action
????? Elementary 2008-09 Data
Execute
System-wide TargetSystem-wide Target
Reduce by ??% the Reduce by ??% the number of Disciplinary number of Disciplinary
ReferralsReferrals
Feedback
Strategies
Baseline Assessments
Six Weeks’ Disciplinary Referrals
Referrals
Gr. 1 2 3 4 5 6
K123456
School
Who? Does What? When?
School Goal: To reduce the number of students earning a grade of D or each six weeks
Sub-Goal this Assessment Period: To decrease the

Critical Area of Need: Discipline SDIS™ | Action
????? Elementary 2008-09
Critical Area of Need: Discipline SDIS™ | Action
????? Elementary 2008-09 Data
Execute
System-wide TargetSystem-wide Target
Reduce by ??% the Reduce by ??% the number of Fightsnumber of Fights
Feedback
Strategies
Baseline Assessments
Six Weeks’ Disciplinary Referrals
Referrals
Gr. 1 2 3 4 5 6
K123456
School
Who? Does What? When?
School Goal: To reduce the number of students earning a grade of D or each six weeks
Sub-Goal this Assessment Period: To decrease the

Critical Area of Need: Discipline SDIS™ | Action
????? Elementary 2008-09
Critical Area of Need: Discipline SDIS™ | Action
????? Elementary 2008-09 Data
Execute
System-wide TargetSystem-wide Target
Reduce by ??% the Reduce by ??% the number of Suspensionsnumber of Suspensions
Feedback
Strategies
Baseline Assessments
Six Weeks’ Disciplinary Referrals
Referrals
Gr. 1 2 3 4 5 6
K123456
School
Who? Does What? When?
School Goal:
Sub-Goal this Assessment Period: To decrease the