compost use in wetland restoration projectsinfohouse.p2ric.org/ref/13/12549.pdftable l experimental...
TRANSCRIPT
Compost Use In WetlandRestoration Projects
NIST MEPEnvironmental Program

Compost Use In WetlandRestoration Projects
FINAL REPORT
Prepared for
Recycling Technology Assistance Partnership (ReTAP)
A program of the Clean Washington Center,
a division of the Department of Community, Trade & Economic Development
2200 Alaskan Way, Suite 460
Seattle, Washington 98121
September, 1996
Prepared by
E&A Environmental Consultants, Inc.19110 Bothell Way NE, Suite 203
Bothell, Washington 98011
in conjunction with
Adolfson Associates, Inc.5309 Shilshole Ave. NW
Seattle, Washington 98107
This recycled paper is recyclable
Copyright ©1996 by Clean Washington Center
Report No. CM-96-2
TABLE OF CONTENTS
EXECUTIVE SUMMARY.............................................................................................................i
1.0 SITE AND PROJECT HISTORY.......................................................................................1
1.1 SITE HISTORY..............................................................................................................1
1.2 GOALS.............................................................................................................................2
1.3 COMMUNITY SUPPORT AND INVOLVEMENT ...................................................3
1.4 STATE GUIDELINES FOR WETLAND RESTORATION......................................4
2.0 SITE DESIGN .......................................................................................................................5
2.1 DESIGN GOALS ............................................................................................................5
3.0 EXPERIMENTAL DESIGN................................................................................................7
3.1 TARGET PARAMETERS.............................................................................................7
3.2 COMPOST INCLUSION RATE...................................................................................7
3.2.1 Similar Species Nutrient Uptake..........................................................................103.2.2 Application Rates For Fen And Experimental Plots ............................................13
4.0 EXPERIMENTAL RESULTS...........................................................................................16
4.1 PLANT GROWTH RESPONSE AND SURVIVAL RATES ...................................16
4.2 SOIL ANALYSES.........................................................................................................18
4.2.1 Total and Volatile Solids Content ..........................................................................14.2.2 Particle Size Analysis.............................................................................................24.2.3 pH...........................................................................................................................34.2.4 Conductivity...........................................................................................................44.2.5 Nitrogen Dynamics ................................................................................................54.2.6 Phosphorus and Potassium Levels .........................................................................74.2.7 Copper..................................................................................................................104.2.8 Other Analyses Performed ...................................................................................10
4.3 SURFACE WATER QUALITY..................................................................................13
4.4 WILDLIFE OBSERVATIONS ...................................................................................14
5.0 GUIDELINE FOR USE OF COMPOST IN WETLAND RESTORATION ................15
5.1 TYPE OF COMPOST..................................................................................................15
5.2 REQUIRED ANALYSES.............................................................................................16
5.3 SUMMARY WORKSHEET FOR COMPOST APPLICATION ...........................20
6.0 INFORMATION DISSEMINATION EFFORTS............................................................23
7.0 ACKNOWLEDGMENTS ..................................................................................................24
BIBLIOGRAPHY........................................................................................................................25
APPENDICES: (Not included in this electronic file but available upon request)
APPENDIX A - GROWTH AND PLANT SURVIVAL RATE SPREADSHEETS ...A-1
APPENDIX B - LABORATORY RESULTS .................................................................A-2
APPENDIX C - SITE DRAWINGS ................................................................................A-3
APPENDIX D - WETLAND SPECIES SUITABLE TO WESTERN WASHINGTONA-4
APPENDIX E - WORKSHEET FOR AGRONOMIC LOADING RATE..................A-5

LIST OF TABLES
Table l Experimental Plot Design Loading................................................... ....... 8Table 2 Plant Species and Quantities for Experimental Plots...............................11Table 3 Similiar Wetland Species Nutrient Uptake.............................................14Table 4 Estimated N Uptake and Weighted Averages................................... .....15Table 5 Cadman Wetland Restoration Compost Application Rates.....................17Table 6 Everett Wetland Target Compost Loading Rates...................................17Table 7 C:N Ratio and Organic Content Estimates....................................... .. ..18Table 8 Micronutrient Analyses.........................................................................32Table 9 Surface Water Quality Analyses Results................................................34Table 10 Example of Analyses of Existing Soils and Compost........................ .....38Table 11 Sample Plant List..................................................................................39Table 12 Agronomic Rates of Plant Groups.........................................................39Table 13 Soil Parameter Comparison...................................................................41Table 14 Worksheet for Agronomic Loading Rate of Compost to Wetland..........42Table 15 Inches of Compost to be Applied..........................................................43Table 16 Conference Attendance and Information Dissemination.........................44
LIST OF FIGURES
Figure l Wetland Nitrogen Cycle.......................................................................13Figure 2 Experimental Plot Growth Comparison................................................20Figure 3 Survival Rate Comparison for Experimental Plots................................21Figure 4 Total and Volatile Solids Content........................................................23Figure 5 Particle Size Analysis...........................................................................24Figure 6 Analysis of pH at 12 Months................................................................25Figure 7 Conductivity Analysis..........................................................................26Figure 8 Organic Nitrogen Analysis...................................................................27Figure 9 Ammonia Nitrogen Dynamics..............................................................28Figure 10 Nitrate Nitrogen Dynamics..................................................................29Figure 11 Phosphorous Levels.............................................................................29Figure 12 Potassium Levels.................................................................................30Figure 13 Copper Levels in Experimental Plots....................................................31Figure 14 Cation Exchange Capacity...................................................................32
i
EXECUTIVE SUMMARY
This project was undertaken with support from the Recycling Technology Assistance Partnership
(ReTAP), a program of the Clean Washington Center of the Washington State Department of
Community, Trade & Economic Development. The intent was to determine if the use of
compost in wetlands had benefits which could add value to compost by decreasing the frequency
of failure of restoration efforts. Commonly, restoration efforts fail for one of the following
reasons:
• Hydraulic miscalculations
• Death of the target wetland plant species
• Invasive species propagation
The last two reasons stated above may very well be curtailed by the addition of compost. The
addition of a rich strong organic matter with some essential plant nutrients ( i.e. nitrogen,
phosphorus, and potassium) can promote strong growth of target species and allow them to
compete with the opportunistic invaders which adapt well to adverse soil conditions. This report
presents the findings of a year long study at a wetland restoration site which showed excellent
results in these areas. The results indicate that if a stable compost is applied at agronomic rates,
the growth and survival rate of target wetland species can be aided. The plots which used
compost showed approximately 20% more growth and 10 to 15% higher survival rate than the
control plots, which used no compost. The surrounding surface water quality did not degrade as
a result of the application.
This report outlines the steps necessary to design compost applications for restoration projects.
A worksheet provides a template for the calculation of an agronomic rate of nitrogen application
from a specific compost to a specific wetland condition.
The aim of this report is to serve as a tool for the wetland community to responsibly use compost
in restoration projects and reduce the number of failures associated with the construction of

ii
wetlands. The results of this study indicate that a compost with a high organic content and a low
nitrogen content will serve this end use best by:
1. Providing strong organic substrate to mimic wetland soils
2. Preventing overloading of nitrogen and contamination of the surface water
3. Providing organic matter for absorption of ammonia N to prevent transport in surface
water.

1
1.0 SITE AND PROJECT HISTORY
In early 1994, staff at the City of Everett’s Department of Public Works , with the help of E&A
Environmental Consultants, Inc. (E&A) and Adolfson Associates, Inc., submitted a technology
validation project proposal to the Clean Washington Center’s Recycling Technology Assistance
Partnership (ReTAP). The proposed project was to determine if the use of compost in wetlands
had benefits which could add value to compost by decreasing the frequency of failure of
restoration efforts. The City knew that such a project was of keen interest to the Clean
Washington Center (CWC) for its potential to open the wetland restoration market to compost
products and funded the project. This report documents the findings of the study. Ultimately,
the study will lead to guidelines outlining the best procedures for using compost to replicate
wetland soils.
1.1 SITE HISTORY
Lower Bigelow Creek in the City of Everett, which flows from the Lowell neighborhood into the
Snohomish River, consists of two large riparian wetlands connected by a 550 foot 18-inch
culvert. This culvert diverts water around a two acre parcel which was filled in decades ago for
the construction of a sawmill. At the outset of the project, the site was barren and all water was
routed through the culvert. The fill material was very sandy, and the site was covered with
Scot’s Broom, an invasive brush. This plant is generally considered a nuisance and is not native
to the area.
Railroad lines run through the property near the upper wetland. The wetlands are home to a
variety of wildlife including a relatively large population of beavers. Beaver activity in and
around the 550 foot culvert has caused constant flooding of the railroad tracks adjacent to the
upper wetland. The railroad and the City of Everett proposed to alleviate the flooding problem
by “removing” the beavers. However, a well organized group of neighbors opposed this plan,
and as a result, a great deal of public attention has been focused on this project.
2
In response, the City proposed to expand the upper wetland at Bigelow Creek in order to control
flooding, as mitigation for other impacted wetlands, and in order to allow the beavers to remain
in the wetland area. The expansion of the upper wetland consisted of replacing the old culvert
with a shorter, (80 foot) fish passable culvert. The shorter culvert would be easier to maintain
and the expanded wetland would provide better flood attenuation and increased wildlife habitat.
In addition, the City proposed to install perforated pipes in the series of existing beaver dams in
the upper wetlands to further reduce the flooding. All would be accomplished using compost as
the restoration's substrate.
1.2 GOALS
The goals of the project included the following:
1. Promotion of the use of compost in wetland projects,
2. Promotion of the beneficial re-use of locally-generated “waste” in local applications
3. Flood control for the area, and
4. Generate and evaluate data for determination of success.
One of the compost materials used was a biosolids and yard debris material from the Everett
Wastewater Treatment Plant pilot composting project (which was also conducted by E&A). The
use of this material constituted a full cycle recycling effort, since the compost feedstocks were all
generated by the residents of the city of Everett and the product was returned for beneficial reuse
within the City limits. Although the practice does promote responsibility for one's own waste,
the concept of using biosolids compost to construct wetlands resulted in some concern in both
the regulatory community and the local neighborhood. First, the neighbors were concerned
about the potential contaminant levels of treated biosolids. However, the U.S. Environmental
Protection Agency maintains strict guidelines to assure that biosolids compost from wastewater
treatment plants are “high quality” and considered safe. Everett's material meets all guidelines
and is considered a high quality material. Second, regulators were concerned about the potential
for compost overloading resulting in nitrate transport to the surface water, and metals leaching.
A surface water monitoring plan proposed as part of the experiment eased concerns about
unmonitored application of the compost. In fact, the results of surface water testing during the
project indicated no adverse effects from the compost application. After extensive collaboration

3
with both groups, the project was able to proceed and demonstrate the concept of full cycle
recycling.
Other goals included those associated with the marketing of compost. This use of compost could
potentially add value to compost by opening new markets within the area of wetland restoration.
If the use of compost increased the success rate of wetland restoration, it would be viewed as a
means of preventing the costly replanting required when a site failed to promote the appropriate
plant community. In addition, the wetland construction project served to stabilize the water
levels in the area. The site handled the flow of 1996’s heavy winter rains quite well, and the
railroad tracks did not flood. This is an indication that the fen area served its purpose as a flood
plain in heavy rain conditions.
In addition, there were research and demonstration goals which were addressed during the course
of the project. The experimental plots examined the growth and survival of the target plants as
well as the invasive species growth. The soil from each plot was analyzed for an array of
parameters in an effort to replicate the soils in the surrounding existing wetland. These results
are presented in Section 5 of this report.
1.3 COMMUNITY SUPPORT AND INVOLVEMENT
City staff conducted a series of one-on-one meetings with neighborhood leaders and other
interested persons in the neighborhood to informally discuss the project objectives and to gather
input for a conceptual design. The concept of using composted products as a wetland soil
substitute was introduced during these informal meetings. Collaborating with the neighborhood
leaders created a positive problem-solving atmosphere which lead to the creation of a plan
addressing the concerns of the City, the railroad, and the neighborhood.
Early and comprehensive involvement of key members of the local neighborhood resulted in a
project that was not just tolerated but demanded by the neighbors. Everett's community
involvement program successfully formed an alliance with the local neighborhood that was
instrumental in negotiating the regulatory hurdles that had to be cleared. After the consultant and
Dan Thompson attended a community meeting and briefed the citizens, over 30 letters of
4
endorsement requesting that the City restore the wetlands using biosolids compost were sent to
the Mayor. The neighborhood civic association voted unanimously to endorse the use of
biosolids to restore wetlands near their homes, and the majority of the project was planted by
volunteer labor from the local neighborhood. The overwhelming support of the neighborhood
overcame the initial skepticism of the regulators. All necessary permits were negotiated in less
than four months.
1.4 STATE GUIDELINES FOR WETLAND RESTORATION
The Washington State Department of Ecology published a report entitled Restoring Wetlands in
Washington - A Guidebook for Wetland Restoration, Planning and Implementation. The
guidebook is a strong reference for such projects in the state, and offers suggestions on suitable
substrates. The report states that restoration sites with suitable soil types are often limited.
Organic amendments are recommended in order to boost organic content of wetland soils.
Suggested materials are processed peat, straw, or hay which can be mixed with mineral soils to
provide preliminary levels of organic matter. It is also suggested that importing hydric soils can
be a benefit, since roots and microbes will aid in the success of a restoration project. The
guidebook states that these measures are necessary to promote moisture retention, add organic
materials, and add nutrients and micronutrients. The use of compost is not specifically outlined,
although compost would add to all of the above stated criteria. This report will be forwarded to
the state DOE and an amendment recommended.
5
2.0 SITE DESIGN
2.1 DESIGN GOALS
The site restoration plan was designed to allow for flow through the fen area, which served as a
flood plain during heavy flow periods. The excavation plan also called for the gradual sloping of
the experimental plots down to the water surface, which allowed for the planting of a wide
variety of wetland species throughout the water regime. These excavation plans are shown in
Appendix C.
In addition to the excavation plans, Appendix C contains the plot plans for the planting design.
The fen area is shown, with the prescribed plant arrangements. The planting schemes for each of
the experimental plots shows that the target species were placed in the same areas of each plot.
An effort was made to ensure that each of the plots had similar slope, sun, and water conditions.
This was accomplished for all but plot one, which was flooded after the original drainage culvert
was plugged. The remainder of the plots all had similar conditions, and therefore represent
identical plots aside from the compost application rate.
The application rates of the compost were designed to bracket the agronomic needs of the plant
community chosen for each plot. Two plots were established for each of three application rates
for two types of compost (greenwaste and biosolids/greenwaste) and a control (no compost) for a
total of 14 plots. One of the three application rates was designed to closely match the agronomic
rate, and the other two were designed to be higher and lower than the agronomic rate. Table 1
describes the application rates and compost type for each of the 14 plots.

6
Table 1: Experimental Plot Design LoadingPlot # Compost Type Target Pounds
Available N/Acre1 gw 2002 gw/bio 2003 control 04 gw 5005 gw/bio 5006 gw 3507 gw/bio 3508 gw 2009 gw/bio 20010 control 011 gw 50012 gw/bio 50013 gw 35014 gw/bio 350
gw = greenwaste, bio = biosolids
7
3.0 EXPERIMENTAL DESIGN
3.1 TARGET PARAMETERS
Three application rates of two different composts were applied in an effort to simulate the
existing wetland soil conditions. Analysis of the surrounding wetland soils defined the desired
target ranges of the chosen soil parameters to be achieved in the restoration effort. These ranges
were met through the introduction of a compost and sand mixture as a substrate in the newly
constructed area. Parameters studied included organic content, C:N ratio, pH, conductivity,
water holding capacity, soil oxygen levels, cation exchange capacity, and trace nutrients. In
addition to the lab analyses, plant populations and dynamics (survival rate and plant height) were
recorded to study the effect of compost use on promoting the growth and survival of target
species as well as suppressing invasive species.
3.2 COMPOST INCLUSION RATE
Compost inclusion rates were based on creating optimum conditions for wetland plant growth
while minimizing environmental impacts. A table was developed that summarizes literature
information on nutrient uptake of wetland plants. Nitrogen (N) uptake will usually be the
limiting factor for the application of the compost, since over-application of nitrogen can cause
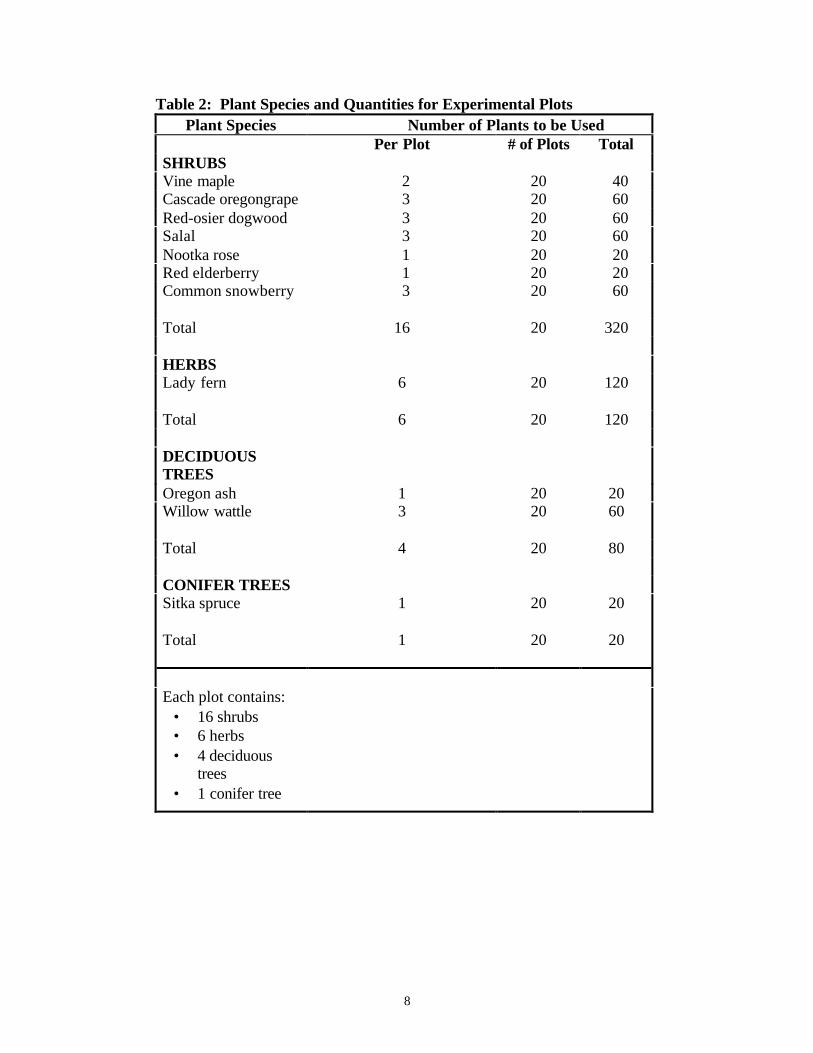
water quality degradation. The nutrient uptake shown in Table 3 follows the list of plants (Table
2) which were used in the experimental plots. The plants were grouped into similar categories
(trees, shrubs, herbs, etc.). Each experimental plot contained a predetermined number of plants
from each grouping. By assigning an average nitrogen uptake for each of the groups of plants, a
weighted average of uptake can be estimated according to the number of each type of plant in
each plot. This estimate can then be presented in pounds of nitrogen per acre.
8
Table 2: Plant Species and Quantities for Experimental PlotsPlant Species Number of Plants to be Used
Per Plot # of Plots TotalSHRUBSVine maple 2 20 40Cascade oregongrape 3 20 60Red-osier dogwood 3 20 60Salal 3 20 60Nootka rose 1 20 20Red elderberry 1 20 20Common snowberry 3 20 60
Total 16 20 320
HERBSLady fern 6 20 120
Total 6 20 120
DECIDUOUSTREESOregon ash 1 20 20Willow wattle 3 20 60
Total 4 20 80
CONIFER TREESSitka spruce 1 20 20
Total 1 20 20
Each plot contains:• 16 shrubs• 6 herbs• 4 deciduous
trees• 1 conifer tree

9
Table 3: Similar Wetland Species Nutrient UptakePlant Species Nutrient Uptake (pounds per acre)
Nitrogen (N) Phosphorous (P) Potassium (K)GRASSESReed canarygrass 169 30 282Orchard grass 300 45 311Brome grass 166 29 211Bluegrass 200 29 149Tall fescue 135 24 149Common reed (Phragmites) 271 35
Average 207 32 220
HERBSCattail 185 38Moss 59Bulrush 185 47
Average 143 42
DECIDUOUS TREESAspen 5.7 0.8Young deciduous 100Medium-mature deciduous 30-50
Average 100 0.8
CONIFER TREESLoblolly pine 9 1 4Young conifer 60Medium-mature conifer 20-30
Average 60 1 4
Next, the nitrogen content of the compost was examined. With data on moisture content, bulk
density, and nitrogen content of the compost, an estimate was made of cubic yards of compost
per acre. Assumptions were made concerning the availability of nitrogen in a wetland
environment, and are presented later in this chapter. An assumption was made for the nitrogen
uptake of shrubs which was based on the numbers for similar groundcover and trees. This
estimate was used for the design of the experimental plots.

10
The evidence from the Monroe Cadman wetland restoration site was also examined to aid in
determining compost inclusion rates. The Monroe Cadman project was a demonstration project
sponsored by the Clean Washington Center completed prior to this project. The Clean
Washington Center report was published in 1993. Its purpose was to complete a cursory
demonstration of the use of compost in a wetland restoration project. This project is the follow
up, and builds upon the previous work by examining soil parameters much more closely. There
was strong evidence that varying levels of nitrogen loading gave varying degrees of success for
plant survival and invasive species suppression. This evidence was noted and taken into
consideration, but was eventually superseded by the nitrogen needs of the plants in each
experimental plot.
3.2.1 Similar Species Nutrient Uptake
In order to estimate the nutrient uptake of each plot, an investigation into the nutrient needs of
wetland species was conducted. Nitrogen uptake is of special significance as it will usually be
the limiting factor affecting application rate. Application rates that exceed the plants uptake rate
will likely result in nitrate leaching and runoff. As a result, the experimental plots were designed
to use no more nitrogen than was needed by the plants to be grown in each plot.
For agricultural soils, there is a tremendous amount of information regarding the transformation
of organic N to inorganic N after an organic amendment is incorporated. Likewise, there is
considerable information regarding plant nitrogen requirements. The research behind this data
was prompted by the need to optimize fertilizer use for low cost and high crop yield. There is
less information about this pertaining to wetland soils. However, some research has been done
from the standpoint of using artificial wetlands for wastewater treatment. As a result, a small
amount of data has been generated concerning the nutrient uptake of wetland species.
Nitrogen exists in three forms - inorganic, organic, and gaseous. Organic N consists of carbon
based compounds such as protein and is not available to plants. Soil microbes convert organic N
to inorganic N (mineralization). Plants use inorganic N for nutrition in the form of nitrate (NO3-)
and ammonia (NH4+) ions, which are the plant available forms. Ammonia, which can be
absorbed by clay and organic matter preventing transportation by water, is converted to nitrate
11
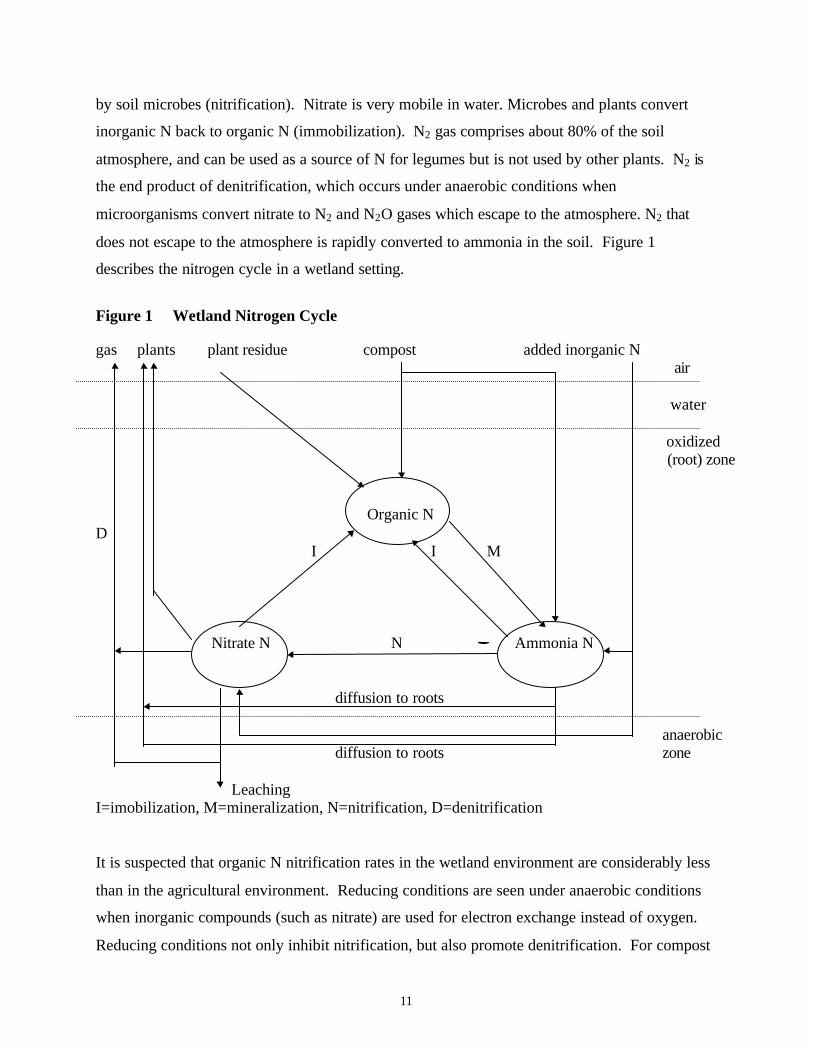
by soil microbes (nitrification). Nitrate is very mobile in water. Microbes and plants convert
inorganic N back to organic N (immobilization). N2 gas comprises about 80% of the soil
atmosphere, and can be used as a source of N for legumes but is not used by other plants. N2 is
the end product of denitrification, which occurs under anaerobic conditions when
microorganisms convert nitrate to N2 and N2O gases which escape to the atmosphere. N2 that
does not escape to the atmosphere is rapidly converted to ammonia in the soil. Figure 1
describes the nitrogen cycle in a wetland setting.
Figure 1 Wetland Nitrogen Cycle
gas plants plant residue compost added inorganic N air
water
oxidized (root) zone
Organic ND
I I M
Nitrate N N Ammonia N
diffusion to roots
anaerobicdiffusion to roots zone
LeachingI=imobilization, M=mineralization, N=nitrification, D=denitrification
It is suspected that organic N nitrification rates in the wetland environment are considerably less
than in the agricultural environment. Reducing conditions are seen under anaerobic conditions
when inorganic compounds (such as nitrate) are used for electron exchange instead of oxygen.
Reducing conditions not only inhibit nitrification, but also promote denitrification. For compost

12
application in agricultural soils it is assumed 10 to 30 percent of the organic N becomes available
in the first year, depending on soil type, temperature, moisture and other factors. It is also
believed that the lack of oxygen in the wetland setting will inhibit the mineralization of nitrogen
into plant available forms. Some oxygen will be introduced into the soil through the root zones
of the plants, so mineralization will occur at some small level. Also, an unstable compost with
high available carbon content will have a very low mineralization rate. The compost used in this
project was very stable. This project used a conservative estimate of 10% mineralization for the
compost. Levels of nitrogen were monitored throughout the project so as to form a better
understanding of the dynamics of the soil.
The data for the trees and the data for the undergrowth (shrubs and herbs) assumed that the
individual plant type was planted uniformly across the entire acreage. However, the trees and
the undergrowth coexist on the same plot of land. Therefore, the weighted averages of the shrub
and herb data were added to the weighted average of the tree data. This accounts for total
potential nitrogen uptake.
Table 4: Estimated N Uptake and Weighted Averages
Plant Type # Plants PerPlot
Estimated N Uptake(lbs/acre)
Shrubs 16 150Herbs 6 143
Weighted average 148
Deciduous trees 4 100Conifer trees 1 60
Weighted average 92
Total 27 240
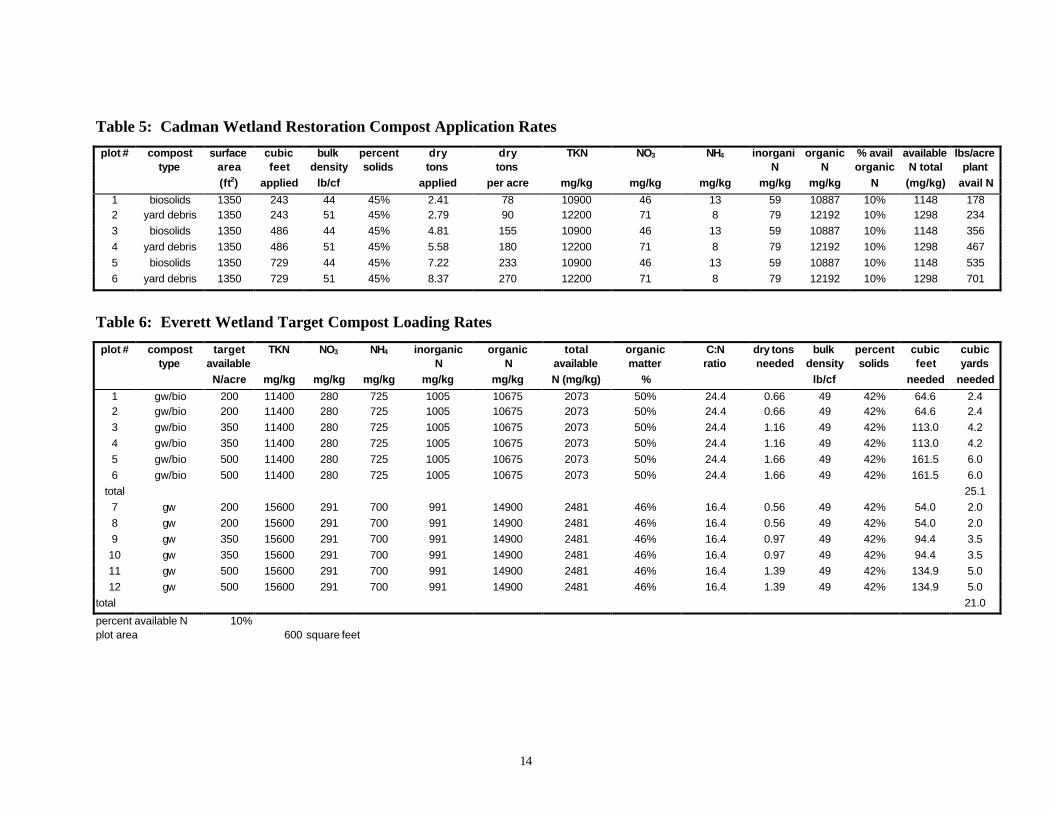
Tables 5 and 6 show the data for the recently completed Monroe Cadman wetland restoration
project in Monroe, as well as the target loading rates of nitrogen and corresponding volumes
needed for the Everett restoration project. Consideration for the loading rates was based first on
the success of the plots at the Cadman site and their corresponding loading rates. After looking
13
at these numbers, the loading rates were adjusted according to the nutrient needs of the plants
going into the experimental plots. Compost for the experimental plots was obtained from the
Everett pilot compost project (biosolids/greenwaste) and from Phoenix Composting
(greenwaste).
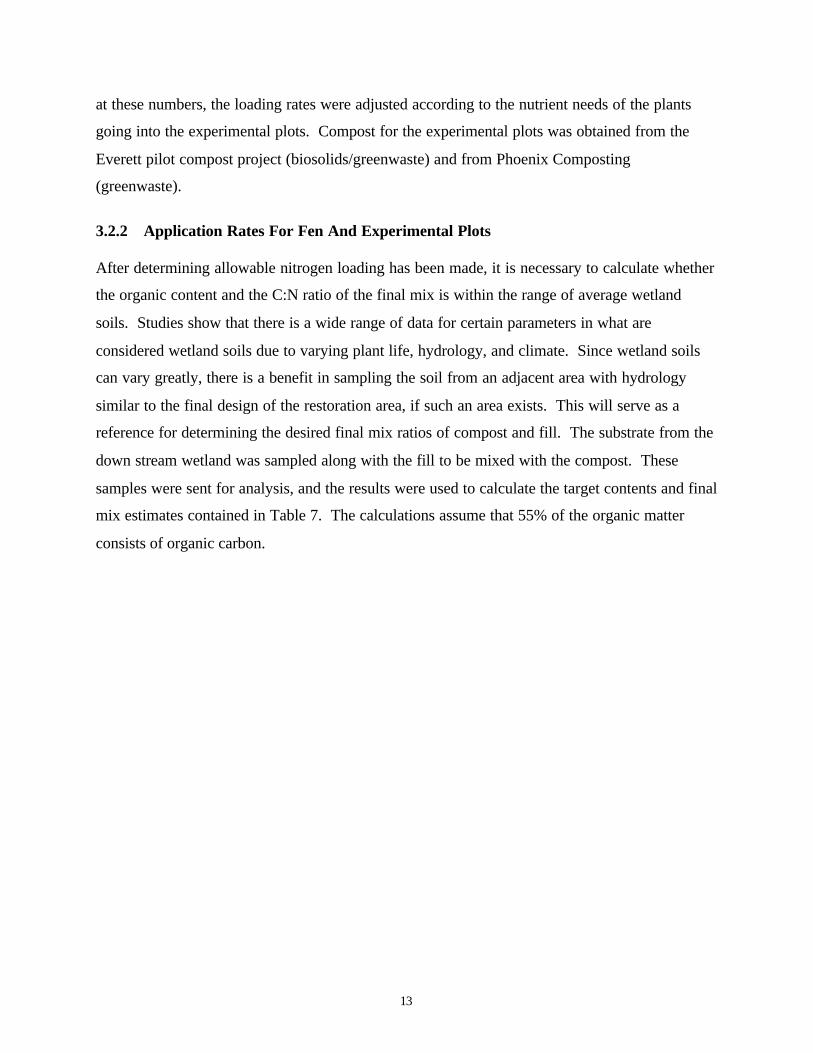
3.2.2 Application Rates For Fen And Experimental Plots
After determining allowable nitrogen loading has been made, it is necessary to calculate whether
the organic content and the C:N ratio of the final mix is within the range of average wetland
soils. Studies show that there is a wide range of data for certain parameters in what are
considered wetland soils due to varying plant life, hydrology, and climate. Since wetland soils
can vary greatly, there is a benefit in sampling the soil from an adjacent area with hydrology
similar to the final design of the restoration area, if such an area exists. This will serve as a
reference for determining the desired final mix ratios of compost and fill. The substrate from the
down stream wetland was sampled along with the fill to be mixed with the compost. These
samples were sent for analysis, and the results were used to calculate the target contents and final
mix estimates contained in Table 7. The calculations assume that 55% of the organic matter
consists of organic carbon.
14
Table 5: Cadman Wetland Restoration Compost Application Rates
plot # compost surface cubic bulk percent dry dry TKN NO3 NH4 inorgani organic % avail available lbs/acretype area feet density solids tons tons N N organic N total plant
(ft2) applied lb/cf applied per acre mg/kg mg/kg mg/kg mg/kg mg/kg N (mg/kg) avail N
1 biosolids 1350 243 44 45% 2.41 78 10900 46 13 59 10887 10% 1148 1782 yard debris 1350 243 51 45% 2.79 90 12200 71 8 79 12192 10% 1298 234
3 biosolids 1350 486 44 45% 4.81 155 10900 46 13 59 10887 10% 1148 356
4 yard debris 1350 486 51 45% 5.58 180 12200 71 8 79 12192 10% 1298 467
5 biosolids 1350 729 44 45% 7.22 233 10900 46 13 59 10887 10% 1148 535
6 yard debris 1350 729 51 45% 8.37 270 12200 71 8 79 12192 10% 1298 701
Table 6: Everett Wetland Target Compost Loading Rates
plot # compost target TKN NO3 NH4 inorganic organic total organic C:N dry tons bulk percent cubic cubictype available N N available matter ratio needed density solids feet yards
N/acre mg/kg mg/kg mg/kg mg/kg mg/kg N (mg/kg) % lb/cf needed needed
1 gw/bio 200 11400 280 725 1005 10675 2073 50% 24.4 0.66 49 42% 64.6 2.42 gw/bio 200 11400 280 725 1005 10675 2073 50% 24.4 0.66 49 42% 64.6 2.4
3 gw/bio 350 11400 280 725 1005 10675 2073 50% 24.4 1.16 49 42% 113.0 4.2
4 gw/bio 350 11400 280 725 1005 10675 2073 50% 24.4 1.16 49 42% 113.0 4.2
5 gw/bio 500 11400 280 725 1005 10675 2073 50% 24.4 1.66 49 42% 161.5 6.0
6 gw/bio 500 11400 280 725 1005 10675 2073 50% 24.4 1.66 49 42% 161.5 6.0
total 25.1
7 gw 200 15600 291 700 991 14900 2481 46% 16.4 0.56 49 42% 54.0 2.0
8 gw 200 15600 291 700 991 14900 2481 46% 16.4 0.56 49 42% 54.0 2.0
9 gw 350 15600 291 700 991 14900 2481 46% 16.4 0.97 49 42% 94.4 3.5
10 gw 350 15600 291 700 991 14900 2481 46% 16.4 0.97 49 42% 94.4 3.5
11 gw 500 15600 291 700 991 14900 2481 46% 16.4 1.39 49 42% 134.9 5.0
12 gw 500 15600 291 700 991 14900 2481 46% 16.4 1.39 49 42% 134.9 5.0
total 21.0
percent available N 10%plot area 600 square feet

15
Table 7: C:N Ratio and Organic Content Estimates
plot # compost fill fill fill fill target target organic C:N
type organic nitrogen C:N bulk organic range content ratio
percent percent ratio density content* C:N ratio* final mix final mix
1 gw/bio 0.40% 0.03% 7.4 110 > 5% > 5% 4.74% 7.67
2 gw/bio 0.40% 0.03% 7.4 110 > 5% > 5% 4.74% 7.67
3 gw/bio 0.40% 0.03% 7.4 110 > 5% > 5% 7.53% 7.87
4 gw/bio 0.40% 0.03% 7.4 110 > 5% > 5% 7.53% 7.87
5 gw/bio 0.40% 0.03% 7.4 110 > 5% > 5% 9.99% 8.06
6 gw/bio 0.40% 0.03% 7.4 110 > 5% > 5% 9.99% 8.06
total
7 gw 0.40% 0.03% 7.4 110 > 5% > 5% 3.78% 7.58
8 gw 0.40% 0.03% 7.4 110 > 5% > 5% 3.78% 7.58
9 gw 0.40% 0.03% 7.4 110 > 5% > 5% 6.01% 7.70
10 gw 0.40% 0.03% 7.4 110 > 5% > 5% 6.01% 7.70
11 gw 0.40% 0.03% 7.4 110 > 5% > 5% 8.01% 7.82
12 gw 0.40% 0.03% 7.4 110 > 5% > 5% 8.01% 7.82
*existing wetland substrate org % = 4 %
C:N = 5.5
The other parameters are probably not extremely critical and it is unlikely the addition of
compost at reasonable rates would create a suboptimal growing environment for wetland species.

16
4.0 EXPERIMENTAL RESULTS
The experimental plots were designed to generate data in order to determine which application
rate and compost type would best mimic the parameters of the surrounding wetlands. The results
indicate that if a stable compost is applied at agronomic rates, the growth and survival rate of
target wetland species can be aided. The plots which used compost showed approximately 20%
more growth and 10 to 15% higher survival rate than the control plots, which used no compost.
The surrounding surface water quality did not degrade as a result of the application. Details of
experimental results are provided in the following sections.
4.1 PLANT GROWTH RESPONSE AND SURVIVAL RATES
In order to study the effects of the use of compost on wetland species growth and survival, this
report presents and analyzes data on both of these items for each of the experimental and control
plots. These items are of importance to the restoration of a wetland since they are indicators
used to judge the success of a project. A regulatory agency can deem a project a success or
failure based on plant survival and invasive species propagation. Other definitions of success
include improvement of wetland functions such as hydrologic (flood peak reduction, shoreline
stabilization, groundwater exchange), water quality improvement (sediment, nutrient), and food
chain support (species diversity). If compost could be shown to promote better target species
survival, it might prevent some regulatory failures, and therefore prevent costly replanting.
The average growth rate (height of plant) of the target plant species is an indication of their
ability to take hold and out compete invasive species. Invasive species are highly adaptable and,
therefore, can often out-compete a target plant when substandard substrate is used. The use of a
good organic substrate offers the target species a good chance to survive against the
opportunistic invaders. Figure 2 on the following page shows the average percent of grow rate
for each of the application rates.

17
The first two bars indicate the first and second plots, and the third, the average of the two. As
can be seen, nearly all of the application rates had considerably higher growth rates than the
control plots. The one exception is the 200 lb/acre N greenwaste plots. This is likely due to high
water in the first plot, which led to low growth and high mortality. The second plot did
considerably better.
Figure 2 Experimental Plot Growth Comparison
Average Growth in Experimental Plots
0%
20%
40%
60%80%
100%
120%
0control
200gw
350gw
500gw
200gw/bio
350gw/bio
500gw/bio
Experimental Plot
% G
row
th 1st plot
2nd plot
average
Figure 3 shows the survival rate of the target species in each application and in the control.
Again, each plot is shown along with the average of the two. Similar to what was seen in the
growth data, nearly all of the application rates had higher survival rates, on average, than the
control plot. The one exception, again, is the 200 lb/acre N greenwaste plots. This is likely also
due to the flooding in the first plot. The second plot did considerably better than the first.
Figure 3 Survival Rate Comparison for Experimental Plots
0 %
1 0 %
2 0 %
3 0 %
4 0 %
5 0 %
6 0 %
7 0 %
8 0 %
9 0 %
1 0 0 %
0cont ro l
200g w
350g w
500g w
200gw/b io
350gw/b io
500gw/b io
E x p e r i m e n t a l P l o t s
Per
cen
t P
lan
t S
urv
ival
1 s t p l o t
2 n d p l o t
a v e r a g e

18
The data presented in the graphs above is available in a spreadsheet in Appendix A - Growth and
Plant Survival Rate Spreadsheets.
4.2 SOIL ANALYSES
Several mesh bags of each soil/compost mixture were buried in each plot in order to track the
nutrient dynamics and other parameters. At three points during the first year (0, 6, and 12
months) after construction, one bag was removed from each plot and sent for lab analysis. The
purpose of these analyses was to determine how the different mixes would respond over time.
Two experimental plots were established for each compost application (type and loading rate)
and control (no compost applied) for a total of 14 plots. In addition, soil samples were taken
from the upstream wetland and analyzed for comparison. The graphics which follow for each of
the target parameters show the results for the surrounding wetland as well as the averages for
each of the experimental plots.
The following information describes the results of the analysis of the soils sampled from each of
the experimental plots at 0, 6, and 12 months after the construction of the wetland. The target
parameters studied included the following:
• Total solids content• Volatile solids content• Particle size• pH• Conductivity
• Nitrogen dynamics• Phosphorus and potassium
dynamics• Copper
Each of these parameters is tracked and compared to the existing wetland substrate in the bar
charts which follow. Along with the data is a description of each parameter and its importance
within the soil ecosystem. Where appropriate, average wetland soil content of each parameter is
described. In addition, the section includes information on additional parameters which were
tracked, beyond those originally described in the proposal. These include:
• Cation exchange capacity• Magnesium• Calcium• Sodium
• Boron• Sulfur• Zinc• Manganese

1
All data for each plot is included in a spread sheet in Appendix B in addition to the bar charts
included in each of the following sections. At the end of the section is a matrix of all parameters
and best matches to the existing substrate.
4.2.1 Total and Volatile Solids Content
Total solids are the total amount of suspended (or filterable) solids in the compost. Volatile
solids are the organic fraction (anything that can be decomposed) of the total solids content.
Their measure is important in determining biological stability. Total and volatile solids content
at the end of the 12 month period for each application are shown in Figure 4. All of the plots,
with the exception of the controls, had a solids content similar to that of the existing wetland.
The volatile solids content (organic matter) for each of the applications was less than that of the
existing substrate, but grew over the 12 month period. The control plot did not see this increase
in organic content. The increase in the volatile solids might be explained by the favorable
conditions for plant growth afforded by the addition of the compost. The growth of plants in
these plots would result in increased root growth. The mesh bags may have allowed some root
growth through the sides, which should account for the increased volatile solids.
Figure 4 Total and Volatile Solids Content
Total Solids at 12 Months and Volatile Solids at 0, 6, and 12 Months
0
5
10
15
20
25
30
35
xexisting
0control
200gw
350gw
500gw
200bio/gw
350bio/gw
500bio/gw
nitrogen loading rate (lb available N) and compost type
per
cen
t
ts - 12 months
vs - 0 months
vs - 6 months
vs - 12 months

2
4.2.2 Particle Size Analysis
Analyses of the particle size for each of the plots allowed for a comparison of soil composition.
This comparison is shown in Figure 5. The mixes used for this project were designed so as not
to over load the nitrogen. The composts chosen for use had average levels of nitrogen. As a
result, large amounts of sand substrate had to be mixed with the compost in order not to overload
the nitrogen on the wetland plots. The results are soils with 10 to 20% more sand content than
the surrounding wetland soils. In hind sight, a compost with a high organic content and a lower
nitrogen content should have been used to provide for a higher organic content and lower
nitrogen content in the final application mix.
Figure 5 Particle Size Analysis
P a r t i c l e S i z e A n a l y s i s
0 %
1 0 %
2 0 %
3 0 %
4 0 %
5 0 %
6 0 %
7 0 %
8 0 %
9 0 %
1 0 0 %
xexis t ing
0con t ro l
2 0 0g w
3 5 0g w
5 0 0g w
2 0 0b i o / g w
3 5 0b i o / g w
5 0 0b i o / g w
n i t r o g e n l o a d i n g r a t e ( l b / a c r e a v a i l a b l e N ) a n d c o m p o s t t y p e
per
cen
t o
f to
tal c
om
po
siti
on
% c l a y
% s i l t
% s a n d
3
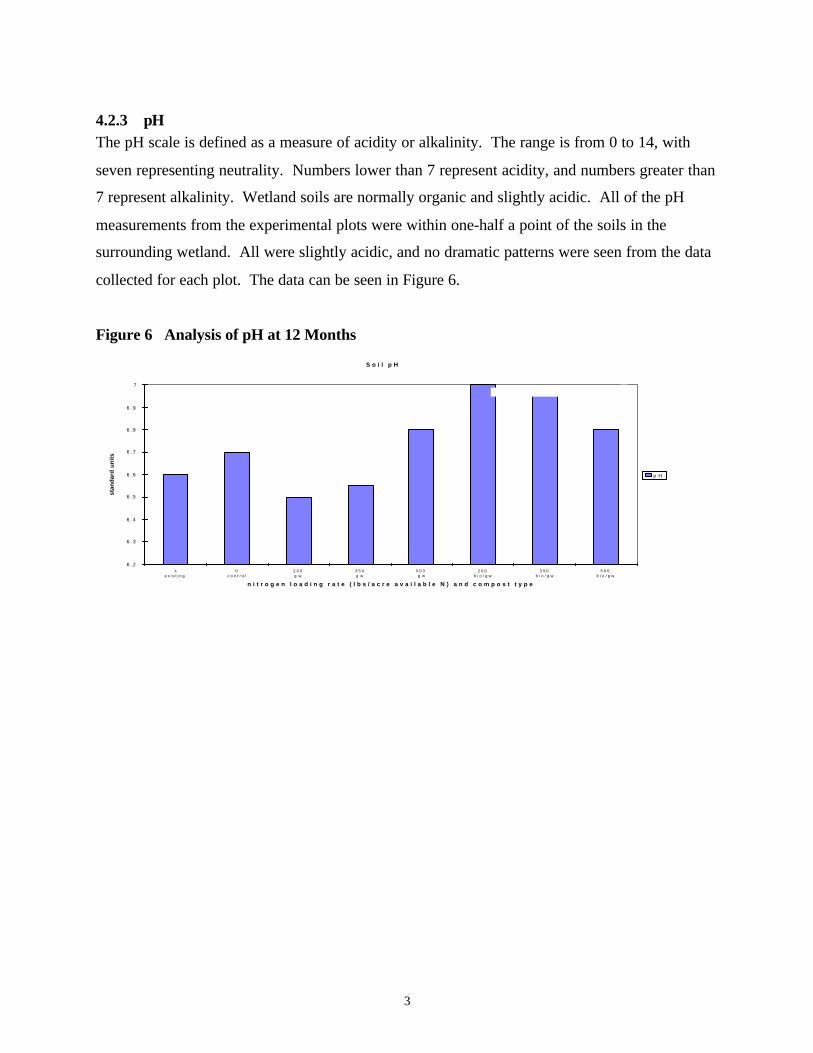
4.2.3 pHThe pH scale is defined as a measure of acidity or alkalinity. The range is from 0 to 14, with
seven representing neutrality. Numbers lower than 7 represent acidity, and numbers greater than
7 represent alkalinity. Wetland soils are normally organic and slightly acidic. All of the pH
measurements from the experimental plots were within one-half a point of the soils in the
surrounding wetland. All were slightly acidic, and no dramatic patterns were seen from the data
collected for each plot. The data can be seen in Figure 6.
Figure 6 Analysis of pH at 12 Months
S o i l p H
6 . 2
6 . 3
6 . 4
6 . 5
6 . 6
6 . 7
6 . 8
6 . 9
7
xe x i s t i n g
0c o n t r o l
2 0 0g w
3 5 0g w
5 0 0g w
2 0 0b i o / g w
3 5 0b i o / g w
5 0 0b i o / g w
n i t r o g e n l o a d i n g r a t e ( l b s / a c r e a v a i l a b l e N ) a n d c o m p o s t t y p e
stan
dar
d u
nit
s
p H
4
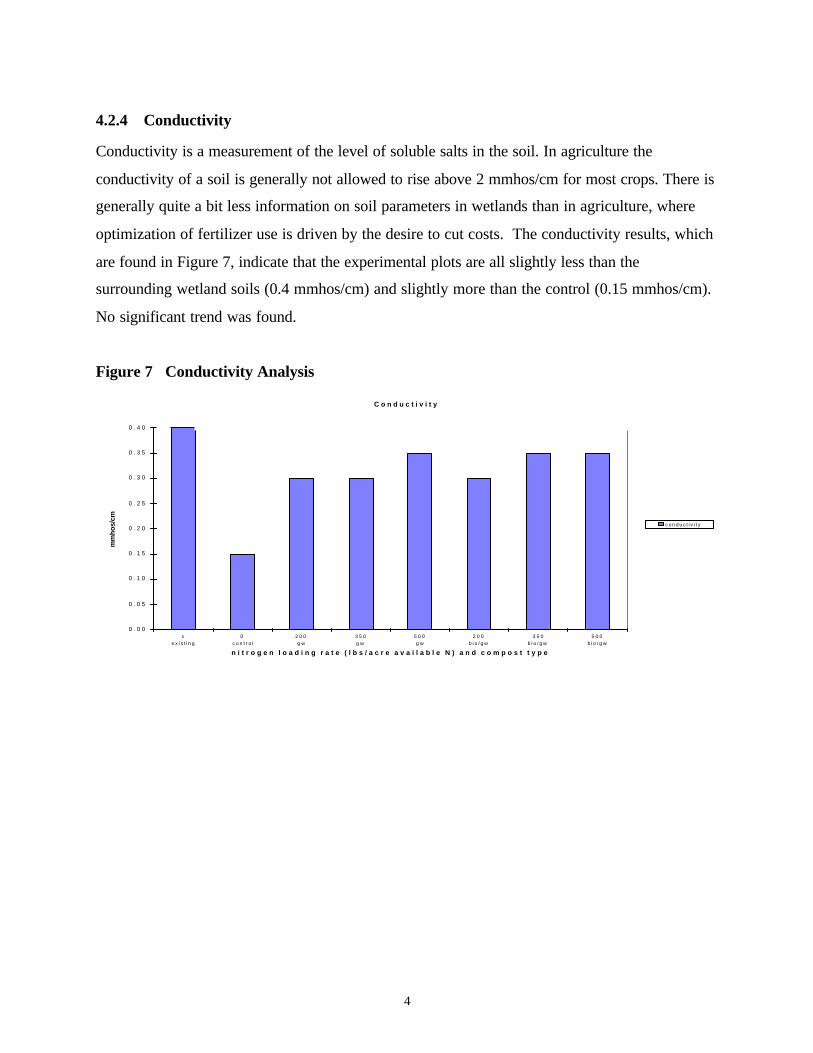
4.2.4 Conductivity
Conductivity is a measurement of the level of soluble salts in the soil. In agriculture the
conductivity of a soil is generally not allowed to rise above 2 mmhos/cm for most crops. There is
generally quite a bit less information on soil parameters in wetlands than in agriculture, where
optimization of fertilizer use is driven by the desire to cut costs. The conductivity results, which
are found in Figure 7, indicate that the experimental plots are all slightly less than the
surrounding wetland soils (0.4 mmhos/cm) and slightly more than the control (0.15 mmhos/cm).
No significant trend was found.
Figure 7 Conductivity Analysis
C o n d u c t i v i t y
0 . 0 0
0 . 0 5
0 . 1 0
0 . 1 5
0 . 2 0
0 . 2 5
0 . 3 0
0 . 3 5
0 . 4 0
xe x i s t i n g
0c o n t r o l
2 0 0g w
3 5 0g w
5 0 0g w
2 0 0b i o / g w
3 5 0b i o / g w
5 0 0b i o / g w
n i t r o g e n l o a d i n g r a t e ( l b s / a c r e a v a i l a b l e N ) a n d c o m p o s t t y p e
mm
ho
s/cm
c o n d u c t i v i t y

5
4.2.5 Nitrogen Dynamics
Nitrogen dynamics are of interest whenever applying a nitrogen source to the soil. The nitrogen
cycle consists of converting organic nitrogen to plant available inorganic nitrogen and back. The
addition of compost into a wetland is of benefit for both the organic matter and for the nitrogen
added. Nitrogen will set the limit for application, since too much N can contaminate ground and
surface water. Please refer to Section 3.3 for a full description of the nitrogen cycle.
Organic N is Total Kjeldahl Nitrogen (TKN) minus ammonia N and nitrate N. Figure 8 shows
the average levels of organic N for each treatment at 0, 6, and 12 months. As can be seen, some
immobilization is taking place, as the organic N levels increase over time. The yard debris
compost continues to rise for the 12 months, while the biosolids compost rises for the first six
months, and then drops off again. This indicates that less immobilization occurs with the
biosolids compost plots, allowing more of the N to remain plant available. None of the plots
have levels approaching that of the surrounding soils, but all exceed the control plots.
Figure 8 Organic Nitrogen Analysis
Organic Ni t rogen Dynamics - 12 Month Per iod
0
1000
2000
3000
4000
5000
6000
xex is t ing
0control
200g w
350g w
500g w
200b i o / g w
350b i o / g w
500b i o / g w
nitrogen loading rate ( lbs/acre avai lable N) and compost type
org
anic
N (
pp
m)
0 months
6 months
12 months
6
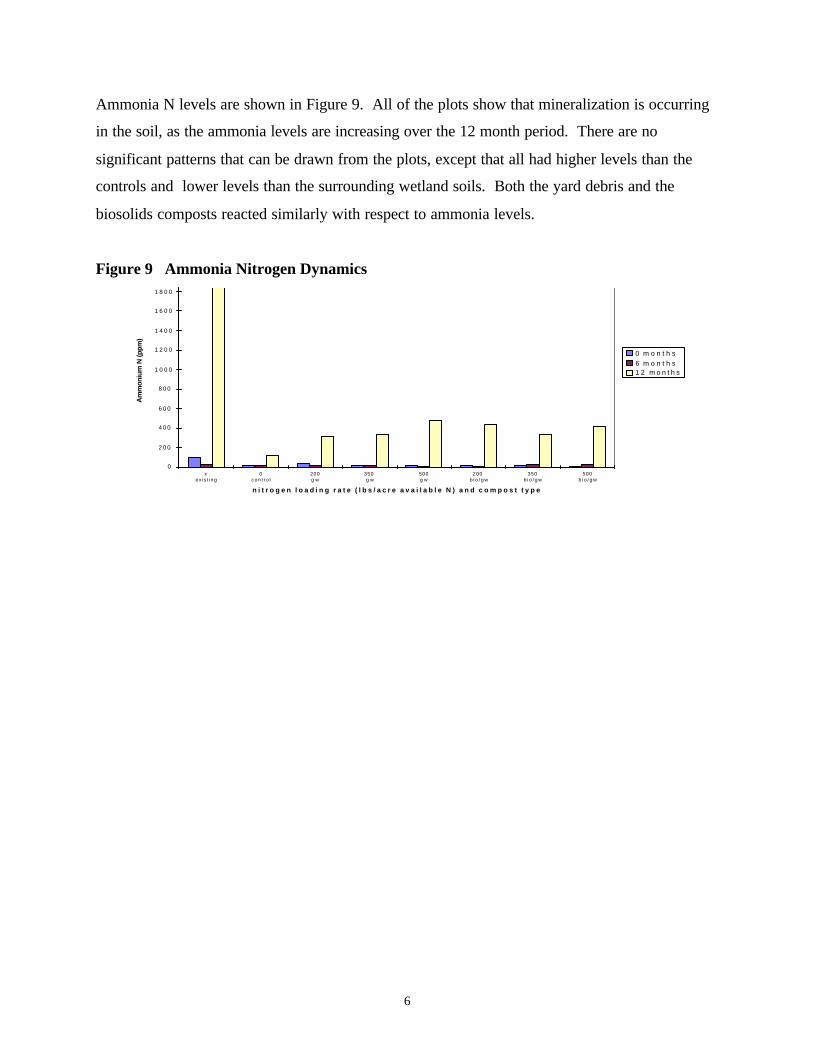
Ammonia N levels are shown in Figure 9. All of the plots show that mineralization is occurring
in the soil, as the ammonia levels are increasing over the 12 month period. There are no
significant patterns that can be drawn from the plots, except that all had higher levels than the
controls and lower levels than the surrounding wetland soils. Both the yard debris and the
biosolids composts reacted similarly with respect to ammonia levels.
Figure 9 Ammonia Nitrogen Dynamics
0
2 0 0
4 0 0
6 0 0
8 0 0
1 0 0 0
1 2 0 0
1 4 0 0
1 6 0 0
1 8 0 0
xex is t ing
0c o n t r o l
200g w
350g w
500g w
200b i o / g w
350b i o / g w
500b i o / g w
n i t r o g e n l o a d i n g r a t e ( l b s / a c r e a v a i l a b l e N ) a n d c o m p o s t t y p e
Am
mo
niu
m N
(p
pm
)
0 m o n t h s
6 m o n t h s1 2 m o n t h s

7
Nitrate levels in the plots over the 12 month period are shown in Figure 10. As is evidenced by
the plots, a good deal of the nitrate is used or lost over the course of the experiment. The new
plants likely used a good deal of this N over the course of the summer, when the plants were
establishing themselves. The plots were planted in late March. The levels of nitrate N loss/use
correspond to less than 10 lbs/acre on average. The estimate for plant uptake of N for each
experimental plot was approximately 240 lb/acre. This assumed a 10% mineralization rate for
the first year. The losses of nitrate N could be from denitrification caused by the anaerobic
conditions of the soil during wet periods, plant uptake, or leaching. No degradation of the
surface water was seen over the 12 month period.
Figure 10 Nitrate Nitrogen Dynamics
0
5
1 0
1 5
2 0
xe x i s t i n g
0c o n t r o l
2 0 0g w
3 5 0g w
5 0 0g w
2 0 0b i o / g w
3 5 0b i o / g w
5 0 0b i o / g w
n i t r o g e n l o a d i n g r a t e ( l b s / a c r e a v a i l a b l e N ) a n d c o m p o s t t y p e
Nit
rate
N (
pp
m)
0 m o n t h s
6 m o n t h s
1 2 m o n t h s
8
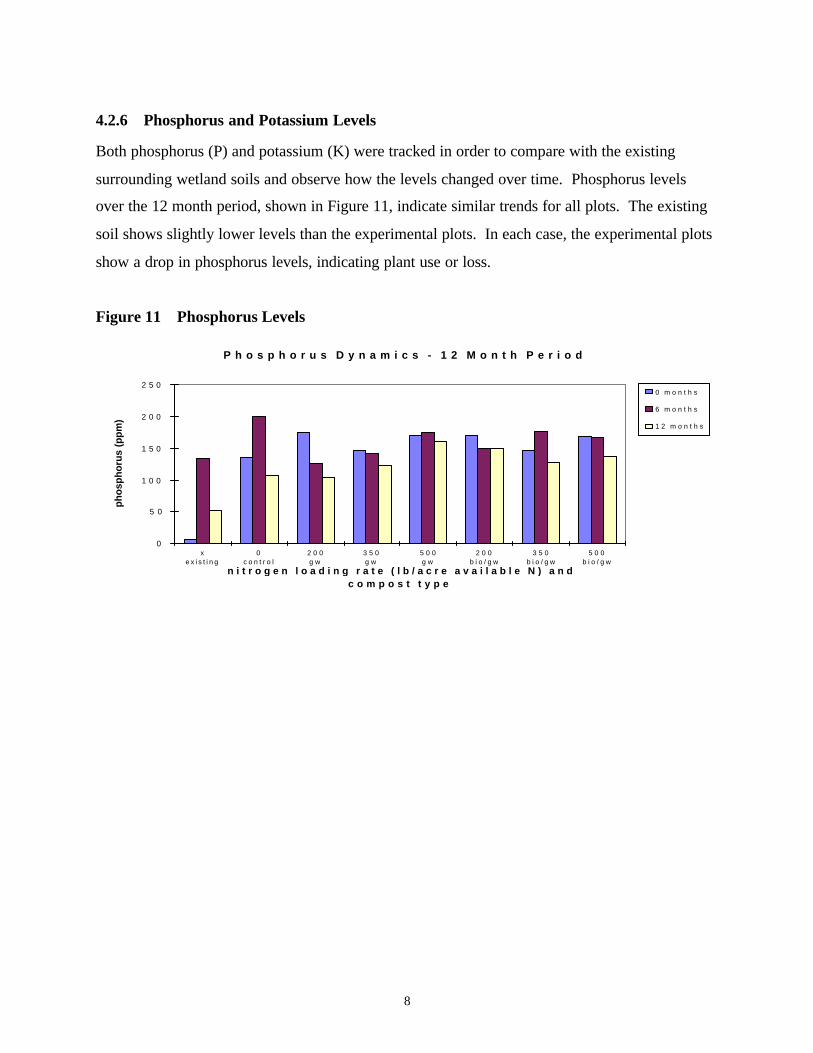
4.2.6 Phosphorus and Potassium Levels
Both phosphorus (P) and potassium (K) were tracked in order to compare with the existing
surrounding wetland soils and observe how the levels changed over time. Phosphorus levels
over the 12 month period, shown in Figure 11, indicate similar trends for all plots. The existing
soil shows slightly lower levels than the experimental plots. In each case, the experimental plots
show a drop in phosphorus levels, indicating plant use or loss.
Figure 11 Phosphorus Levels
P h o s p h o r u s D y n a m i c s - 1 2 M o n t h P e r i o d
0
5 0
1 0 0
1 5 0
2 0 0
2 5 0
xe x i s t i n g
0c o n t r o l
2 0 0g w
3 5 0g w
5 0 0g w
2 0 0b i o / g w
3 5 0b i o / g w
5 0 0b i o / g w
n i t r o g e n l o a d i n g r a t e ( l b / a c r e a v a i l a b l e N ) a n d c o m p o s t t y p e
ph
osp
ho
rus
(pp
m)
0 m o n t h s
6 m o n t h s
1 2 m o n t h s

9
Potassium levels over the 12 month period are shown in Figure 12. This Figure shows that
again, levels are greater in the experimental plots than in the surrounding soils and control. All
of the data for the existing soil, control plots, and compost applications show a similar trend,
indicating some possible seasonal effects. The plots all start out high and drop off rapidly during
the first six months. This might indicate that the phosphorus in the compost is being used by the
new plants in each of the plots. It also might indicate some loss or as stated above, a seasonal
effect.
Figure 12 Potassium Levels
0
1 0 0
2 0 0
3 0 0
4 0 0
5 0 0
6 0 0
7 0 0
x
e x i s t i n g
0
c o n t r o l
2 0 0
g w
3 5 0
g w
5 0 0
g w
2 0 0
b i o / g w
3 5 0
b i o / g w
5 0 0
b i o / g w
n i t r o g e n l o a d i n g r a t e ( l b a v a i l a b l e N ) a n d c o m p o s t t y p e
po
tass
ium
(p
pm
)
0 m o n t h s
6 m o n t h s
1 2 m o n t h s
10
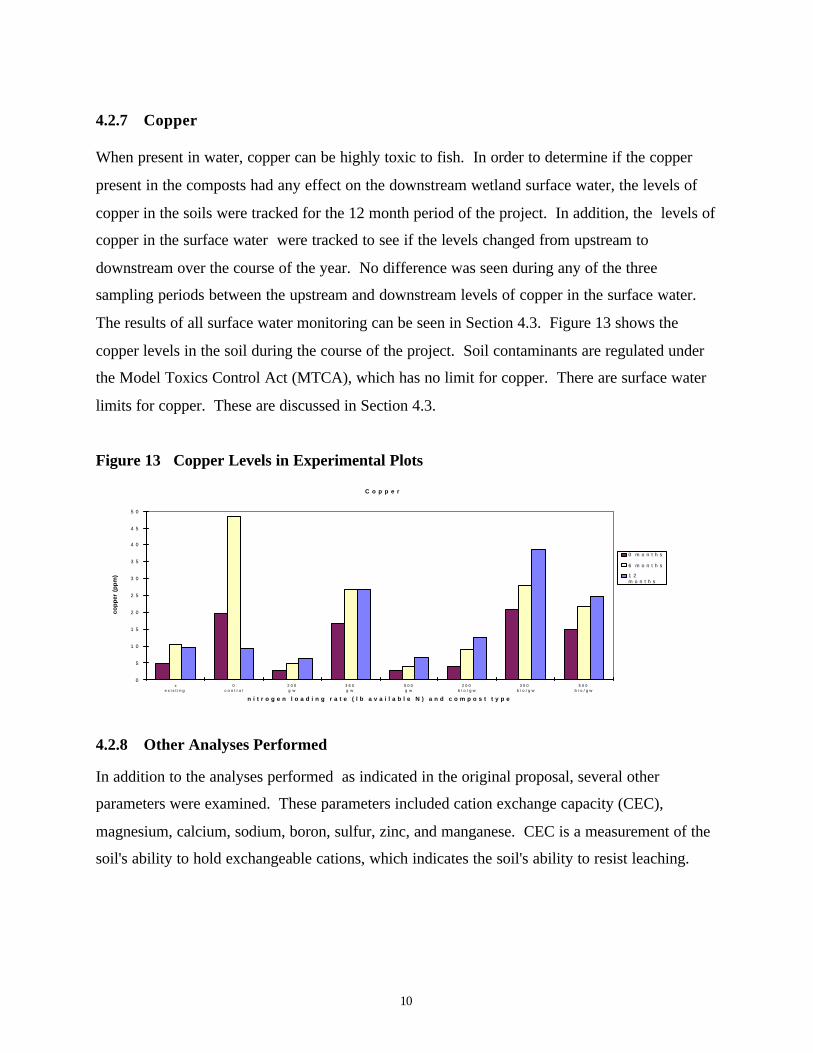
4.2.7 Copper
When present in water, copper can be highly toxic to fish. In order to determine if the copper
present in the composts had any effect on the downstream wetland surface water, the levels of
copper in the soils were tracked for the 12 month period of the project. In addition, the levels of
copper in the surface water were tracked to see if the levels changed from upstream to
downstream over the course of the year. No difference was seen during any of the three
sampling periods between the upstream and downstream levels of copper in the surface water.
The results of all surface water monitoring can be seen in Section 4.3. Figure 13 shows the
copper levels in the soil during the course of the project. Soil contaminants are regulated under
the Model Toxics Control Act (MTCA), which has no limit for copper. There are surface water
limits for copper. These are discussed in Section 4.3.
Figure 13 Copper Levels in Experimental Plots
C o p p e r
0
5
1 0
1 5
2 0
2 5
3 0
3 5
4 0
4 5
5 0
xe x i s t i n g
0c o n t r o l
2 0 0g w
3 5 0g w
5 0 0g w
2 0 0b i o / g w
3 5 0b i o / g w
5 0 0b i o / g w
n i t r o g e n l o a d i n g r a t e ( l b a v a i l a b l e N ) a n d c o m p o s t t y p e
cop
per
(p
pm
)
0 m o n t h s
6 m o n t h s
1 2m o n t h s
4.2.8 Other Analyses Performed
In addition to the analyses performed as indicated in the original proposal, several other
parameters were examined. These parameters included cation exchange capacity (CEC),
magnesium, calcium, sodium, boron, sulfur, zinc, and manganese. CEC is a measurement of the
soil's ability to hold exchangeable cations, which indicates the soil's ability to resist leaching.

11
Figure 14 shows CEC throughout the duration of the project. All experimental plots are slightly
less than the existing wetland soils, but all are also greater than the control plots except at 6
months. CEC is largely dependent upon the amount and type of clay present and the organic
matter content.
Figure 14 Cation Exchange Capacity
C a t i o n E x c h a n g e C a p a c i t y
0
2
4
6
8
1 0
1 2
1 4
1 6
xe x i s t i n g
0c o n t r o l
2 0 0g w
3 5 0g w
5 0 0g w
2 0 0b i o / g w
3 5 0b i o / g w
5 0 0b i o / g w
n i t r o g e n l o a d i n g r a t e ( l b s / a c r e a v a i l a b l e N ) a n d c o m p o s t t y p e
meq
/100
g
0 m o n t h s 6 m o n t h s 1 2 m o n t h s

12
The other parameters mentioned are all plant micronutrients. The results of the analyses for
these constituents can be seen in Table 8 below.
Table 8: Micronutrient Analyses
Plot N
lb/ac
Magnesium
0 6 12
Calcium
0 6 12
Sodium
0 6 12
Boron
0 6 12
exist x 166 135 421 2460 2910 1350 69 47 21 2 3 2
control 0 83 150 49 300 1535 500 46 30 12 3 3.5 1.5
gw 200 90 138 83 425 655 775 22 28 20 20 3 1.5
gw 350 93 119 101 375 725 855 15 23 15 14.5 3 1.5
gw 500 82 94 70 395 930 1335 26 21 12 19.5 4 1
bio/gw 200 82 125 81 460 825 960 21 25 13 16 3.5 1
bio/gw 350 90 146 74 380 820 1020 15 60 15 18.5 3.5 2
bio/gw 500 118 123 96 555 715 950 21 30 18 24 3 1.5
Table 8 continued
Plot N
lb/ac
Sulfur
0 6 12
Zinc
0 6 12
Manganese
0 6 12
exist x 176 6 17 21.7 56.5 27.4 33 20 30
control 0 6 110 11 5.9 148 423 3 27.5 4.5
gw 200 7 12 14 5.7 12.6 18.4 4 54.5 68.5
gw 350 9.5 9.5 12.5 13.4 17.9 27.8 3 24.5 27
gw 500 15 17.5 14 14.1 17.3 50.4 2.5 51.5 59
bio/gw 200 17 10 14 20.1 24.5 35 3 51 41.5
bio/gw 350 96 9 10.5 16 20.5 27.7 1.5 51 29
bio/gw 500 88.5 10.5 12.5 30.6 46.3 43.7 3 40 34
13
4.3 SURFACE WATER QUALITY
This project also examined the surface water quality both upstream and downstream of the
construction area to gain insight as to how the application of the compost may have changed
water quality. While compost was applied to most plots at agronomic rates, some plots were
overloaded to evaluate plant response at higher application rates. For the surface water quality
evaluation, the overloading allowed experimenters to look at potential trade-offs between plant
response from compost overloading and surface water quality.
The constituents examined were biochemical oxygen demand (BOD), conductivity, ammonia N,
nitrate/nitrite N, total phosphorus, pH, dissolved oxygen, and copper. Of particular interest were
the numbers for nitrate/nitrite and copper. Nitrate/nitrite is important because of the mobility of
nitrate in water, and copper because of its toxicity to fish.
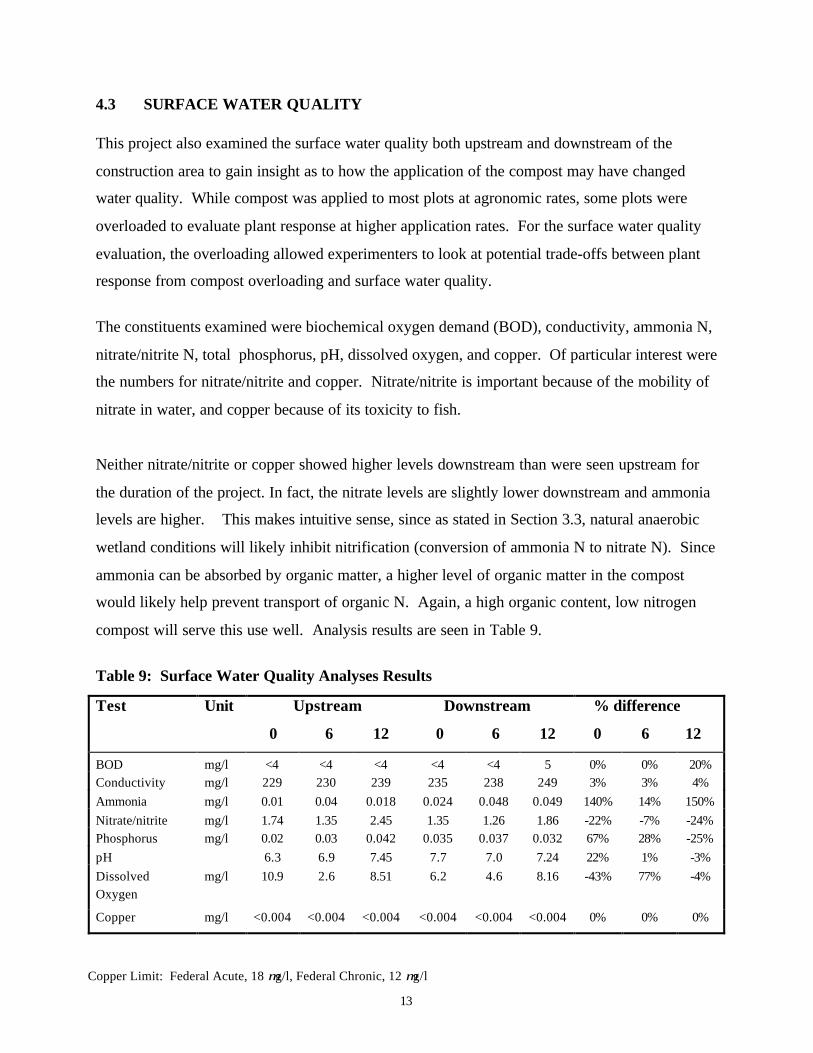
Neither nitrate/nitrite or copper showed higher levels downstream than were seen upstream for
the duration of the project. In fact, the nitrate levels are slightly lower downstream and ammonia
levels are higher. This makes intuitive sense, since as stated in Section 3.3, natural anaerobic
wetland conditions will likely inhibit nitrification (conversion of ammonia N to nitrate N). Since
ammonia can be absorbed by organic matter, a higher level of organic matter in the compost
would likely help prevent transport of organic N. Again, a high organic content, low nitrogen
compost will serve this use well. Analysis results are seen in Table 9.
Table 9: Surface Water Quality Analyses Results
Test Unit Upstream
0 6 12
Downstream
0 6 12
% difference
0 6 12
BOD mg/l <4 <4 <4 <4 <4 5 0% 0% 20%Conductivity mg/l 229 230 239 235 238 249 3% 3% 4%Ammonia mg/l 0.01 0.04 0.018 0.024 0.048 0.049 140% 14% 150%Nitrate/nitrite mg/l 1.74 1.35 2.45 1.35 1.26 1.86 -22% -7% -24%Phosphorus mg/l 0.02 0.03 0.042 0.035 0.037 0.032 67% 28% -25%pH 6.3 6.9 7.45 7.7 7.0 7.24 22% 1% -3%DissolvedOxygen
mg/l 10.9 2.6 8.51 6.2 4.6 8.16 -43% 77% -4%
Copper mg/l <0.004 <0.004 <0.004 <0.004 <0.004 <0.004 0% 0% 0%
Copper Limit: Federal Acute, 18 µg/l, Federal Chronic, 12 µg/l
14
4.4 WILDLIFE OBSERVATIONS
The area is home to many species of animals. The casual observations of the consultant on
several trips to the site include the following birds. This list is not a comprehensive biological
inventory.
• Belted kingfisher
• Red tailed hawk
• Great blue heron
• American goldfinch
• Virgina rail
• Sand piper
• Osprey
• Northern flicker
In addition, small fish fry were observed in the upstream, downstream, and restored wetlands.
Identification of the species was not accomplished. Evidence of deer has been sighted and
beaver activity in the area is also heavy.
15
5.0 GUIDELINE FOR USE OF COMPOST IN WETLAND RESTORATION
5.1 TYPE OF COMPOST
These guidelines are based on the experimental design and results. As mentioned, and shown in
the design, some plots were overloaded with compost (greater than agronomic need). The results
for survival rate and growth did not indicate that these plots were more successful. This
information should discourage overloading and therefore help prevent higher levels of
nitrate/nitrite in the surface water.
The compost selected should feature the following characteristics:
• A high organic content
• Low nitrogen content
• Highly stable and mature
It is important to try to match the organic content of the compost to the wetland's organic
content. Wetland soils are traditionally high in organic content, and any restoration or
construction effort will require a substrate mixture which is highly organic. In addition, the
compost should be low in nitrogen content, since the nitrogen will be the limiting factor of the
application. A lower nitrogen-content compost will allow for a higher application rate, thereby
increasing the organic content of the mix. This is, of course, dependent upon the analysis of the
surrounding wetland soils. Typically, though, this will be the case. Nitrogen content should be
less than 20,000 ppm (2% N on dry weight basis) and organic content should be at or above 15 to
20%.
It is also important to investigate the stability of a product. An unstable product is a compost
which has not degraded all of its carbon content. This condition can lead to an incorporated
material actually robbing nitrogen from the surrounding soils for the available carbon. The use
of this material would be detrimental to the target species, as the invaders are better suited to
adapt to the nitrogen-poor soil. Therefore, the likelihood of failure is greater with the use of an
unstable compost. Compost stability is determined by sight, smell, and lab analysis. The Clean
16
Washington Center published a report on field determination of compost stability, which may be
of use in choosing a material. This report can be obtained through the Clean Washington Center.
Please see the title page of this report for ordering information. Lab analysis of the material can
quantify the stability of the compost by measuring the CO2 respiration rate. The rate of CO2
production calculated on the organic fraction determines the stability of the compost and
measures the predicted change during use due to continued decomposition. Lab analysis
includes an analysis of the compost with data interpretation, and an estimate of the stability of
the product.
5.2 REQUIRED ANALYSES
The materials to be used in the project and the surrounding wetland substrate should be tested for
the following parameters:
• Organic matter
• Solids content
• Total kjeldahl nitrogen
• Soluble salts (conductivity)
• pH
These analyses will be used to best mix the compost with a native organic soil in order to match
the analyses of the existing substrate. The following is an example of how this can be
accomplished. The data for the existing soils is for example purposes only, and any calculations
will be site-specific. The plant nutrient uptake data is also based upon actual data, but the
example is not site-specific.
17
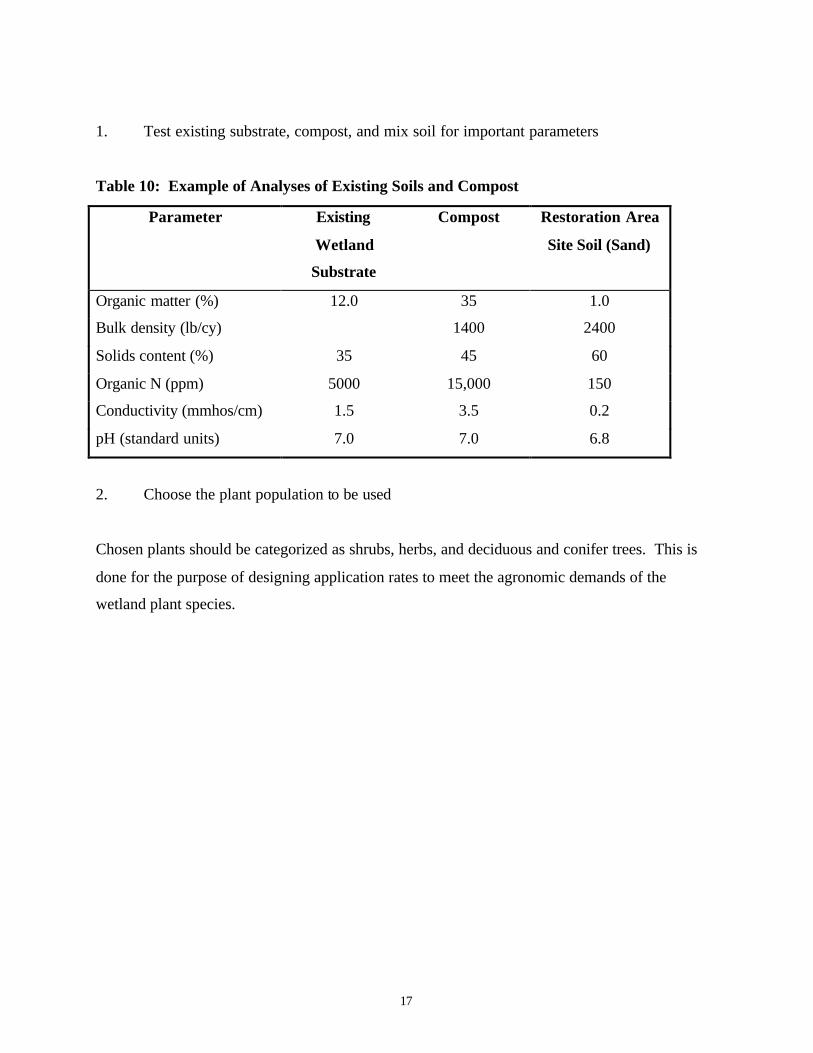
1. Test existing substrate, compost, and mix soil for important parameters
Table 10: Example of Analyses of Existing Soils and Compost
Parameter Existing
Wetland
Substrate
Compost Restoration Area
Site Soil (Sand)
Organic matter (%) 12.0 35 1.0
Bulk density (lb/cy) 1400 2400
Solids content (%) 35 45 60
Organic N (ppm) 5000 15,000 150
Conductivity (mmhos/cm) 1.5 3.5 0.2
pH (standard units) 7.0 7.0 6.8
2. Choose the plant population to be used
Chosen plants should be categorized as shrubs, herbs, and deciduous and conifer trees. This is
done for the purpose of designing application rates to meet the agronomic demands of the
wetland plant species.
18
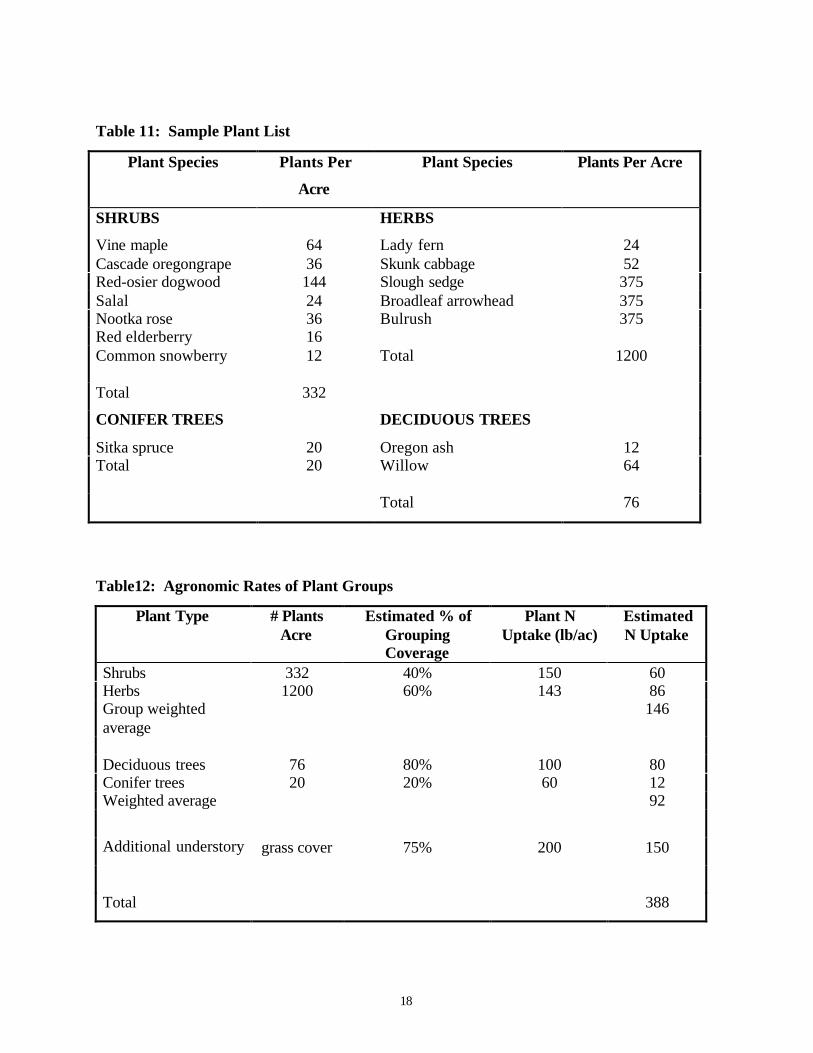
Table 11: Sample Plant List
Plant Species Plants Per
Acre
Plant Species Plants Per Acre
SHRUBS HERBS
Vine maple 64 Lady fern 24Cascade oregongrape 36 Skunk cabbage 52Red-osier dogwood 144 Slough sedge 375Salal 24 Broadleaf arrowhead 375Nootka rose 36 Bulrush 375Red elderberry 16Common snowberry 12 Total 1200
Total 332
CONIFER TREES DECIDUOUS TREES
Sitka spruce 20 Oregon ash 12Total 20 Willow 64
Total 76
Table12: Agronomic Rates of Plant Groups
Plant Type # PlantsAcre
Estimated % ofGroupingCoverage
Plant NUptake (lb/ac)
EstimatedN Uptake
Shrubs 332 40% 150 60Herbs 1200 60% 143 86Group weightedaverage
146
Deciduous trees 76 80% 100 80Conifer trees 20 20% 60 12Weighted average 92
Additional understory grass cover 75% 200 150
Total 388
19
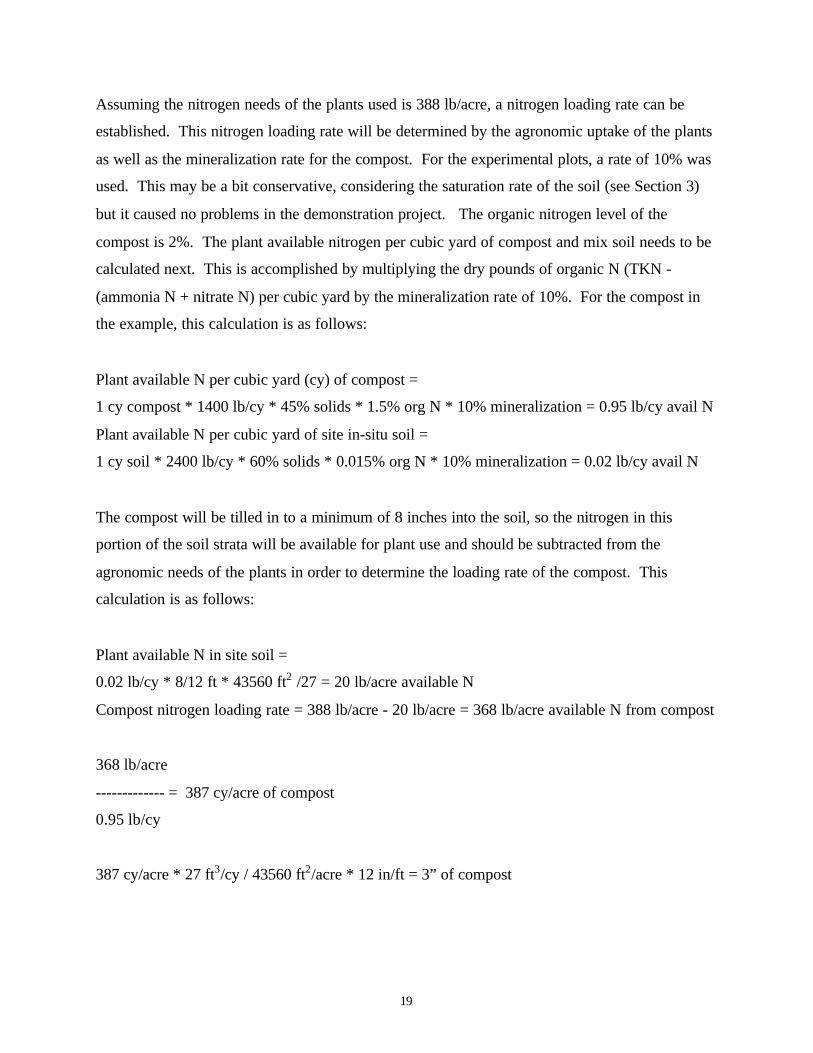
Assuming the nitrogen needs of the plants used is 388 lb/acre, a nitrogen loading rate can be
established. This nitrogen loading rate will be determined by the agronomic uptake of the plants
as well as the mineralization rate for the compost. For the experimental plots, a rate of 10% was
used. This may be a bit conservative, considering the saturation rate of the soil (see Section 3)
but it caused no problems in the demonstration project. The organic nitrogen level of the
compost is 2%. The plant available nitrogen per cubic yard of compost and mix soil needs to be
calculated next. This is accomplished by multiplying the dry pounds of organic N (TKN -
(ammonia N + nitrate N) per cubic yard by the mineralization rate of 10%. For the compost in
the example, this calculation is as follows:
Plant available N per cubic yard (cy) of compost =
1 cy compost * 1400 lb/cy * 45% solids * 1.5% org N * 10% mineralization = 0.95 lb/cy avail N
Plant available N per cubic yard of site in-situ soil =
1 cy soil * 2400 lb/cy * 60% solids * 0.015% org N * 10% mineralization = 0.02 lb/cy avail N
The compost will be tilled in to a minimum of 8 inches into the soil, so the nitrogen in this
portion of the soil strata will be available for plant use and should be subtracted from the
agronomic needs of the plants in order to determine the loading rate of the compost. This
calculation is as follows:
Plant available N in site soil =
0.02 lb/cy * 8/12 ft * 43560 ft2 /27 = 20 lb/acre available N
Compost nitrogen loading rate = 388 lb/acre - 20 lb/acre = 368 lb/acre available N from compost
368 lb/acre
------------- = 387 cy/acre of compost
0.95 lb/cy
387 cy/acre * 27 ft3/cy / 43560 ft2/acre * 12 in/ft = 3” of compost
20
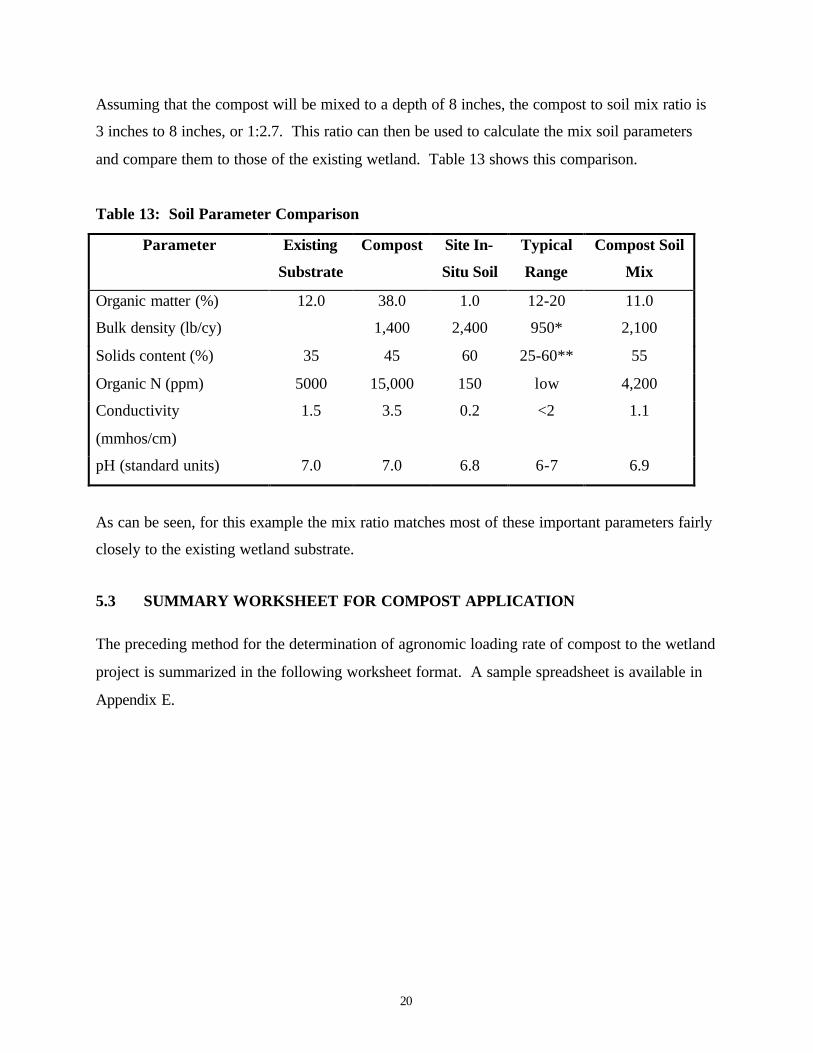
Assuming that the compost will be mixed to a depth of 8 inches, the compost to soil mix ratio is
3 inches to 8 inches, or 1:2.7. This ratio can then be used to calculate the mix soil parameters
and compare them to those of the existing wetland. Table 13 shows this comparison.
Table 13: Soil Parameter Comparison
Parameter Existing
Substrate
Compost Site In-
Situ Soil
Typical
Range
Compost Soil
Mix
Organic matter (%) 12.0 38.0 1.0 12-20 11.0
Bulk density (lb/cy) 1,400 2,400 950* 2,100
Solids content (%) 35 45 60 25-60** 55
Organic N (ppm) 5000 15,000 150 low 4,200
Conductivity
(mmhos/cm)
1.5 3.5 0.2 <2 1.1
pH (standard units) 7.0 7.0 6.8 6-7 6.9
As can be seen, for this example the mix ratio matches most of these important parameters fairly
closely to the existing wetland substrate.
5.3 SUMMARY WORKSHEET FOR COMPOST APPLICATION
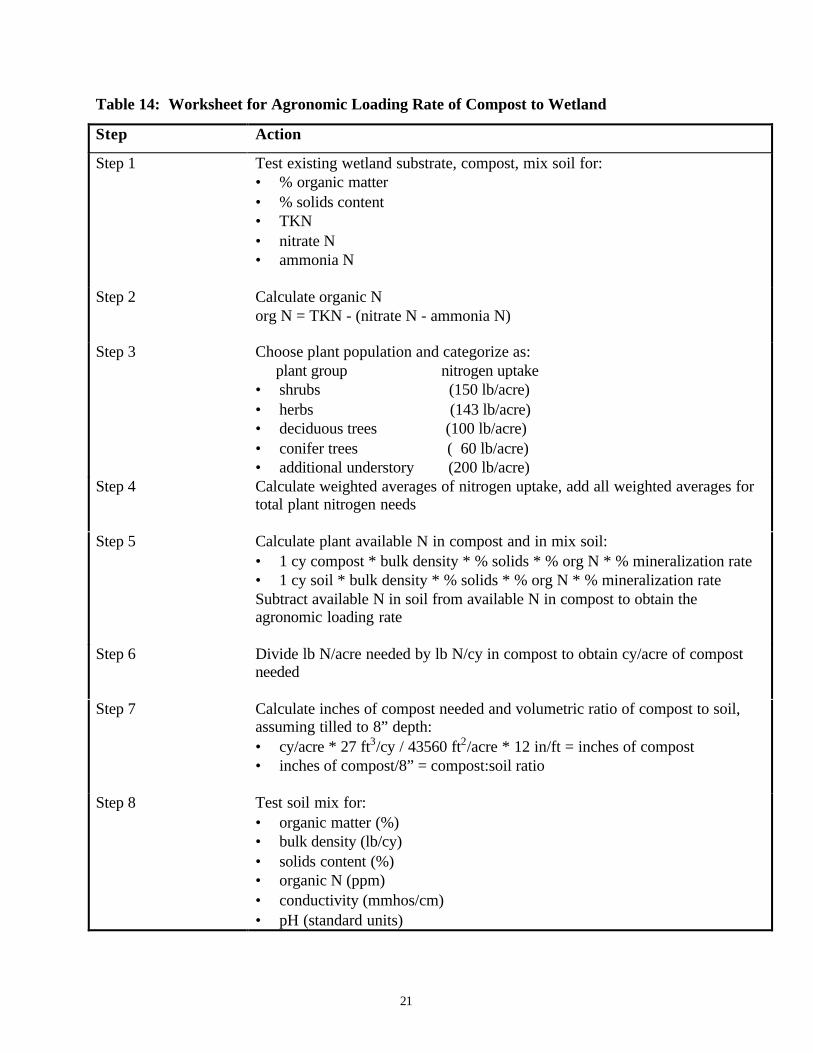
The preceding method for the determination of agronomic loading rate of compost to the wetland
project is summarized in the following worksheet format. A sample spreadsheet is available in
Appendix E.
21
Table 14: Worksheet for Agronomic Loading Rate of Compost to Wetland
Step Action
Step 1 Test existing wetland substrate, compost, mix soil for:• % organic matter• % solids content• TKN• nitrate N• ammonia N
Step 2 Calculate organic Norg N = TKN - (nitrate N - ammonia N)
Step 3 Choose plant population and categorize as: plant group nitrogen uptake• shrubs (150 lb/acre)• herbs (143 lb/acre)• deciduous trees (100 lb/acre)• conifer trees ( 60 lb/acre)• additional understory (200 lb/acre)
Step 4 Calculate weighted averages of nitrogen uptake, add all weighted averages fortotal plant nitrogen needs
Step 5 Calculate plant available N in compost and in mix soil:• 1 cy compost * bulk density * % solids * % org N * % mineralization rate• 1 cy soil * bulk density * % solids * % org N * % mineralization rateSubtract available N in soil from available N in compost to obtain theagronomic loading rate
Step 6 Divide lb N/acre needed by lb N/cy in compost to obtain cy/acre of compostneeded
Step 7 Calculate inches of compost needed and volumetric ratio of compost to soil,assuming tilled to 8” depth:• cy/acre * 27 ft3/cy / 43560 ft2/acre * 12 in/ft = inches of compost• inches of compost/8” = compost:soil ratio
Step 8 Test soil mix for:• organic matter (%)• bulk density (lb/cy)• solids content (%)• organic N (ppm)• conductivity (mmhos/cm)• pH (standard units)
22
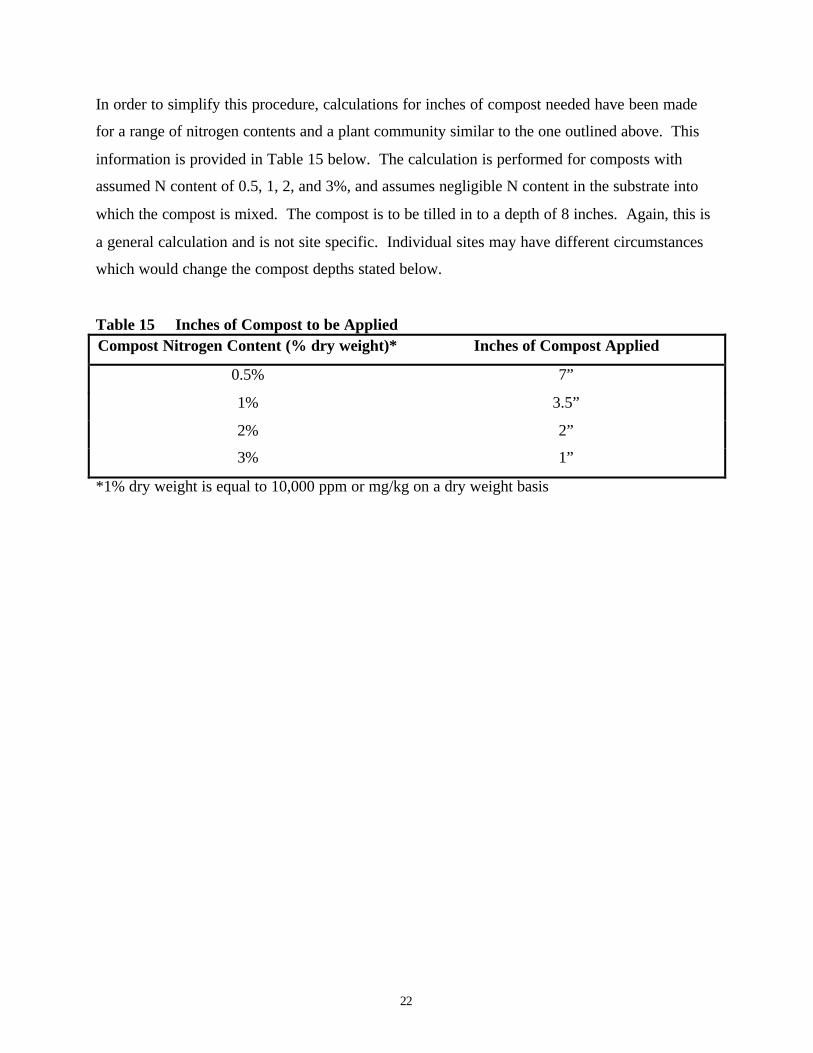
In order to simplify this procedure, calculations for inches of compost needed have been made
for a range of nitrogen contents and a plant community similar to the one outlined above. This
information is provided in Table 15 below. The calculation is performed for composts with
assumed N content of 0.5, 1, 2, and 3%, and assumes negligible N content in the substrate into
which the compost is mixed. The compost is to be tilled in to a depth of 8 inches. Again, this is
a general calculation and is not site specific. Individual sites may have different circumstances
which would change the compost depths stated below.
Table 15 Inches of Compost to be AppliedCompost Nitrogen Content (% dry weight)* Inches of Compost Applied
0.5% 7”
1% 3.5”
2% 2”
3% 1”
*1% dry weight is equal to 10,000 ppm or mg/kg on a dry weight basis

23
6.0 INFORMATION DISSEMINATION EFFORTS
E&A presented project design information and results at several conferences during 1995. In
addition, an article was written for Biocycle magazine on the design concepts for the
experimental plots. The magazine has expressed interest in having a follow-up article written
when this report is completed. The original article appeared in the January 1996 issue. The
conferences during which results were presented are outlined in Table 16.
Table 16: Conference Attendance and Information Dissemination
Conferences, Site Tours, Publications Location Date
Washington State Recycling Association Annual Conference Spokane, WA 4/95
Northwest Biosolids Management Association Conference Silverdale, WA 9/95
Water Environment Federation Annual Conference Miami, FL 10/95
Biocycle West Coast Conference Seattle, WA 3/96
Site tours for:
Cowlitz County
Seattle Metro
GroCo Compost
University of Washington
Site
Site
Site
Site
7/95
7/95
7/95
11/95

24
7.0 ACKNOWLEDGMENTS
The author would like to acknowledge the commitment of the ReTAP program to expanding the
market for recycled goods. ReTAP is a program of the Clean Washington Center, Washington
State’s lead agency of the market development of recycled materials. ReTAP is an affiliate of
the national Manufacturing Extension Partnership (MEP), a program of the U.S. Commerce
Department’s National Institute of Standards and Technology. The MEP is a growing
nationwide network of extension services to help smaller U.S. Manufacturers improve their
performance and become more competitive. ReTAP is also sponsored by the U.S.
Environmental Protection Agency and the American Plastics Council.
In addition, the author would like to acknowledge the assistance of:
• Andy Castelle at Adolfson Associates, Inc. for his expert knowledge of Washington
wetland plants and conditions.
• Dan Thompson of the City of Everett for his enthusiasm and commitment to the
completion of this project, and for canvassing the neighborhood soliciting support for the
concept.
• The citizens of the Lowell Neighborhood Civic Group, for attending evening meetings,
strongly supporting the project to the City of Everett officials, and for helping with the
planting of the area.
• Melanie Jordan-Hecla of Phoenix Composting for supplying compost for the majority of
the restoration area.
25
BIBLIOGRAPHY
Clean Washington Center. 1993. Compost Utilization in Wetland Restoration. Report NumberE1
EPA Sludge Land Application Report
EPA. 1983. Process Design Manual - Land Application of Municipal Sludge. EPA-625/1-83-016. Cincinnati, OH.
EPA. 1978. Sludge Treatment and Disposal, Sludge Disposal, Volume 2. EPA-625/4-78-012.Cincinnati, Ohio
Hammer, Donald C. 1989. Constructed Wetlands for Wastewater Treatment, Lewis Publishers,Inc., Chelsea, Michigan
Linden, Clapp, Dowdy. Hydrologic and Nutrient Management Aspects of MunicipalWastewater and Sludge Utilization on Land. USDA-ARS, Minnesota Agricultural ExperimentalStation, Paper No. 1851.
McCain, Dan. 1994. Storm Lake Growers. Personal Communication.
Patrick, W. H. 1982. Nitrogen Transformations in Submerged Soils. ASA-CSSA-SSSA,Nitrogen in Agricultural Soils - Agronomy Monograph no. 22.
Peot, C. and Thompson, D. Compost Use in Wetland Restoration. BioCycle, January 1996
Reddy, K.R., Patrick, W.H. 1984. Nitrogen Transformations and Loss in Flooded Soils andSediments. CRC Critical Reviews in Environmental Control. Volume 13, Issue 4.
Robert M. Devlin. 1966. Plant Physiology. Reinhold Publishing Corporation. New York, NewYork.
Washington State Department of Ecology. 1993. Guidelines for Wetland Restoration.Publication #93-17
Washington State Department of Ecology. 1993. Biosolids Management Guidelines (draft) forWashington State. Publication Number 93-80
A-1
APPENDIX A
GROWTH AND PLANT SUVIVAL RATE SPREADSHEETS
(Not included in this electronic file but available upon request)

A-2
APPENDIX B
LABORATORY RESULTS
(Not included in this electronic file but available upon request)

A-3
APPENDIX C
SITE DRAWINGS
(Not included in this electronic file but available upon request)
A-4
APPENDIX D
WETLAND SPECIES SUITABLE TO WESTERN WASHINGTON
(Not included in this electronic file but available upon request)

A-5
APPENDIX E
WORKSHEET FOR AGRONOMIC LOADING RATE OF COMPOST TO WETLANDS
(Not included in this electronic file but available upon request)