composite indicator at variable geometry in cohesion analysis · composite indicator at variable...
TRANSCRIPT
Composite indicator at variable geometry in cohesion analysis
Marta Kuc @kuc_martaFaculty of Management and Economics,
Gdansk University of Technology
Andrea Saltelli @AndreaSaltelliCentre for the Study of the Sciences and the Humanities,
University of Bergen
European Conference on Data Analysis 2017September 27th to 29th 2017, University of
Economics, Wroclaw, Poland

Where to find this talk: www.andreasaltelli.eu

Is a theory for composite indicators possible?
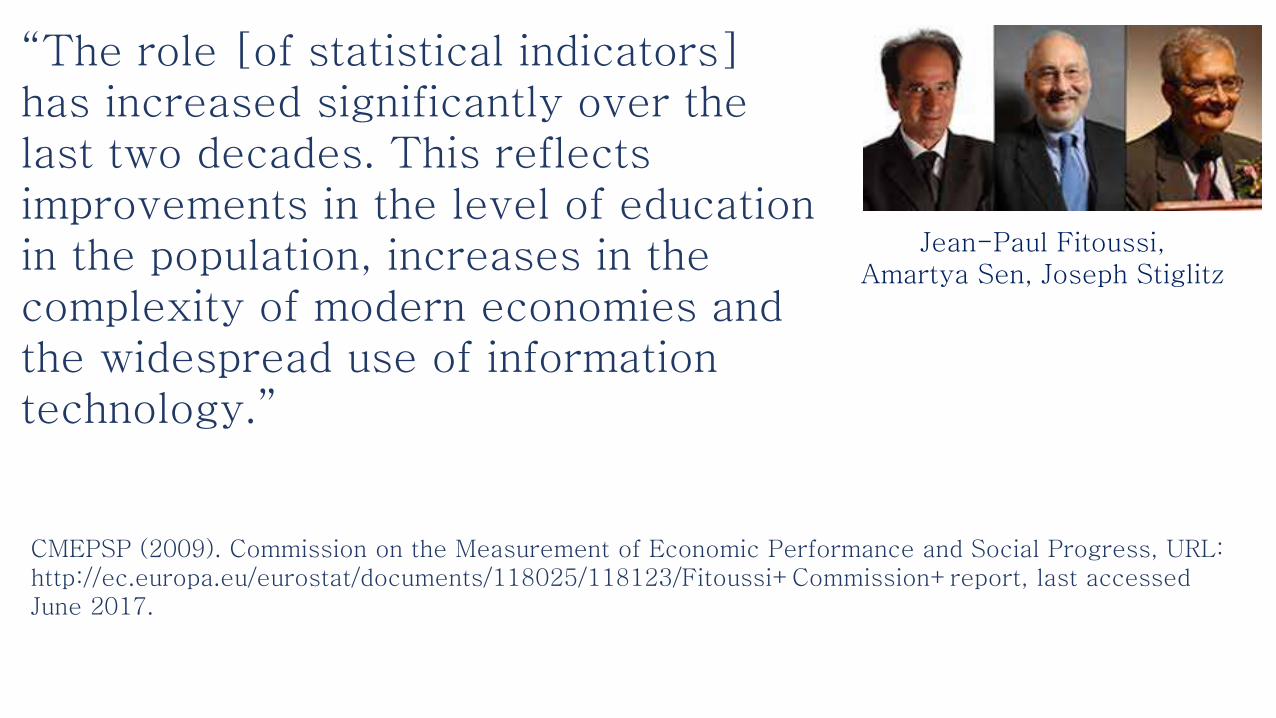
“The role [of statistical indicators] has increased significantly over the last two decades. This reflects improvements in the level of education in the population, increases in the complexity of modern economies and the widespread use of information technology.”
Jean-Paul Fitoussi, Amartya Sen, Joseph Stiglitz
CMEPSP (2009). Commission on the Measurement of Economic Performance and Social Progress, URL: http://ec.europa.eu/eurostat/documents/118025/118123/Fitoussi+Commission+report, last accessed June 2017.

CI as boundary objects, between analysis and advocacy
CI as instruments in a changing styles of governance of knowledge for policy; of democratization of expertise; of social discovery (John Dewey); the semiotic of CI’s (Charles Sanders Peirce)
Paul-Marie Boulanger, 2014, Elements for a comprehensive assessment of public indicators, Report EUR 26921 EN. http://publications.jrc.ec.europa.eu/repository/bitstream/JRC92162/lbna26921enn.pdf
Paul-Marie Boulanger

A triadic conception of the sign as structure connecting three elements: the sign properly said (S), an object (O) and an “interpretant”(I). But an example is needed …
Charles Sanders Peirce, the father of semiotics

“This monkey possess a sophisticated repertory of vocal signs for signaling the presence of a predator [distinguishing a] terrestrial stalking one such as a leopard, an aerial raptor such as an eagle or a ground predator such as a snake.”
Paul-Marie Boulanger, 2014, Elements for a comprehensive assessment of public indicators, Report EUR 26921 EN. http://publications.jrc.ec.europa.eu/repository/bitstream/JRC92162/lbna26921enn.pdf
African vervet monkey (Cercopithecus aethiops)
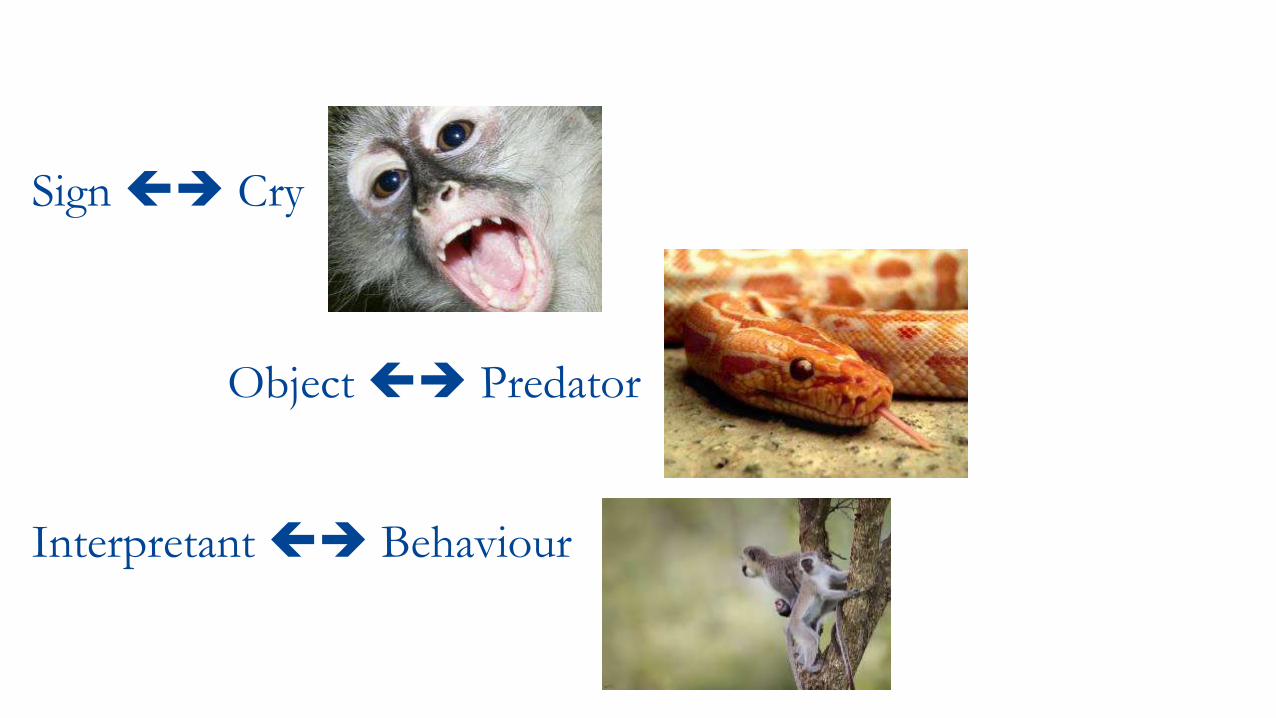
Sign Cry
Object Predator
Interpretant Behaviour
CI as instrumental to the creation of a new public, through a process of social discovery (J. Dewey)
Why are ‘social discoveries’ needed?
Because there are ‘publics’ affected by transaction taking place somewhere else. “[…] machine age has so enormously expanded, multiplied, intensified and complicated the scope of the indirect consequences […] that the resultant public cannot identify and distinguish itself.”
Dewey, J., 1938. The Public and its Problems, Read Book Ltd. Edition, 2013.

Social facts – unlike physical facts, are only meaningful in a context of desired ends
Peirce’s interpretant
From J. Dewey ‘Social Science and Social Control’ in John Dewey: The Later Works, 1925-1953: 1931-1932, Vol. 6-ExLibrary,

Paul-Marie Boulanger, 2014, Elements for a comprehensive assessment of public indicators, Report EUR 26921 EN. http://publications.jrc.ec.europa.eu/repository/bitstream/JRC92162/lbna26921enn.pdf
Building a composite indicator can be seen as a process of social discovery for which a model of extended participation comes natural
Frames and indicators are co-produced in the process which must be designed as to have a meaningful ‘interpretant’, or ‘end-in-sight’
Ubiquity of composite indicators
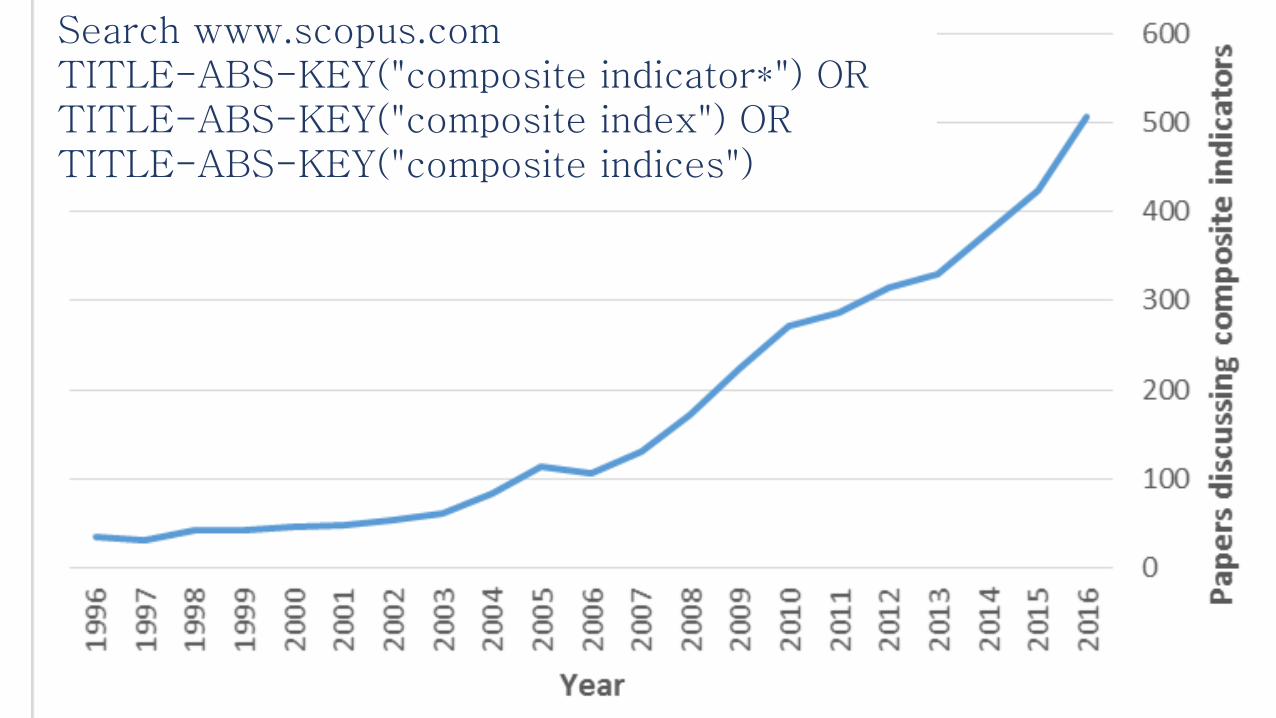
Search www.scopus.com TITLE-ABS-KEY("composite indicator*") OR TITLE-ABS-KEY("composite index") OR TITLE-ABS-KEY("composite indices")

Critique of composite indicators

“a general criticism … frequently addressed at composite indicators, i.e. the arbitrary character of the procedures used to weight their various components ... an aggregation procedure always means putting relative values on the items that are introduced in the index ...
Jean-Paul Fitoussi, Amartya Sen, Joseph Stiglitz
CMEPSP (2009). Commission on the Measurement of Economic Performance and Social Progress, URL: http://ec.europa.eu/eurostat/documents/118025/118123/Fitoussi+Commission+report, last accessed June 2017.

“The problem is not that these weighting procedures are hidden, non-transparent or non-replicable – they are often very explicitly presented by the authors of the indices, andthis is one of the strengths of this literature. The problem is rather that their normative implications are seldom made explicit or justified.
Jean-Paul Fitoussi, Amartya Sen, Joseph Stiglitz
CMEPSP (2009). Commission on the Measurement of Economic Performance and Social Progress, URL: http://ec.europa.eu/eurostat/documents/118025/118123/Fitoussi+Commission+report, last accessed June 2017.

The problem is not the non-neutrality of a measure but its purported neutrality (R. Pielke’s Jr ‘stealth advocacy’)
Roger A. Pielke, Jr., 2007, The honest broker, Cambridge University Press
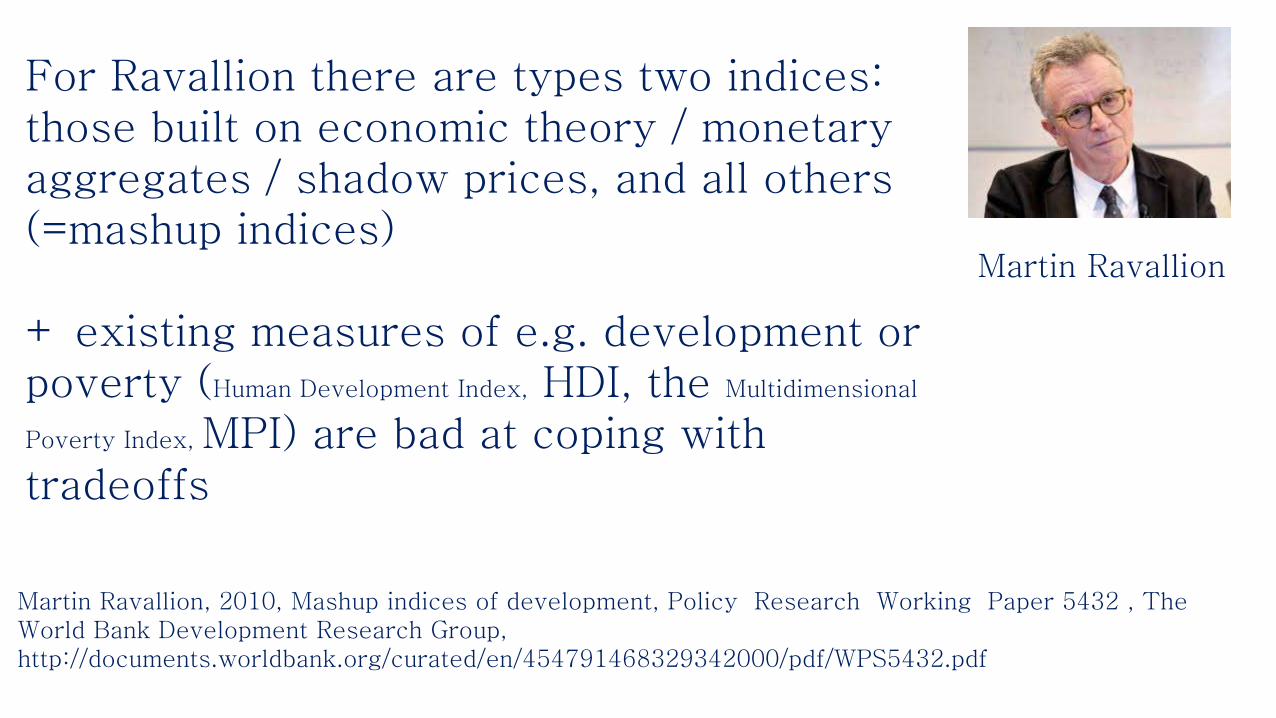
For Ravallion there are types two indices: those built on economic theory / monetary aggregates / shadow prices, and all others (=mashup indices)
+ existing measures of e.g. development or poverty (Human Development Index, HDI, the Multidimensional
Poverty Index, MPI) are bad at coping with tradeoffs
Martin Ravallion
Martin Ravallion, 2010, Mashup indices of development, Policy Research Working Paper 5432 , The World Bank Development Research Group, http://documents.worldbank.org/curated/en/454791468329342000/pdf/WPS5432.pdf
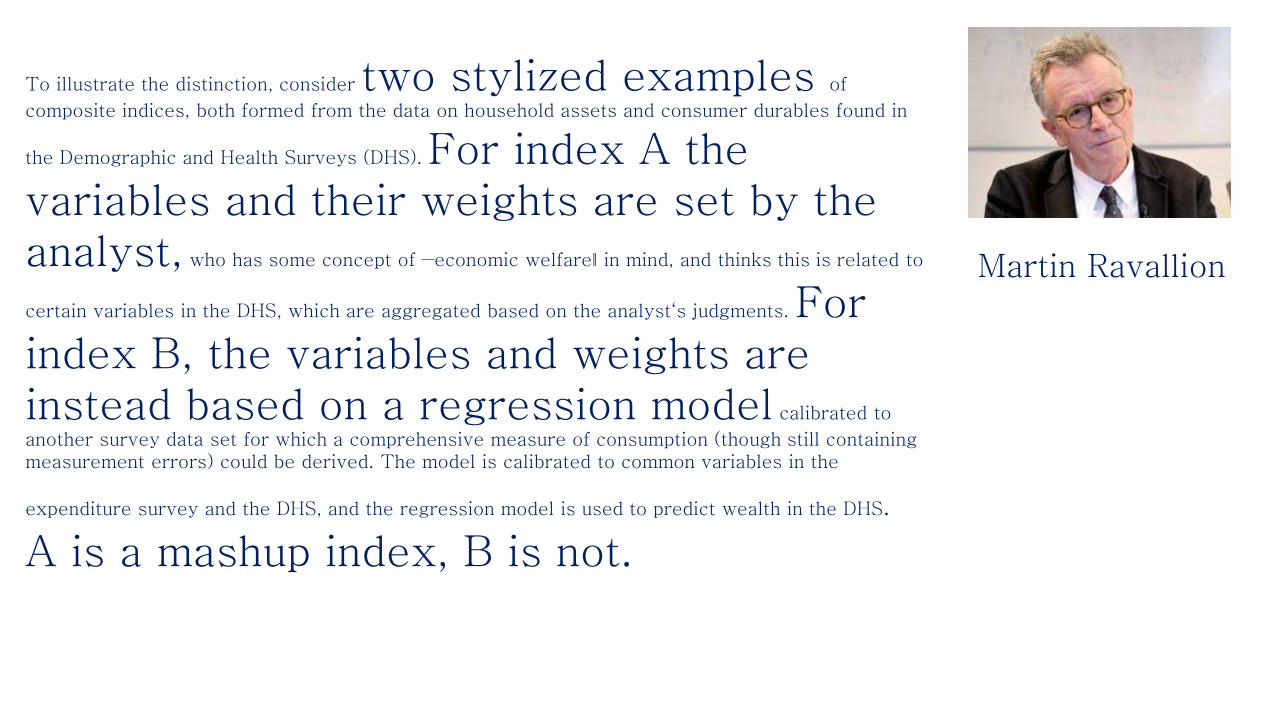
To illustrate the distinction, consider two stylized examples of
composite indices, both formed from the data on household assets and consumer durables found in
the Demographic and Health Surveys (DHS). For index A the variables and their weights are set by the analyst, who has some concept of ―economic welfare‖ in mind, and thinks this is related to
certain variables in the DHS, which are aggregated based on the analyst‘s judgments. For index B, the variables and weights are instead based on a regression model calibrated to
another survey data set for which a comprehensive measure of consumption (though still containing measurement errors) could be derived. The model is calibrated to common variables in the
expenditure survey and the DHS, and the regression model is used to predict wealth in the DHS.
A is a mashup index, B is not.
Martin Ravallion
Economics theory is not always helpful
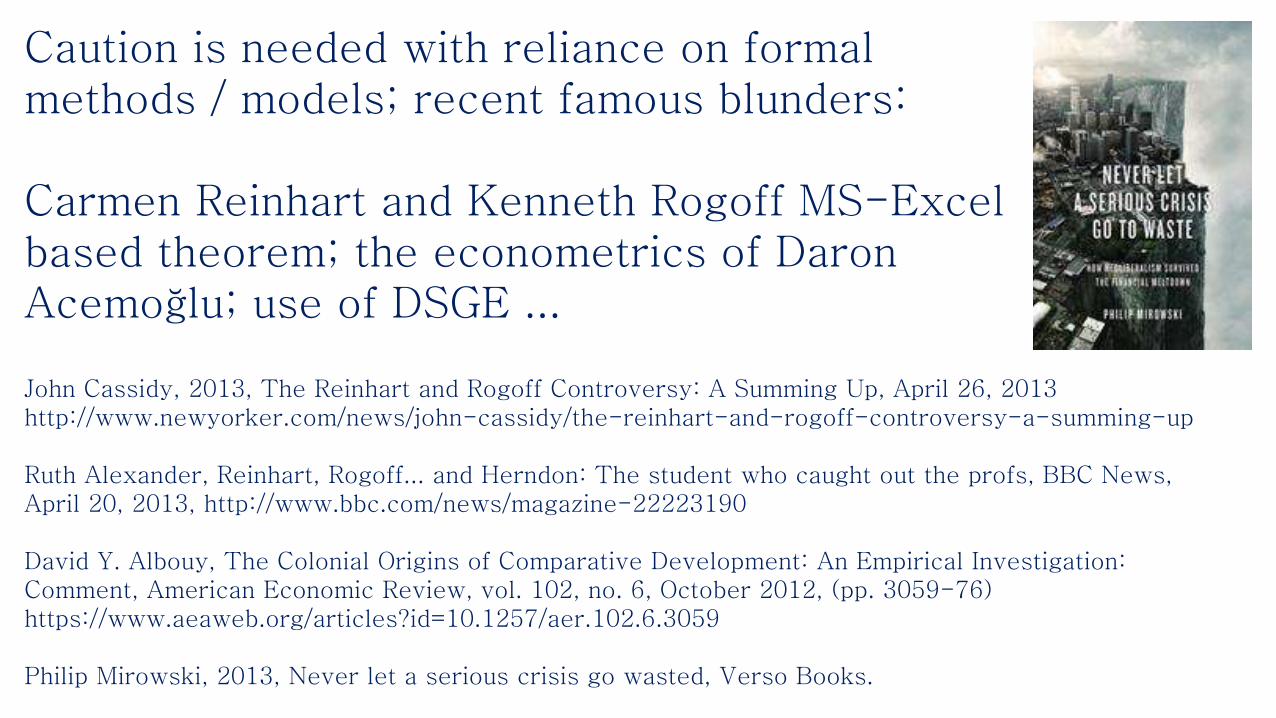
John Cassidy, 2013, The Reinhart and Rogoff Controversy: A Summing Up, April 26, 2013http://www.newyorker.com/news/john-cassidy/the-reinhart-and-rogoff-controversy-a-summing-up
Ruth Alexander, Reinhart, Rogoff... and Herndon: The student who caught out the profs, BBC News, April 20, 2013, http://www.bbc.com/news/magazine-22223190
David Y. Albouy, The Colonial Origins of Comparative Development: An Empirical Investigation: Comment, American Economic Review, vol. 102, no. 6, October 2012, (pp. 3059-76) https://www.aeaweb.org/articles?id=10.1257/aer.102.6.3059
Philip Mirowski, 2013, Never let a serious crisis go wasted, Verso Books.
Caution is needed with reliance on formal methods / models; recent famous blunders:
Carmen Reinhart and Kenneth Rogoff MS-Excel based theorem; the econometrics of DaronAcemoğlu; use of DSGE ...
Since composite indicators are here to stay …
Better try to built them with a theory
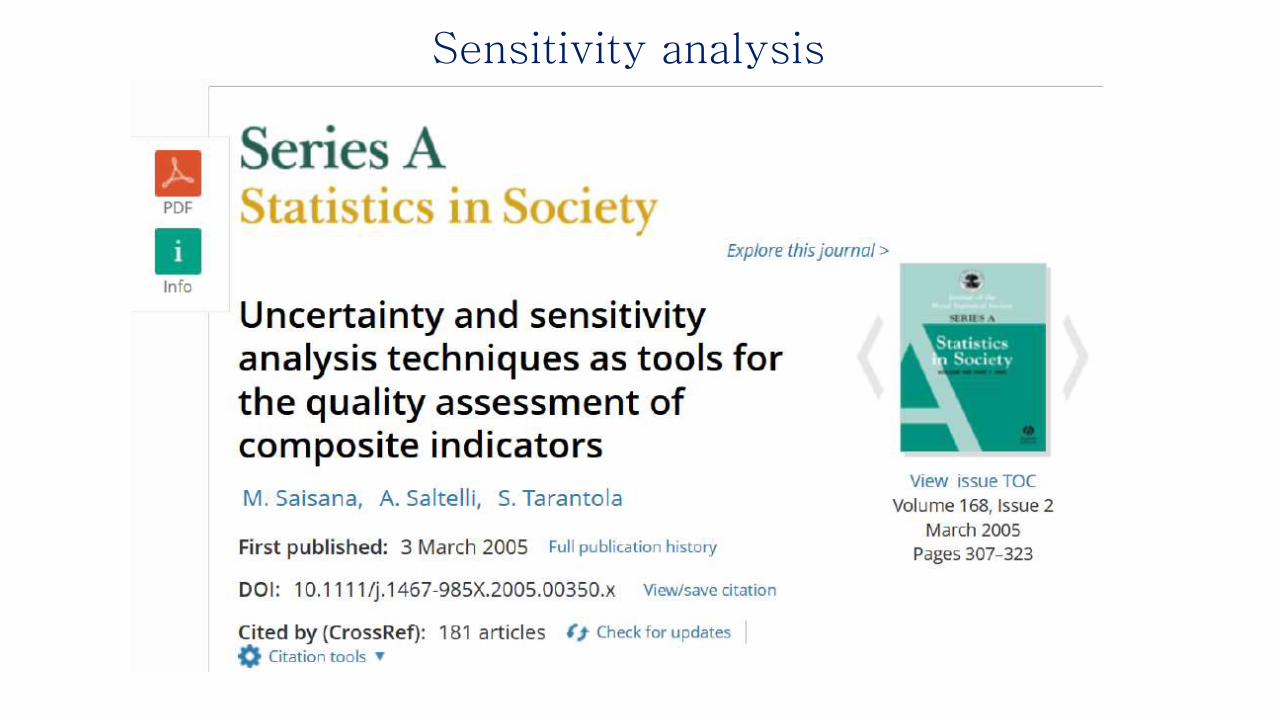
Sensitivity analysis
CI problematic just because of weights?
Sources of arbitrariety: What to include, what to exclude How to organize the dimensions
How to populate dimensions with indicators …

Examples
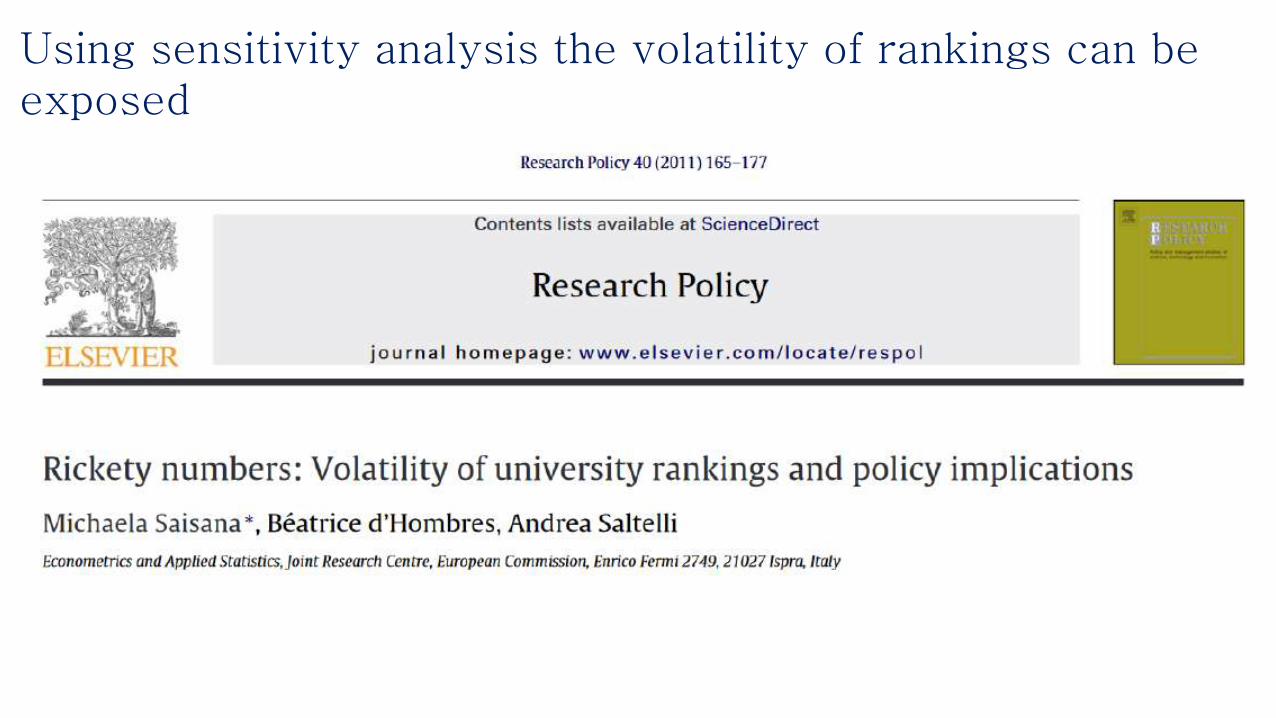
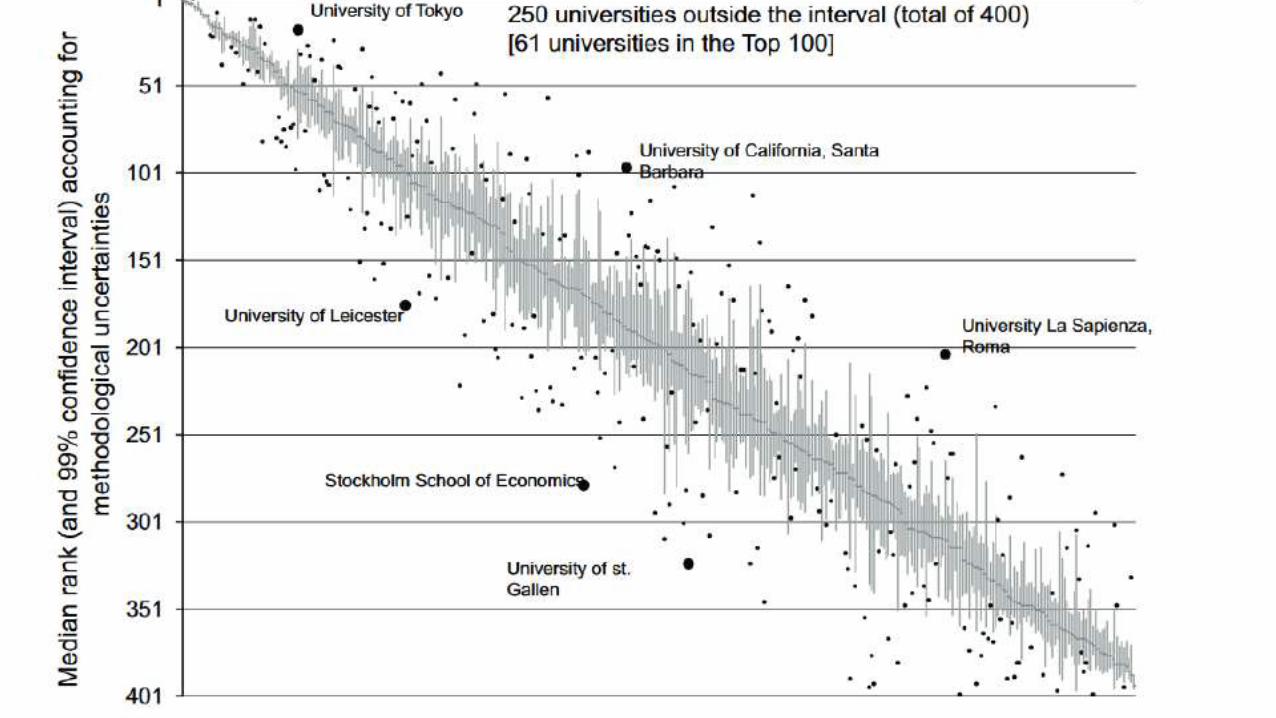
Using sensitivity analysis the volatility of rankings can be exposed

One can test whether assigned weights correspond to real importance
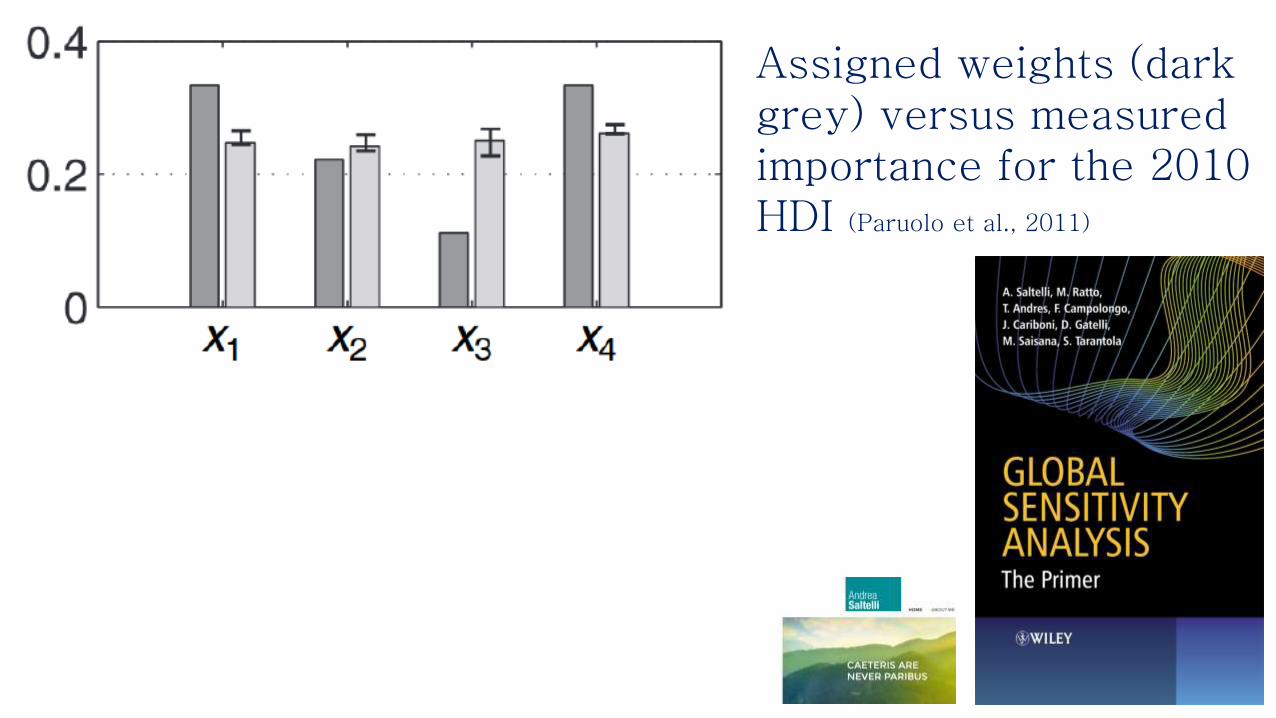
Assigned weights (dark grey) versus measured importance for the 2010 HDI (Paruolo et al., 2011)

A CI corresponds to a fixed framing but this maybe be undesirable when different constituencies are affected
Thus a CI can be deconstructed CI need to be build keeping the possibility of deconstruction in mind, hence internalizing the multiplicity of frames
Araujo, L., Saltelli, A. & Schnepf, S. V. Do PISA data justify PISA-based education policy? Int. J. Comp. Educ. Dev. 19, 20–34 (2017).
More deconstructions:http://www.andreasaltelli.eu/file/repository/Saltelli_Bergen_September2017_Methods.pdf


A condensed version of the article
An example in the making: cohesion policy

Composite indicators for cohesion policy?
A work in progress
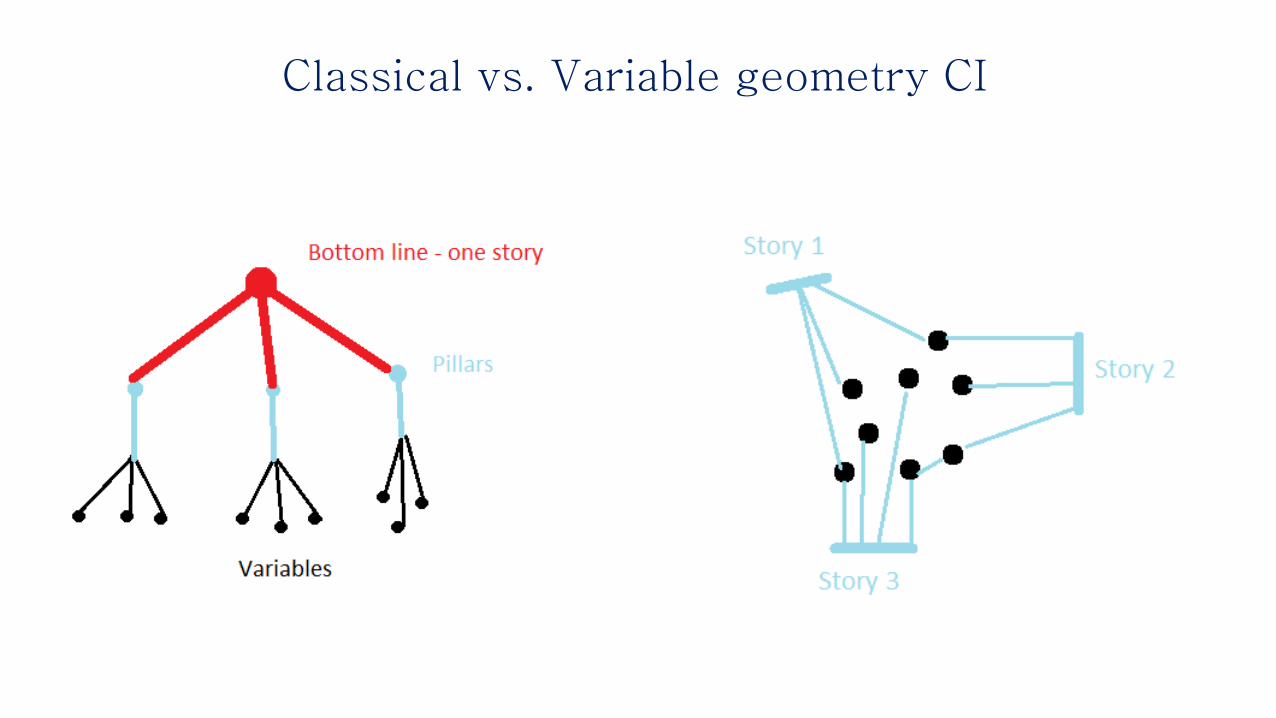
Classical vs. Variable geometry CI
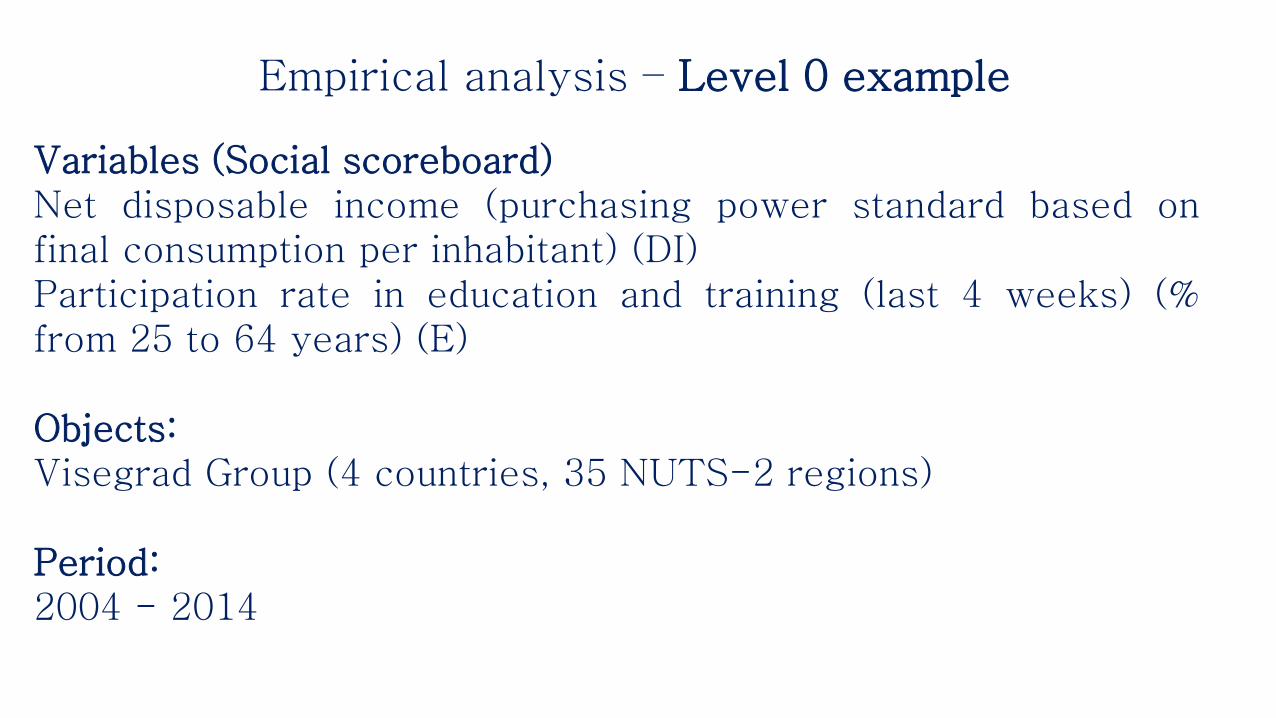
Empirical analysis – Level 0 example
Variables (Social scoreboard)Net disposable income (purchasing power standard based onfinal consumption per inhabitant) (DI)Participation rate in education and training (last 4 weeks) (%from 25 to 64 years) (E)
Objects:Visegrad Group (4 countries, 35 NUTS-2 regions)
Period:2004 - 2014
0,0
2,0
4,0
6,0
8,0
10,0
12,0
14,0
0,00 2 000,00 4 000,00 6 000,00 8 000,00 10 000,00 12 000,00 14 000,00 16 000,00 18 000,00 20 000,00
E
DI
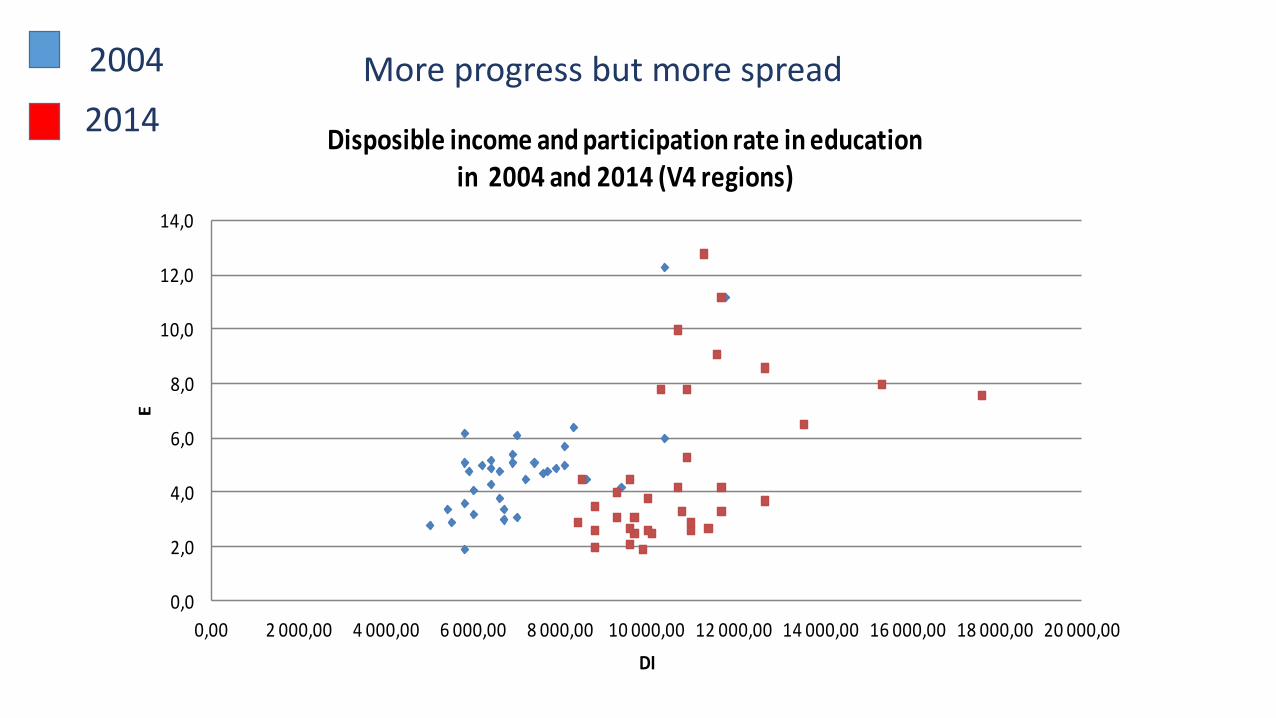
Disposible income and participation rate in education in 2004 and 2014 (V4 regions)
2004
2014
More progress but more spread

CI_Nations (averaging V4 regions)
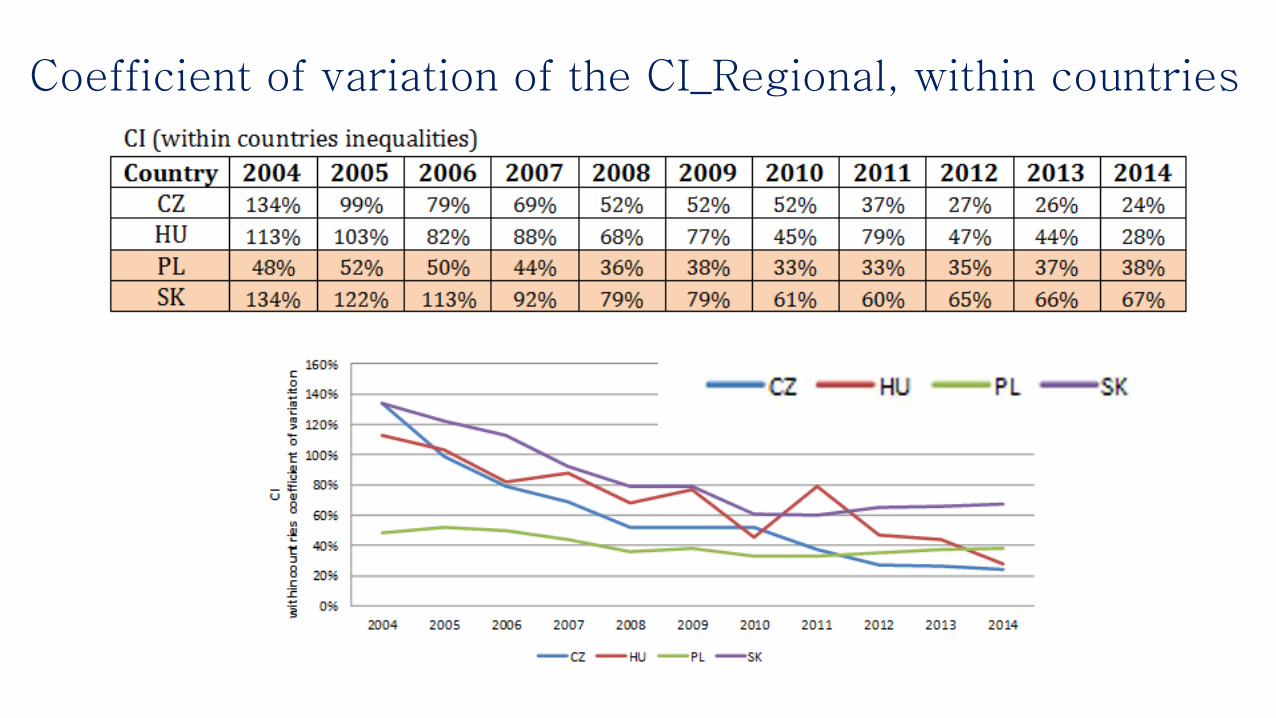
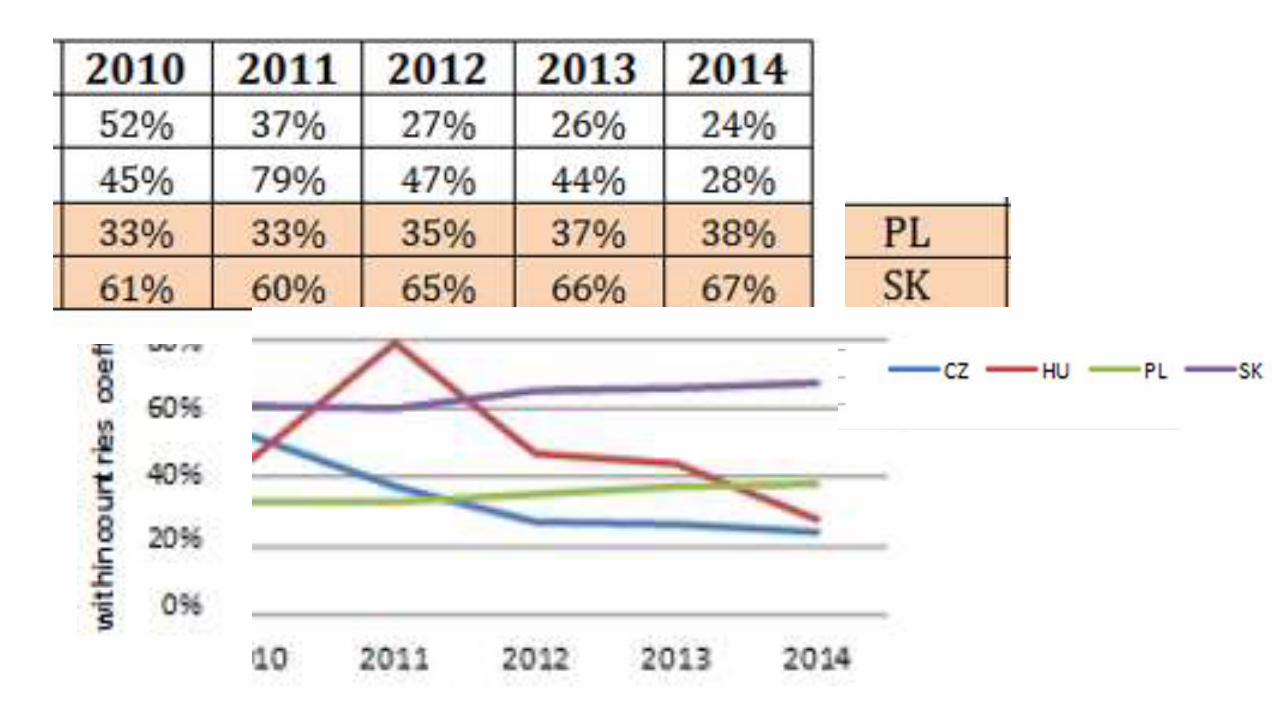
Coefficient of variation of the CI_Regional, within countries
Conclusions: CI – instructions for use
Awareness of the imperfections and non-neutrality of measures
Investigate properties and assumptions
Use for social discovery, (deliberative) extended participation; quality as fitness for purpose
Don’t commit to a single view

Further research:
Level 0 example shows that based on the same data one can saytwo different stories, i.e. regional convergence and withincountries divergence.
• Extend the analysis for more countries,• Extend the analysis for more variables (final set of variables
based on sensitivity analysis),• Composite indicator at variable geometry?

END