competitiveness of selected south african agricultural ... · agriculture, forestry & fisheries...
TRANSCRIPT
agriculture,forestry & fisheriesDepartment: Agriculture, Forestry and FisheriesREPUBLIC OF SOUTH AFRICA
Competitiveness of selected South African agricultural products in
the European union market
Compiled byEconomic Research Division
DIRECTORATE: ECONOMIC SERVICES
January 2011
Compiled by:
Directorate: Economic Services and Directorate: International Trade
Department of Agriculture, Forestry and Fisheries
Competitiveness of selected South African agricultural product exports in the EU-27
1
Abstract This study measures the competitiveness of selected agricultural exports in the European Union (EU-27) between 2001 and 2009. The Revealed Comparative Advantage (RCA) index and Comparative Export Performance (CEP) index approaches were applied to analyse data sourced from the International Trade Centre (ITC) Trade Map. The results suggest that, in comparison to the world average, South Africa has been competitive in the EU-27 in terms of fish and crustaceans, vegetables, fruit and beverages, but uncompetitive with regard to cereals, sugar and tobacco. The results also suggest that Argentinean agricultural exports generally had a comparative advantage over South Africa in the EU-27. South Africa had a comparative advantage over Brazil with regard to fish and crustaceans, fruit and beverages. In comparison to Chile, South Africa stayed competitive in terms of the vegetable, fruit, sugar and tobacco industries. In comparison to Australia, it stayed competitive in terms of fish and crustaceans, vegetables and fruit foods, sugar and tobacco.
1. Introduction South Africa’s first democratic government, which came into power in 1994, was facing a challenge to reform the country’s exclusive policy system where the initial challenge was to transform the country from an import substituting industrialisation to an export orientated regime (Sandrey et al., 2008). Prior to policy reform, South Africa’s trade regime was dominated by tariff (multitude tariffs and other duties and charges), non-tariff barriers (quantitative restrictions, permits and other regulations), which in most cases, eliminated foreign competition (Vink et al., 2002). The policy transformation came at the right time after the conclusion of the Uruguay round of the General Agreement on Tariffs and Trade (GATT), setting the base for South Africa’s accession to the World Trade Organization (WTO), though giving a signal to farmers that they must prepare for intensive competition in the less controlled world trade environment (Esterhuizen & Van Rooyen, 1999, cited by Mosoma, 2004). Tsikata (1999) argues that one symbol of South Africa’s break with the economic policies of the past and a key element of its drive to achieve accelerated economic growth, was the new regime’s liberalisation of the external trade regime. According to Sandrey et al. (2008), supported by Vink et al. (2002), the agriculture sector has undergone huge economic, social and political changes since the beginning of the democratisation process in 1994 and is increasingly integrated into world markets. The combination of liberalisation and stricter labour laws, brought by the economic transformation, exposed the agricultural sector to the adverse effects of globalisation (Chitiga, 2008). Being integrated into the global economy, South Africa’s international trade becomes an increasingly important component in the South African agricultural economy (Daya et al., 2006). As such, agricultural producers and agribusiness firms in South Africa are facing increasing competition in domestic and international markets (Ortmann, 2000). Amid the increasing competition in global markets, South Africa’s exports and imports of agricultural
Competitiveness of selected South African agricultural product exports in the EU-27
2
commodities and of food, tobacco and beverages have increased substantially (Vink et al., 2002). In today’s world of liberalised trade, the future of food dynamics is determined by competiveness, which is a complex issue, because food products must be competitive and meet all consumer concerns (Polymeros et al., undated), hence agricultural producers and agribusiness managers are facing increasing pressure to improve products and service quality, enhance productivity, and reduce production and transaction costs (Ortmann, 2000). The Organisation for Economic Cooperation and Development (OECD) (2006) argues that the South African economy, including agriculture, is increasingly integrated into world markets with about one third of agricultural production exported. It is among the world’s leading exporters of agro-food products such as wine, fresh fruit and sugar. Therefore South Africa’s agriculture sector depends substantially on global markets. For example, Kirsten (1999) argues the future survival and growth of the South African agricultural sector will largely depend on its ability to compete on the world market. The author further argues that increased agricultural exports, especially high-value agricultural commodities and value-added products, are considered to provide the growth impetus for South African agriculture. Mosoma (2004) concludes that relative competitiveness plays an important role in determining changes in trade patterns and flows in the South African agricultural sector. The competitiveness of South Africa’s agricultural trade is therefore crucial for performance and growth of the agricultural sector itself. In the light of the above background and in line with one of the strategic objectives of the Department of Agriculture, Forestry and Fisheries (DAFF), which is to increase competitiveness, raise net exports, grow trade as a share of world trade and improve its composition, this study intends to measure South Africa’s trade competitiveness in the European Union (EU-27) markets over the past nine years. The specific objectives of this study are: � To measure competitiveness of South Africa’s selected agricultural products in
the EU-27 markets, relative to that of the world, for the past nine years. � To measure relative competitiveness of South Africa’s agricultural products in
EU-27, against that of the selected competitors1, for the past nine years. The next section (section 2) presents the literature review, while section 3 provides background on the South African agricultural trade. Section 4 presents the study approach, which outlines the methodology used in this study, while section 5 and 6 provide the discussion of the results and conclusion, respectively. The last section is a reference list.
1 Selected competitors refer to Argentina and Australia. These countries enjoy the same counter-
seasonal advantage in access to developed country markets and constitute competition for South Africa’s highest value export sub-sectors namely, sugar, wine, citrus fruit and grapes in South Africa’s top five export destinations, namely the United Kingdom, Netherlands, Belgium, Japan and Mozambique (Mosoma, 2004). To add to these two countries Brazil and Chile are also included.
Competitiveness of selected South African agricultural product exports in the EU-27
3
2. Literature review 2.1. Definition of competitiveness The OECD (2010) defines competitiveness in two perspectives:
(i) Competitiveness as the ability to face competition and to be successful when facing competition
(ii) Competitiveness as the ability to sell products that meet demand requirements and at the same time, ensure profits over time that enable the firm to thrive
Competitiveness is a comparative concept of the ability and performance of a firm, subsector or country to sell and supply goods and/or services in a given market. Competitiveness captures the awareness of both the limitations and challenges posed by global competition, at a time when effective government action is constrained by budgetary constraints and the private sector faces significant barriers to compete in domestic and international markets (Wikipedia, 2010). Comparative advantage refers to the ability of one nation to produce a commodity at a lower opportunity cost of other products forgone than another nation, while competitive advantage indicates whether a firm could successfully compete in the trade of the commodity in the international market, given existing policies and economic structure (Warr, 1994) as cited by Mosoma (2004). According to Nordin et al. (2008) the theory of competitiveness is based on comparative and competitive advantage, both of which are related, but one is often mistaken for the other. The concept of comparative advantage is derived from traditional theory of international trade that it is more profitable for a country to export goods that it produces at a relatively lower cost than other countries, and import goods that it produces at a relatively higher cost than other countries. Although widely used in economics and business management, the value of the concept, particularly in the context of national competitiveness, is disputed vigorously by economists (Wikipedia, 2010). According to the OECD (2010), competitiveness is a relative measure and there is no agreement on how to define it, or how to measure it precisely. 2.2. Results from other studies Kalaba and Henneberry (2001) studied the competitiveness of South African apples, pears and grapes in the European Union. Their findings suggest that South African fruit exports are the least competitive among the selected suppliers, i.e. Chile, the United States, New Zealand, Argentina and Turkey. The authors argue that lack of competitiveness from South African products might be attributed to many years of isolation or poor product quality compared to other products. Using revealed comparative advantage (RCA) methodology, Edwards and Schoer (2001) showed that South Africa has a comparative advantage in the production of agriculture, mining and manufacturing products relating to these sectors.
Competitiveness of selected South African agricultural product exports in the EU-27
4
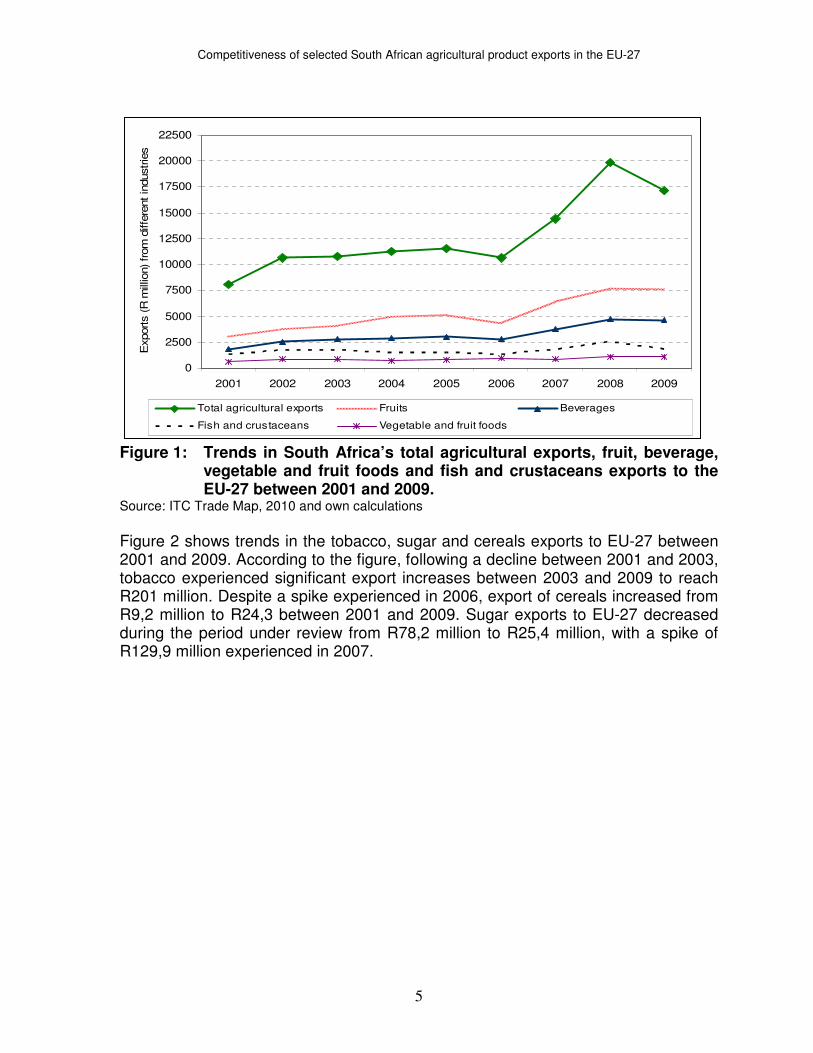
Mosoma, (2004) compared South African agricultural exports with those of Argentina and Australia, regarding relative international competitiveness and established that South Africa’s agriculture remains marginally competitive internationally, and that Australia and Argentina’s food chains are generally more competitive internationally than those of South Africa. Hallat et al, (undated) used the Net Export Index (NEI), the RCA and the Relative Revealed Comparative Trade Advantage (RTA) index, to determine the comparative and competitive advantages of the South African oilseed industry. Their findings reveal that South African groundnuts and sunflower seed have a competitive advantage in their primary form. The authors also found that in most cases, oilseed to which value has been added, had a competitive disadvantage. Kirsten (1999) concluded that in the context of the increasing importance of competitiveness in world agricultural markets, it was critical that the agricultural inputs industry was well integrated and well aligned with the agricultural value chain to ensure the survival of the agricultural industry. 3. Background on South Africa’s agricultural trade During the first quarter of 2010 the agriculture sector has earned export revenue of R10,1 billion and used R8,4 billion to pay for imported agricultural products. Therefore the sector earned a positive trade balance of R1,7 billion. What is noteworthy is that agricultural sector has experienced a fluctuating trade balance for the past five years, which was in the positive territory most of the time (DAFF, 2010). South Africa’s most important agricultural export products, that accounted for more than 80% of agricultural export revenue in the first quarter of 2010, include edible fruit and nuts, beverages, preserved food, tobacco, cereals, wool not carded or combed, miscellaneous food, sugar, meat, milling products, malt and starch. Most important agricultural import products, that account for over 60% of agricultural import value during the same period, include cereals, meat, soya-bean oil cake, beverages, soya-bean oil and its fractions, tobacco, palm oil and its fractions, miscellaneous food, spices, coffee, tea, and preserved food (DAFF, 2010). Figure 1 and Figure 2 show the trends in South Africa’s total agricultural exports and exports from selected industries to the EU-27 (see Appendix A for full descriptions of these industries). According to Figure 1, the total agricultural exports increased marginally between 2002 and 2005, following a significant increase between 2001 and 2002. However, between 2006 and 2008 agricultural exports increased sharply to reach almost R20 billion in 2008. Disappointingly, the exports dropped to reach below R17 billion between 2008 and 2009. During the period under review, fruit exports increased from about R3 billion in 2001 to R7,6 billion in 2009. Exports of beverages, fish and crustaceans experienced similar trends and increased from about R1,8 billion and R1,3 billion in 2001 to reach R4,7 billion and R1,8 billion in 2009, respectively. Exports of vegetable and fruit foods increased from R638 million to R1,1 billion during the same period.
Competitiveness of selected South African agricultural product exports in the EU-27
5
0
2500
5000
7500
10000
12500
15000
17500
20000
22500
2001 2002 2003 2004 2005 2006 2007 2008 2009
Exports (R
mill
ion) from
diffe
rent in
dustrie
s
Total agricultural exports Fruits Beverages
Fish and crustaceans Vegetable and fruit foods
Figure 1: Trends in South Africa’s total agricultural exports, fruit, beverage, vegetable and fruit foods and fish and crustaceans exports to the EU-27 between 2001 and 2009.
Source: ITC Trade Map, 2010 and own calculations
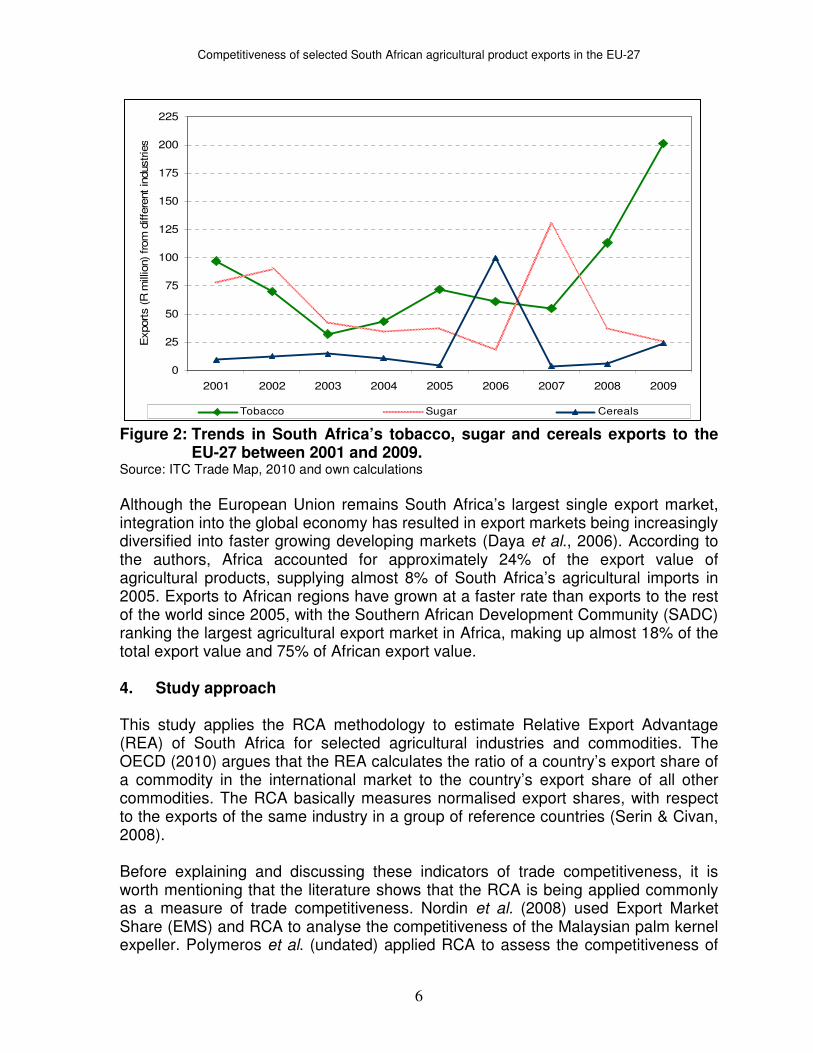
Figure 2 shows trends in the tobacco, sugar and cereals exports to EU-27 between 2001 and 2009. According to the figure, following a decline between 2001 and 2003, tobacco experienced significant export increases between 2003 and 2009 to reach R201 million. Despite a spike experienced in 2006, export of cereals increased from R9,2 million to R24,3 between 2001 and 2009. Sugar exports to EU-27 decreased during the period under review from R78,2 million to R25,4 million, with a spike of R129,9 million experienced in 2007.
Competitiveness of selected South African agricultural product exports in the EU-27
6
0
25
50
75
100
125
150
175
200
225
2001 2002 2003 2004 2005 2006 2007 2008 2009
Exports (R
mill
ion) from
diffe
rent in
dustrie
s
Tobacco Sugar Cereals
Figure 2: Trends in South Africa’s tobacco, sugar and cereals exports to the EU-27 between 2001 and 2009.
Source: ITC Trade Map, 2010 and own calculations
Although the European Union remains South Africa’s largest single export market, integration into the global economy has resulted in export markets being increasingly diversified into faster growing developing markets (Daya et al., 2006). According to the authors, Africa accounted for approximately 24% of the export value of agricultural products, supplying almost 8% of South Africa’s agricultural imports in 2005. Exports to African regions have grown at a faster rate than exports to the rest of the world since 2005, with the Southern African Development Community (SADC) ranking the largest agricultural export market in Africa, making up almost 18% of the total export value and 75% of African export value. 4. Study approach This study applies the RCA methodology to estimate Relative Export Advantage (REA) of South Africa for selected agricultural industries and commodities. The OECD (2010) argues that the REA calculates the ratio of a country’s export share of a commodity in the international market to the country’s export share of all other commodities. The RCA basically measures normalised export shares, with respect to the exports of the same industry in a group of reference countries (Serin & Civan, 2008). Before explaining and discussing these indicators of trade competitiveness, it is worth mentioning that the literature shows that the RCA is being applied commonly as a measure of trade competitiveness. Nordin et al. (2008) used Export Market Share (EMS) and RCA to analyse the competitiveness of the Malaysian palm kernel expeller. Polymeros et al. (undated) applied RCA to assess the competitiveness of
Competitiveness of selected South African agricultural product exports in the EU-27
7
EU-Mediterranean fisheries and aquaculture. Carraresi and Banterle (2008) applied EMS, RCA, Relative Import Advantage (RIA) and Net Export Index (NEI) to assess European countries’ competitiveness at the sector level in the intra-EU market over the last 15 years. Hallat et al, (undated) used RCA, NEI and RTA to measure competitive and comparative advantage of the South African oilseed industry. The OECD (2010) shows that many authors2 have applied EMS and/or RCA to measure competitiveness.
According to the OECD (2010) the RCA can be expressed as:
RCAij = (Xij / Xik) / (Xnj / Xnk) …………………………………………………………. (1)
Where,
X = exports; k = all commodities other than j; and n = all other countries other than i.
RCA index greater than 1 indicates that the country i has a comparative advantage in the commodity j, therefore, it reveals competitiveness. RCA index less than 1 indicates that the country i does not have a comparative advantage in the commodity. However, this study adopts and applies a slightly modified RCA formula3 to calculate the comparative export performance of agricultural exports of South Africa and selected competitors, relative to the world agricultural exports, in the EU-27 markets. Such formula is expressed differently:
CEP = ln(XA,C,E / XT,C,E) / (XA,W,E / XT,W,E)………………………………………………..(2)
Where,
CEP = Comparative export performance X = exports A = agricultural industry C = country of choice T = total exports W = world E = EU-27 CEP greater than 0 indicates that a country has a comparative export advantage in the EU-27 markets, relative to the world, while RCA of less than 0 indicates that a country has a comparative export disadvantage in the EU-27 markets, relative to the world. Again, index value of South Africa higher than its rival country, indicates relative comparative advantage of South Africa against its rival country.
2 Some of the authors include Mulder et al. (2004), Drescher and Maurer (1999), Banterle and
Carraresi (2007), Wijnands et al. (2008), Venturini and Boccaletti (1994), Bavorova (2003), Bojnec and Fertö (2009) and Qineti et al.(2009) 3 See Serin and Civan (2008)
Competitiveness of selected South African agricultural product exports in the EU-27
8
Another formula used in this study is also a slightly modified RCA index formula, which intends to calculate the revealed comparative advantage of South African agricultural exports relative to the agricultural exports of the selected competitors in the EU-27 markets (see equations 3 below).
RCAA,SA = ln(XAi,SA,E / XT,SA,E) / (XAi,Cr,E / XT,Cr,E)…………………………………….…..(3)
Where,
X = exports Ai= agricultural industry (or products) SA = South Africa T = total exports Cr = rival country E = EU-27 RCA greater than 0 indicates that South Africa has a comparative export advantage over a rival country, while RCA of less than 0 indicates that South Africa has a comparative export disadvantage over a rival country. In this study, analyses of competitiveness of South Africa’s agricultural exports is performed using the export data for agricultural industries that earn most of South Africa’s agricultural export revenue, i.e. 80% in 2009 (see appendix G). These industries include fish, crustaceans, molluscs, aquatic invertebrates nes; edible fruit, nuts, peel of citrus fruit, melons; beverages, spirits and vinegar; cereals; sugars and sugar confectionery; vegetables,, food preparations, tobacco and manufactured tobacco substitutes. Their respective harmonised system (HS) codes 2 (product cluster 2) are 03, 08, 22, 10, 17, 20 and 24, respectively and their full descriptions are in Appendix A. It is important to note that performing the analysis of competitiveness at sector/industry level or aggregated product level reveals an average measure of competitiveness for that sector/industry but does not reflect particular strength and weakness of individual products, unless the competitiveness is analysed at a disaggregated level (Polymeros et al., undated). As such, analysis of competitiveness was also done at disaggregated (product) level (at HS code 4). Variables used in this study include; (i) agricultural exports (values) of the above stated industries to EU-27 for South Africa, Argentina, Australia, Brazil, Chile and world, and (ii) total exports (values) to EU-27 for South Africa, Argentina, Australia, Brazil, Chile and the world. It should be noted that agricultural imports and total imports by EU-27 from the world were used as proxies for agricultural exports and total exports to EU-27 by the world. Microsoft excel was used to calculate CEP and RCA indices. 5. Discussion of findings
This section discusses the results of data analysis (CEP and RCA indices), which are presented in appendix B, C, D, E and F. In some tables there are empty cells, which indicate that there has been zero value or unreported value for either South Africa’s exports or competitor’s exports of the particular commodity/product in
Competitiveness of selected South African agricultural product exports in the EU-27
9
question. Subsection 5.1 discusses the CEP indices results for selected agricultural industries of South Africa, Argentina, Australia, Brazil and Chile. Section 5.2 to section 5.5 discuss the RCA indices results for selected South African agricultural industries and products. It is worth noting that, in appendix A, long descriptions of industries and product categories are shortened to make writing and reading simple. For example, fish, crustaceans, molluscs, aquatic invertebrates nes, are shortened to fish and crustaceans. 5.1 Comparative Export Performance (CEP) indices of South Africa and its
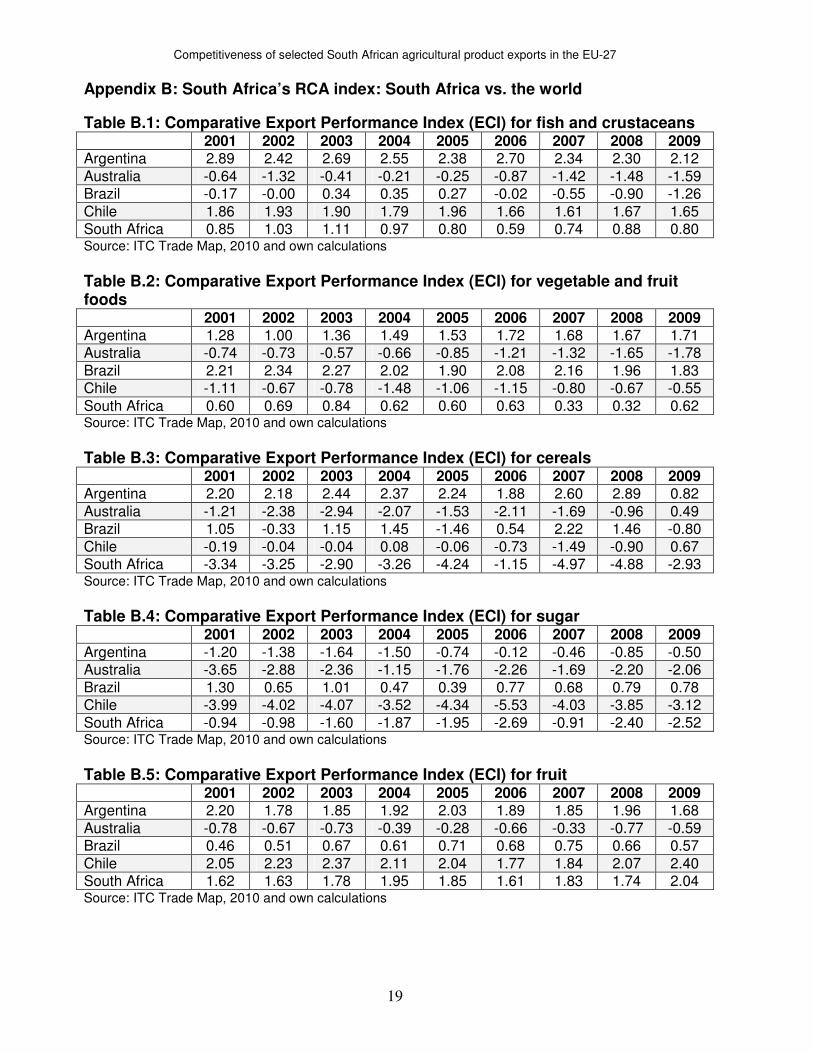
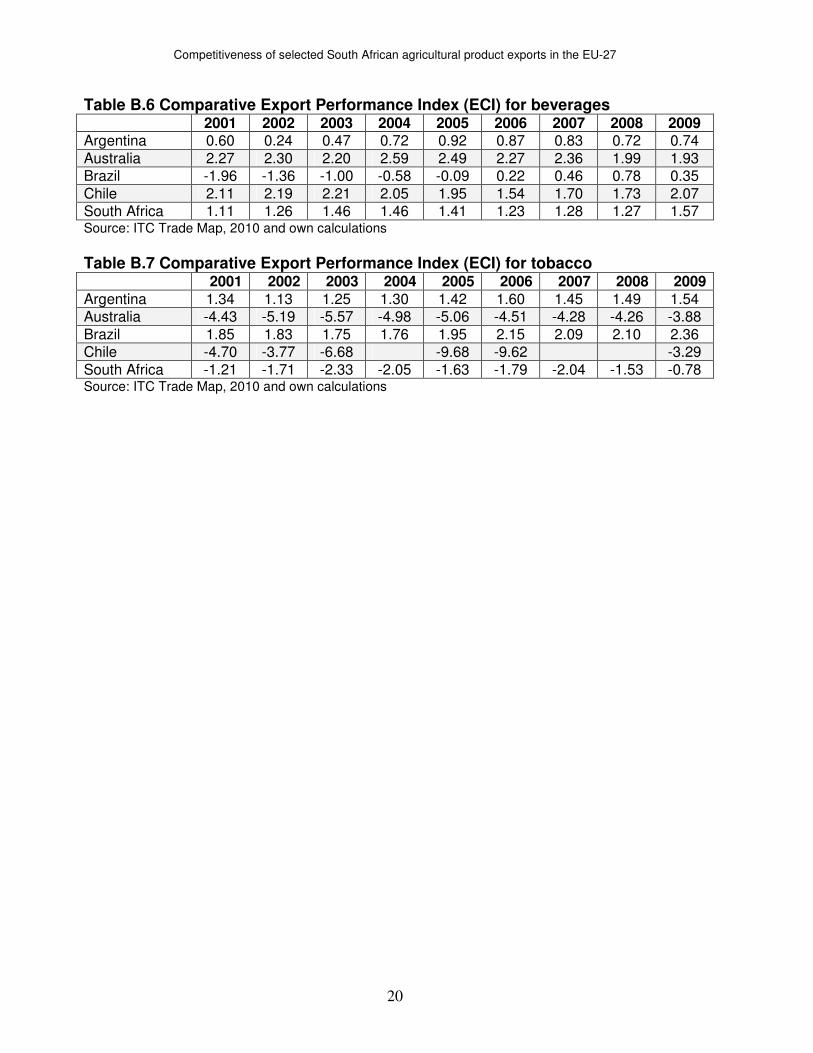
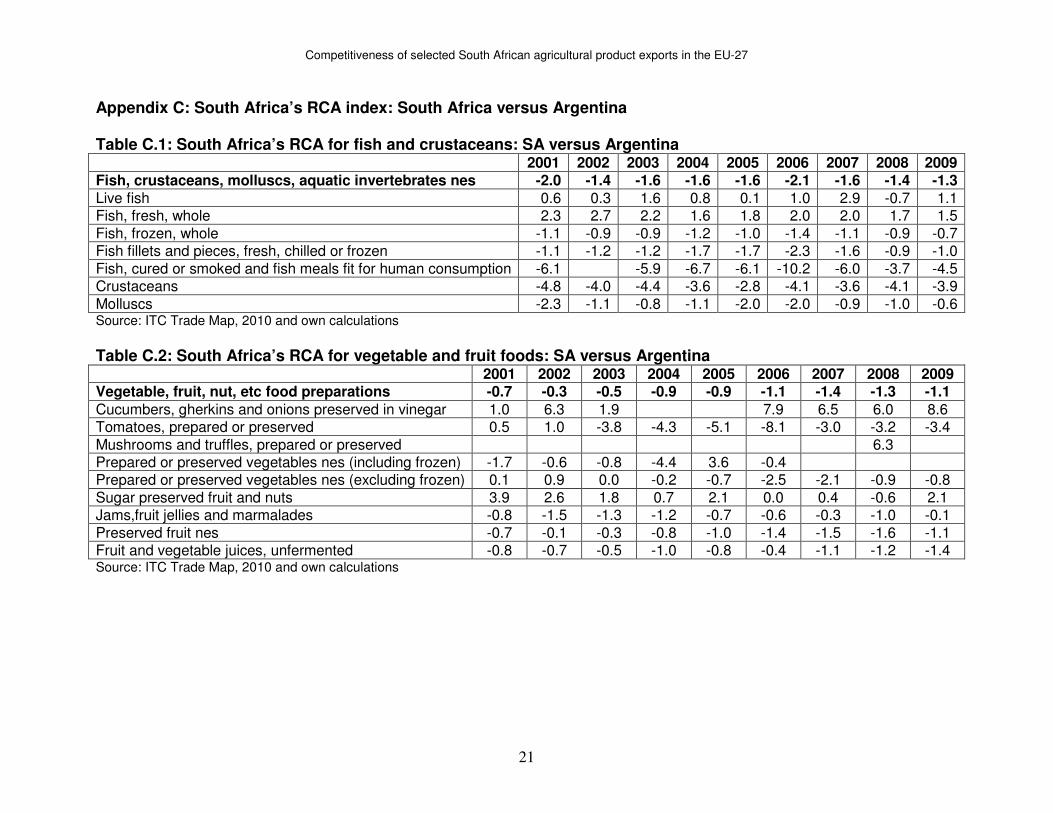
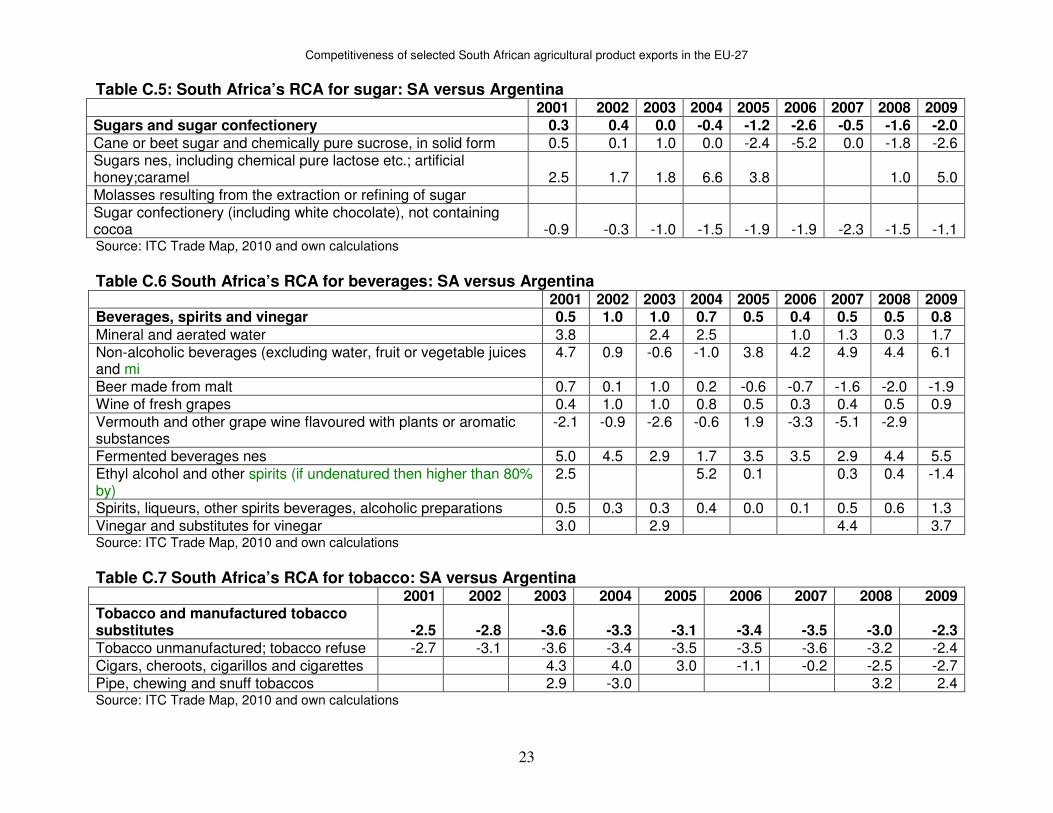
rival countries The results in Table B.1 reveal that in the case of fish and crustaceans, South Africa, Argentina and Chile had a comparative advantage in the EU-27 markets between 2001 and 2009, while the opposite counts for Australia. Brazil had a comparative advantage only from 2003 to 2005. The results further suggest that South Africa had higher competitiveness than Brazil and Australia. However, it has been relatively inferior when compared to Argentina and Chile. Table B.2 shows that in terms of vegetable and fruit foods, South Africa, Argentina and Brazil had a comparative advantage, while the opposite counts for Australia and Chile. The table also shows that South Africa has still been superior to Australia and Chile. Argentina and Brazil were, however, superior to South Africa. The results in Table B.3 suggest that South Africa, Australia and Chile had a comparative disadvantage in terms of cereals, while Argentina and Brazil enjoyed the upper hand. South Africa had a relative comparative disadvantage compared to all the countries under assessment. In terms sugar, Table B.4 shows that Brazil was competitive, while the opposite holds for South Africa, Argentina, Chile and Australia. However, South Africa appears to have been superior over Chile and also over Australia in 2001–2003, 2007 and 2009. Table B.5 shows that with the exception of Australia, all countries were competitive in terms of fruit. South Africa also has been superior over Australia and Brazil, but inferior to Chile and Argentina, though in 2004 and 2009 Argentina had a relative comparative disadvantage over South Africa. In the case of beverages, table B.6 reveals that South Africa, Argentina, Chile and Australia had a comparative advantage in the EU-27 markets, while Brazil had a comparative advantage only in the years from 2006 to 2009. South Africa enjoyed the upper hand over Argentina and Brazil, but remained inferior to Chile and Australia. In terms of tobacco, South Africa, Chile and Australia had comparative disadvantages, while Argentina and Brazil had comparative advantages (see table B.7). South Africa had a relative comparative advantage over Chile and Australia, though it remained inferior against Argentina and Brazil. 5.2 South Africa’s RCA indices: South Africa versus Argentina In terms of the fish and crustaceans industry, Table C.1 shows that between 2001 and 2009, South Africa had a comparative disadvantage over Argentina. At the product level it had a comparative advantage in fresh fish and live fish, which
Competitiveness of selected South African agricultural product exports in the EU-27
10
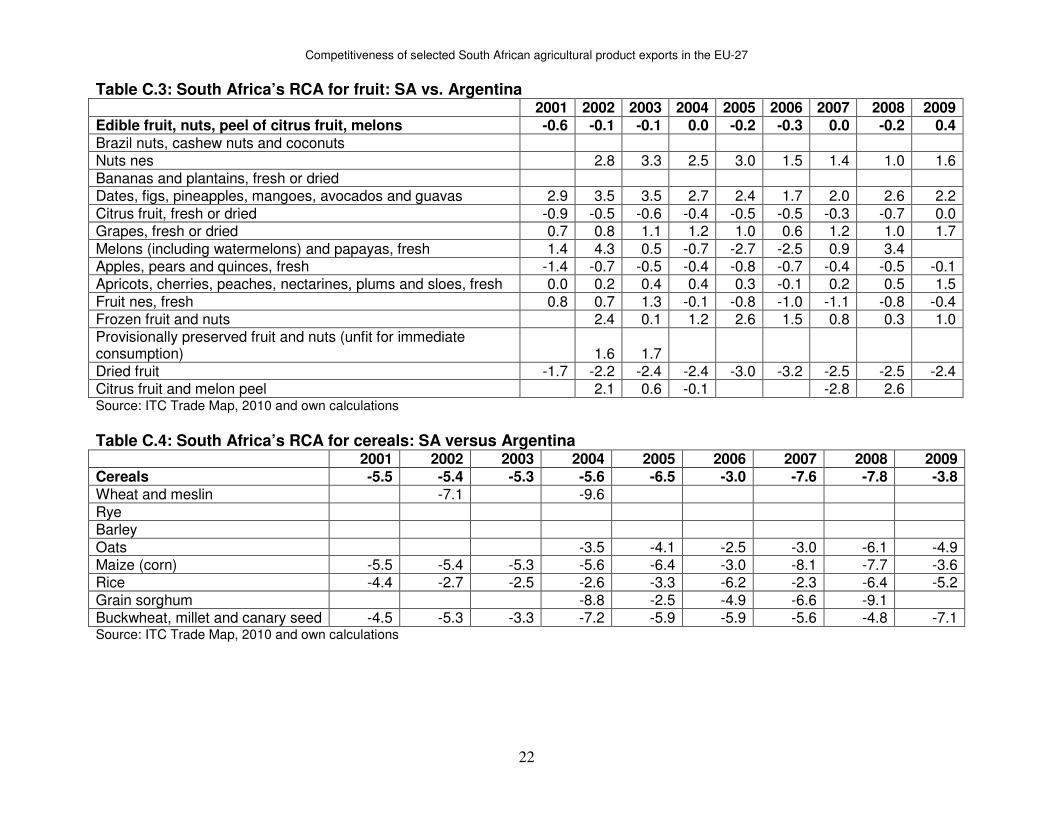
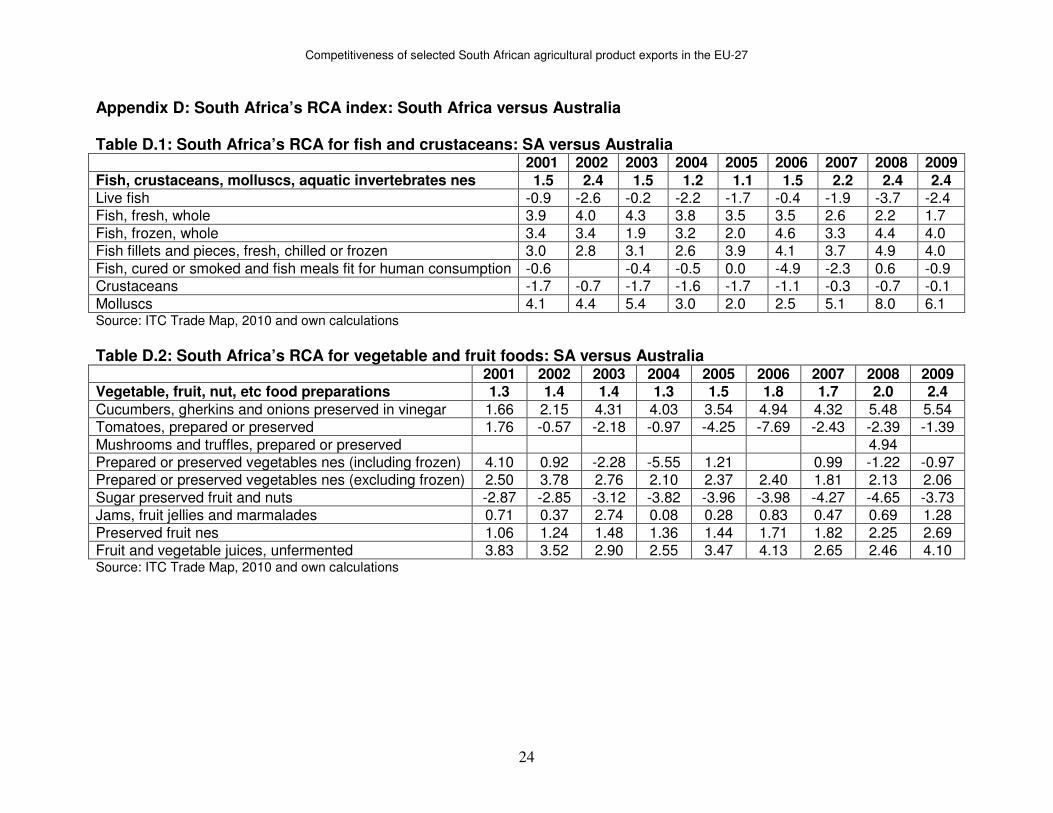
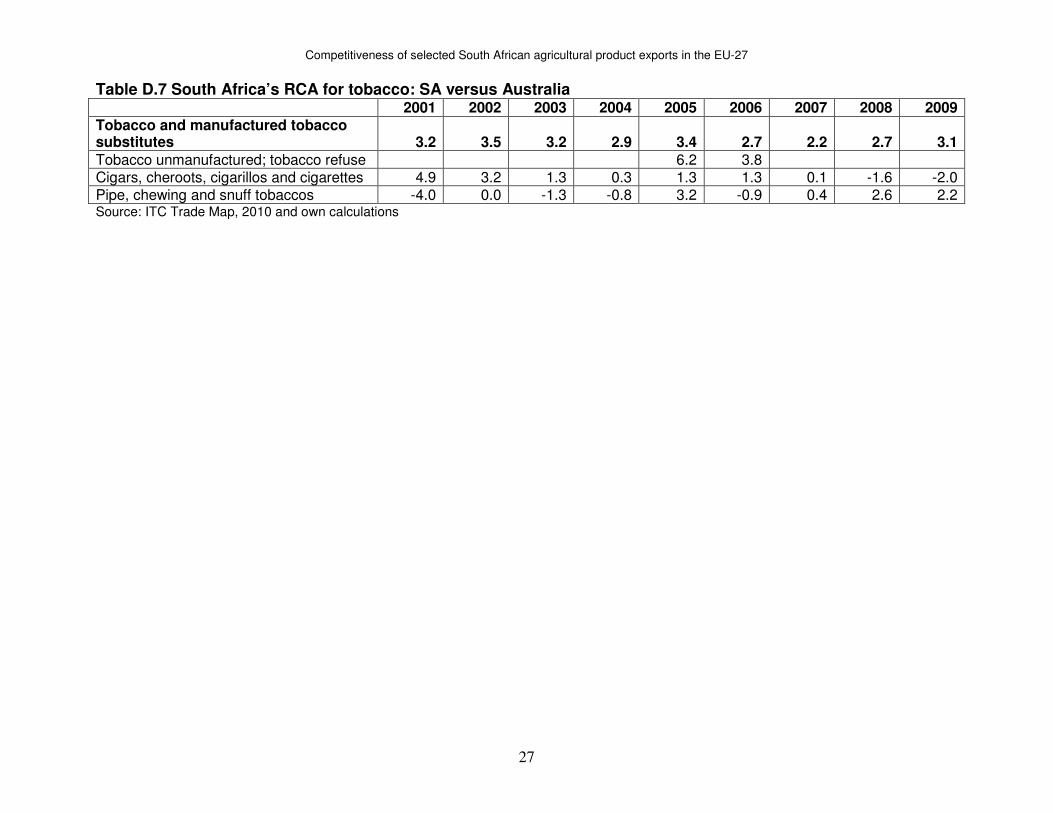
however, had a negative RCA index value in 2008. Argentina had a comparative advantage in frozen fish, fish fillets, smoked fish, crustaceans and molluscs. In terms of the vegetable and fruit industry, the results suggest that South Africa remained inferior against Argentina (see Table C.2). Within this industry, Argentina stayed competitive against South Africa in terms of jams, preserved fruit nes and fruit and vegetable juices. In terms of vinegar preserved cucumber, South Africa had the upper hand over Argentina. Products such as preserved tomato and sugar preserved fruit display mixed results, with South Africa being stronger in most years. Results in table B.3 suggest that the Argentinean fruit industry stayed superior over that of South Africa, except in 2004 and 2009. Nevertheless, South Africa was stronger over Argentina in terms of nuts nes, mangoes and avocados, grapes, apricots and peaches, preserved fruit and nuts and frozen fruit and nuts. On the other hand, Argentina had a comparative advantage in terms of products such as citrus fruit, apples, pears and dried fruit. Mixed results are seen in terms of melons and citrus fruit and melon peel, for which South Africa stayed stronger in most cases and in terms of fruit nes, for which Argentina had the upper hand in most cases. Table C.4 presents the Balassa index values which reveal that the Argentinean cereal industry had a significant comparative advantage over that of South Africa during the study period. Regarding the sugar industry, table C.4 shows that South Africa only had a comparative advantage over Argentina from 2001 to 2004. Argentina had a comparative advantage over South Africa in all products within the cereal industry. In terms of cane sugar, South Africa was stronger over Argentina from 2001 to 2004 and in 2004. South Africa had a comparative advantage over Argentina in terms of sugar nes, while Argentina has been superior in terms of sugar confectionary throughout the study period. The South African beverage industry had a comparative advantage over that of Argentina (see table C.6). At the product level, South Africa enjoyed the comparative advantage over Argentina in terms of mineral water, grape wine, fermented beverages, spirits and vinegar. Argentina had a comparative advantage over flavoured grape wine, except in 2005. In terms of non-alcoholic beverages, malt beer and ethyl alcohol, Argentina had a comparative advantage only from 2003 to 2004, from 2006 to 2009 and in 2009, respectively. The results in Table C.7 reveal South Africa’s comparative disadvantage in tobacco throughout the study period. Within this industry, Argentina enjoyed the upper hand over South Africa in terms of tobacco refuse. It also had an advantage in terms of cigars between 2006 and 2009. South Africa had an advantage in snuff tobacco. 5.3 South Africa’s RCA indices: South Africa versus Australia The results in Table D.1 suggest that the South African fish and crustaceans industry had a comparative advantage over that of Australia. At product level, South Africa had a comparative advantage in terms of fresh fish, frozen fish, fish fillets and molluscs, while Australia had a comparative advantage in terms of live fish, smoked
Competitiveness of selected South African agricultural product exports in the EU-27
11
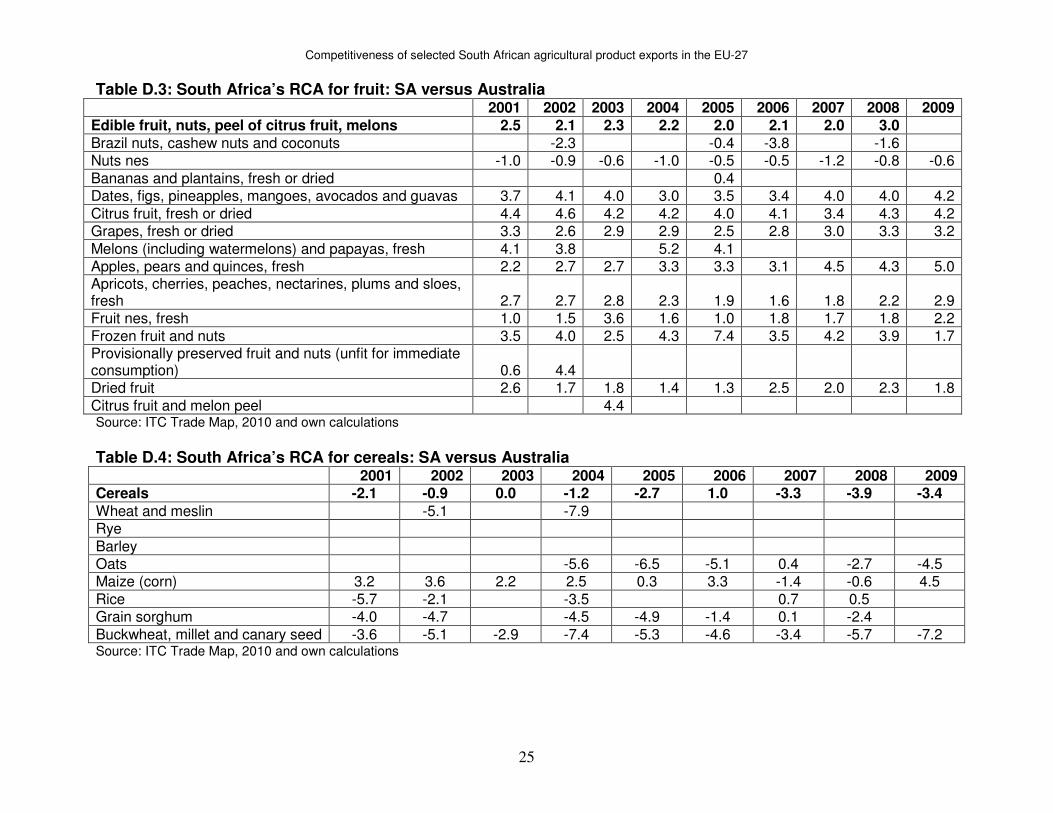
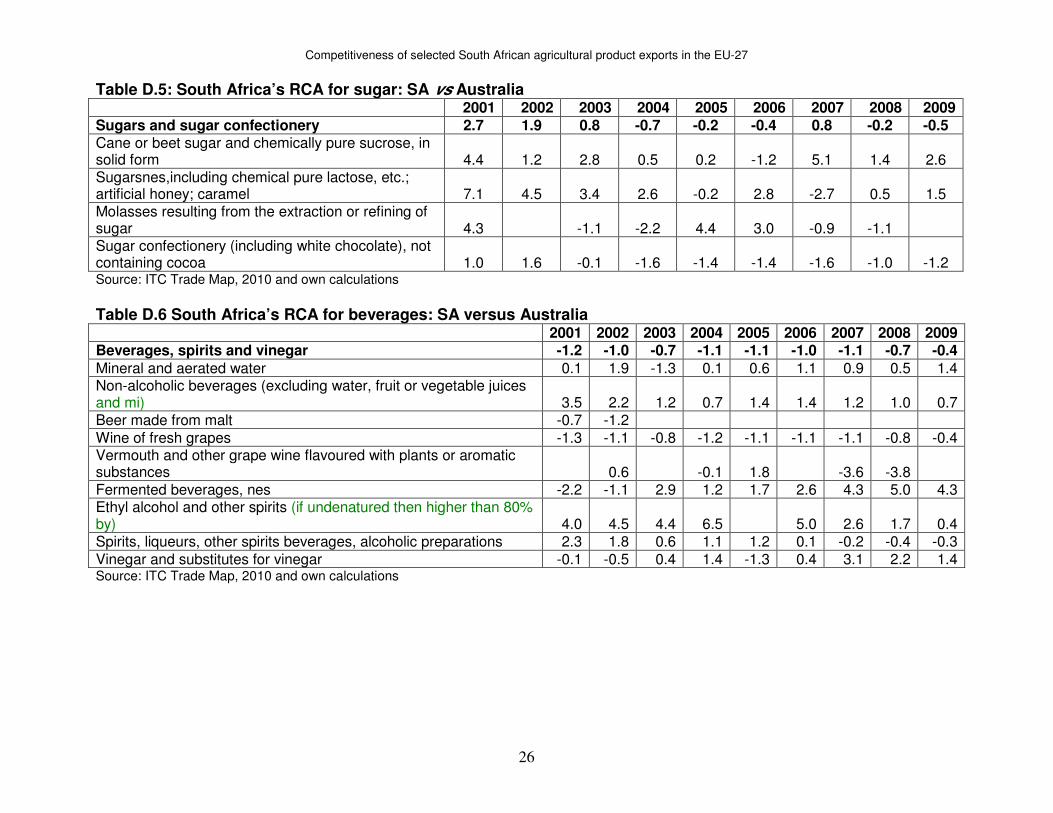
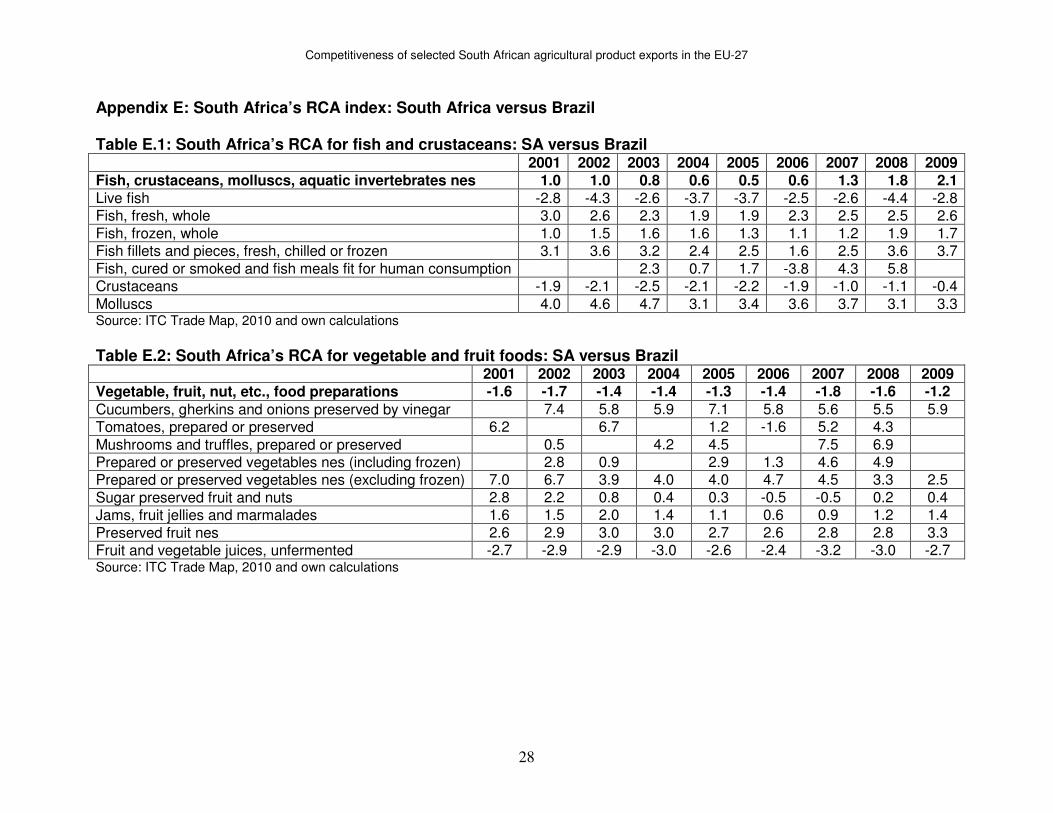
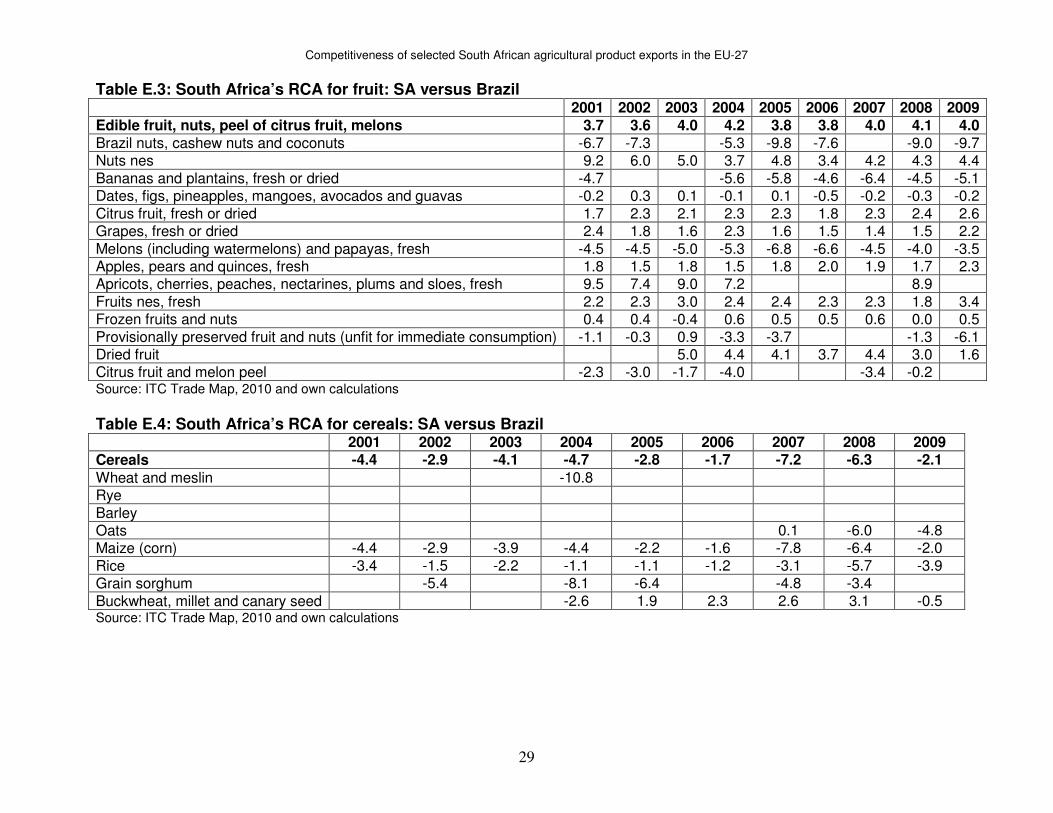
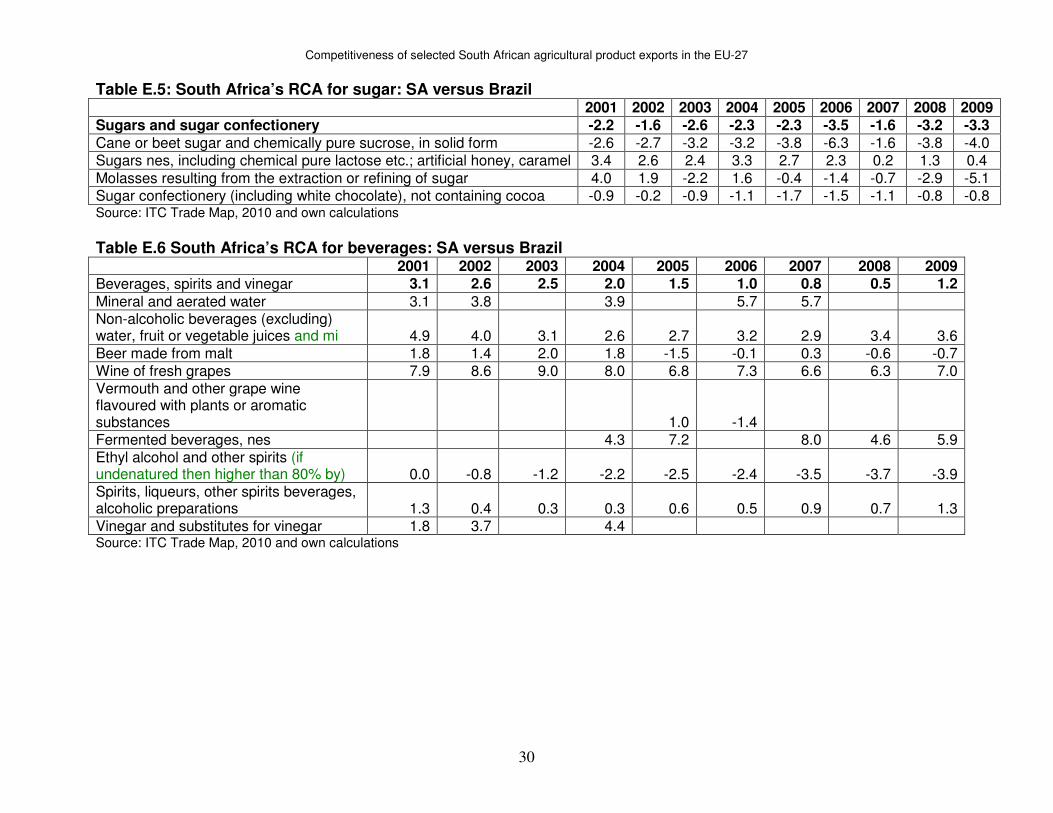
fish and crustaceans. Table D.2 shows that South Africa had a comparative advantage over Australia in terms of the vegetable and fruit foods industry. At product level, South Africa had a comparative advantage in vinegar preserved cucumber, preserved vegetables (excluding frozen), jams, preserved fruit nes and fruit and vegetable juices. Australia had the upper hand in preserved tomato and sugar preserved fruit. The South African fruit industry had a comparative advantage over that of Australia (see table D.3). At product level, South Africa had a comparative advantage in all products, except for nuts nes and Brazilian nuts, for which Australia had a comparative advantage. Table D.4 illustrates that regarding cereals, Australia has been significantly superior over South Africa in most years, except in 2003 and 2006, when South Africa had a comparative advantage over Australia. When considering individual products within this industry, Australia has been excelling relative to South Africa in terms of millet. However, South Africa performed better with regard to maize throughout the study period, except for 2007 and 2008. For oats, rice and sorghum, Australia performed better than South Africa, except for 2007 and 2008 respectively. Regarding the sugar industry covered by Table D.5, South Africa had a comparative advantage over Australia from 2001 to 2003 and 2007. Individual product observations indicate the upper hand for South Africa over Australia for cane sugar and sugar nes over the period examined, except in 2005, 2006 and 2007, respectively. An interesting observation occurred for molasses; comparative advantage alternated on a two-year basis between these countries throughout the study period. When considering sugar confectionery, South Africa had the upper hand over Australia only during the first two years of study. Table D.6 reveals that the South African beverages industry had a comparative disadvantage over that of Australia. However, it had a consistent comparative advantage - only in terms of non-alcoholic beverages and ethyl alcohol. Australia had an advantage in grape wine. Mineral water, spirits and vinegar display mixed results, with South Africa being stronger over Australia in most years. However, Table D.7 shows that, in terms of tobacco, South Africa enjoyed the upper hand over Australia. At product level, South Africa had an upper hand in terms of tobacco refuse, which is only reported in 2005 and 2006. Cigars and snuff tobacco experienced mixed results with South Africa having advantage in most cases. 5.4 South Africa’s RCA indices: South Africa versus Brazil Table E.1 shows that in terms of the fish and crustacean industry, South Africa had a comparative advantage over Brazil. At product level, South Africa had a comparative advantage in terms of fresh fish, frozen fish, fish fillets and molluscs, while Brazil had a comparative advantage in terms of crustaceans and live fish. Mixed results are seen in terms of smoked fish for which South Africa had a comparative advantage in most years. According to Table E.2, Brazil had a comparative advantage over South Africa in terms of the vegetable and fruit foods industry. Its strength was in fruit and vegetable juices for which it had a consistent comparative advantage. For the rest of the products falling within this industry, South Africa was stronger, though it had a
Competitiveness of selected South African agricultural product exports in the EU-27
12
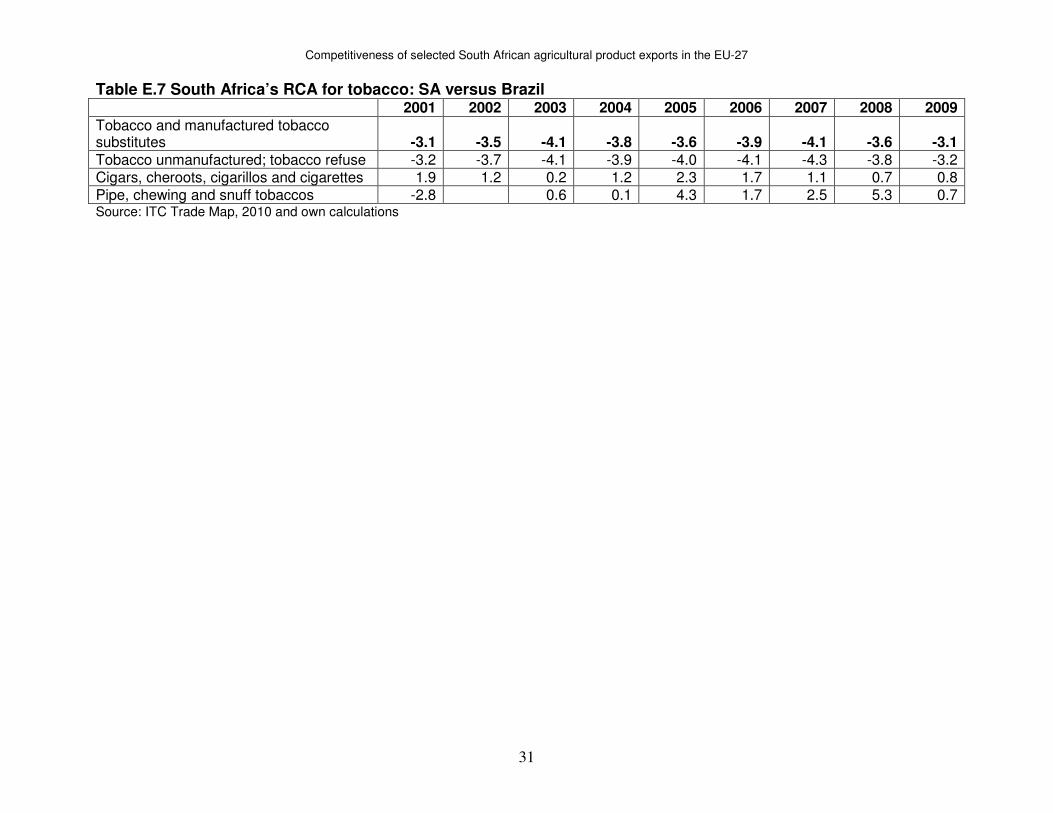
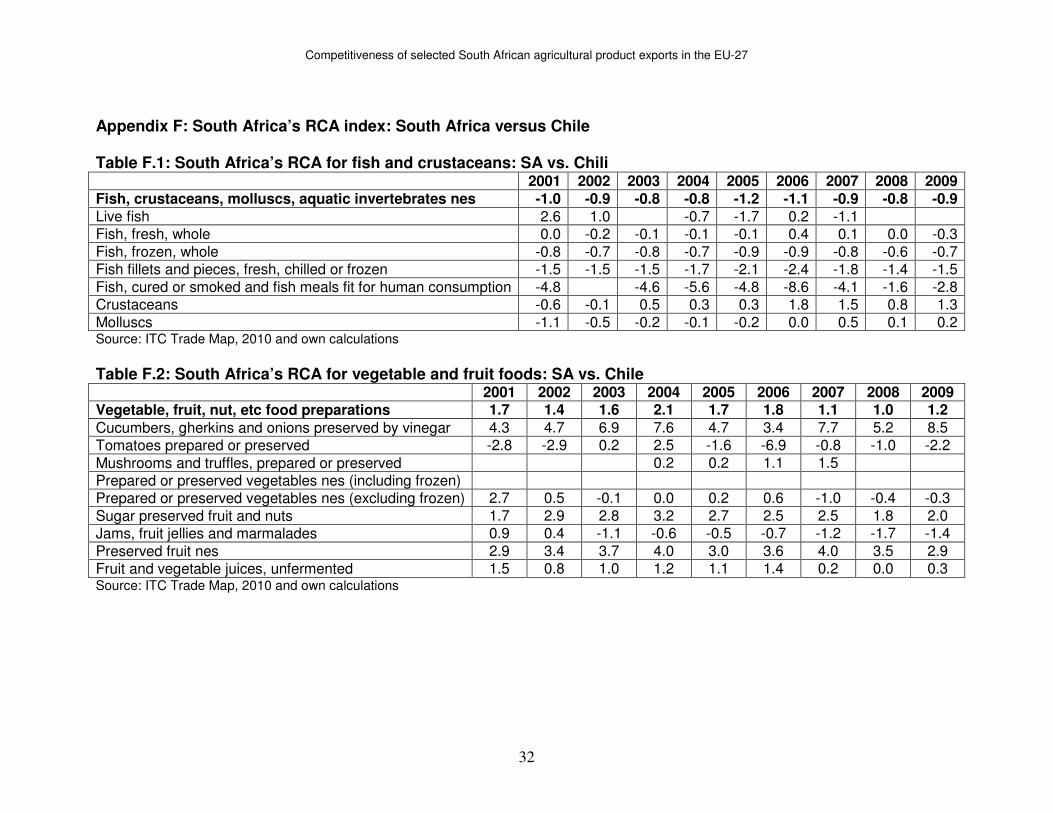
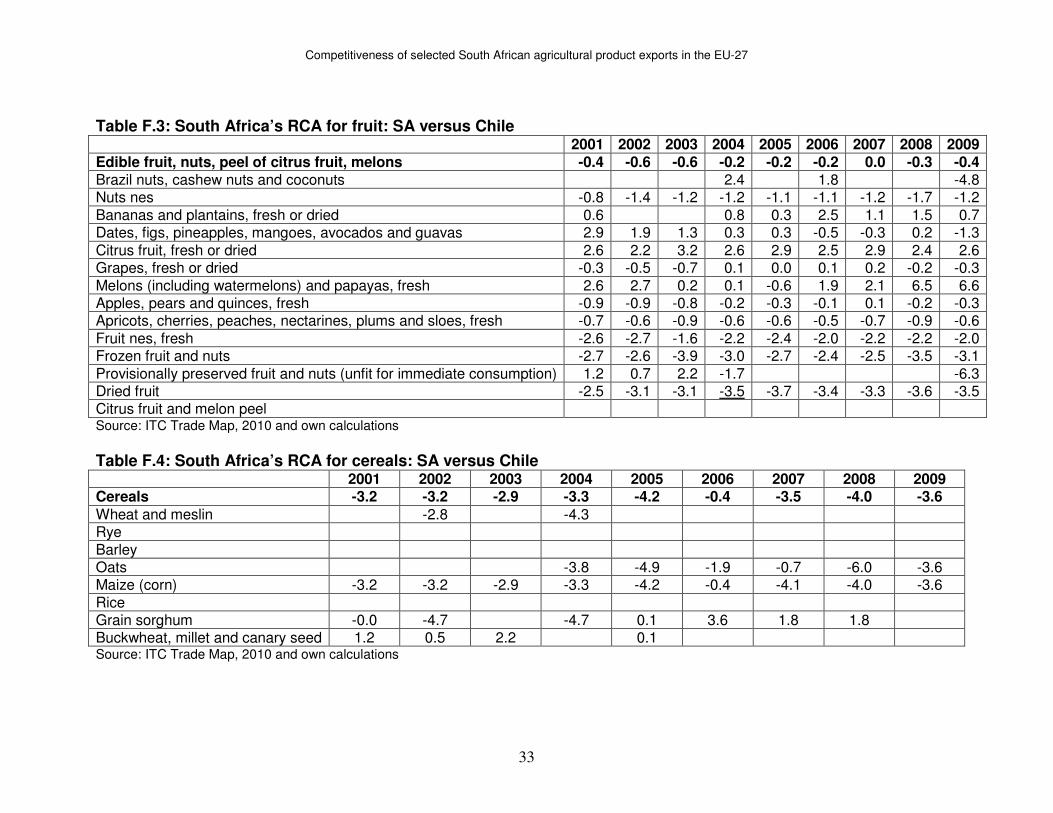
comparative disadvantage for preserved tomato and sugar preserved vegetables in 2004 and between 2006 and 2007, respectively. The South African fruit industry had a comparative advantage over that of Brazil (see Table E.3). Within this industry, South Africa was stronger in terms of nuts nes, citrus fruit, grapes, apples and pears, apricots and peaches, fruit nes and dried fruit, while Brazil was stronger in terms of bananas, melons, citrus fruit and melon peel. Frozen fruit also display mixed results with South Africa being stronger in most cases, while mangoes, avocados and preserved fruit display mixed results with Brazil being weaker in most cases. Table E.4 shows that with regard to the cereal industry, Brazil had performed well compared to South Africa throughout the period examined. Within this industry, Brazil had a comparative advantage in maize, rice, sorghum and wheat. South Africa had a comparative advantage in terms of oats in 2007 and in terms of millet from 2005 to 2008. Brazil had a comparative advantage in the sugar industry and in terms of individual products such as cane sugar and sugar confectionery, but with regard to sugar nes, South Africa performed extremely well compared to Brazil. When considering molasses, it had the upper hand only during the first two years (see Table E.5). Table E.6 reveals that South Africa had a comparative advantage over Brazil in terms of the beverages industry and products such as mineral water, non-alcoholic beverages, grape wine, fermented beverages, spirits and vinegar. South Africa had an advantage in terms of malt beer from 2001 to 2004 and in 2007, while Brazil had an advantage in terms of ethyl alcohol throughout the study period. The Brazilian tobacco industry had a comparative advantage over South African though. At product level Brazil had an advantage in tobacco refuse, while South Africa had an advantage in cigars throughout the study period and in snuff tobacco, in all the years, except 2001 (see Table E.7). 5.5 South Africa’s RCA indices: South Africa versus Chile Table F.1 reveals that the South African fish and crustaceans industry had a comparative disadvantage over that of Chile. Except for frozen fish and fish fillets, for which Chile had a comparative advantage over South Africa, all other products show mixed results with Chile having a comparative advantage over South Africa in most years. However, this is excludes crustaceans, for which South Africa had an advantage in most years. South Africa had a comparative advantage over Chile in terms of the vegetable and fruit foods industry (see Table F.2). Within this industry, South Africa had an advantage in vinegar preserved cucumber, preserved mushrooms, sugar preserved fruit, preserved fruit nes and fruit and vegetable juices. Jams, preserved vegetables (excluding frozen) and preserved tomato show mixed results and Chile had a comparative advantage in most years. According to Table F.3, the Chilean fruit industry had a comparative advantage over South Africa. At product level, South Africa had a comparative advantage only in bananas, citrus fruit and melons, while Chile had a comparative advantage in nuts nes, mangoes and avocados, apricots and peaches, fruit nes, frozen fruit and nuts, and citrus fruit and melon peel. Mangoes, avocados and preserved fruit and nuts show mixed results
Competitiveness of selected South African agricultural product exports in the EU-27
13
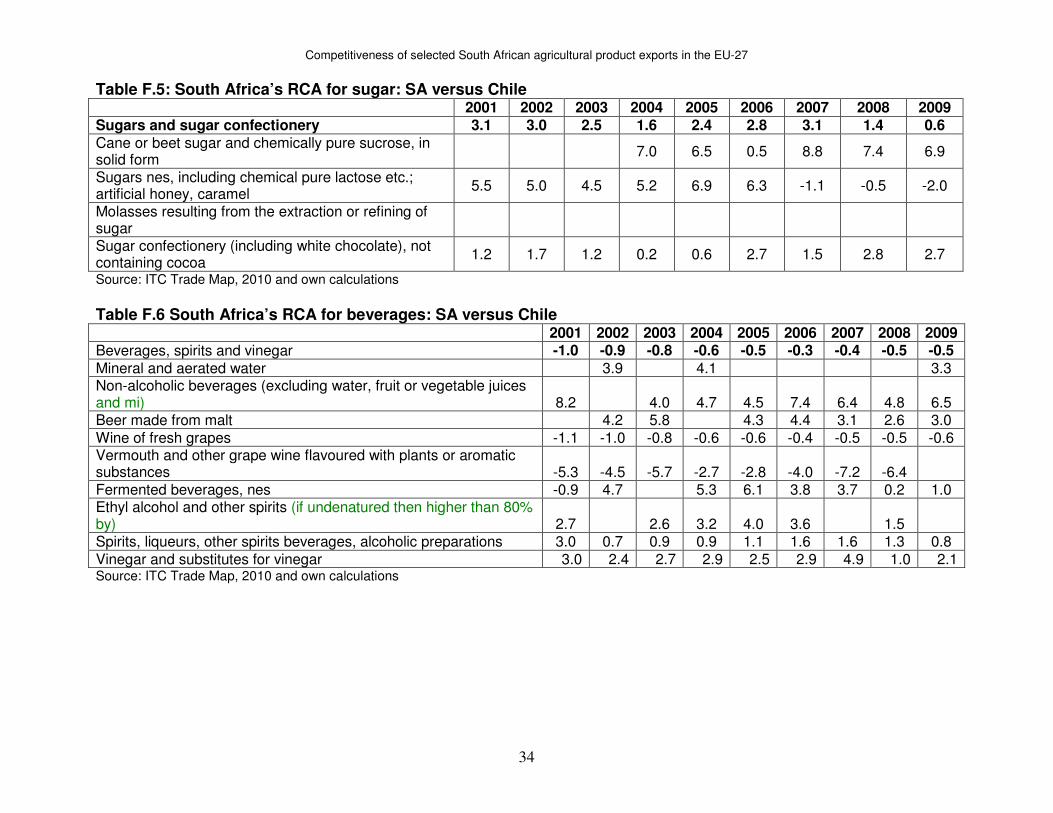
with South Africa having an advantage in most years, while in terms of grapes, apples and pears, Chile had a comparative advantage in most years. Table F.4 and F.5 presents revealed comparative advantage indices between South Africa and Chile between 2001 and 2009 for the cereal and sugar industries respectively. Chile had a comparative advantage over South Africa in the case of cereal, and individual products such as wheat, oats and maize. For millet, South Africa had the upper hand over Chile for the available year’s calculations, while Chile performed better than South Africa in 2001, 2002 and 2004 in terms of sorghum. As for the sugar industry, South Africa had a comparative advantage over Chile throughout the study period and in terms of cane sugar and sugar confectionery. In case of sugar nes, South Africa had the upper hand over Chile until 2006, but lost an edge starting from 2007. The results in Table F.6 and Table F.7 reveal that between 2001 and 2009, South Africa had a comparative advantage over Chile in terms of the tobacco industry, while Chile had a comparative advantage over South Africa in terms of the beverages industry. Apart from grape wine, flavoured grape wine and fermented beverages, South Africa had an advantage over Chile in all products within the beverages industry. In terms of fermented beverages, South Africa had an advantage in all years of the study period, except in 2001. For all cases reported for products falling within the tobacco industry, South Africa enjoyed the upper hand over Chile. 6. Conclusion This study has presented an analysis of the competitiveness of South Africa’s agricultural exports in the EU-27 markets between 2001 and 2009, using the CEP indices and RCA indices. The results in this study suggest that, in relation to world competition, South Africa has been competitive in the EU-27 in terms of fish and crustaceans, vegetable and fruit foods, fruit and beverages. Cereals, sugar and tobacco display a comparative disadvantage, which indicates that South Africa was uncompetitive in this regard. The results further show that South Africa was more competitive than Argentina only in terms of the beverages industry. South Africa was more competitive than Brazil with regard to the fish and crustaceans, fruit and beverages industries, while Brazil stayed stronger over South Africa with regard to the vegetable and fruit foods, cereals, sugar and tobacco industries. In comparison to Chile, South Africa stayed competitive in terms of the vegetable and fruit, sugar and tobacco industries, but less competitive in terms of the fish and crustaceans, fruit, cereals and beverages industries. South Africa had the upper hand over Australia in terms of fish and crustaceans, vegetable and fruit foods, fruit, sugar and tobacco. However, it stayed less competitive than Australia in terms of the cereals and beverages industries. On the basis of changing the dynamics of agricultural product markets and evolving product standards in the global and European Union, it remains critical to maintain
Competitiveness of selected South African agricultural product exports in the EU-27
14
and improve the competitiveness of South African agricultural exports in these markets. Some important factors to ensure improved competitiveness of South African agricultural exports, as identified by Ortmann (2005), include good governance at all levels of government and industry, institutional innovations for commercial and small-scale farmers, improving the quality of (school) education (particularly in mathematics and science) and skills training, promoting research in agriculture and farmers adopting new technologies.
Competitiveness of selected South African agricultural product exports in the EU-27
15
References Carraresi, L. & Banterle, A. 2008. Measuring competitiveness in the EU market: a comparison between food industry and agriculture. Paper for the 12th Congress of the European Association of Agricultural Economist-EAAE 2008.
Chitiga, M., Kandiero, T. & Ngwenya, P. 2008. Agricultural trade policy reform in South Africa. Agrekon, 47(1).
Daya, Y., Ranoto, T.R. & Letsoalo, M.A. 2006. Intra-Africa agricultural trade: A South African perspective. Department of Agriculture, Pretoria, South Africa.
Department of Agriculture Forestry and Fisheries (DAFF). 2010. Quarterly economic overview of the agriculture, forestry and fisheries sector: April 2010 to June 2010 8(2).
Edwards, L. & Schoer, V. 2001. The structure and competitiveness of South African trade. Paper for 2001annual forum of Trade and Industrial Policy Strategies (TIPS).www.tips.org.za/files/The_Structure_and_Competitiveness_of_South_African_Trade.pdf
Hallat, J., Van Schalkwyk H.D. & Taljaard P.R. Undated. Comparative advantage and competitive performance of the South African oilseed industry. University of Free State.
Kalaba, M. & Henneberry, S.R. 2001. The effects of free trade agreement on South African Agriculture: Competitiveness of fruits in the EU market. Agrekon, 40(4).
Kirsten, J.F. 1999. The agricultural input industry and the competitiveness of South African agriculture, Agrekon, 38(4).
Mosoma, K. 2004. Agricultural competitiveness and supply chain integration: South Africa, Argentina and Australia. Agrekon, 43(1).
Nordin, A.B.A., Shariff, F.M, Simeh, A.S. & Baharim, B. 2008. Future competitiveness of the Malaysian PKE. Oil Palm industry economic journal, 8(2).
Ortmann, G.F. 2000. Promoting competitiveness in South African agriculture and agribusiness: the role of institutions. Agrekon, 39(4).
Ortmann, G.F. 2005. Promoting the competitiveness of South African agriculture in a dynamic economic and political environment. Agrekon, 44(3).
Polymeros, K., Tsakiridou, E. & Mattas, K. Undated. Assessing the competitiveness of E.U Mediterranean fisheries and aquaculture industries. University of Thessaly, Greece.
Competitiveness of selected South African agricultural product exports in the EU-27
16
Sandrey, R., Jansen, H.G., Vink, N., Fundira, T., Meyer F., Hughes, C., Nyhodo, B. & Smit, L. 2008. South Africa’s way ahead, Looking East. Trade Law Centre for Southern Africa (Tralac).
Serin, V. & Civan, A. 2008. Revealed comparative advantage and competitiveness: A case study for Turkey towards the EU. Journal of Economic and Social Research, 10(2).
The Organization for Economic Co-operation and Development (OECD). 2005. Review of Agricultural Policies - South Africa: OECD. http://www.oecd.org/document/31/0,3343,en_2649_33797_36482847_1_1_1_1,00.html
The Organization for Economic Co-operation and Development (OECD). 2010. Competitiveness, productivity and efficiency in the agricultural and agri-food sectors: definition, measurement and evidence from a literature review. OECD working paper on agricultural policies and markets.
Tsikata, Y.M. 1999. Liberalization and trade performance in South Africa. The World Bank: Southern Africa Department, Informal discussion paper.
Vink, N., Tregurtha, N. & Kirsten, J. 2002. South Africa’s changing agricultural trade regime. Paper for 2002 annual forum of Trade and Industrial Policy Strategies (TIPS).
Warr, P.G. 1994. Comparative and competitive advantage. Asia-Pacific Economic Literature, 8(2).
Wikipedia 2010. Competitiveness. http://en.wikipedia.org/wiki/Competitiveness
Competitiveness of selected South African agricultural product exports in the EU-27
17
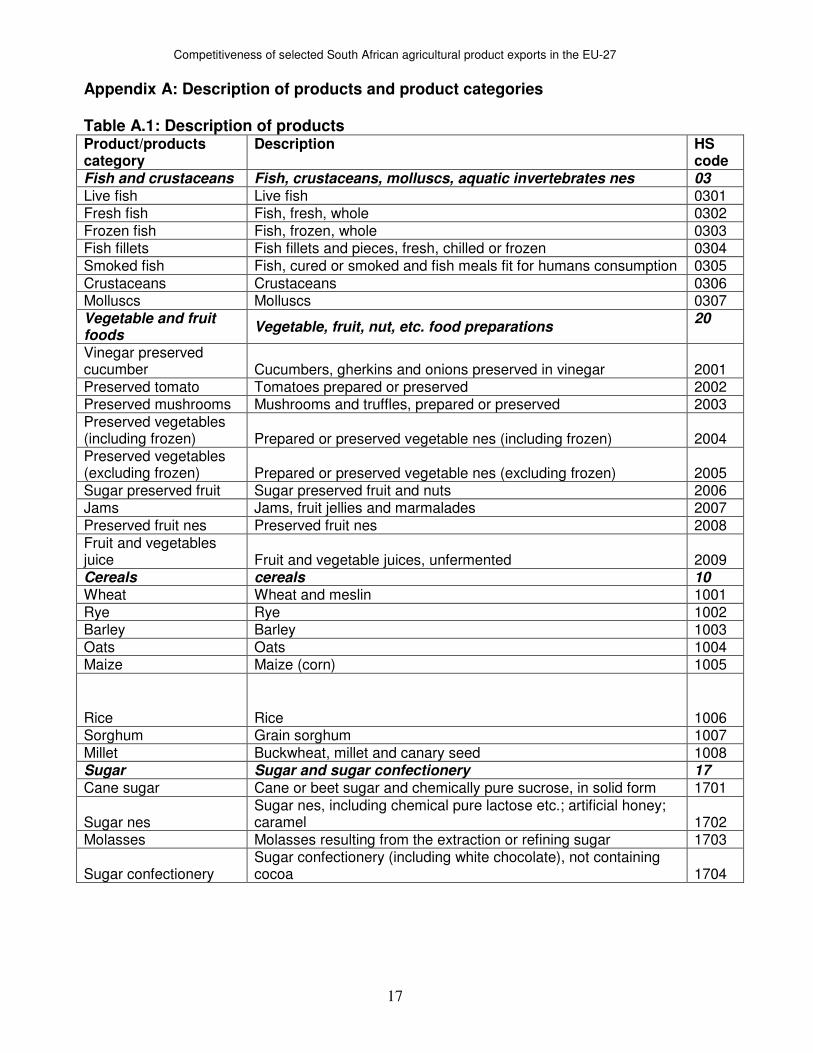
Appendix A: Description of products and product categories Table A.1: Description of products Product/products category
Description HS code
Fish and crustaceans Fish, crustaceans, molluscs, aquatic invertebrates nes 03 Live fish Live fish 0301 Fresh fish Fish, fresh, whole 0302 Frozen fish Fish, frozen, whole 0303 Fish fillets Fish fillets and pieces, fresh, chilled or frozen 0304 Smoked fish Fish, cured or smoked and fish meals fit for humans consumption 0305 Crustaceans Crustaceans 0306 Molluscs Molluscs 0307 Vegetable and fruit foods
Vegetable, fruit, nut, etc. food preparations 20
Vinegar preserved cucumber Cucumbers, gherkins and onions preserved in vinegar 2001 Preserved tomato Tomatoes prepared or preserved 2002 Preserved mushrooms Mushrooms and truffles, prepared or preserved 2003 Preserved vegetables (including frozen) Prepared or preserved vegetable nes (including frozen) 2004 Preserved vegetables (excluding frozen) Prepared or preserved vegetable nes (excluding frozen) 2005 Sugar preserved fruit Sugar preserved fruit and nuts 2006 Jams Jams, fruit jellies and marmalades 2007 Preserved fruit nes Preserved fruit nes 2008 Fruit and vegetables juice Fruit and vegetable juices, unfermented 2009 Cereals cereals 10 Wheat Wheat and meslin 1001 Rye Rye 1002 Barley Barley 1003 Oats Oats 1004 Maize Maize (corn) 1005
Rice Rice 1006 Sorghum Grain sorghum 1007 Millet Buckwheat, millet and canary seed 1008 Sugar Sugar and sugar confectionery 17 Cane sugar Cane or beet sugar and chemically pure sucrose, in solid form 1701
Sugar nes Sugar nes, including chemical pure lactose etc.; artificial honey; caramel 1702
Molasses Molasses resulting from the extraction or refining sugar 1703
Sugar confectionery Sugar confectionery (including white chocolate), not containing cocoa 1704
Competitiveness of selected South African agricultural product exports in the EU-27
18
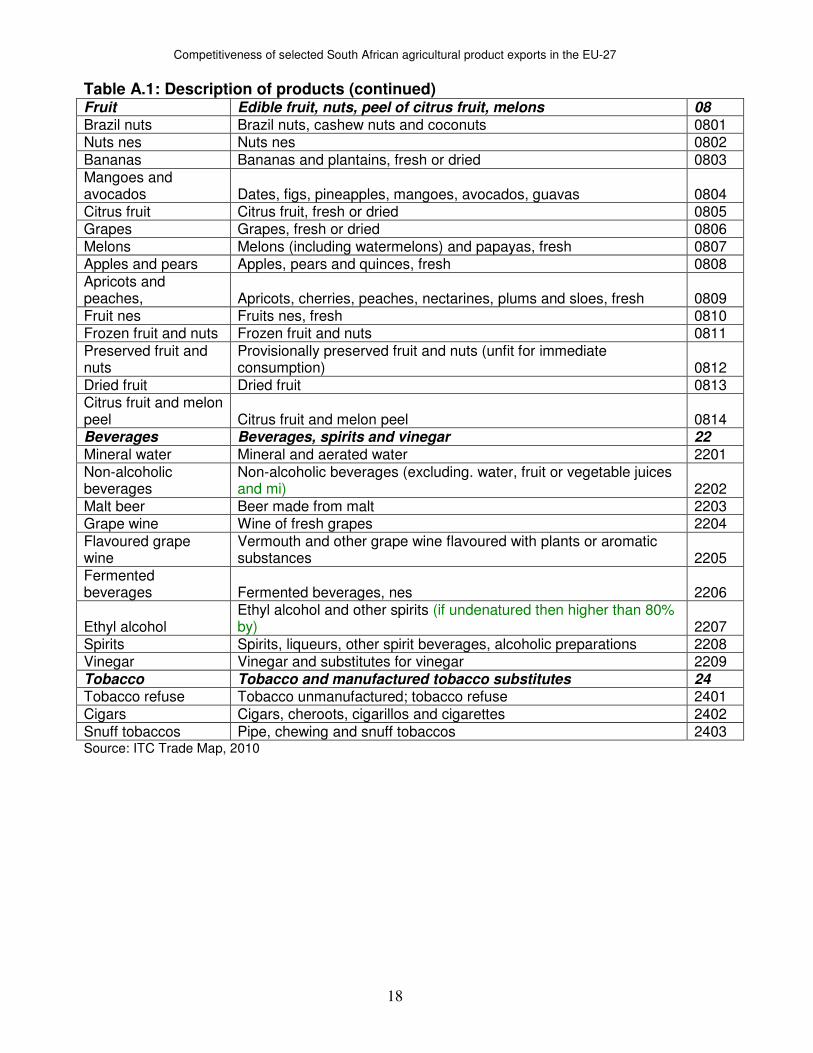
Table A.1: Description of products (continued) Fruit Edible fruit, nuts, peel of citrus fruit, melons 08 Brazil nuts Brazil nuts, cashew nuts and coconuts 0801 Nuts nes Nuts nes 0802 Bananas Bananas and plantains, fresh or dried 0803 Mangoes and avocados Dates, figs, pineapples, mangoes, avocados, guavas 0804 Citrus fruit Citrus fruit, fresh or dried 0805 Grapes Grapes, fresh or dried 0806 Melons Melons (including watermelons) and papayas, fresh 0807 Apples and pears Apples, pears and quinces, fresh 0808 Apricots and peaches, Apricots, cherries, peaches, nectarines, plums and sloes, fresh 0809 Fruit nes Fruits nes, fresh 0810 Frozen fruit and nuts Frozen fruit and nuts 0811 Preserved fruit and nuts
Provisionally preserved fruit and nuts (unfit for immediate consumption) 0812
Dried fruit Dried fruit 0813 Citrus fruit and melon peel Citrus fruit and melon peel 0814 Beverages Beverages, spirits and vinegar 22 Mineral water Mineral and aerated water 2201 Non-alcoholic beverages
Non-alcoholic beverages (excluding. water, fruit or vegetable juices and mi) 2202
Malt beer Beer made from malt 2203 Grape wine Wine of fresh grapes 2204 Flavoured grape wine
Vermouth and other grape wine flavoured with plants or aromatic substances 2205
Fermented beverages Fermented beverages, nes 2206
Ethyl alcohol Ethyl alcohol and other spirits (if undenatured then higher than 80% by) 2207
Spirits Spirits, liqueurs, other spirit beverages, alcoholic preparations 2208 Vinegar Vinegar and substitutes for vinegar 2209 Tobacco Tobacco and manufactured tobacco substitutes 24 Tobacco refuse Tobacco unmanufactured; tobacco refuse 2401 Cigars Cigars, cheroots, cigarillos and cigarettes 2402 Snuff tobaccos Pipe, chewing and snuff tobaccos 2403 Source: ITC Trade Map, 2010
Competitiveness of selected South African agricultural product exports in the EU-27
19
Appendix B: South Africa’s RCA index: South Africa vs. the world
Table B.1: Comparative Export Performance Index (ECI) for fish and crustaceans 2001 2002 2003 2004 2005 2006 2007 2008 2009
Argentina 2.89 2.42 2.69 2.55 2.38 2.70 2.34 2.30 2.12
Australia -0.64 -1.32 -0.41 -0.21 -0.25 -0.87 -1.42 -1.48 -1.59 Brazil -0.17 -0.00 0.34 0.35 0.27 -0.02 -0.55 -0.90 -1.26
Chile 1.86 1.93 1.90 1.79 1.96 1.66 1.61 1.67 1.65 South Africa 0.85 1.03 1.11 0.97 0.80 0.59 0.74 0.88 0.80 Source: ITC Trade Map, 2010 and own calculations
Table B.2: Comparative Export Performance Index (ECI) for vegetable and fruit foods
2001 2002 2003 2004 2005 2006 2007 2008 2009 Argentina 1.28 1.00 1.36 1.49 1.53 1.72 1.68 1.67 1.71 Australia -0.74 -0.73 -0.57 -0.66 -0.85 -1.21 -1.32 -1.65 -1.78
Brazil 2.21 2.34 2.27 2.02 1.90 2.08 2.16 1.96 1.83 Chile -1.11 -0.67 -0.78 -1.48 -1.06 -1.15 -0.80 -0.67 -0.55
South Africa 0.60 0.69 0.84 0.62 0.60 0.63 0.33 0.32 0.62 Source: ITC Trade Map, 2010 and own calculations
Table B.3: Comparative Export Performance Index (ECI) for cereals
2001 2002 2003 2004 2005 2006 2007 2008 2009 Argentina 2.20 2.18 2.44 2.37 2.24 1.88 2.60 2.89 0.82
Australia -1.21 -2.38 -2.94 -2.07 -1.53 -2.11 -1.69 -0.96 0.49 Brazil 1.05 -0.33 1.15 1.45 -1.46 0.54 2.22 1.46 -0.80
Chile -0.19 -0.04 -0.04 0.08 -0.06 -0.73 -1.49 -0.90 0.67 South Africa -3.34 -3.25 -2.90 -3.26 -4.24 -1.15 -4.97 -4.88 -2.93 Source: ITC Trade Map, 2010 and own calculations
Table B.4: Comparative Export Performance Index (ECI) for sugar
2001 2002 2003 2004 2005 2006 2007 2008 2009
Argentina -1.20 -1.38 -1.64 -1.50 -0.74 -0.12 -0.46 -0.85 -0.50 Australia -3.65 -2.88 -2.36 -1.15 -1.76 -2.26 -1.69 -2.20 -2.06
Brazil 1.30 0.65 1.01 0.47 0.39 0.77 0.68 0.79 0.78 Chile -3.99 -4.02 -4.07 -3.52 -4.34 -5.53 -4.03 -3.85 -3.12
South Africa -0.94 -0.98 -1.60 -1.87 -1.95 -2.69 -0.91 -2.40 -2.52 Source: ITC Trade Map, 2010 and own calculations
Table B.5: Comparative Export Performance Index (ECI) for fruit
2001 2002 2003 2004 2005 2006 2007 2008 2009 Argentina 2.20 1.78 1.85 1.92 2.03 1.89 1.85 1.96 1.68
Australia -0.78 -0.67 -0.73 -0.39 -0.28 -0.66 -0.33 -0.77 -0.59 Brazil 0.46 0.51 0.67 0.61 0.71 0.68 0.75 0.66 0.57
Chile 2.05 2.23 2.37 2.11 2.04 1.77 1.84 2.07 2.40 South Africa 1.62 1.63 1.78 1.95 1.85 1.61 1.83 1.74 2.04 Source: ITC Trade Map, 2010 and own calculations
Competitiveness of selected South African agricultural product exports in the EU-27
20
Table B.6 Comparative Export Performance Index (ECI) for beverages 2001 2002 2003 2004 2005 2006 2007 2008 2009
Argentina 0.60 0.24 0.47 0.72 0.92 0.87 0.83 0.72 0.74
Australia 2.27 2.30 2.20 2.59 2.49 2.27 2.36 1.99 1.93 Brazil -1.96 -1.36 -1.00 -0.58 -0.09 0.22 0.46 0.78 0.35
Chile 2.11 2.19 2.21 2.05 1.95 1.54 1.70 1.73 2.07 South Africa 1.11 1.26 1.46 1.46 1.41 1.23 1.28 1.27 1.57 Source: ITC Trade Map, 2010 and own calculations
Table B.7 Comparative Export Performance Index (ECI) for tobacco
2001 2002 2003 2004 2005 2006 2007 2008 2009
Argentina 1.34 1.13 1.25 1.30 1.42 1.60 1.45 1.49 1.54 Australia -4.43 -5.19 -5.57 -4.98 -5.06 -4.51 -4.28 -4.26 -3.88
Brazil 1.85 1.83 1.75 1.76 1.95 2.15 2.09 2.10 2.36 Chile -4.70 -3.77 -6.68 -9.68 -9.62 -3.29
South Africa -1.21 -1.71 -2.33 -2.05 -1.63 -1.79 -2.04 -1.53 -0.78 Source: ITC Trade Map, 2010 and own calculations
Competitiveness of selected South African agricultural product exports in the EU-27
21
Appendix C: South Africa’s RCA index: South Africa versus Argentina Table C.1: South Africa’s RCA for fish and crustaceans: SA versus Argentina 2001 2002 2003 2004 2005 2006 2007 2008 2009
Fish, crustaceans, molluscs, aquatic invertebrates nes -2.0 -1.4 -1.6 -1.6 -1.6 -2.1 -1.6 -1.4 -1.3
Live fish 0.6 0.3 1.6 0.8 0.1 1.0 2.9 -0.7 1.1 Fish, fresh, whole 2.3 2.7 2.2 1.6 1.8 2.0 2.0 1.7 1.5
Fish, frozen, whole -1.1 -0.9 -0.9 -1.2 -1.0 -1.4 -1.1 -0.9 -0.7 Fish fillets and pieces, fresh, chilled or frozen -1.1 -1.2 -1.2 -1.7 -1.7 -2.3 -1.6 -0.9 -1.0
Fish, cured or smoked and fish meals fit for human consumption -6.1 -5.9 -6.7 -6.1 -10.2 -6.0 -3.7 -4.5 Crustaceans -4.8 -4.0 -4.4 -3.6 -2.8 -4.1 -3.6 -4.1 -3.9
Molluscs -2.3 -1.1 -0.8 -1.1 -2.0 -2.0 -0.9 -1.0 -0.6 Source: ITC Trade Map, 2010 and own calculations
Table C.2: South Africa’s RCA for vegetable and fruit foods: SA versus Argentina 2001 2002 2003 2004 2005 2006 2007 2008 2009 Vegetable, fruit, nut, etc food preparations -0.7 -0.3 -0.5 -0.9 -0.9 -1.1 -1.4 -1.3 -1.1
Cucumbers, gherkins and onions preserved in vinegar 1.0 6.3 1.9 7.9 6.5 6.0 8.6 Tomatoes, prepared or preserved 0.5 1.0 -3.8 -4.3 -5.1 -8.1 -3.0 -3.2 -3.4
Mushrooms and truffles, prepared or preserved 6.3 Prepared or preserved vegetables nes (including frozen) -1.7 -0.6 -0.8 -4.4 3.6 -0.4 Prepared or preserved vegetables nes (excluding frozen) 0.1 0.9 0.0 -0.2 -0.7 -2.5 -2.1 -0.9 -0.8
Sugar preserved fruit and nuts 3.9 2.6 1.8 0.7 2.1 0.0 0.4 -0.6 2.1 Jams,fruit jellies and marmalades -0.8 -1.5 -1.3 -1.2 -0.7 -0.6 -0.3 -1.0 -0.1
Preserved fruit nes -0.7 -0.1 -0.3 -0.8 -1.0 -1.4 -1.5 -1.6 -1.1 Fruit and vegetable juices, unfermented -0.8 -0.7 -0.5 -1.0 -0.8 -0.4 -1.1 -1.2 -1.4 Source: ITC Trade Map, 2010 and own calculations
Competitiveness of selected South African agricultural product exports in the EU-27
22
Table C.3: South Africa’s RCA for fruit: SA vs. Argentina 2001 2002 2003 2004 2005 2006 2007 2008 2009
Edible fruit, nuts, peel of citrus fruit, melons -0.6 -0.1 -0.1 0.0 -0.2 -0.3 0.0 -0.2 0.4
Brazil nuts, cashew nuts and coconuts Nuts nes 2.8 3.3 2.5 3.0 1.5 1.4 1.0 1.6
Bananas and plantains, fresh or dried Dates, figs, pineapples, mangoes, avocados and guavas 2.9 3.5 3.5 2.7 2.4 1.7 2.0 2.6 2.2
Citrus fruit, fresh or dried -0.9 -0.5 -0.6 -0.4 -0.5 -0.5 -0.3 -0.7 0.0 Grapes, fresh or dried 0.7 0.8 1.1 1.2 1.0 0.6 1.2 1.0 1.7
Melons (including watermelons) and papayas, fresh 1.4 4.3 0.5 -0.7 -2.7 -2.5 0.9 3.4 Apples, pears and quinces, fresh -1.4 -0.7 -0.5 -0.4 -0.8 -0.7 -0.4 -0.5 -0.1 Apricots, cherries, peaches, nectarines, plums and sloes, fresh 0.0 0.2 0.4 0.4 0.3 -0.1 0.2 0.5 1.5
Fruit nes, fresh 0.8 0.7 1.3 -0.1 -0.8 -1.0 -1.1 -0.8 -0.4 Frozen fruit and nuts 2.4 0.1 1.2 2.6 1.5 0.8 0.3 1.0 Provisionally preserved fruit and nuts (unfit for immediate consumption) 1.6 1.7 Dried fruit -1.7 -2.2 -2.4 -2.4 -3.0 -3.2 -2.5 -2.5 -2.4 Citrus fruit and melon peel 2.1 0.6 -0.1 -2.8 2.6 Source: ITC Trade Map, 2010 and own calculations
Table C.4: South Africa’s RCA for cereals: SA versus Argentina 2001 2002 2003 2004 2005 2006 2007 2008 2009
Cereals -5.5 -5.4 -5.3 -5.6 -6.5 -3.0 -7.6 -7.8 -3.8
Wheat and meslin -7.1 -9.6
Rye Barley
Oats -3.5 -4.1 -2.5 -3.0 -6.1 -4.9 Maize (corn) -5.5 -5.4 -5.3 -5.6 -6.4 -3.0 -8.1 -7.7 -3.6 Rice -4.4 -2.7 -2.5 -2.6 -3.3 -6.2 -2.3 -6.4 -5.2
Grain sorghum -8.8 -2.5 -4.9 -6.6 -9.1 Buckwheat, millet and canary seed -4.5 -5.3 -3.3 -7.2 -5.9 -5.9 -5.6 -4.8 -7.1 Source: ITC Trade Map, 2010 and own calculations
Competitiveness of selected South African agricultural product exports in the EU-27
23
Table C.5: South Africa’s RCA for sugar: SA versus Argentina 2001 2002 2003 2004 2005 2006 2007 2008 2009
Sugars and sugar confectionery 0.3 0.4 0.0 -0.4 -1.2 -2.6 -0.5 -1.6 -2.0
Cane or beet sugar and chemically pure sucrose, in solid form 0.5 0.1 1.0 0.0 -2.4 -5.2 0.0 -1.8 -2.6 Sugars nes, including chemical pure lactose etc.; artificial honey;caramel 2.5 1.7 1.8 6.6 3.8 1.0 5.0 Molasses resulting from the extraction or refining of sugar Sugar confectionery (including white chocolate), not containing cocoa -0.9 -0.3 -1.0 -1.5 -1.9 -1.9 -2.3 -1.5 -1.1 Source: ITC Trade Map, 2010 and own calculations
Table C.6 South Africa’s RCA for beverages: SA versus Argentina 2001 2002 2003 2004 2005 2006 2007 2008 2009 Beverages, spirits and vinegar 0.5 1.0 1.0 0.7 0.5 0.4 0.5 0.5 0.8
Mineral and aerated water 3.8 2.4 2.5 1.0 1.3 0.3 1.7 Non-alcoholic beverages (excluding water, fruit or vegetable juices and mi
4.7 0.9 -0.6 -1.0 3.8 4.2 4.9 4.4 6.1
Beer made from malt 0.7 0.1 1.0 0.2 -0.6 -0.7 -1.6 -2.0 -1.9 Wine of fresh grapes 0.4 1.0 1.0 0.8 0.5 0.3 0.4 0.5 0.9
Vermouth and other grape wine flavoured with plants or aromatic substances
-2.1 -0.9 -2.6 -0.6 1.9 -3.3 -5.1 -2.9
Fermented beverages nes 5.0 4.5 2.9 1.7 3.5 3.5 2.9 4.4 5.5 Ethyl alcohol and other spirits (if undenatured then higher than 80% by)
2.5 5.2 0.1 0.3 0.4 -1.4
Spirits, liqueurs, other spirits beverages, alcoholic preparations 0.5 0.3 0.3 0.4 0.0 0.1 0.5 0.6 1.3
Vinegar and substitutes for vinegar 3.0 2.9 4.4 3.7 Source: ITC Trade Map, 2010 and own calculations
Table C.7 South Africa’s RCA for tobacco: SA versus Argentina 2001 2002 2003 2004 2005 2006 2007 2008 2009 Tobacco and manufactured tobacco substitutes -2.5 -2.8 -3.6 -3.3 -3.1 -3.4 -3.5 -3.0 -2.3
Tobacco unmanufactured; tobacco refuse -2.7 -3.1 -3.6 -3.4 -3.5 -3.5 -3.6 -3.2 -2.4
Cigars, cheroots, cigarillos and cigarettes 4.3 4.0 3.0 -1.1 -0.2 -2.5 -2.7 Pipe, chewing and snuff tobaccos 2.9 -3.0 3.2 2.4 Source: ITC Trade Map, 2010 and own calculations
Competitiveness of selected South African agricultural product exports in the EU-27
24
Appendix D: South Africa’s RCA index: South Africa versus Australia Table D.1: South Africa’s RCA for fish and crustaceans: SA versus Australia 2001 2002 2003 2004 2005 2006 2007 2008 2009
Fish, crustaceans, molluscs, aquatic invertebrates nes 1.5 2.4 1.5 1.2 1.1 1.5 2.2 2.4 2.4 Live fish -0.9 -2.6 -0.2 -2.2 -1.7 -0.4 -1.9 -3.7 -2.4 Fish, fresh, whole 3.9 4.0 4.3 3.8 3.5 3.5 2.6 2.2 1.7
Fish, frozen, whole 3.4 3.4 1.9 3.2 2.0 4.6 3.3 4.4 4.0 Fish fillets and pieces, fresh, chilled or frozen 3.0 2.8 3.1 2.6 3.9 4.1 3.7 4.9 4.0
Fish, cured or smoked and fish meals fit for human consumption -0.6 -0.4 -0.5 0.0 -4.9 -2.3 0.6 -0.9 Crustaceans -1.7 -0.7 -1.7 -1.6 -1.7 -1.1 -0.3 -0.7 -0.1
Molluscs 4.1 4.4 5.4 3.0 2.0 2.5 5.1 8.0 6.1 Source: ITC Trade Map, 2010 and own calculations
Table D.2: South Africa’s RCA for vegetable and fruit foods: SA versus Australia 2001 2002 2003 2004 2005 2006 2007 2008 2009 Vegetable, fruit, nut, etc food preparations 1.3 1.4 1.4 1.3 1.5 1.8 1.7 2.0 2.4
Cucumbers, gherkins and onions preserved in vinegar 1.66 2.15 4.31 4.03 3.54 4.94 4.32 5.48 5.54 Tomatoes, prepared or preserved 1.76 -0.57 -2.18 -0.97 -4.25 -7.69 -2.43 -2.39 -1.39
Mushrooms and truffles, prepared or preserved 4.94 Prepared or preserved vegetables nes (including frozen) 4.10 0.92 -2.28 -5.55 1.21 0.99 -1.22 -0.97 Prepared or preserved vegetables nes (excluding frozen) 2.50 3.78 2.76 2.10 2.37 2.40 1.81 2.13 2.06
Sugar preserved fruit and nuts -2.87 -2.85 -3.12 -3.82 -3.96 -3.98 -4.27 -4.65 -3.73 Jams, fruit jellies and marmalades 0.71 0.37 2.74 0.08 0.28 0.83 0.47 0.69 1.28
Preserved fruit nes 1.06 1.24 1.48 1.36 1.44 1.71 1.82 2.25 2.69 Fruit and vegetable juices, unfermented 3.83 3.52 2.90 2.55 3.47 4.13 2.65 2.46 4.10 Source: ITC Trade Map, 2010 and own calculations
Competitiveness of selected South African agricultural product exports in the EU-27
25
Table D.3: South Africa’s RCA for fruit: SA versus Australia 2001 2002 2003 2004 2005 2006 2007 2008 2009
Edible fruit, nuts, peel of citrus fruit, melons 2.5 2.1 2.3 2.2 2.0 2.1 2.0 3.0
Brazil nuts, cashew nuts and coconuts -2.3 -0.4 -3.8 -1.6 Nuts nes -1.0 -0.9 -0.6 -1.0 -0.5 -0.5 -1.2 -0.8 -0.6
Bananas and plantains, fresh or dried 0.4 Dates, figs, pineapples, mangoes, avocados and guavas 3.7 4.1 4.0 3.0 3.5 3.4 4.0 4.0 4.2
Citrus fruit, fresh or dried 4.4 4.6 4.2 4.2 4.0 4.1 3.4 4.3 4.2 Grapes, fresh or dried 3.3 2.6 2.9 2.9 2.5 2.8 3.0 3.3 3.2
Melons (including watermelons) and papayas, fresh 4.1 3.8 5.2 4.1 Apples, pears and quinces, fresh 2.2 2.7 2.7 3.3 3.3 3.1 4.5 4.3 5.0 Apricots, cherries, peaches, nectarines, plums and sloes, fresh 2.7 2.7 2.8 2.3 1.9 1.6 1.8 2.2 2.9 Fruit nes, fresh 1.0 1.5 3.6 1.6 1.0 1.8 1.7 1.8 2.2
Frozen fruit and nuts 3.5 4.0 2.5 4.3 7.4 3.5 4.2 3.9 1.7 Provisionally preserved fruit and nuts (unfit for immediate consumption) 0.6 4.4 Dried fruit 2.6 1.7 1.8 1.4 1.3 2.5 2.0 2.3 1.8
Citrus fruit and melon peel 4.4 Source: ITC Trade Map, 2010 and own calculations
Table D.4: South Africa’s RCA for cereals: SA versus Australia 2001 2002 2003 2004 2005 2006 2007 2008 2009 Cereals -2.1 -0.9 0.0 -1.2 -2.7 1.0 -3.3 -3.9 -3.4
Wheat and meslin -5.1 -7.9 Rye
Barley Oats -5.6 -6.5 -5.1 0.4 -2.7 -4.5 Maize (corn) 3.2 3.6 2.2 2.5 0.3 3.3 -1.4 -0.6 4.5
Rice -5.7 -2.1 -3.5 0.7 0.5 Grain sorghum -4.0 -4.7 -4.5 -4.9 -1.4 0.1 -2.4
Buckwheat, millet and canary seed -3.6 -5.1 -2.9 -7.4 -5.3 -4.6 -3.4 -5.7 -7.2 Source: ITC Trade Map, 2010 and own calculations
Competitiveness of selected South African agricultural product exports in the EU-27
26
Table D.5: South Africa’s RCA for sugar: SA vs Australia 2001 2002 2003 2004 2005 2006 2007 2008 2009
Sugars and sugar confectionery 2.7 1.9 0.8 -0.7 -0.2 -0.4 0.8 -0.2 -0.5 Cane or beet sugar and chemically pure sucrose, in solid form 4.4 1.2 2.8 0.5 0.2 -1.2 5.1 1.4 2.6 Sugarsnes,including chemical pure lactose, etc.; artificial honey; caramel 7.1 4.5 3.4 2.6 -0.2 2.8 -2.7 0.5 1.5 Molasses resulting from the extraction or refining of sugar 4.3 -1.1 -2.2 4.4 3.0 -0.9 -1.1 Sugar confectionery (including white chocolate), not containing cocoa 1.0 1.6 -0.1 -1.6 -1.4 -1.4 -1.6 -1.0 -1.2 Source: ITC Trade Map, 2010 and own calculations
Table D.6 South Africa’s RCA for beverages: SA versus Australia 2001 2002 2003 2004 2005 2006 2007 2008 2009 Beverages, spirits and vinegar -1.2 -1.0 -0.7 -1.1 -1.1 -1.0 -1.1 -0.7 -0.4
Mineral and aerated water 0.1 1.9 -1.3 0.1 0.6 1.1 0.9 0.5 1.4 Non-alcoholic beverages (excluding water, fruit or vegetable juices and mi) 3.5 2.2 1.2 0.7 1.4 1.4 1.2 1.0 0.7 Beer made from malt -0.7 -1.2
Wine of fresh grapes -1.3 -1.1 -0.8 -1.2 -1.1 -1.1 -1.1 -0.8 -0.4 Vermouth and other grape wine flavoured with plants or aromatic substances 0.6 -0.1 1.8 -3.6 -3.8 Fermented beverages, nes -2.2 -1.1 2.9 1.2 1.7 2.6 4.3 5.0 4.3 Ethyl alcohol and other spirits (if undenatured then higher than 80% by) 4.0 4.5 4.4 6.5 5.0 2.6 1.7 0.4 Spirits, liqueurs, other spirits beverages, alcoholic preparations 2.3 1.8 0.6 1.1 1.2 0.1 -0.2 -0.4 -0.3
Vinegar and substitutes for vinegar -0.1 -0.5 0.4 1.4 -1.3 0.4 3.1 2.2 1.4 Source: ITC Trade Map, 2010 and own calculations
Competitiveness of selected South African agricultural product exports in the EU-27
27
Table D.7 South Africa’s RCA for tobacco: SA versus Australia 2001 2002 2003 2004 2005 2006 2007 2008 2009 Tobacco and manufactured tobacco substitutes 3.2 3.5 3.2 2.9 3.4 2.7 2.2 2.7 3.1
Tobacco unmanufactured; tobacco refuse 6.2 3.8 Cigars, cheroots, cigarillos and cigarettes 4.9 3.2 1.3 0.3 1.3 1.3 0.1 -1.6 -2.0 Pipe, chewing and snuff tobaccos -4.0 0.0 -1.3 -0.8 3.2 -0.9 0.4 2.6 2.2 Source: ITC Trade Map, 2010 and own calculations
Competitiveness of selected South African agricultural product exports in the EU-27
28
Appendix E: South Africa’s RCA index: South Africa versus Brazil Table E.1: South Africa’s RCA for fish and crustaceans: SA versus Brazil 2001 2002 2003 2004 2005 2006 2007 2008 2009
Fish, crustaceans, molluscs, aquatic invertebrates nes 1.0 1.0 0.8 0.6 0.5 0.6 1.3 1.8 2.1
Live fish -2.8 -4.3 -2.6 -3.7 -3.7 -2.5 -2.6 -4.4 -2.8 Fish, fresh, whole 3.0 2.6 2.3 1.9 1.9 2.3 2.5 2.5 2.6
Fish, frozen, whole 1.0 1.5 1.6 1.6 1.3 1.1 1.2 1.9 1.7 Fish fillets and pieces, fresh, chilled or frozen 3.1 3.6 3.2 2.4 2.5 1.6 2.5 3.6 3.7
Fish, cured or smoked and fish meals fit for human consumption 2.3 0.7 1.7 -3.8 4.3 5.8 Crustaceans -1.9 -2.1 -2.5 -2.1 -2.2 -1.9 -1.0 -1.1 -0.4
Molluscs 4.0 4.6 4.7 3.1 3.4 3.6 3.7 3.1 3.3 Source: ITC Trade Map, 2010 and own calculations
Table E.2: South Africa’s RCA for vegetable and fruit foods: SA versus Brazil 2001 2002 2003 2004 2005 2006 2007 2008 2009
Vegetable, fruit, nut, etc., food preparations -1.6 -1.7 -1.4 -1.4 -1.3 -1.4 -1.8 -1.6 -1.2
Cucumbers, gherkins and onions preserved by vinegar 7.4 5.8 5.9 7.1 5.8 5.6 5.5 5.9
Tomatoes, prepared or preserved 6.2 6.7 1.2 -1.6 5.2 4.3
Mushrooms and truffles, prepared or preserved 0.5 4.2 4.5 7.5 6.9
Prepared or preserved vegetables nes (including frozen) 2.8 0.9 2.9 1.3 4.6 4.9
Prepared or preserved vegetables nes (excluding frozen) 7.0 6.7 3.9 4.0 4.0 4.7 4.5 3.3 2.5
Sugar preserved fruit and nuts 2.8 2.2 0.8 0.4 0.3 -0.5 -0.5 0.2 0.4
Jams, fruit jellies and marmalades 1.6 1.5 2.0 1.4 1.1 0.6 0.9 1.2 1.4
Preserved fruit nes 2.6 2.9 3.0 3.0 2.7 2.6 2.8 2.8 3.3
Fruit and vegetable juices, unfermented -2.7 -2.9 -2.9 -3.0 -2.6 -2.4 -3.2 -3.0 -2.7 Source: ITC Trade Map, 2010 and own calculations
Competitiveness of selected South African agricultural product exports in the EU-27
29
Table E.3: South Africa’s RCA for fruit: SA versus Brazil 2001 2002 2003 2004 2005 2006 2007 2008 2009
Edible fruit, nuts, peel of citrus fruit, melons 3.7 3.6 4.0 4.2 3.8 3.8 4.0 4.1 4.0
Brazil nuts, cashew nuts and coconuts -6.7 -7.3 -5.3 -9.8 -7.6 -9.0 -9.7 Nuts nes 9.2 6.0 5.0 3.7 4.8 3.4 4.2 4.3 4.4
Bananas and plantains, fresh or dried -4.7 -5.6 -5.8 -4.6 -6.4 -4.5 -5.1 Dates, figs, pineapples, mangoes, avocados and guavas -0.2 0.3 0.1 -0.1 0.1 -0.5 -0.2 -0.3 -0.2
Citrus fruit, fresh or dried 1.7 2.3 2.1 2.3 2.3 1.8 2.3 2.4 2.6 Grapes, fresh or dried 2.4 1.8 1.6 2.3 1.6 1.5 1.4 1.5 2.2
Melons (including watermelons) and papayas, fresh -4.5 -4.5 -5.0 -5.3 -6.8 -6.6 -4.5 -4.0 -3.5 Apples, pears and quinces, fresh 1.8 1.5 1.8 1.5 1.8 2.0 1.9 1.7 2.3 Apricots, cherries, peaches, nectarines, plums and sloes, fresh 9.5 7.4 9.0 7.2 8.9
Fruits nes, fresh 2.2 2.3 3.0 2.4 2.4 2.3 2.3 1.8 3.4 Frozen fruits and nuts 0.4 0.4 -0.4 0.6 0.5 0.5 0.6 0.0 0.5
Provisionally preserved fruit and nuts (unfit for immediate consumption) -1.1 -0.3 0.9 -3.3 -3.7 -1.3 -6.1 Dried fruit 5.0 4.4 4.1 3.7 4.4 3.0 1.6 Citrus fruit and melon peel -2.3 -3.0 -1.7 -4.0 -3.4 -0.2 Source: ITC Trade Map, 2010 and own calculations
Table E.4: South Africa’s RCA for cereals: SA versus Brazil 2001 2002 2003 2004 2005 2006 2007 2008 2009
Cereals -4.4 -2.9 -4.1 -4.7 -2.8 -1.7 -7.2 -6.3 -2.1
Wheat and meslin -10.8
Rye
Barley
Oats 0.1 -6.0 -4.8
Maize (corn) -4.4 -2.9 -3.9 -4.4 -2.2 -1.6 -7.8 -6.4 -2.0
Rice -3.4 -1.5 -2.2 -1.1 -1.1 -1.2 -3.1 -5.7 -3.9
Grain sorghum -5.4 -8.1 -6.4 -4.8 -3.4
Buckwheat, millet and canary seed -2.6 1.9 2.3 2.6 3.1 -0.5 Source: ITC Trade Map, 2010 and own calculations
Competitiveness of selected South African agricultural product exports in the EU-27
30
Table E.5: South Africa’s RCA for sugar: SA versus Brazil 2001 2002 2003 2004 2005 2006 2007 2008 2009
Sugars and sugar confectionery -2.2 -1.6 -2.6 -2.3 -2.3 -3.5 -1.6 -3.2 -3.3
Cane or beet sugar and chemically pure sucrose, in solid form -2.6 -2.7 -3.2 -3.2 -3.8 -6.3 -1.6 -3.8 -4.0 Sugars nes, including chemical pure lactose etc.; artificial honey, caramel 3.4 2.6 2.4 3.3 2.7 2.3 0.2 1.3 0.4
Molasses resulting from the extraction or refining of sugar 4.0 1.9 -2.2 1.6 -0.4 -1.4 -0.7 -2.9 -5.1 Sugar confectionery (including white chocolate), not containing cocoa -0.9 -0.2 -0.9 -1.1 -1.7 -1.5 -1.1 -0.8 -0.8 Source: ITC Trade Map, 2010 and own calculations
Table E.6 South Africa’s RCA for beverages: SA versus Brazil 2001 2002 2003 2004 2005 2006 2007 2008 2009
Beverages, spirits and vinegar 3.1 2.6 2.5 2.0 1.5 1.0 0.8 0.5 1.2
Mineral and aerated water 3.1 3.8 3.9 5.7 5.7 Non-alcoholic beverages (excluding) water, fruit or vegetable juices and mi 4.9 4.0 3.1 2.6 2.7 3.2 2.9 3.4 3.6 Beer made from malt 1.8 1.4 2.0 1.8 -1.5 -0.1 0.3 -0.6 -0.7 Wine of fresh grapes 7.9 8.6 9.0 8.0 6.8 7.3 6.6 6.3 7.0 Vermouth and other grape wine flavoured with plants or aromatic substances 1.0 -1.4 Fermented beverages, nes 4.3 7.2 8.0 4.6 5.9 Ethyl alcohol and other spirits (if undenatured then higher than 80% by) 0.0 -0.8 -1.2 -2.2 -2.5 -2.4 -3.5 -3.7 -3.9 Spirits, liqueurs, other spirits beverages, alcoholic preparations 1.3 0.4 0.3 0.3 0.6 0.5 0.9 0.7 1.3 Vinegar and substitutes for vinegar 1.8 3.7 4.4 Source: ITC Trade Map, 2010 and own calculations
Competitiveness of selected South African agricultural product exports in the EU-27
31
Table E.7 South Africa’s RCA for tobacco: SA versus Brazil 2001 2002 2003 2004 2005 2006 2007 2008 2009
Tobacco and manufactured tobacco substitutes -3.1 -3.5 -4.1 -3.8 -3.6 -3.9 -4.1 -3.6 -3.1
Tobacco unmanufactured; tobacco refuse -3.2 -3.7 -4.1 -3.9 -4.0 -4.1 -4.3 -3.8 -3.2 Cigars, cheroots, cigarillos and cigarettes 1.9 1.2 0.2 1.2 2.3 1.7 1.1 0.7 0.8 Pipe, chewing and snuff tobaccos -2.8 0.6 0.1 4.3 1.7 2.5 5.3 0.7 Source: ITC Trade Map, 2010 and own calculations
Competitiveness of selected South African agricultural product exports in the EU-27
32
Appendix F: South Africa’s RCA index: South Africa versus Chile Table F.1: South Africa’s RCA for fish and crustaceans: SA vs. Chili 2001 2002 2003 2004 2005 2006 2007 2008 2009
Fish, crustaceans, molluscs, aquatic invertebrates nes -1.0 -0.9 -0.8 -0.8 -1.2 -1.1 -0.9 -0.8 -0.9
Live fish 2.6 1.0 -0.7 -1.7 0.2 -1.1 Fish, fresh, whole 0.0 -0.2 -0.1 -0.1 -0.1 0.4 0.1 0.0 -0.3
Fish, frozen, whole -0.8 -0.7 -0.8 -0.7 -0.9 -0.9 -0.8 -0.6 -0.7 Fish fillets and pieces, fresh, chilled or frozen -1.5 -1.5 -1.5 -1.7 -2.1 -2.4 -1.8 -1.4 -1.5
Fish, cured or smoked and fish meals fit for human consumption -4.8 -4.6 -5.6 -4.8 -8.6 -4.1 -1.6 -2.8 Crustaceans -0.6 -0.1 0.5 0.3 0.3 1.8 1.5 0.8 1.3
Molluscs -1.1 -0.5 -0.2 -0.1 -0.2 0.0 0.5 0.1 0.2 Source: ITC Trade Map, 2010 and own calculations
Table F.2: South Africa’s RCA for vegetable and fruit foods: SA vs. Chile 2001 2002 2003 2004 2005 2006 2007 2008 2009
Vegetable, fruit, nut, etc food preparations 1.7 1.4 1.6 2.1 1.7 1.8 1.1 1.0 1.2
Cucumbers, gherkins and onions preserved by vinegar 4.3 4.7 6.9 7.6 4.7 3.4 7.7 5.2 8.5
Tomatoes prepared or preserved -2.8 -2.9 0.2 2.5 -1.6 -6.9 -0.8 -1.0 -2.2
Mushrooms and truffles, prepared or preserved 0.2 0.2 1.1 1.5
Prepared or preserved vegetables nes (including frozen)
Prepared or preserved vegetables nes (excluding frozen) 2.7 0.5 -0.1 0.0 0.2 0.6 -1.0 -0.4 -0.3
Sugar preserved fruit and nuts 1.7 2.9 2.8 3.2 2.7 2.5 2.5 1.8 2.0
Jams, fruit jellies and marmalades 0.9 0.4 -1.1 -0.6 -0.5 -0.7 -1.2 -1.7 -1.4
Preserved fruit nes 2.9 3.4 3.7 4.0 3.0 3.6 4.0 3.5 2.9
Fruit and vegetable juices, unfermented 1.5 0.8 1.0 1.2 1.1 1.4 0.2 0.0 0.3 Source: ITC Trade Map, 2010 and own calculations
Competitiveness of selected South African agricultural product exports in the EU-27
33
Table F.3: South Africa’s RCA for fruit: SA versus Chile 2001 2002 2003 2004 2005 2006 2007 2008 2009
Edible fruit, nuts, peel of citrus fruit, melons -0.4 -0.6 -0.6 -0.2 -0.2 -0.2 0.0 -0.3 -0.4
Brazil nuts, cashew nuts and coconuts 2.4 1.8 -4.8 Nuts nes -0.8 -1.4 -1.2 -1.2 -1.1 -1.1 -1.2 -1.7 -1.2
Bananas and plantains, fresh or dried 0.6 0.8 0.3 2.5 1.1 1.5 0.7 Dates, figs, pineapples, mangoes, avocados and guavas 2.9 1.9 1.3 0.3 0.3 -0.5 -0.3 0.2 -1.3
Citrus fruit, fresh or dried 2.6 2.2 3.2 2.6 2.9 2.5 2.9 2.4 2.6 Grapes, fresh or dried -0.3 -0.5 -0.7 0.1 0.0 0.1 0.2 -0.2 -0.3
Melons (including watermelons) and papayas, fresh 2.6 2.7 0.2 0.1 -0.6 1.9 2.1 6.5 6.6 Apples, pears and quinces, fresh -0.9 -0.9 -0.8 -0.2 -0.3 -0.1 0.1 -0.2 -0.3 Apricots, cherries, peaches, nectarines, plums and sloes, fresh -0.7 -0.6 -0.9 -0.6 -0.6 -0.5 -0.7 -0.9 -0.6
Fruit nes, fresh -2.6 -2.7 -1.6 -2.2 -2.4 -2.0 -2.2 -2.2 -2.0 Frozen fruit and nuts -2.7 -2.6 -3.9 -3.0 -2.7 -2.4 -2.5 -3.5 -3.1
Provisionally preserved fruit and nuts (unfit for immediate consumption) 1.2 0.7 2.2 -1.7 -6.3 Dried fruit -2.5 -3.1 -3.1 -3.5 -3.7 -3.4 -3.3 -3.6 -3.5 Citrus fruit and melon peel Source: ITC Trade Map, 2010 and own calculations
Table F.4: South Africa’s RCA for cereals: SA versus Chile 2001 2002 2003 2004 2005 2006 2007 2008 2009 Cereals -3.2 -3.2 -2.9 -3.3 -4.2 -0.4 -3.5 -4.0 -3.6
Wheat and meslin -2.8 -4.3 Rye
Barley Oats -3.8 -4.9 -1.9 -0.7 -6.0 -3.6 Maize (corn) -3.2 -3.2 -2.9 -3.3 -4.2 -0.4 -4.1 -4.0 -3.6
Rice Grain sorghum -0.0 -4.7 -4.7 0.1 3.6 1.8 1.8 Buckwheat, millet and canary seed 1.2 0.5 2.2 0.1 Source: ITC Trade Map, 2010 and own calculations
Competitiveness of selected South African agricultural product exports in the EU-27
34
Table F.5: South Africa’s RCA for sugar: SA versus Chile 2001 2002 2003 2004 2005 2006 2007 2008 2009
Sugars and sugar confectionery 3.1 3.0 2.5 1.6 2.4 2.8 3.1 1.4 0.6
Cane or beet sugar and chemically pure sucrose, in solid form
7.0 6.5 0.5 8.8 7.4 6.9
Sugars nes, including chemical pure lactose etc.; artificial honey, caramel
5.5 5.0 4.5 5.2 6.9 6.3 -1.1 -0.5 -2.0
Molasses resulting from the extraction or refining of sugar
Sugar confectionery (including white chocolate), not containing cocoa
1.2 1.7 1.2 0.2 0.6 2.7 1.5 2.8 2.7
Source: ITC Trade Map, 2010 and own calculations
Table F.6 South Africa’s RCA for beverages: SA versus Chile 2001 2002 2003 2004 2005 2006 2007 2008 2009
Beverages, spirits and vinegar -1.0 -0.9 -0.8 -0.6 -0.5 -0.3 -0.4 -0.5 -0.5
Mineral and aerated water 3.9 4.1 3.3 Non-alcoholic beverages (excluding water, fruit or vegetable juices and mi) 8.2 4.0 4.7 4.5 7.4 6.4 4.8 6.5 Beer made from malt 4.2 5.8 4.3 4.4 3.1 2.6 3.0
Wine of fresh grapes -1.1 -1.0 -0.8 -0.6 -0.6 -0.4 -0.5 -0.5 -0.6 Vermouth and other grape wine flavoured with plants or aromatic substances -5.3 -4.5 -5.7 -2.7 -2.8 -4.0 -7.2 -6.4 Fermented beverages, nes -0.9 4.7 5.3 6.1 3.8 3.7 0.2 1.0 Ethyl alcohol and other spirits (if undenatured then higher than 80% by) 2.7 2.6 3.2 4.0 3.6 1.5 Spirits, liqueurs, other spirits beverages, alcoholic preparations 3.0 0.7 0.9 0.9 1.1 1.6 1.6 1.3 0.8
Vinegar and substitutes for vinegar 3.0 2.4 2.7 2.9 2.5 2.9 4.9 1.0 2.1 Source: ITC Trade Map, 2010 and own calculations

Competitiveness of selected South African agricultural product exports in the EU-27
35
Table F.7 South Africa’s RCA for tobacco: SA versus Chile 2001 2002 2003 2004 2005 2006 2007 2008 2009
Tobacco and manufactured tobacco substitutes 3.5 2.1 4.4 8.0 7.8 2.5
Tobacco unmanufactured; tobacco refuse 3.4 1.8 4.3 2.4 Cigars, cheroots, cigarillos and cigarettes Pipe, chewing and snuff tobaccos 6.7 3.0 Source: ITC Trade Map, 2010 and own calculations
Competitiveness of selected South African agricultural product exports in the EU-27
36
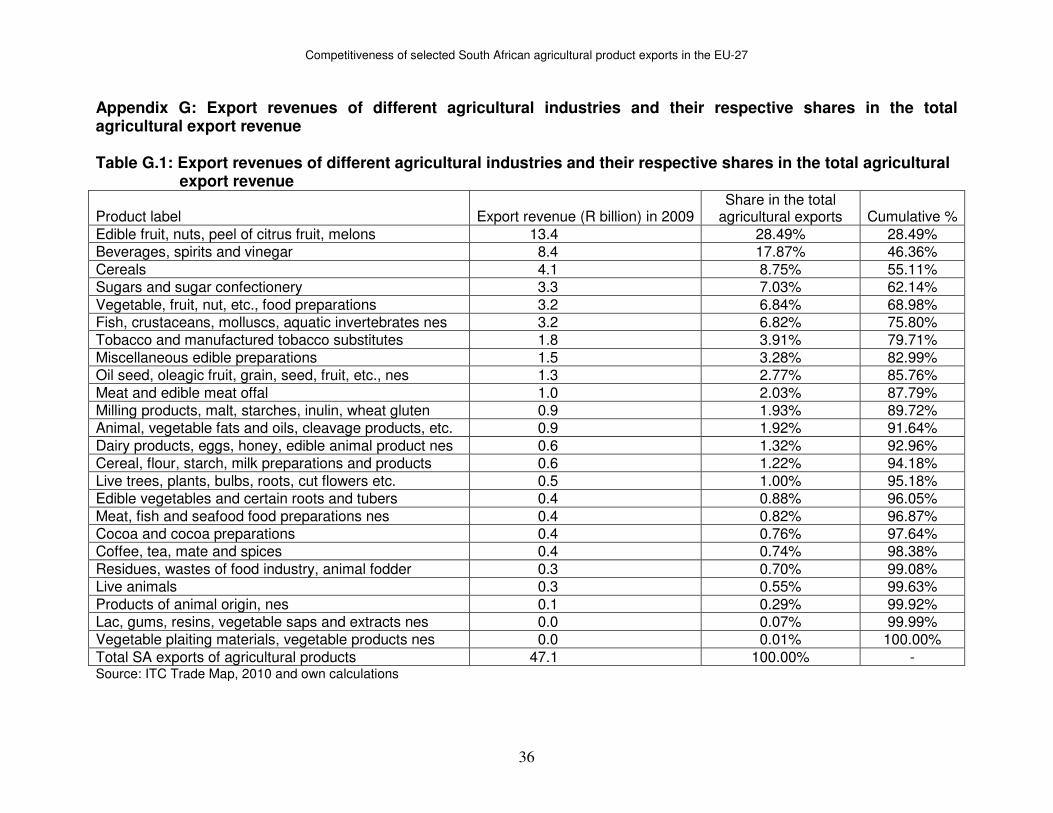
Appendix G: Export revenues of different agricultural industries and their respective shares in the total agricultural export revenue Table G.1: Export revenues of different agricultural industries and their respective shares in the total agricultural
export revenue
Product label Export revenue (R billion) in 2009 Share in the total
agricultural exports Cumulative %
Edible fruit, nuts, peel of citrus fruit, melons 13.4 28.49% 28.49% Beverages, spirits and vinegar 8.4 17.87% 46.36%
Cereals 4.1 8.75% 55.11% Sugars and sugar confectionery 3.3 7.03% 62.14%
Vegetable, fruit, nut, etc., food preparations 3.2 6.84% 68.98% Fish, crustaceans, molluscs, aquatic invertebrates nes 3.2 6.82% 75.80% Tobacco and manufactured tobacco substitutes 1.8 3.91% 79.71%
Miscellaneous edible preparations 1.5 3.28% 82.99% Oil seed, oleagic fruit, grain, seed, fruit, etc., nes 1.3 2.77% 85.76%
Meat and edible meat offal 1.0 2.03% 87.79% Milling products, malt, starches, inulin, wheat gluten 0.9 1.93% 89.72% Animal, vegetable fats and oils, cleavage products, etc. 0.9 1.92% 91.64%
Dairy products, eggs, honey, edible animal product nes 0.6 1.32% 92.96% Cereal, flour, starch, milk preparations and products 0.6 1.22% 94.18%
Live trees, plants, bulbs, roots, cut flowers etc. 0.5 1.00% 95.18% Edible vegetables and certain roots and tubers 0.4 0.88% 96.05%
Meat, fish and seafood food preparations nes 0.4 0.82% 96.87% Cocoa and cocoa preparations 0.4 0.76% 97.64% Coffee, tea, mate and spices 0.4 0.74% 98.38%
Residues, wastes of food industry, animal fodder 0.3 0.70% 99.08% Live animals 0.3 0.55% 99.63%
Products of animal origin, nes 0.1 0.29% 99.92% Lac, gums, resins, vegetable saps and extracts nes 0.0 0.07% 99.99% Vegetable plaiting materials, vegetable products nes 0.0 0.01% 100.00%
Total SA exports of agricultural products 47.1 100.00% - Source: ITC Trade Map, 2010 and own calculations