agriculture, forestry & fisheries -...
TRANSCRIPT
agriculture,forestry & fisheriesDepartment:Agriculture, Forestry and FisheriesREPUBLIC OF SOUTH AFRICA

2015
Department: Agriculture, Forestry and FisheriesREPUBLIC OF SOUTH AFRICA
Printed and published by
Department of Agriculture, Forestry and FisheriesDirectorate: Communication ServicesPrivate Bag X144, Pretoria 0001
II
III
CONTENTS
ACRONYMS ................................................................................................................................................................... IV LIST OF TABLES ........................................................................................................................................................... IVLIST OF FIGURES ......................................................................................................................................................... VEXECUTIVE SUMMARY ................................................................................................................................................ VII
Chapter 1: Introduction and background
1.1. Introduction ............................................................................................................................................................. 1 1.2. Goals and key objectives of the report ................................................................................................................... 11.3. Key defi nitions and principles ................................................................................................................................. 1 1.4. Strategic role of sector cooperatives in economic growth ...................................................................................... 2 1.5. Methodological considerations for data collection .................................................................................................. 21.6. Limitations/scope of the report ............................................................................................................................... 31.7. Structure of the report ............................................................................................................................................. 3
Chapter 2: Profi ling of cooperatives in the sector
2.1. Geographic distribution of cooperatives ................................................................................................................. 3 2.2. Cooperatives according to subsector ..................................................................................................................... 42.3. Cooperatives according to commodities ................................................................................................................. 52.4. Cooperatives according to forms/levels .................................................................................................................. 52.5. Post production cooperatives ................................................................................................................................. 62.6 Cooperatives according to operational status ......................................................................................................... 7
Chapter 3: Membership and cooperative management
3.1. Membership in cooperatives ................................................................................................................................... 7 3.2. Gender analysis ...................................................................................................................................................... 83.3. Management in cooperatives ................................................................................................................................. 93.4. Educational level of cooperative managers ............................................................................................................ 10
Chapter 4: Cooperatives and employment
4.1. Introduction ............................................................................................................................................................. 114.2. Defi nition of employment ........................................................................................................................................ 114.3. Cooperative employment estimates (globally, regionally and locally) .................................................................... 114.4. Gender in cooperative employment ........................................................................................................................ 14
Chapter 5: Training support and capacity development
5.1. Introduction ............................................................................................................................................................. 145.2. Types of capacity building programmes for cooperatives ...................................................................................... 15 5.3. Cooperative compliance in the sector .................................................................................................................... 16
Chapter 6: Financial matters related to cooperatives in the sector
6.1. Capitalisation of cooperatives ................................................................................................................................. 186.2. The gearing ratio .................................................................................................................................................... 196.3. Sources of capital for cooperatives in the sector .................................................................................................... 196.4. Financial performance of cooperatives in the sector (annual turnover) .................................................................. 23
Chapter 7: Cooperatives and market access
7.1. Defi ning market access .......................................................................................................................................... 257.2. Challenges with market access ............................................................................................................................... 257.3. Types of markets accessed by cooperatives in the sector ..................................................................................... 26 7.4. Summary of formal markets supplied by sector cooperatives ................................................................................ 30 7.5. Landownership by cooperatives ............................................................................................................................. 30 7.6 Conclusion and recommendation ............................................................................................................................ 31
Annexures
Business analysis sheet (data collecting questionnaire) ............................................................................................... 33
Cooperatives and enterprise development business analysis sheet
IV
ACRONYMSARC Agricultural Research Council CODAS Cooperative Data Analysis System CIPC Companies and Intellectual Property Commission CICOPA International Organization of Industrial, Artisan, Service and Social Producers’ Cooperatives CRDP Comprehensive Rural Development Programme DAFF Department of Agriculture, Forestry and Fisheries DEDEA Department of Economic Development and Environmental Affairs DL Department of Labour DRDLR Department of Rural Development and Land Reform DSD Department of Social Development dti Department of Trade and Industry DWS Department of Water and Sanitation FAO Food and Agriculture Organization GDP Gross Domestic Product ICA International Cooperative Alliance IDC Industrial Development Corporation ILO International Labour Organization IYC International Year of Cooperatives LEDA Limpopo Economic Development Agency LRAD Land Redistribution for Agricultural Development MAFISA Micro Agricultural Financial Institutions of South Africa NDA National Development Agency NYDA National Youth Development Agency PTO Permission to occupy UN United Nations USD United States Dollar VDM Vhembe District Municipality ZAR South African Rand
LIST OF TABLESTable 1: Geographic distribution of cooperatives ......................................................................................................... 3Table 2: Cooperatives according to subsector s .......................................................................................................... 4Table 3: Cooperatives according to commodities ......................................................................................................... 5Table 4: Cooperatives according to forms .................................................................................................................... 5Table 5: Postproduction cooperatives .......................................................................................................................... 6Table 6: Cooperatives according to operational status ................................................................................................ 7Table 7: Global memberships in cooperatives ............................................................................................................. 8Table 8: Membership of cooperatives in provinces ...................................................................................................... 8Table 9: Cooperatives with managers and their gender ............................................................................................... 9Table 10: Level of education of cooperative managers ................................................................................................ 10Table 11: Global membership in cooperatives ............................................................................................................. 12Table 12: Memberships in Sub-Sahara Africa .............................................................................................................. 12Table 13: Job opportunities created by cooperatives in the sector .............................................................................. 13Table 14: Three year analysis of employment in cooperatives .................................................................................... 13Table 15: Type of employment according to gender .................................................................................................... 14Table 16: Institutional support and capacity development in cooperatives .................................................................. 15Table 17: Cooperative compliance in the sector .......................................................................................................... 17Table 18: Equity in cooperatives .................................................................................................................................. 19Table 19: Grants by DAFF ............................................................................................................................................ 20Table 20: Grants by external stakeholders in the Eastern Cape .................................................................................. 21Table 21: Grants by external stakeholders in Free State ............................................................................................. 21Table 22: Grants by external stakeholders in Gauteng ................................................................................................ 21Table 23: Grants by external stakeholders in Limpopo ................................................................................................ 22Table 24: Grants by external stakeholders in Mpumalanga ......................................................................................... 22
V
Table 25: Grants by external stakeholders in North West ............................................................................................ 22Table 26: Grants by external stakeholders in Western Cape ....................................................................................... 22Table 27: Loans by DAFF ............................................................................................................................................. 23Table 28: Loans by external stakeholders .................................................................................................................... 23Table 29: Comparison between grants and loans ........................................................................................................ 23Table 30: Global annual turnover by cooperatives ....................................................................................................... 24Table 31: Financial performance over a three-year period ........................................................................................... 24Table 32: Markets accessed by Eastern Cape cooperatives ....................................................................................... 26Table 33: Markets accessed by Free State cooperatives ............................................................................................. 26Table 34: Markets accessed by Gauteng cooperatives ................................................................................................ 27Table 35: Markets accessed by KwaZulu-Natal cooperatives ...................................................................................... 27Table 36: Markets accessed by Limpopo cooperatives ................................................................................................ 28Table 37: Markets accessed by Mpumalanga cooperatives ......................................................................................... 28Table 38: Markets accessed by Northern Cape cooperatives ...................................................................................... 29Table 39: Markets accessed by North West cooperatives ........................................................................................... 29Table 40: Markets accessed by Western Cape cooperatives ...................................................................................... 29Table 41: Summary of market opportunities for cooperatives ...................................................................................... 30Table 42: Landownership by cooperatives in provinces ............................................................................................... 31
LIST OF FIGURESFIG. 1: Geographical distribution of cooperatives ........................................................................................................ 4FIG. 2: Cooperatives per province according to subsectors ......................................................................................... 4FIG. 3: Graph depicting forms of cooperatives and provinces ..................................................................................... 6FIG. 4: Cooperatives in postproduction ........................................................................................................................ 6FIG. 5: Graphical presentation of cumulative membership in cooperatives ................................................................. 9FIG. 6: Cooperative managers according to gender .................................................................................................... 10FIG. 7: Graphical presentation of level of education of cooperative managers ............................................................ 11FIG. 8: Analysis of three year employment in cooperatives ......................................................................................... 13FIG. 9: Institutional capacity building and support ........................................................................................................ 16FIG.10: Graphical presentation of cooperative compliance in the sector ..................................................................... 18FIG. 11: Members’ contribution in cooperatives ........................................................................................................... 20FIG.12: Comparison between grants and loans ........................................................................................................... 23FIG. 13: Annual turnover in cooperatives ..................................................................................................................... 25FIG. 14: Graphical presentation of formal market opportunities for cooperatives ........................................................ 31FIG. 15: Pie chart of landownership in cooperatives .................................................................................................... 31

VI
VII
EXECUTIVE SUMMARYThe importance of the cooperative sector and its impact round the world continues to be studied and highlighted. However, the economic and social dimensions of this business model are yet to be fully understood and demonstrated. It is very diffi cult to determine how to support or aid cooperative development without reliable data on the size and impact of coop-eratives. The goal of the cooperative annual report, now in its fourth edition, is to increase and enhance the available data on cooperatives in order to present a more detailed account of their actual contribution to the socio-economic development of communities.
The 2014/15 edition presents the results of a data analysis on cooperatives in agriculture, forestry and fi sheries, using data of 1 788 cooperatives collected and captured on the Cooperative Data Analysis System (CODAS). The report quantita-tively measured the economic impact of cooperatives in the sector. It describes and quantifi es the magnitude of economic activity accounted for by sector cooperative businesses in the country. It also provides insights into sector cooperative ac-tivities, as well as into effective support measures for these organisations which can be used by farmers , in setting up and strengthening their collective organisation, and by the cooperative movement and government in their effort to encourage the establishment of cooperatives in the sector.
Of the 1 788 cooperatives whose data was used to prepare this report, 95% (1703) are involved in activities relating to agriculture, with only 60 cooperatives involved in fi shery related activities. Forest related cooperatives account for 1, 4% (25) of the total cooperatives. In terms of commodities, the vegetable commodity has been found to be dominant with about 24% of the cooperatives (amounting to 430) involved in vegetable production. This is followed by the livestock commod-ity at 21% (377 cooperatives). The number of cooperatives participating in post-production activities (value adding and agro-processing) has showed a steady increase over a three year period from 27 in 2012 to 60 in 2013 and 96 in 2014.In terms of the level at which the 1 788 cooperatives are formalised, 1 755 have been formalised as primary/producer co-operatives with 42 cooperatives at secondary level primarily to provide support services to producer cooperatives. A total of 41 930 farmers belong to cooperatives in the sector with 55% of these being females. Only 716 of the total cooperatives surveyed have full-time managers, which raises concerns on operational effi ciency and sustainability.
According to analysis performed, an additional 2 697 jobs were created by cooperatives in the sector in 2014/15. The department continues to provide support with training and capacity development to cooperatives in key identifi ed com-petencies such as fi nancial management, business planning, marketing, cooperative governance, etc. In terms of equity, there has been an increase of about R3,5 million invested by members in their cooperatives from 2013. A greater number of cooperatives are benefi ting from the departmental fi nancing support programmes, in particular, the Comprehensive Agricultural Support Programme (CASP), with 185 cooperatives supported to the amount of R120 million in the 2014/15 fi nancial year and one cooperative approved for support with R6,9 million through the AgriBEE Fund. Altogether 16 coop-eratives have been supported with production loans through Mafi sa amounting to R4,3 million. However, the private sector is still lagging behind in terms of providing fi nancial support to cooperatives in the sector.
There has been a slight increase in annual turnover from R134 million in 2013 to R157 million in 2014. Market access continues to be a challenge. Of the 245 cooperatives with access to formal markets, only 30 are selling to the retail chain supermarkets such as Shoprite, Pick n Pay, Boxer, etc. In terms of landownership, 406 cooperatives (23%) have title deeds to their land and 499 cooperatives (28%) use the permission to occupy method. Together all the cooperatives surveyed have a combined ownership of 645 583 ha.
The department continues to promote the establishment of commodity-based cooperatives to ensure a more focused approach by smallholder farmers. Support to existing cooperatives, through training and capacity development will be heightened to improve profi tability and competitiveness. An impact assessment study on the existing support instruments will be conducted in the current fi nancial year to determine the effectiveness thereof and inform future interventions.

VIII
1
CHAPTER 1:INTRODUCTION AND BACKGROUND
1.1 Introduction
Cooperatives are successful in economic development because they are commercial organisations that operate by a broader set of values than those associated with the limited pursuit of profi t alone. Firstly, they are businesses that practise economic fairness by ensuring equal access to markets and services among an open and voluntary membership base. Because they are owned by the consumers of the services they provide, cooperatives tend to make decisions that balance the need for profi tability with the greater interests of the community which they serve.
Taken as a whole, the cooperative movement is Africa’s biggest non-governmental organisation that plays a signifi cant role in many national economies and has created a great number of salaried jobs and self-employment opportunities. Yet, the role of cooperatives in employment creation has been neglected by employment planners, cooperative promotion agen-cies, social partners and donor organisations alike. In many African countries, cooperatives were considered primarily as instruments to execute certain economic or political functions on behalf of the government, not as autonomous, member based organisations that create and consolidate self-employment.
The importance of the cooperative sector and its impact round the world continues to be studied and highlighted. However, the economic and social dimensions are yet to be fully understood and demonstrated. It is very diffi cult to determine how to support or aid the development of cooperatives without reliable data on their size and impact. Despite the much publicised United Nation’s International Year of Cooperatives (IYC), clear, concise and reputable data on the number of cooperatives in the country, number of members, turnover, employees and assets do not exist.
The goal of the ongoing annual publications on the state of cooperatives in the agriculture, Forestry and Fisheries coopera-tives, now in its fourth edition, is to increase and enhance the availability of data on cooperatives in order to present a more detailed view of their actual contribution to the socio-economic development of the country. The Department of Agriculture, Forestry and Fisheries (DAFF) collect available economic and social data on cooperative enterprises in the country with the support of provincial departments of agriculture (PDAs) and other stakeholders in an effort to demonstrate the existence and viability of this model as an alternative to the traditionally dominant for-profi t business model.
The 2014 edition presents results of data analysis of 1 788 sector cooperatives whose data is captured on the Cooperative Data Analysis System (CODAS). As in the previous editions, the report is intended to be exploratory, and does not attempt to be all-inclusive rather, but to be an overview of the signifi cant contribution of cooperatives in the sector to economic growth and job creation imperatives.
The goal is to increasingly move beyond the current cooperatives used for analysis to include all operational cooperatives registered with the Companies and Intellectual Property Commission (CIPC) so as to have a more accurate measure of their impact on the economy. To accomplish this, a more aggressive data collection strategy, which include deepening collaborations with, among others the cooperative movement, commodity associations, CIPC, local government and other community-based organisations operating at local level will have to be explored.
1.2 Goals and key objectives of the report
This report aims at contributing to a better understanding of the contribution of cooperatives in the sector to the key gov-ernment imperatives of food security, job creation and contribution to the economic growth. The report further seeks to highlight some of the key challenges faced by cooperatives, such as access to markets, fi nance, infrastructure, skills, technology, etc. In summary, the report aims to achieve the following:
Raise the awareness and profi le of cooperatives in the sector;
Highlight some of the challenges facing sector cooperatives;
Demonstrate the economic and social importance of cooperatives in the sector; and
Model good practice and highlight successful cooperative business models and innovative approaches.
1.3 Key defi nitions and principles
The International Cooperative Alliance (ICA) defi nes a cooperative as an autonomous association of persons united volun-tarily to meet their mutual economic, social, and cultural needs and aspirations through a jointly-owned and democratical-ly-controlled enterprise. Cooperatives are based on the values of self-help, self-responsibility, democracy, equality, equity and solidarity. In the tradition of their founders, cooperative members believe in the ethical values of honesty, openness, social responsibility and caring for others. The cooperative principles are guidelines by which cooperatives put their values into practice, including voluntary and open membership, democratic member control, member economic participation,
2
autonomy and independence, education, training and information, cooperation among cooperatives and concern for com-munity.
1.3.1. Agricultural cooperatives
An agricultural cooperative is a cooperative that produces, processes or markets agricultural products and supplies agri-cultural inputs and services to its members. Put another way, agricultural cooperatives pool the production and resources of farmers and rural entrepreneurs in order to maximise the benefi ts for their members. Agricultural cooperatives can be classifi ed into service or production cooperatives. Production cooperatives involve farmers who operate the cooperative on jointly owned agricultural plots/farms while service cooperatives are more common and members carry out their activities independently, and the cooperative provides them with a range of services, including machinery, processing, transport, packaging, distribution, marketing and information.
1.3.2. Forest cooperatives
As the name indicates, forest owner cooperatives are owned and democratically controlled by individuals, families and organisations that own forest land. They provide a variety of services to their landowner members, especially forest man-agement and timber marketing services. Forest user cooperatives, often referred to as community forest management groups, comprise local community residents who make use of state-owned or communal forests for fi rewood, charcoal, timber, non-timber forest products, hunting, eco-tourism and other activities.
1.3.3. Fishery cooperatives
These are cooperatives that produce, process, sell and market fi shery products and supply fi shery inputs and services to their members. They do fi shing, extraction of aquatic animals, aquatic plants from oceans, rivers, lakes and dams. Fishing is done on the basis of obtaining fi shing and other related business licences to do business in specifi ed waters or areas.
1.4. Strategic role of sector cooperatives in economic growth
Despite its signifi cant and positive impact on economic and social development, the cooperative form of enterprise con-tinues to be underutilised and poorly understood. Very few people today are aware that an estimated 100 million jobs are provided by cooperatives to salaried employment—which is 20% more than multinational corporations. This is in fact a conservative fi gure considering that cooperatives provide not only direct employment, but also self-employment, indirect and induced employment.
For example, in agriculture, where the majority of cooperatives are still found, cooperatives maintain farmers’ ability to be self-employed given that for many farmers the fact that they are members of a cooperative and derive income from the ser-vices, allows them to continue to farm and contribute to rural community development. In both urban and rural contexts, the impact of cooperatives in providing income to members creates additional employment through multiplier effects, including enabling other enterprises to grow and, in turn, provide local jobs (the indirect employment capacity of cooperatives).
According to the Food and Agriculture Organization of the United Nations (FAO), agriculture, forestry, fi sheries and live-stock cooperatives are the main sources of employment and income in rural areas, where most of the world’s poor and hungry people live. Agriculture cooperatives play an important role in supporting small agricultural producers and mar-ginalised groups such as young people and women. They empower their members economically and socially and create sustainable rural employment through business models that are resilient to economic and environmental shocks.
Cooperatives offer small agricultural producers opportunities and a wide range of services, including improved access to markets, natural resources, information, communications, technologies, credit, training and warehouses. They also facil-itate smallholder producers’ participation in decision making at all levels, support them in securing land-use rights, and negotiate better terms for engagement in contract farming and lower prices for agricultural inputs such as seeds, fertiliser and equipment. Through this support, smallholder producers can secure their livelihoods and play a greater role in meeting the growing demand for food on local, national and international markets, thereby contributing to poverty alleviation, food security and the eradication of hunger.
1.5. Methodological considerations for data collection
The choice of the many methods for collecting data will depend on the variables to be measured and the source and the resources available. In many cases, there is a natural way to collect particular variables. The choice of method is infl u-enced by the data collection strategy, the type of variable, the accuracy required, the collection point and the skill of the enumerator.
3
For the purposes of this report, a data collecting questionnaire specifi cally designed for this project and which is the core of the process of data collection, was used. The advantage of using a questionnaire lies in its ability to be distributed to a large number of people. It also saves time and money as compared to interviews. People are more truthful while respond-ing to the questionnaires regarding controversial issues in particular owing to the fact that their responses are anonymous. However, they also have drawbacks. The majority of the people who receive questionnaires do not return them and those who do might not be representative of the originally selected sample.
To facilitate its completion among diverse groups of people, the questionnaire is made available to PDAs and other stake-holders. Data collection should be conducted at intervals suffi ciently frequent for management purposes. New data is collected on a regular basis while existing data is reviewed annually. Data collected directly from the primary source make it possible to collect a wider range of data than those available in existing databases.
1.6. Limitations/scope of the report
To stimulate interest and raise awareness on the importance of cooperatives, particularly in the agriculture, forestry and fi sheries sector, greater effort in data collection and reporting on the economic impact of these cooperatives is needed. This report is thus presented to help stimulate interest and raise the profi le of cooperatives in the sector. The report is there-fore only limited to all cooperatives in the sector whose data has been collected and captured on the cooperative database.
1.7. Structure of the report
This report is structured as follows: Chapter 2 provides profi les of cooperatives surveyed in terms of commodities, subsec-tor, forms/levels, level of activity and operational status. The third chapter presents an analysis of membership in coopera-tives as a key ingredient/component of the cooperative model, management of cooperatives and the educational levels of cooperative managers. This is followed by analysis of cooperative employment in chapter 4. Chapter 5 focuses on training and capacity development as a tool towards the successful realisation of goals by cooperatives. Capitalisation and fi nancial performance of cooperatives are dealt with in Chapter 6 and Chapter 7 looks at issues relating to market access. Finally, the last chapter provides the concluding remarks for this report.
CHAPTER 2:PROFILING OF COOPERATIVES IN THE SECTOR
2.1. Number of cooperatives profi led
Chapter 2 of this report focuses on profi ling the cooperatives that formed the basis of analysis performed to generate this report. This include their geographic distribution, classifi cation in terms of subsectors, forms/levels, commodities they are involved in, categorisation in terms of those involved in primary production as well as those in post- production activities as well as their operational status. A profi le of a total of 1 788 sector cooperatives whose data is captured on CODAS is presented in this section.
Province Number of cooperatives
Eastern Cape 212
Free State 89
Gauteng 106
KwaZulu-Natal 383
Limpopo 384
Mpumalanga 224
Northern Cape 107
North West 222
Western Cape 61
Total 1 788
Table 1: Geographic distribution of cooperatives
4
Figure 1: Geographical distribution of cooperatives
According to Table 1 and Figure 1, Limpopo has the highest number of cooperatives at 384 with one cooperative more than KwaZulu-Natal at 383. The Free State and the Western Cape have the least number of cooperatives at 89 and 61, respectively.
2.2. Cooperatives according to subsectors
Province Agriculture Forestry Fisheries
Eastern Cape 202 5 5
Free State 79 2 8
Gauteng 100 3 3
KwaZulu-Natal 378 1 4
Limpopo 377 3 4
Mpumalanga 209 6 9
Northern Cape 107 0 0
North West 215 4 3
Western Cape 36 1 24
Total 1 703 25 60
Table 2. Cooperatives according to subsectors
Figure 2: Cooperatives per province according to subsectors
According to the fi gure above, ninety fi ve percent (95%) of the cooperatives surveyed falls within the agriculture sub sector with three percent (3%) and a percent (1%) in fi shery and forestry respectively.
5
2.3. Cooperatives according to commodities
Commodity Number of cooperatives in a province
EC FS GP KZN LP MP NC NW WC Total
Beekeeping 2 0 1 2 3 2 1 1 1 13
Cotton 0 0 0 0 0 13 0 0 0 13
Crops 61 5 5 73 97 38 4 52 1 336
Fisheries 5 8 3 4 4 9 0 3 24 60
Forestry 5 2 3 1 3 6 0 4 1 25
Flowers 0 0 1 0 1 0 0 0 1 3
Fruit 3 1 1 2 9 0 0 3 1 20
Herbs 0 0 1 0 1 0 0 0 0 2
Input supply 6 6 0 3 10 5 1 6 3 40
Livestock 36 27 5 39 36 25 78 60 9 315
Marketing/value add-ing/processing
7 5 13 2 13 6 0 3 4 53
Mixed farming 10 5 0 18 8 9 5 30 0 85
Poultry 28 15 28 113 103 44 12 30 4 377
Sugar cane 0 0 0 12 0 0 0 0 0 12
Vegetables 47 15 45 114 96 67 6 30 10 430
Wool 2 0 0 0 0 0 0 0 2 4
Total 212 89 106 383 384 224 107 222 61 1788
Table 3: Cooperatives according to commodities
According to Table 3, the highest number of cooperatives (430) constituting 24% are involved in vegetable production and the bulk of these are found in the KwaZulu-Natal. The second dominant commodity is poultry at 21% (377) cooperatives with KwaZulu-Natal still the leading province.
2.4. Cooperatives according to forms/levels
In South Africa the structure of cooperatives follow a four-tier pyramidal structure with primary cooperatives at the bottom of the pyramid, followed by secondary cooperatives, tertiary and the apex. The table below indicates the number of coop-eratives in the sector according to levels.
ProvinceTypes of cooperatives
Primary Secondary Tertiary Apex
Eastern Cape 205 7 0 0
Free State 87 2 0 0
Gauteng 104 2 0 0
KwaZulu-Natal 372 11 0 0
Limpopo 379 5 0 0
Mpumalanga 215 9 0 0
Northern Cape 107 0 0 0
North West 218 4 0 0
Western Cape 59 2 0 0
Total 1 746 42 0 0
Table 4: Cooperatives according to types
6
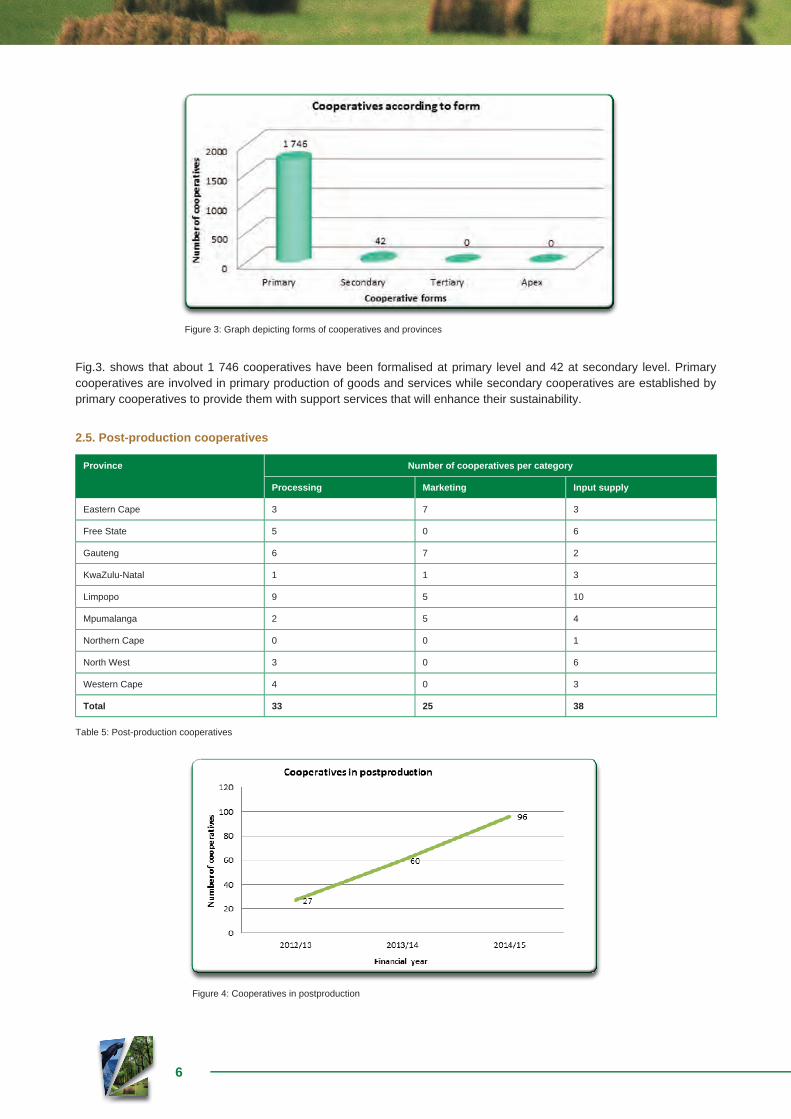
Figure 3: Graph depicting forms of cooperatives and provinces
Fig.3. shows that about 1 746 cooperatives have been formalised at primary level and 42 at secondary level. Primary cooperatives are involved in primary production of goods and services while secondary cooperatives are established by primary cooperatives to provide them with support services that will enhance their sustainability.
2.5. Post-production cooperatives
Province Number of cooperatives per category
Processing Marketing Input supply
Eastern Cape 3 7 3
Free State 5 0 6
Gauteng 6 7 2
KwaZulu-Natal 1 1 3
Limpopo 9 5 10
Mpumalanga 2 5 4
Northern Cape 0 0 1
North West 3 0 6
Western Cape 4 0 3
Total 33 25 38
Table 5: Post-production cooperatives
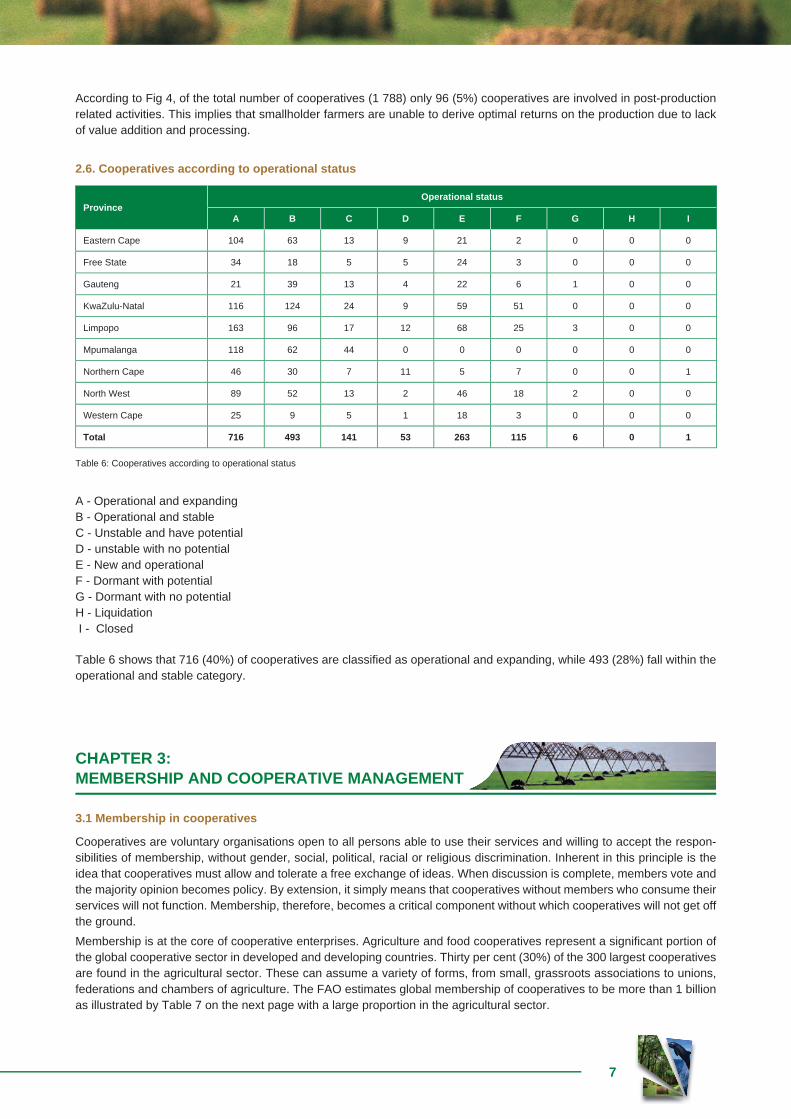
Figure 4: Cooperatives in postproduction
7
According to Fig 4, of the total number of cooperatives (1 788) only 96 (5%) cooperatives are involved in post-production related activities. This implies that smallholder farmers are unable to derive optimal returns on the production due to lack of value addition and processing.
2.6. Cooperatives according to operational status
ProvinceOperational status
A B C D E F G H I
Eastern Cape 104 63 13 9 21 2 0 0 0
Free State 34 18 5 5 24 3 0 0 0
Gauteng 21 39 13 4 22 6 1 0 0
KwaZulu-Natal 116 124 24 9 59 51 0 0 0
Limpopo 163 96 17 12 68 25 3 0 0
Mpumalanga 118 62 44 0 0 0 0 0 0
Northern Cape 46 30 7 11 5 7 0 0 1
North West 89 52 13 2 46 18 2 0 0
Western Cape 25 9 5 1 18 3 0 0 0
Total 716 493 141 53 263 115 6 0 1
Table 6: Cooperatives according to operational status
A - Operational and expandingB - Operational and stableC - Unstable and have potentialD - unstable with no potentialE - New and operationalF - Dormant with potentialG - Dormant with no potentialH - Liquidation I - Closed
Table 6 shows that 716 (40%) of cooperatives are classifi ed as operational and expanding, while 493 (28%) fall within the operational and stable category.
CHAPTER 3: MEMBERSHIP AND COOPERATIVE MANAGEMENT
3.1 Membership in cooperatives
Cooperatives are voluntary organisations open to all persons able to use their services and willing to accept the respon-sibilities of membership, without gender, social, political, racial or religious discrimination. Inherent in this principle is the idea that cooperatives must allow and tolerate a free exchange of ideas. When discussion is complete, members vote and the majority opinion becomes policy. By extension, it simply means that cooperatives without members who consume their services will not function. Membership, therefore, becomes a critical component without which cooperatives will not get off the ground.
Membership is at the core of cooperative enterprises. Agriculture and food cooperatives represent a signifi cant portion of the global cooperative sector in developed and developing countries. Thirty per cent (30%) of the 300 largest cooperatives are found in the agricultural sector. These can assume a variety of forms, from small, grassroots associations to unions, federations and chambers of agriculture. The FAO estimates global membership of cooperatives to be more than 1 billion as illustrated by Table 7 on the next page with a large proportion in the agricultural sector.
8
Recent statistics show that out of 100 Africans, at least seven people are members of a cooperative and the total number of cooperatives in most countries has continued to grow.
The table below provides a breakdown of cooperative membership according to sectors worldwide as well as the number of cooperatives thereof.
Sector No. of cooperatives No. of members
Banking/credit unions 210,559 703,070,123
Insurance 3,644 248,864
Agriculture 1,224,650 122,120,167
Utilities 1,714 19,858,921
Grocery/consumer 81,437 97,869,940
Worker 84,799 4,369,600
Housing 15,247 16,383,048
Health 1,700 3,441,221
Education and social 87,998 21,876,054
Purchasing or marketing 41,865 26,256,054
Other or undefi ned 760,985 56,296,177
Worldwide total 2,514,598 1,071,790,167
Table 7: Global memberships in cooperatives (Source: UN Secretariat Results of 2014)
3.1.2. Membership of cooperatives in provinces
Province Total Male Female Youth People living with disabilities
Eastern Cape 8 627 3 650 4 977 1 092 115
Free State 1 274 729 545 159 6
Gauteng 1 246 557 689 280 45
KwaZulu-Natal 8 487 3 046 5 441 1 175 73
Limpopo 11 100 5 882 5 218 946 135
Mpumalanga 5 574 2 438 3 136 568 45
Northern Cape 1 765 776 989 237 10
North West 3 160 1 537 1 623 337 33
Western Cape 697 450 247 34 6
Total 41 930 19 065 22 865 4 828 468
Table 8: Membership of cooperatives in provinces
Table 8 indicates that the 1 788 cooperatives have a combined membership of 41 930, of which 19 065 (45%) consist of males and 22 865 (55%) females. Youth and People living with disabilities constitute 12 % (4828) and 1% (468) respec-tively.
3.2. Gender analysis
Gender refers to the social attributes and opportunities associated with being male or female and the relationships between women and men and girls and boys, as well as the relations between women and those between men. These attributes, opportunities and relationships are socially constructed and are learned through socialisation processes. They are context/time-specifi c and changeable. Gender determines what is expected, allowed and valued in a women or a man in a given context. In most societies there are differences and inequalities between women and men in responsibilities assigned,
9
activities undertaken, access to and control over resources, as well as decision-making opportunities. Gender is part of the broader socio-cultural context. Other important criteria for socio-cultural analysis include class, race, poverty level, ethnic group and age.
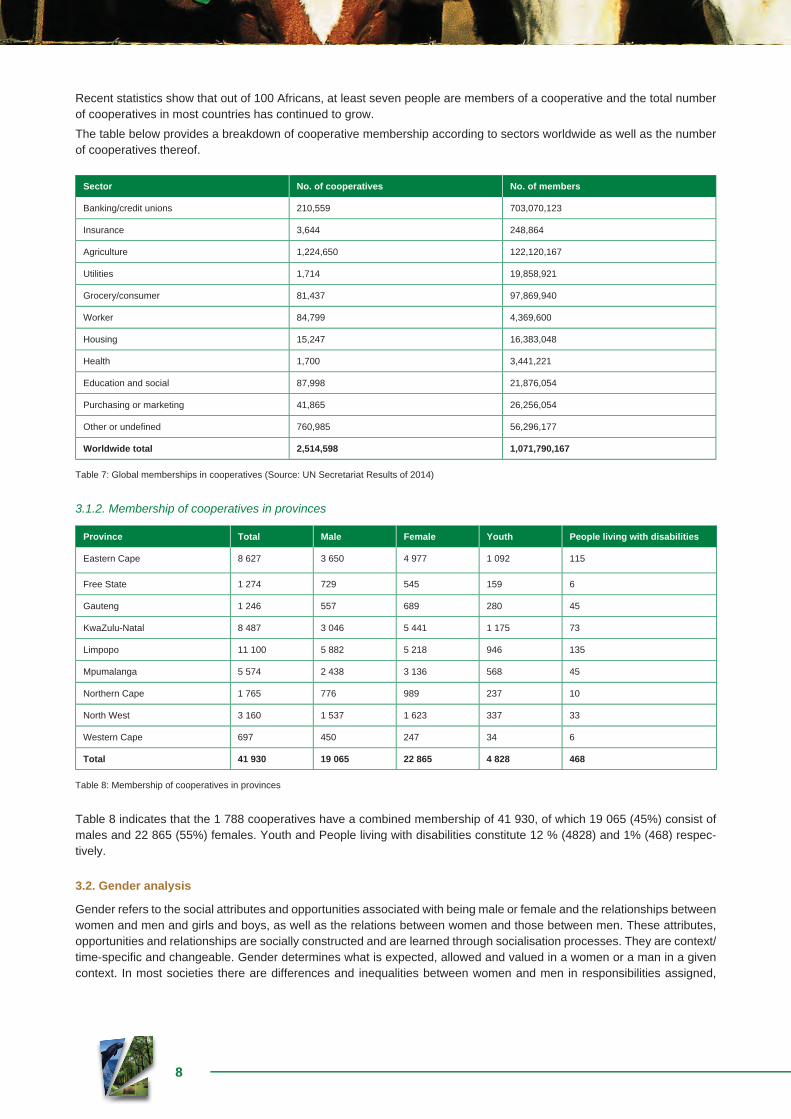
Gender plays a signifi cant role in cooperatives particularly those in rural areas where culture is still observed and practiced.
Figure 5: Graphical presentation of cumulative membership in cooperatives
3.3. Management in cooperatives
Cooperatives believe that management is not only benefi cial from a human and social point of view, but also a key com-petitive asset for a company. This conviction originates both from real life examples and academic research. One of the challenges facing cooperatives is their inability to attract suitably qualifi ed managers, partly owing to the perceived low or poor remunerations offered by these enterprises.
Management combines ideas, processes, materials, facilities and people to effectively provide needed services to mem-ber-owners. Managing a cooperative can be challenging and diffi cult. It involves not only managing resources and busi-ness operations, as in other businesses, but also dealing with problems stemming from the cooperative’s distinctive char-acteristics. Because the cooperative’s members are both owners and patrons, special relationships and problems arise concerning member and board of director roles and responsibilities. Management in cooperatives involves mobilisation of human skills, processes, as well as fi nancial and technological resources so that the cooperatives’ goals can be reached.
3.3.1 Cooperatives with managers and their gender
Province Total number of co-ops withmanagers
Male Female Youth People livingwithdisabilities
Eastern Cape 124 93 31 2 1
Free State 48 30 18 0 0
Gauteng 73 48 25 0 0
KwaZulu-Natal 147 52 95 2 0
Limpopo 93 92 1 1 1
Mpumalanga 117 50 67 5 0
Northern Cape 12 7 5 0 0
North West 74 52 22 3 0
Western Cape 28 24 4 0 0
Total 716 448 268 13 2
Table 9: Cooperatives with managers and their gender
10
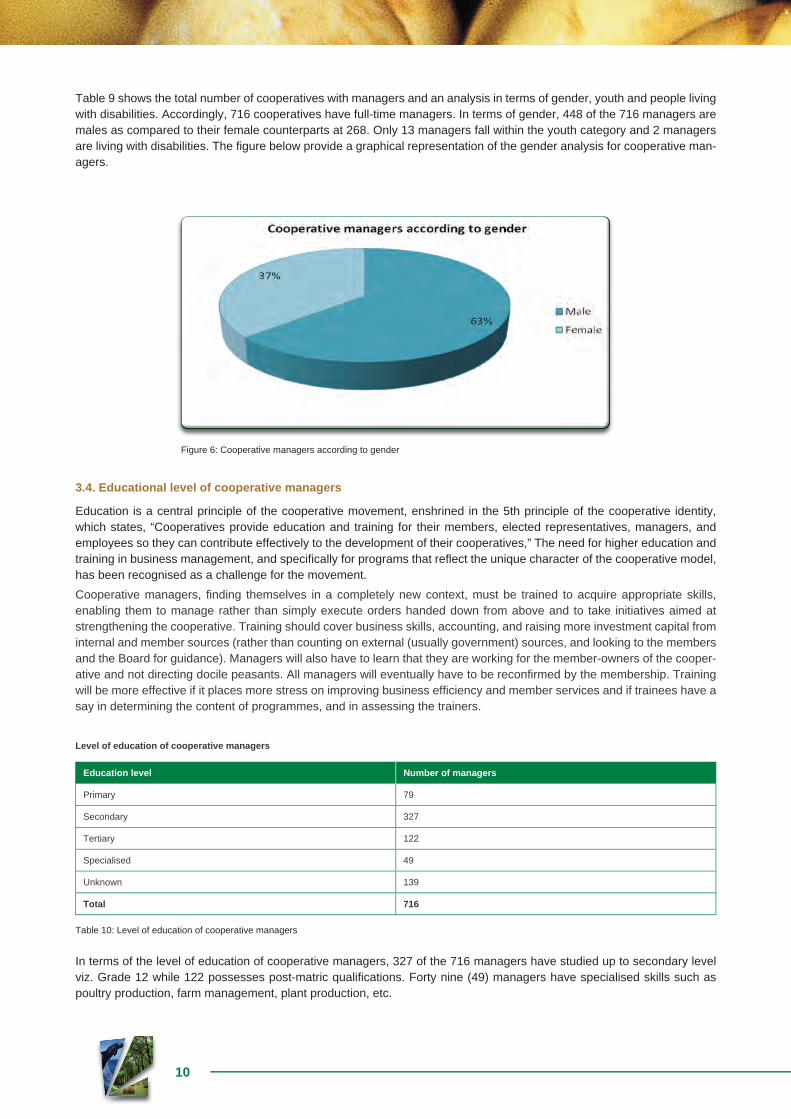
Table 9 shows the total number of cooperatives with managers and an analysis in terms of gender, youth and people living with disabilities. Accordingly, 716 cooperatives have full-time managers. In terms of gender, 448 of the 716 managers are males as compared to their female counterparts at 268. Only 13 managers fall within the youth category and 2 managers are living with disabilities. The fi gure below provide a graphical representation of the gender analysis for cooperative man-agers.
Figure 6: Cooperative managers according to gender
3.4. Educational level of cooperative managers
Education is a central principle of the cooperative movement, enshrined in the 5th principle of the cooperative identity, which states, “Cooperatives provide education and training for their members, elected representatives, managers, and employees so they can contribute effectively to the development of their cooperatives,” The need for higher education and training in business management, and specifi cally for programs that refl ect the unique character of the cooperative model, has been recognised as a challenge for the movement.
Cooperative managers, fi nding themselves in a completely new context, must be trained to acquire appropriate skills, enabling them to manage rather than simply execute orders handed down from above and to take initiatives aimed at strengthening the cooperative. Training should cover business skills, accounting, and raising more investment capital from internal and member sources (rather than counting on external (usually government) sources, and looking to the members and the Board for guidance). Managers will also have to learn that they are working for the member-owners of the cooper-ative and not directing docile peasants. All managers will eventually have to be reconfi rmed by the membership. Training will be more effective if it places more stress on improving business effi ciency and member services and if trainees have a say in determining the content of programmes, and in assessing the trainers.
Level of education of cooperative managers
Education level Number of managers
Primary 79
Secondary 327
Tertiary 122
Specialised 49
Unknown 139
Total 716
Table 10: Level of education of cooperative managers
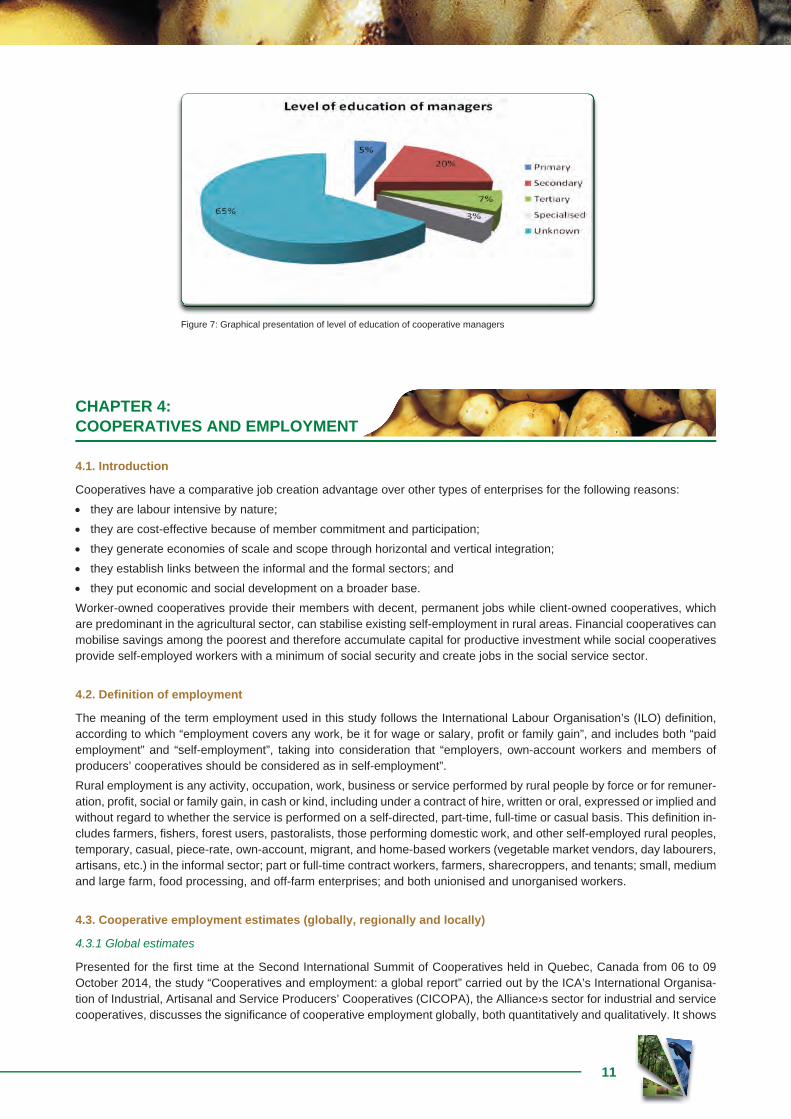
In terms of the level of education of cooperative managers, 327 of the 716 managers have studied up to secondary level viz. Grade 12 while 122 possesses post-matric qualifi cations. Forty nine (49) managers have specialised skills such as poultry production, farm management, plant production, etc.
11
Figure 7: Graphical presentation of level of education of cooperative managers
CHAPTER 4:COOPERATIVES AND EMPLOYMENT
4.1. Introduction
Cooperatives have a comparative job creation advantage over other types of enterprises for the following reasons:
they are labour intensive by nature;
they are cost-effective because of member commitment and participation;
they generate economies of scale and scope through horizontal and vertical integration;
they establish links between the informal and the formal sectors; and
they put economic and social development on a broader base.
Worker-owned cooperatives provide their members with decent, permanent jobs while client-owned cooperatives, which are predominant in the agricultural sector, can stabilise existing self-employment in rural areas. Financial cooperatives can mobilise savings among the poorest and therefore accumulate capital for productive investment while social cooperatives provide self-employed workers with a minimum of social security and create jobs in the social service sector.
4.2. Defi nition of employment
The meaning of the term employment used in this study follows the International Labour Organisation’s (ILO) defi nition, according to which “employment covers any work, be it for wage or salary, profi t or family gain”, and includes both “paid employment” and “self-employment”, taking into consideration that “employers, own-account workers and members of producers’ cooperatives should be considered as in self-employment”.
Rural employment is any activity, occupation, work, business or service performed by rural people by force or for remuner-ation, profi t, social or family gain, in cash or kind, including under a contract of hire, written or oral, expressed or implied and without regard to whether the service is performed on a self-directed, part-time, full-time or casual basis. This defi nition in-cludes farmers, fi shers, forest users, pastoralists, those performing domestic work, and other self-employed rural peoples, temporary, casual, piece-rate, own-account, migrant, and home-based workers (vegetable market vendors, day labourers, artisans, etc.) in the informal sector; part or full-time contract workers, farmers, sharecroppers, and tenants; small, medium and large farm, food processing, and off-farm enterprises; and both unionised and unorganised workers.
4.3. Cooperative employment estimates (globally, regionally and locally)
4.3.1 Global estimates
Presented for the fi rst time at the Second International Summit of Cooperatives held in Quebec, Canada from 06 to 09 October 2014, the study “Cooperatives and employment: a global report” carried out by the ICA’s International Organisa-tion of Industrial, Artisanal and Service Producers’ Cooperatives (CICOPA), the Alliance›s sector for industrial and service cooperatives, discusses the signifi cance of cooperative employment globally, both quantitatively and qualitatively. It shows
12
how cooperatives contribute to resilient employment, a sustainable economy and the well-being of people at work, making up almost 12% of the entire employed population of the G20 countries.
Together cooperatives employ over twelve (12) million persons or roughly 0,2% of the world’s population. In relative terms, this is slightly larger than the entire adult population of Ecuador. The summit illustrated more clearly how important the cooperative movement is to the world economy. As cited in various studies that were presented during the summit, there are 2,6 million cooperatives worldwide, with 1 billion members and 12,6 million jobs. Within the G20 nations, cooperatives account for 12% of all jobs and annual revenue of US$3 000 billion.
Sector No. of cooperatives No. of members No. of employees
Banking/credit unions 210 559 703 070 123 2 452 130
Insurance 3 644 248 864 961 409
Agriculture 1 224650 122 120 167 1 181 682
Utilities 1 714 19 858 921 94 882
Grocery/consumer 81 437 97 869 940 875 181
Worker 84 799 4 369 600 1 218 751
Housing 15 247 16 383048 102 823
Health 1 700 3 441 221 153 180
Education and social 87 998 21 876 054 497 445
Purchasing or marketing 41 865 26 256 054 3 402 008
Other or undefi ned 760 985 56 296 177 1 671 257
Total worldwide 2 514 598 1 071 790 167 12 610 748
Table 11: Global membership in cooperatives (Source: UN Secretariat Results of 2014)
4.3.2. Regional estimates
Region Co-ops Membership Employee
Africa-Sub Sahara 85 260 18 509 605 10 914
Table 12: Memberships in Sub-Sahara Africa (Source: UN Secretariat Results of 2014)
Table 12 above indicates that Africa-Sub-sahara accounts for about ten thousand jobs from eighty fi ve thousand cooper-atives with a combined membership of over eighteen million (Statistics of South African cooperatives are not included in these fi gures).
13
4.3.3. Employment opportunities created by cooperatives in the sector (South Africa)
ProvinceNature of employment
Permanent Part time
2013/14 2014/15 Variance 2013/14 2014/15 Variance
Eastern Cape 1504 1 738 234 318 318 0
Free State 128 814 686 46 83 37
Gauteng 463 651 188 58 61 3
KwaZulu-Natal 702 868 166 542 988 446
Limpopo 694 1 056 362 611 798 187
Mpumalanga 722 855 133 264 293 29
Northern Cape 42 46 4 15 60 45
North West 461 561 100 196 205 9
Western Cape 170 170 6 82 150 68
Total 4 886 6 759 1 879 2 132 2 956 824
Table 13: Job opportunities created by cooperatives in the sector
4.3.3.1. Three-year analysis of employment in cooperatives.
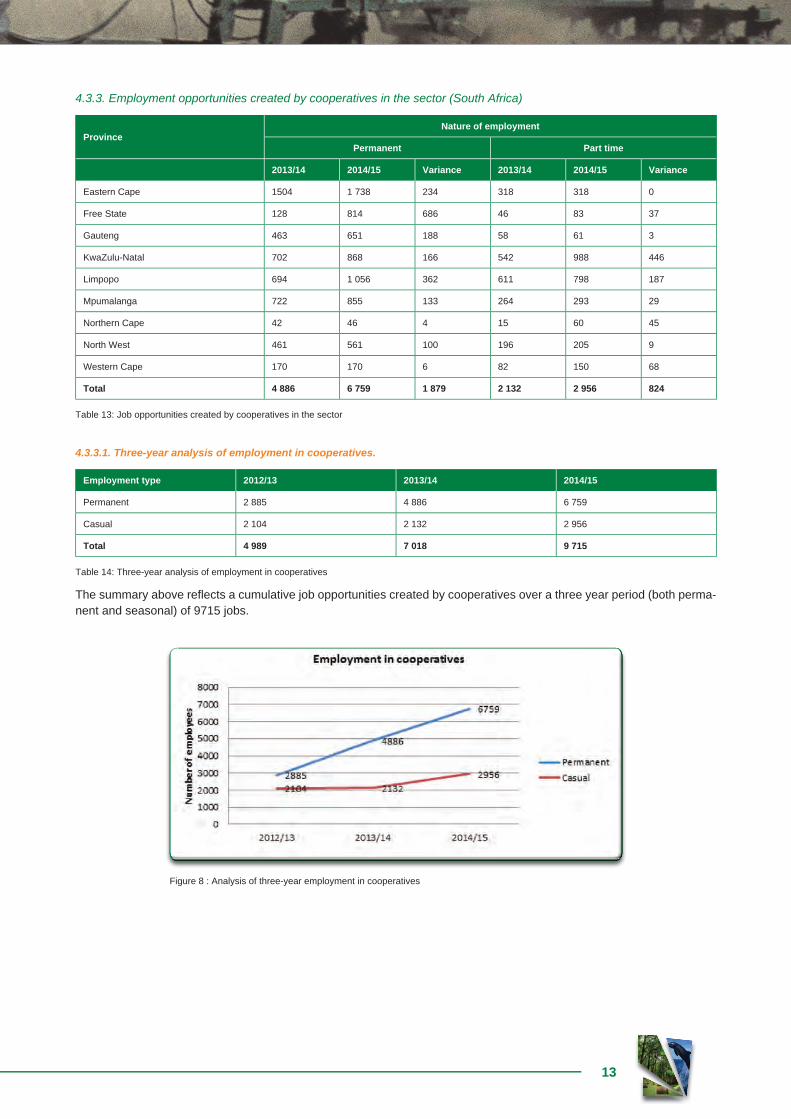
Employment type 2012/13 2013/14 2014/15
Permanent 2 885 4 886 6 759
Casual 2 104 2 132 2 956
Total 4 989 7 018 9 715
Table 14: Three-year analysis of employment in cooperatives
The summary above refl ects a cumulative job opportunities created by cooperatives over a three year period (both perma-nent and seasonal) of 9715 jobs.
Figure 8 : Analysis of three-year employment in cooperatives
14
4.4. Gender in cooperative employment
Province
Type of employment
Permanent Casual
Male Female Male Female
Eastern Cape 747 1 013 147 149
Free State 423 394 48 32
Gauteng 267 387 18 40
KwaZulu-Natal 364 497 407 588
Limpopo 391 665 321 477
Mpumalanga 309 546 117 176
Northern Cape 31 12 37 26
North West 262 299 115 90
Western Cape 127 49 105 39
Total 2 921 3 862 1315 1 617
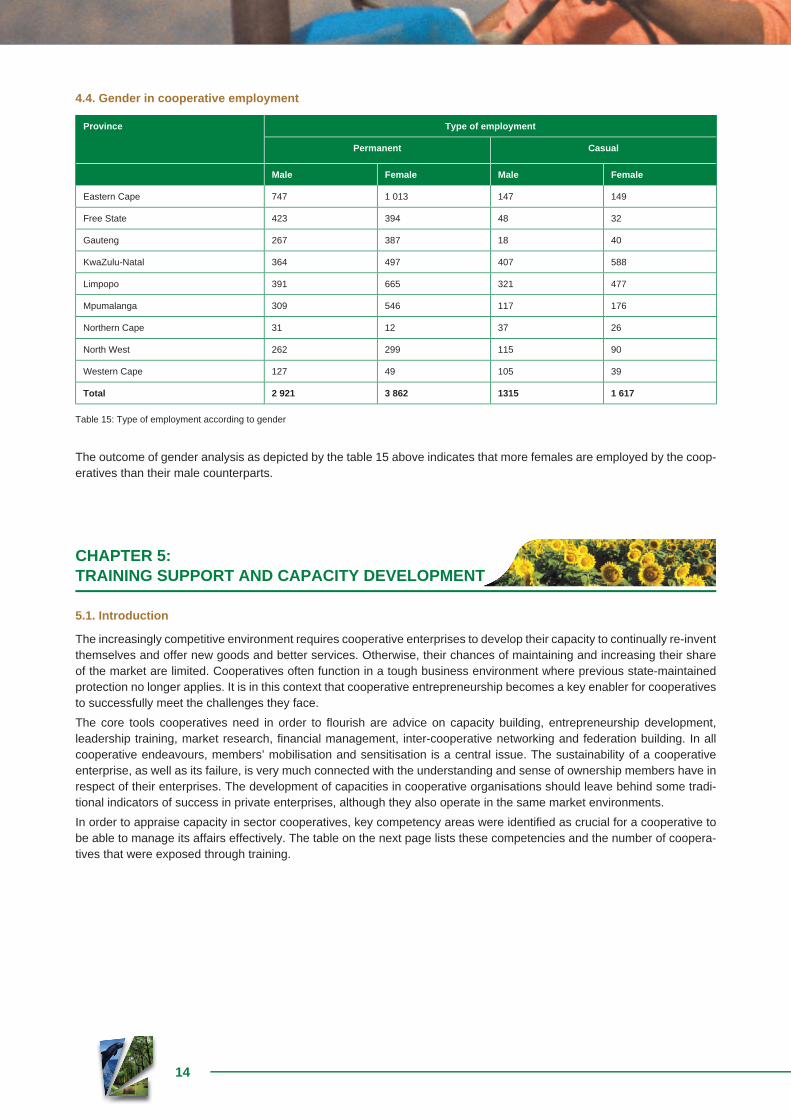
Table 15: Type of employment according to gender
The outcome of gender analysis as depicted by the table 15 above indicates that more females are employed by the coop-eratives than their male counterparts.
CHAPTER 5:TRAINING SUPPORT AND CAPACITY DEVELOPMENT
5.1. Introduction
The increasingly competitive environment requires cooperative enterprises to develop their capacity to continually re-invent themselves and offer new goods and better services. Otherwise, their chances of maintaining and increasing their share of the market are limited. Cooperatives often function in a tough business environment where previous state-maintained protection no longer applies. It is in this context that cooperative entrepreneurship becomes a key enabler for cooperatives to successfully meet the challenges they face.
The core tools cooperatives need in order to fl ourish are advice on capacity building, entrepreneurship development, leadership training, market research, fi nancial management, inter-cooperative networking and federation building. In all cooperative endeavours, members’ mobilisation and sensitisation is a central issue. The sustainability of a cooperative enterprise, as well as its failure, is very much connected with the understanding and sense of ownership members have in respect of their enterprises. The development of capacities in cooperative organisations should leave behind some tradi-tional indicators of success in private enterprises, although they also operate in the same market environments.
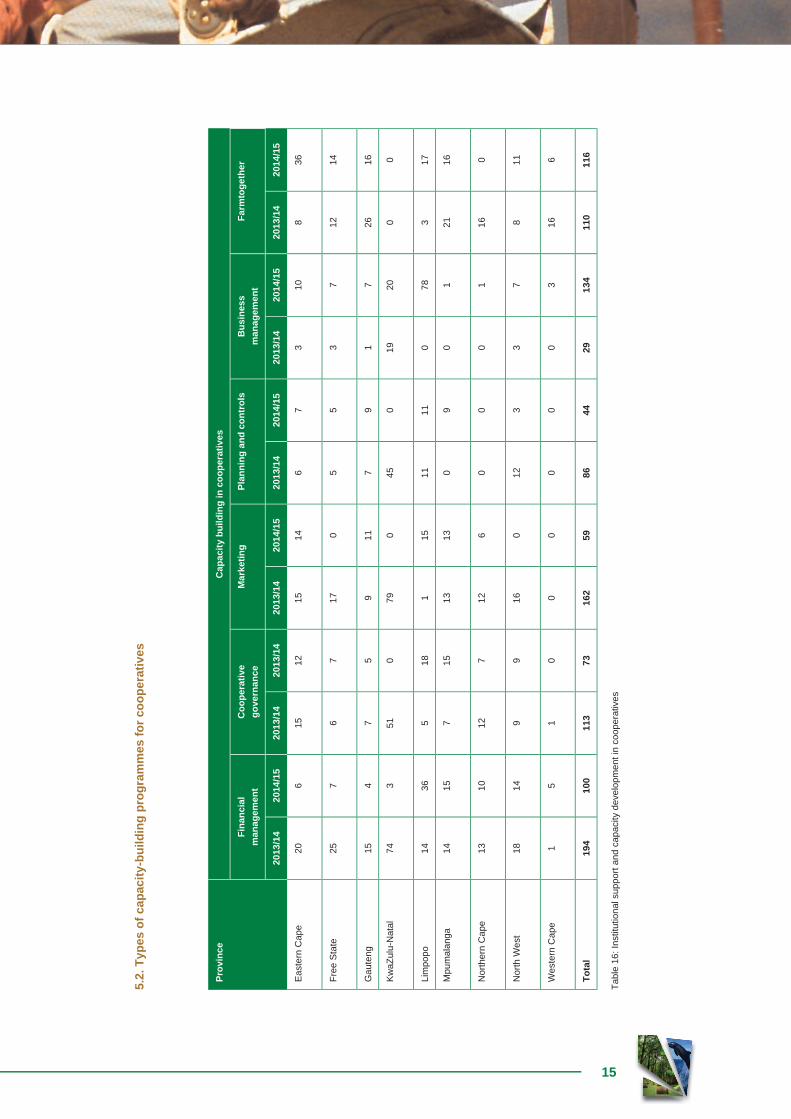
In order to appraise capacity in sector cooperatives, key competency areas were identifi ed as crucial for a cooperative to be able to manage its affairs effectively. The table on the next page lists these competencies and the number of coopera-tives that were exposed through training.
15
Tab
le 1
6: In
stitu
tiona
l sup
port
and
cap
acity
dev
elop
men
t in
coop
erat
ives
5.2.
Typ
es o
f ca
pac
ity-
bu
ildin
g p
rog
ram
mes
fo
r co
op
erat
ives
Pro
vin
ceC
apac
ity
bu
ildin
g in
co
op
erat
ives
Fin
anci
alm
anag
emen
tC
oo
per
ativ
eg
ove
rnan
ceM
arke
tin
gP
lan
nin
g a
nd
co
ntr
ols
Bu
sin
ess
man
agem
ent
Far
mto
get
her
20
13/1
420
14/1
520
13/1
420
13/1
420
13/1
420
14/1
520
13/1
420
14/1
520
13/1
420
14/1
520
13/1
420
14/1
5
Eas
tern
Cap
e20
615
1215
146
73
108
36
Fre
e S
tate
257
67
170
55
37
1214
Gau
teng
15
47
59
117
91
726
16
Kw
aZul
u-N
atal
743
510
790
450
1920
00
Lim
popo
1436
518
115
1111
078
317
Mpu
mal
anga
1415
715
1313
09
01
2116
Nor
ther
n C
ape
1310
127
126
00
01
160
Nor
th W
est
1814
99
160
123
37
811
Wes
tern
Cap
e1
51
00
00
00
316
6
To
tal
194
100
113
7316
259
8644
2913
411
011
6
16
Figure 9: Institutional capacity building and support
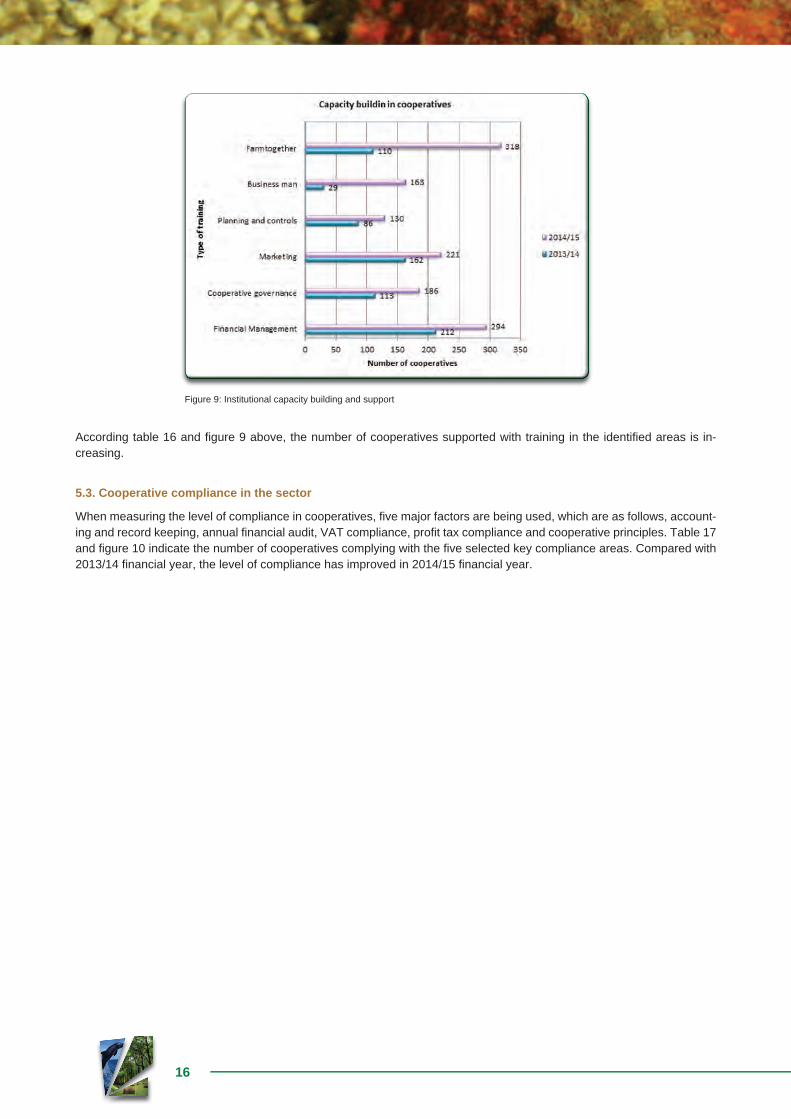
According table 16 and fi gure 9 above, the number of cooperatives supported with training in the identifi ed areas is in-creasing.
5.3. Cooperative compliance in the sector
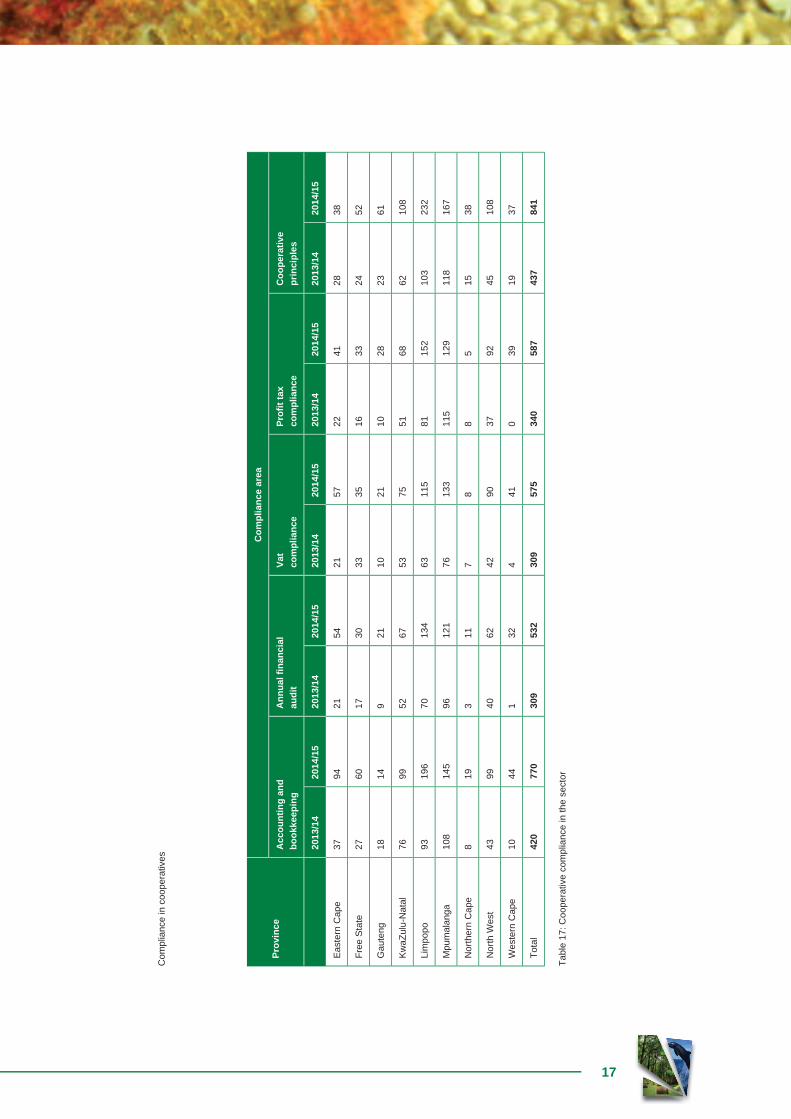
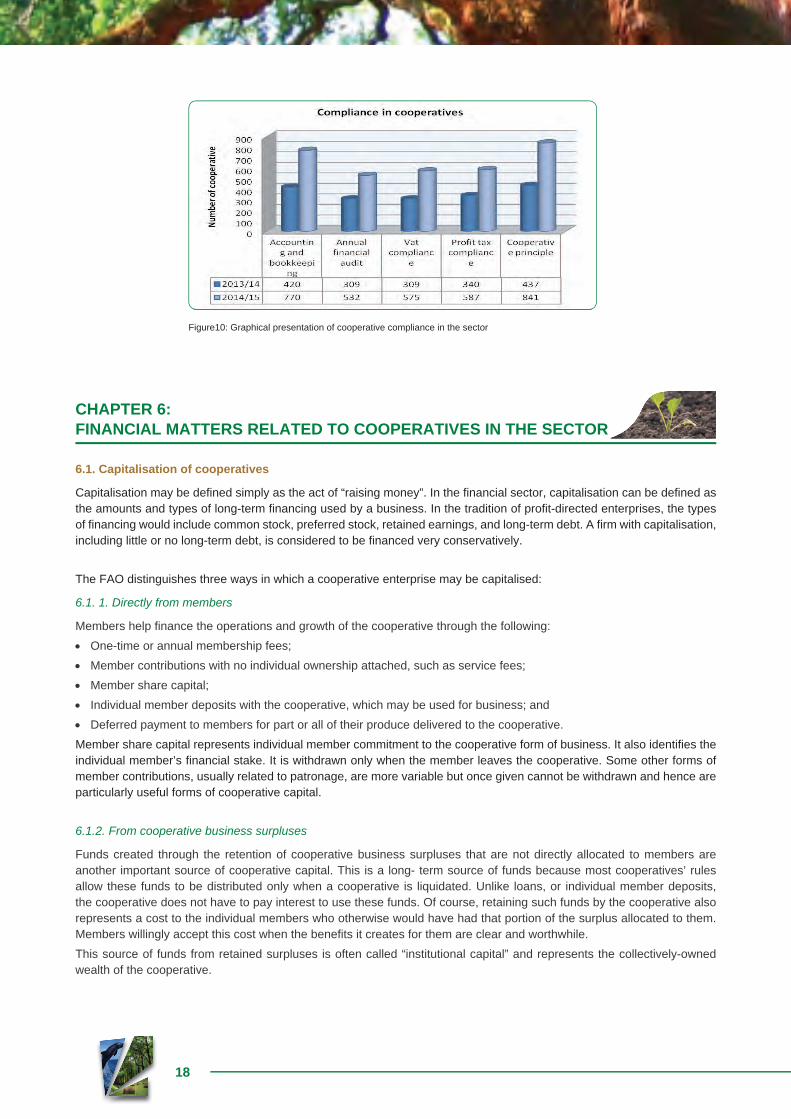
When measuring the level of compliance in cooperatives, fi ve major factors are being used, which are as follows, account-ing and record keeping, annual fi nancial audit, VAT compliance, profi t tax compliance and cooperative principles. Table 17 and fi gure 10 indicate the number of cooperatives complying with the fi ve selected key compliance areas. Compared with 2013/14 fi nancial year, the level of compliance has improved in 2014/15 fi nancial year.
17
Pro
vin
ce
Co
mp
lian
ce a
rea
Acc
ou
nti
ng
an
db
oo
kkee
pin
gA
nn
ual
fi n
anci
alau
dit
Vat
com
plia
nce
Pro
fi t
tax
com
plia
nce
Co
op
erat
ive
pri
nci
ple
s
2013
/14
2014
/15
2013
/14
2014
/15
2013
/14
2014
/15
2013
/14
2014
/15
2013
/14
2014
/15
Eas
tern
Cap
e37
9421
5421
5722
4128
38
Fre
e S
tate
2760
1730
3335
1633
2452
Gau
teng
18
149
2110
2110
2823
61
Kw
aZul
u-N
atal
7699
5267
5375
5168
6210
8
Lim
popo
9319
670
134
6311
581
152
103
232
Mpu
mal
anga
108
145
9612
176
133
115
129
118
167
Nor
ther
n C
ape
819
311
78
85
1538
Nor
th W
est
4399
4062
4290
3792
4510
8
Wes
tern
Cap
e10
441
324
410
3919
37
Tot
al
420
770
309
532
309
575
340
587
437
841
Com
plia
nce
in c
oope
rativ
es
Tab
le 1
7: C
oope
rativ
e co
mpl
ianc
e in
the
sect
or
18
Figure10: Graphical presentation of cooperative compliance in the sector
CHAPTER 6: FINANCIAL MATTERS RELATED TO COOPERATIVES IN THE SECTOR
6.1. Capitalisation of cooperatives
Capitalisation may be defi ned simply as the act of “raising money”. In the fi nancial sector, capitalisation can be defi ned as the amounts and types of long-term fi nancing used by a business. In the tradition of profi t-directed enterprises, the types of fi nancing would include common stock, preferred stock, retained earnings, and long-term debt. A fi rm with capitalisation, including little or no long-term debt, is considered to be fi nanced very conservatively.
The FAO distinguishes three ways in which a cooperative enterprise may be capitalised:
6.1. 1. Directly from members
Members help fi nance the operations and growth of the cooperative through the following:
One-time or annual membership fees;
Member contributions with no individual ownership attached, such as service fees;
Member share capital;
Individual member deposits with the cooperative, which may be used for business; and
Deferred payment to members for part or all of their produce delivered to the cooperative.
Member share capital represents individual member commitment to the cooperative form of business. It also identifi es the individual member’s fi nancial stake. It is withdrawn only when the member leaves the cooperative. Some other forms of member contributions, usually related to patronage, are more variable but once given cannot be withdrawn and hence are particularly useful forms of cooperative capital.
6.1.2. F rom cooperative business surpluses
Funds created through the retention of cooperative business surpluses that are not directly allocated to members are another important source of cooperative capital. This is a long- term source of funds because most cooperatives’ rules allow these funds to be distributed only when a cooperative is liquidated. Unlike loans, or individual member deposits, the cooperative does not have to pay interest to use these funds. Of course, retaining such funds by the cooperative also represents a cost to the individual members who otherwise would have had that portion of the surplus allocated to them. Members willingly accept this cost when the benefi ts it creates for them are clear and worthwhile.
This source of funds from retained surpluses is often called “institutional capital” and represents the collectively-owned wealth of the cooperative.
19
6.1.3. From outsiders
I n addition to institutional capital and member capital, cooperatives often make use of external sources of funds to run their operations or to fi nance investments. These non-member sources of funds may include cooperative or commercial banks, suppliers, government or donor agencies. External funding may be provided in different ways:
as a grant,
as a short term-loan,
as a long-term loan, and
as a trade credit offered by a supplier.
Commercial providers of funds, such as banks, generally provide credit or loans that are legally secured by collateral (pledged assets of the cooperative). They are motivated by profi t and seek to minimise risk. Non-commercial providers, such as governments or donors, generally provide credit on more generous terms at below market rates of interest or pro-vide grants. Their motivations may be social, political or economic and often a combination of all three.
6.2. The gearing ratio
T he more assets the cooperative owns and has fully paid for (buildings, equipment, stock and fi nancial reserves) the more others are willing to lend additional funds. Also, the greater the amount of the cooperative’s institutional plus member cap-ital, the higher the amount that can safely be borrowed from outside sources. Financial leverage, or gearing, is expressed by a percentage ratio which gives an indication of the degree of risk involved in borrowing funds. The higher the gearing ratio, the higher the risk the cooperative runs in losing its assets in the event of inability to repay a loan. The gearing ra-tio relates to the amount of externally borrowed capital to the total capital employed by the cooperative (institutional and member capital plus borrowed funds).
6.3. Sources of capital for cooperatives in the sector
6.3.1. Equity
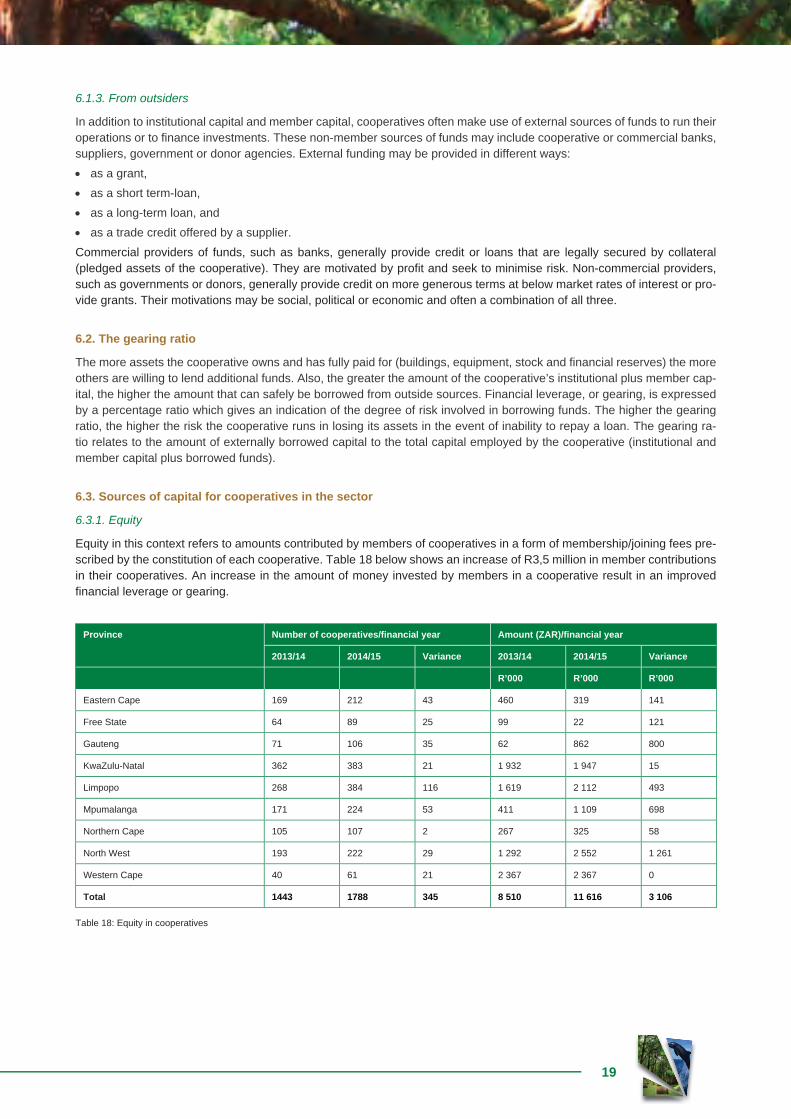
Equity in this context refers to amounts contributed by members of cooperatives in a form of membership/joining fees pre-scribed by the constitution of each cooperative. Table 18 below shows an increase of R3,5 million in member contributions in their cooperatives. An increase in the amount of money invested by members in a cooperative result in an improved fi nancial leverage or gearing.
Province Number of cooperatives/fi nancial year Amount (ZAR)/fi nancial year
2013/14 2014/15 Variance 2013/14 2014/15 Variance
R’000 R’000 R’000
Eastern Cape 169 212 43 460 319 141
Free State 64 89 25 99 22 121
Gauteng 71 106 35 62 862 800
KwaZulu-Natal 362 383 21 1 932 1 947 15
Limpopo 268 384 116 1 619 2 112 493
Mpumalanga 171 224 53 411 1 109 698
Northern Cape 105 107 2 267 325 58
North West 193 222 29 1 292 2 552 1 261
Western Cape 40 61 21 2 367 2 367 0
Total 1443 1788 345 8 510 11 616 3 106
Table 18: Equity in cooperatives
20
Figure 11: Members contribution in cooperatives
6.3.2. Investment by DAFF through grants
As indicated in 6.1 above, in addition to institutional capital and member capital, cooperatives often make use of external sources of funds to run their operations or to fi nance their business activities. These non-member sources of funds may include cooperative or commercial banks, suppliers, government or donor agencies. This section presents the results of analysis undertaking on external sources of fi nance for sector cooperatives in a form of grants mainly from the Department (DAFF), provinces (PDA’s) and other government departments. The table below shows a cumulative amount of R178 mil-lion invested in sector cooperatives by DAFF in the form of grants over a period of two years.
Province Number of cooperatives Grant amount (ZAR) Cumulative amount
2013/14 2014/15 2013/14 2014/15
R’000 R’000 R’000
Eastern Cape 32 17 9 654 7 126 9 829
Free State 20 5 990 13 805 14 795
Gauteng 8 21 460 638 1 098
KwaZulu-Natal 22 27 0 12 655 12 655
Limpopo 15 28 8 788 40 683 49 471
Mpumalanga 8 12 179 34 275 34 454
Northern Cape 5 4 0 685 685
North West 40 61 27 631 47 944 75 575
Western Cape 2 11 3 300 10 033 13 333
Total 152 186 51 002 127 162 178 164
Table 19: Grants by DAFF
21
6.3.3. Investment by other intuitions through grants
6.3.3.1. Eastern Cape
Name of institution Number of cooperatives Grant amount (ZAR)
R’000
Municipality 10 35 441
Shell SA 1 150
DSD 2 32 606
DRDLR 2 637
DWS 1 150
NDA 1 2 000
DEDEA 1 350
NETS AFRICA 10 4 000
ARC 1 180
TINA SINAKO 1 2 000
Total 30 77 513
Table 20: Grants by external stakeholders in the Eastern Cape
6.3.3.2. Free State
Name of institution Number of cooperatives Grant amount (ZAR)
R’000
Harmony gold mine 2 3 000
Total 2 3 000
Table 21: Grants by external stakeholders in the Free State
6.3.3.3. Gauteng
Name of institution Number of cooperatives Grant amount (ZAR)
R’000
dti 5 574
DRDLR 1 390
DSD 1 920
DL 1 200
NDA 1 250
Total 9 2 334
Table 22: Grants by external stakeholders in Gauteng
22
6.3.3.4. Limpopo
Name of institution Number of cooperatives Grant amount (ZAR)
R’000
dti 4 1 400
AFGRI 1 700
LEDA 1 177
DSD 1 500
NDA 1 1 800
VDM 1 1 500
DRDLR 1 2 500
Total 10 8 577
Table 23: Grants by external stakeholders in Limpopo
6.3.3.5. Mpumalanga
Name of institution Number of cooperatives Grant amount (ZAR)
R’000
CRDP 1 2 000
NYDA 1 27
Total 2 2 027
Table 24: Grants by external stakeholders in Mpumalanga
6.3.3.6. North West
Name of institution Number of cooperatives Grant amount (ZAR)
R’000
IDC 1 2 200
Total 1 2 200
Table 25: Grants by external stakeholders in the North West
6.3.3.7. Western Cape Province
Name of institution Number of cooperatives Grant amount (ZAR)
R’000
DRDLR 2 2 500
Total 2 2 500 000
Table 26: Grants by external stakeholders in the Western Cape
6.3.4. Investment through loans
External funding to cooperatives does not only come in the form of grants but also in the form of loans either from the department or other stakeholders. This section presents the results of analysis of external funding in the form of loans.
6.3.4.1. Investment by DAFF through loans
DAFF provides loan funding to cooperatives for production purposes through the Micro agricultural Financial Institutions of South Africa (Mafi sa). These funds are disbursed through accredited service providers authorised to retail the funds.

23
Province Number of cooperatives Loan amount (ZAR)
R’000
Eastern Cape 11 3 486
KwaZulu-Natal 5 870
North West 1 2
Total 16 4 358
Table 27: Loans by DAFF
6.3.4.2. Investment by other institutions through loans
Province Institution Number of cooperatives Loan amount (ZAR)
R’000
Gauteng Land Bank 1 120
ABSA Bank 1 85
Total 2 205
Table 28: Loans by external stakeholders
6.3.5. Comparison between grants and loans
Grants Loans
R’000 R’000
225 313 4 379
Table 29: Comparison between grants and loans
Figure 12: Comparison between grants and loans
6.4. Financial performance of cooperatives in the sector (annual turnover)
6.4.1. Global estimates
The new World Cooperative Monitor launched this week, reveals that together cooperatives around the world generated US$2,96 trillion in national revenue. This is done through leveraging of their combined asset base of US$ 19,6 trillion. It is further estimated that combined, the global cooperative economy is larger than France’s economy and places it right behind Germany’s economy as the 5th largest economic unit if it were a united country. The table that follows illustrates the
24
economic importance of cooperatives globally as extracted from the results of the 2014 Global Census on Cooperatives by the United Nations (UN).
Global estimates of annual turnover by cooperatives
Sector No. of cooperatives
No. of members
No. of employees
Assets (USD) Annual grossturnover (USD)
R’000 R’000
Banking/credit unions 210 559 703 070 123 2 452 130 11 262 671 499 167 413 448
Insurance 3 644 248 864 961 409 7 500 074 559 1 219 472 098
Agriculture/Grocery 1 224 650 122 120 167 1 181 682 133 811 867 337 705 145
Utilities 1 714 19 858 921 94 882 141 544 317 41 944 022
Grocery/Consumer 81 437 97 869 940 875 181 243 888 763 154 573 071
Worker 84 799 4 369 600 1 218 751 1 393 874 124 821 200
Housing 15 247 16 383 048 102 823 52 405 481 20 709 518
Health 1 700 3 441 221 153 180 485 789 4 075 077
Education and social 87 998 21 876 052 497 445 840 678 12 305 812
Purchasing or marketing 41 865 26 256 054 3 402 008 239 000 352 736 631 647
Other or undefi ned 760 985 56 296 177 1 671 257 31 310 913 143 245 072
Worldwide totals 2 514 598 1 071 790,167 12 610 748 19 607 428 2 962 896 113
Table 30: Global annual turnover by cooperatives (Source: UN Secretariat Results of 2014)
6.4.2. Estimates of turnover by local sector cooperatives
Province Turnover (ZAR)
F/Y 2012/13 F/Y 2013/14 F/Y 2014/15
R’000 R’000 R’000
Eastern Cape 16 037 3 712 20
Free State 2 616 1 456 5 118
Gauteng 2 100 9 112 810
KwaZulu-Natal 24 589 15 485 24 589
Limpopo 6 718 10 098 22 421
Mpumalanga 6 200 19 711 698
Northern Cape 1 460 564 4 881
North West 3 740 31 245 4 516
Western Cape 100 43 2101 74 302
Total (R) 63 560 134 594 157 679
Table 31: Financial performance over a three year period
Table 31 above provides comparisons of turnover generated by cooperatives in the sector over a three-year period. To-gether, the 1 788 cooperatives surveyed generated R157,7 million in annual revenue during the 2014/15 fi nancial year.
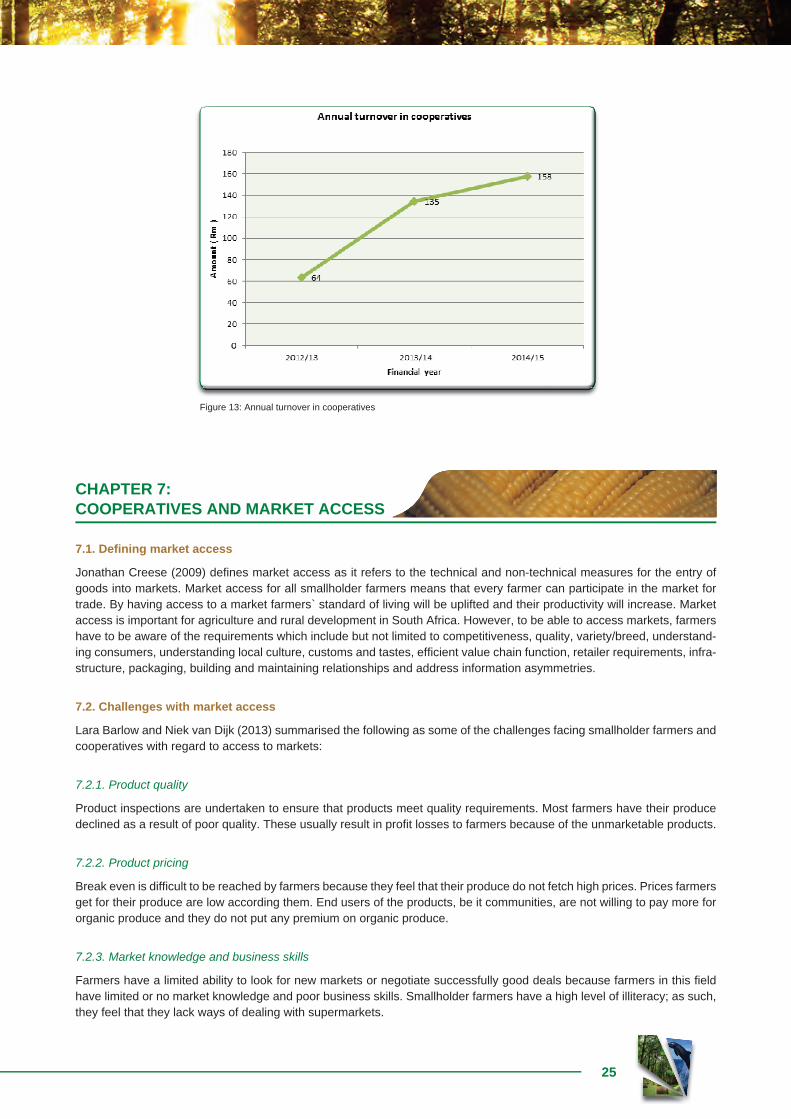
25
Figure 13: Annual turnover in cooperatives
CHAPTER 7:COOPERATIVES AND MARKET ACCESS
7.1. Defi ning market access
Jonathan Creese (2009) defi nes market access as it refers to the technical and non-technical measures for the entry of goods into markets. Market access for all smallholder farmers means that every farmer can participate in the market for trade. By having access to a market farmers` standard of living will be uplifted and their productivity will increase. Market access is important for agriculture and rural development in South Africa. However, to be able to access markets, farmers have to be aware of the requirements which include but not limited to competitiveness, quality, variety/breed, understand-ing consumers, understanding local culture, customs and tastes, effi cient value chain function, retailer requirements, infra-structure, packaging, building and maintaining relationships and address information asymmetries.
7.2. Challenges with market access
Lara Barlow and Niek van Dijk (2013) summarised the following as some of the challenges facing smallholder farmers and cooperatives with regard to access to markets:
7.2.1. Product quality
Product inspections are undertaken to ensure that products meet quality requirements. Most farmers have their produce declined as a result of poor quality. These usually result in profi t losses to farmers because of the unmarketable products.
7.2.2. Product pricing
Break even is diffi cult to be reached by farmers because they feel that their produce do not fetch high prices. Prices farmers get for their produce are low according them. End users of the products, be it communities, are not willing to pay more for organic produce and they do not put any premium on organic produce.
7.2.3. Market knowledge and business skills
Farmers have a limited ability to look for new markets or negotiate successfully good deals because farmers in this fi eld have limited or no market knowledge and poor business skills. Smallholder farmers have a high level of illiteracy; as such, they feel that they lack ways of dealing with supermarkets.
26
Other challenges with market access include lack of appropriate infrastructure, limited access and high cost to improve farm inputs and production technology, insuffi cient agricultural services, lack of access of facilities for agricultural credit and the ownership and control of productive land.
7.3. Types of markets accessed by cooperatives in the sector
7.3.1 Eastern Cape
Institutions supplied Number of cooperatives supplying
Spar 3
Hoppsin & Karen 1
Boxer 2
East London market 1
Shepstone 1
Steers 1
Total 9
Table 32: Markets accessed by Eastern Cape cooperatives
7.3.2 Free State
Institutions supplied Number of cooperatives supplying
Albert Boarding School 1
BKB 1
Mangaung Fresh Produce Market 2
Boxer Supermarket 1
Cambridge Supermarket 1
Local government 1
Econo Fish 4
J.S Poultry 1
Overland 1
Pick n Pay Supermarket 1
Ponelopele 1
Tshwane Fresh Produce Market 1
Senwes Kooperasie 1
Shoprite Supermarket 1
Sky country 1
Supreme Chicken 1
Thabanchu Butchery 1
Veriland 1
Welkom 1
Grain SA 1
Total 24
Table 33: Markets accessed by Free State cooperatives
27
7.3.3 Gauteng Province
Institutions supplied Number of cooperatives supplying
Joburg Fresh Produce Market 1
Hospitals 1
Hotel Swazi Inn 1
Hawkers Association 1
Pick n Pay 1
Retailers 1
Total 6
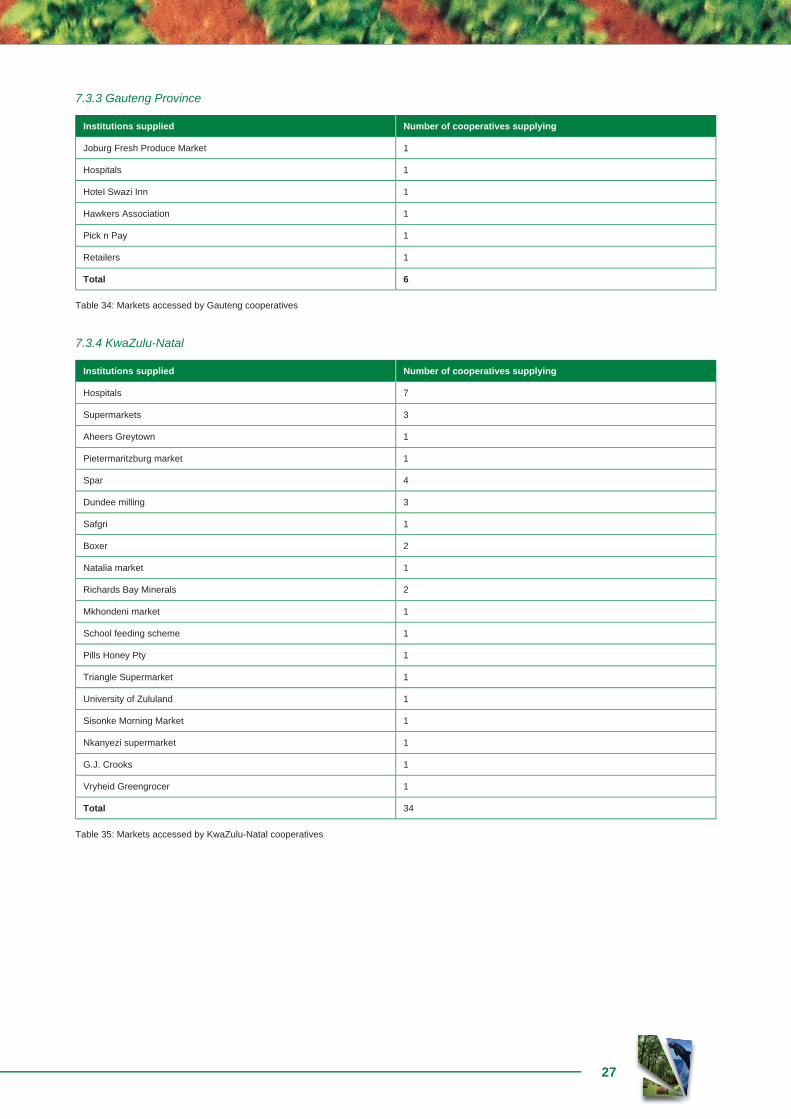
Table 34: Markets accessed by Gauteng cooperatives
7.3.4 KwaZulu-Natal
Institutions supplied Number of cooperatives supplying
Hospitals 7
Supermarkets 3
Aheers Greytown 1
Pietermaritzburg market 1
Spar 4
Dundee milling 3
Safgri 1
Boxer 2
Natalia market 1
Richards Bay Minerals 2
Mkhondeni market 1
School feeding scheme 1
Pills Honey Pty 1
Triangle Supermarket 1
University of Zululand 1
Sisonke Morning Market 1
Nkanyezi supermarket 1
G.J. Crooks 1
Vryheid Greengrocer 1
Total 34
Table 35: Markets accessed by KwaZulu-Natal cooperatives
28
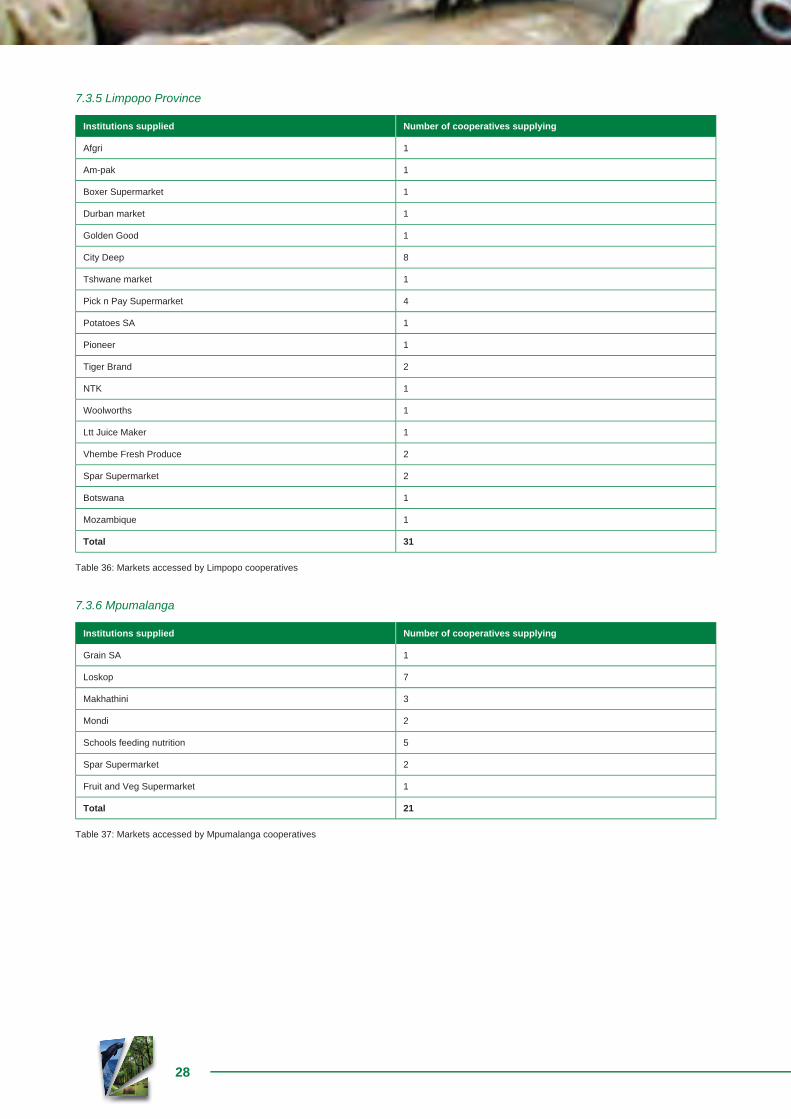
7.3.5 Limpopo Province
Institutions supplied Number of cooperatives supplying
Afgri 1
Am-pak 1
Boxer Supermarket 1
Durban market 1
Golden Good 1
City Deep 8
Tshwane market 1
Pick n Pay Supermarket 4
Potatoes SA 1
Pioneer 1
Tiger Brand 2
NTK 1
Woolworths 1
Ltt Juice Maker 1
Vhembe Fresh Produce 2
Spar Supermarket 2
Botswana 1
Mozambique 1
Total 31
Table 36: Markets accessed by Limpopo cooperatives
7.3.6 Mpumalanga
Institutions supplied Number of cooperatives supplying
Grain SA 1
Loskop 7
Makhathini 3
Mondi 2
Schools feeding nutrition 5
Spar Supermarket 2
Fruit and Veg Supermarket 1
Total 21
Table 37: Markets accessed by Mpumalanga cooperatives
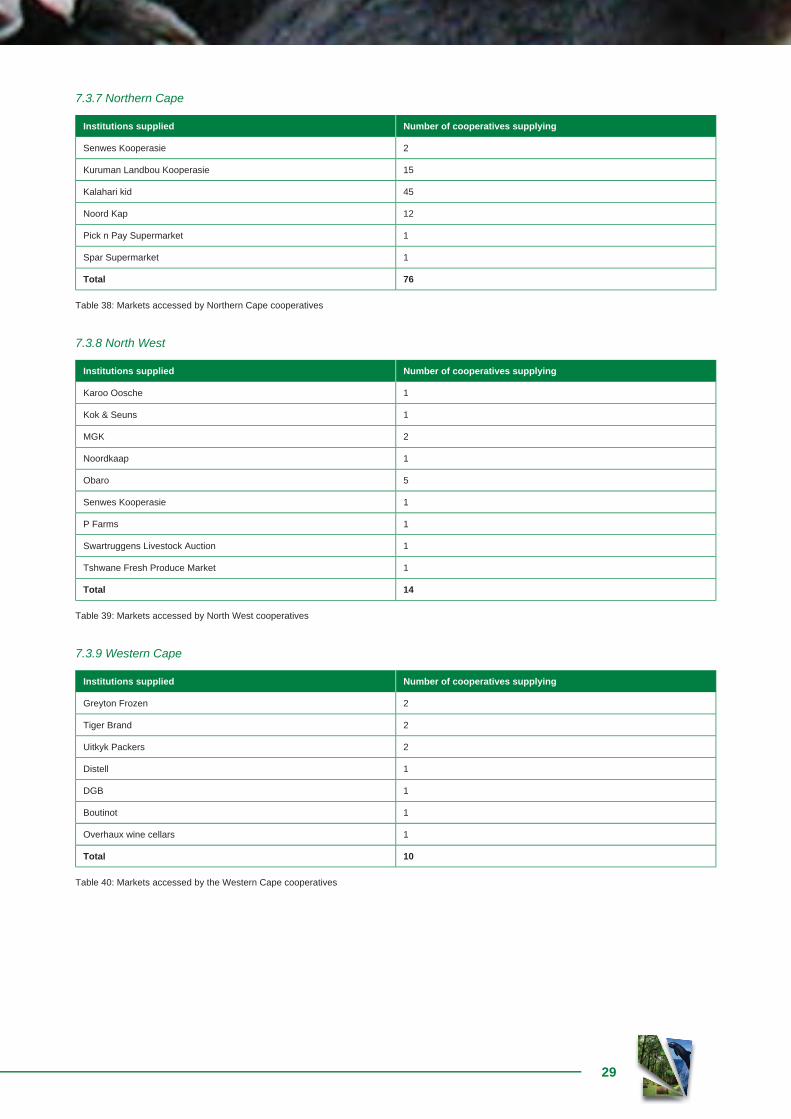
29
7.3.7 Northern Cape
Institutions supplied Number of cooperatives supplying
Senwes Kooperasie 2
Kuruman Landbou Kooperasie 15
Kalahari kid 45
Noord Kap 12
Pick n Pay Supermarket 1
Spar Supermarket 1
Total 76
Table 38: Markets accessed by Northern Cape cooperatives
7.3.8 North West
Institutions supplied Number of cooperatives supplying
Karoo Oosche 1
Kok & Seuns 1
MGK 2
Noordkaap 1
Obaro 5
Senwes Kooperasie 1
P Farms 1
Swartruggens Livestock Auction 1
Tshwane Fresh Produce Market 1
Total 14
Table 39: Markets accessed by North West cooperatives
7.3.9 Western Cape
Institutions supplied Number of cooperatives supplying
Greyton Frozen 2
Tiger Brand 2
Uitkyk Packers 2
Distell 1
DGB 1
Boutinot 1
Overhaux wine cellars 1
Total 10
Table 40: Markets accessed by the Western Cape cooperatives
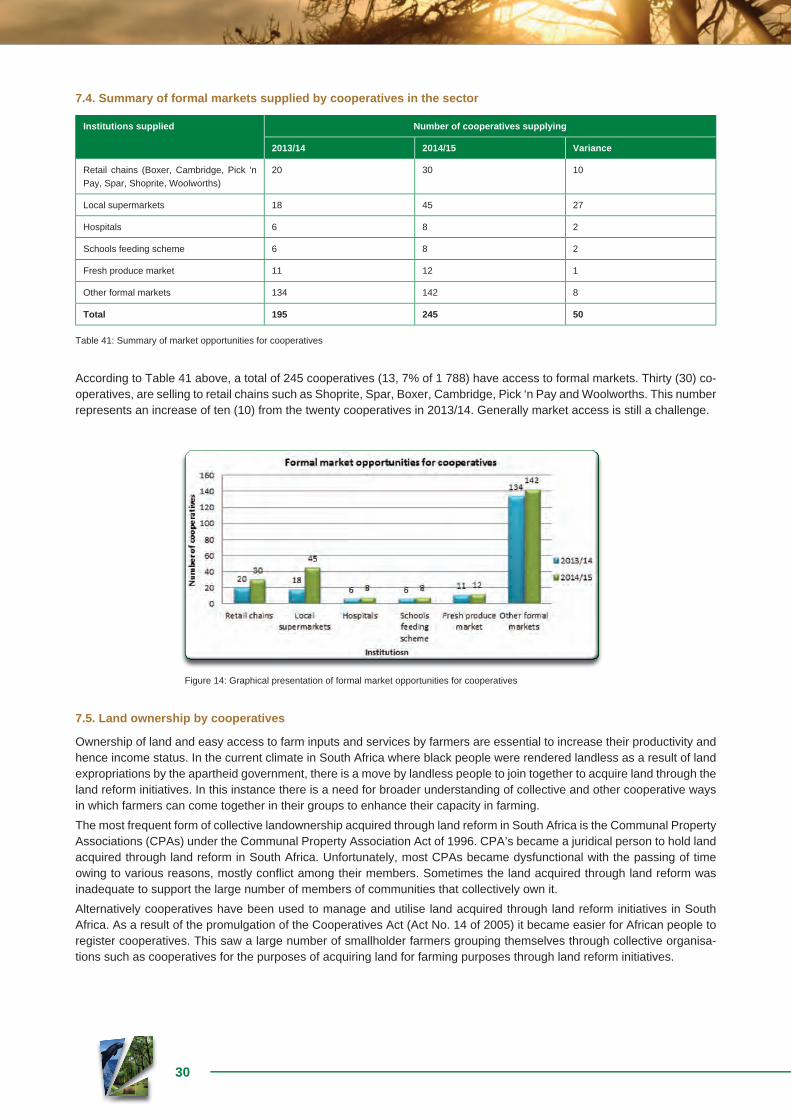
30
7.4. Summary of formal markets supplied by cooperatives in the sector
Institutions supplied Number of cooperatives supplying
2013/14 2014/15 Variance
Retail chains (Boxer, Cambridge, Pick ‘n Pay, Spar, Shoprite, Woolworths)
20 30 10
Local supermarkets 18 45 27
Hospitals 6 8 2
Schools feeding scheme 6 8 2
Fresh produce market 11 12 1
Other formal markets 134 142 8
Total 195 245 50
Table 41: Summary of market opportunities for cooperatives
According to Table 41 above, a total of 245 cooperatives (13, 7% of 1 788) have access to formal markets. Thirty (30) co-operatives, are selling to retail chains such as Shoprite, Spar, Boxer, Cambridge, Pick ‘n Pay and Woolworths. This number represents an increase of ten (10) from the twenty cooperatives in 2013/14. Generally market access is still a challenge.
Figure 14: Graphical presentation of formal market opportunities for cooperatives
7.5. Land ownership by cooperatives
Ownership of land and easy access to farm inputs and services by farmers are essential to increase their productivity and hence income status. In the current climate in South Africa where black people were rendered landless as a result of land expropriations by the apartheid government, there is a move by landless people to join together to acquire land through the land reform initiatives. In this instance there is a need for broader understanding of collective and other cooperative ways in which farmers can come together in their groups to enhance their capacity in farming.
The most frequent form of collective landownership acquired through land reform in South Africa is the Communal Property Associations (CPAs) under the Communal Property Association Act of 1996. CPA’s became a juridical person to hold land acquired through land reform in South Africa. Unfortunately, most CPAs became dysfunctional with the passing of time owing to various reasons, mostly confl ict among their members. Sometimes the land acquired through land reform was inadequate to support the large number of members of communities that collectively own it.
Alternatively cooperatives have been used to manage and utilise land acquired through land reform initiatives in South Africa. As a result of the promulgation of the Cooperatives Act (Act No. 14 of 2005) it became easier for African people to register cooperatives. This saw a large number of smallholder farmers grouping themselves through collective organisa-tions such as cooperatives for the purposes of acquiring land for farming purposes through land reform initiatives.
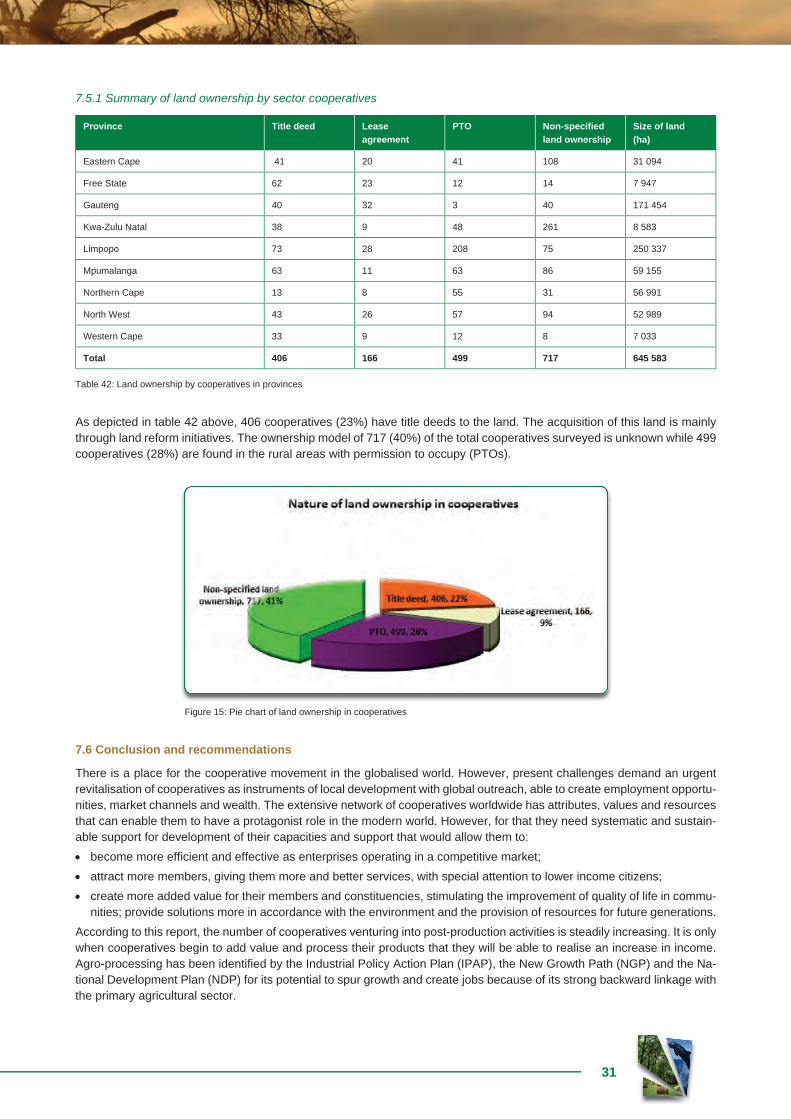
31
7.5.1 Summary of land ownership by sector cooperatives
Province Title deed Lease agreement
PTO Non-specifi edland ownership
Size of land(ha)
Eastern Cape 41 20 41 108 31 094
Free State 62 23 12 14 7 947
Gauteng 40 32 3 40 171 454
Kwa-Zulu Natal 38 9 48 261 8 583
Limpopo 73 28 208 75 250 337
Mpumalanga 63 11 63 86 59 155
Northern Cape 13 8 55 31 56 991
North West 43 26 57 94 52 989
Western Cape 33 9 12 8 7 033
Total 406 166 499 717 645 583
Table 42: Land ownership by cooperatives in provinces
As depicted in table 42 above, 406 cooperatives (23%) have title deeds to the land. The acquisition of this land is mainly through land reform initiatives. The ownership model of 717 (40%) of the total cooperatives surveyed is unknown while 499 cooperatives (28%) are found in the rural areas with permission to occupy (PTOs).
Figure 15: Pie chart of land ownership in cooperatives
7.6 Conclusion and recommendations
There is a place for the cooperative movement in the globalised world. However, present challenges demand an urgent revitalisation of cooperatives as instruments of local development with global outreach, able to create employment opportu-nities, market channels and wealth. The extensive network of cooperatives worldwide has attributes, values and resources that can enable them to have a protagonist role in the modern world. However, for that they need systematic and sustain-able support for development of their capacities and support that would allow them to:
become more effi cient and effective as enterprises operating in a competitive market;
attract more members, giving them more and better services, with special attention to lower income citizens;
create more added value for their members and constituencies, stimulating the improvement of quality of life in commu-nities; provide solutions more in accordance with the environment and the provision of resources for future generations.
According to this report, the number of cooperatives venturing into post-production activities is steadily increasing. It is only when cooperatives begin to add value and process their products that they will be able to realise an increase in income. Agro-processing has been identifi ed by the Industrial Policy Action Plan (IPAP), the New Growth Path (NGP) and the Na-tional Development Plan (NDP) for its potential to spur growth and create jobs because of its strong backward linkage with the primary agricultural sector.
32
The amount of investment into cooperatives by the department is also showing an upward movement as compared to pre-vious fi nancial years. So is the annual revenue generated together by all cooperatives surveyed. However, private sector funding is still a challenge. Cooperatives in the sector struggle to obtain fi nance from private institutions mainly because of risks associated with the cooperative business model and lack of collaterals.
As voluntary organisations, cooperatives are open to all persons able to use their services and willing to accept the respon-sibilities of membership, without gender, social, political, racial or religious discrimination. By extension, it simply means that cooperatives without members who consume their services will not function. Membership is at core of cooperative enterprises. Globally, agriculture and food cooperatives represent a signifi cant portion of the cooperative sector in devel-oped and developing countries. Thirty per cent (30%) of the 300 largest cooperatives are found in the agricultural sector. The number of farmers belonging to cooperatives in the sector is also showing an upward trend from 35 000 in 2013/14 to about 41 000 in 2014/15.
Market access remains a challenge for cooperatives in the sector. The fact that only 13,7% of the total cooperatives on CODAS have access to a formal market with only 30 cooperatives supplying the retail chain supermarkets in the country is a cause for concern. This could be attributed to a variety of issues, including quality, inadequate and inconsistent vol-umes, lack of compliance with set standards and specifi cations of markets, inappropriate production and post-production infrastructure, just to mention few.
The department continues to make efforts to promote and support institutionalisation of smallholder farmers into com-modity cooperatives to enable them to benefi t from economies of scale and scope. Training and capacity development is at the centre of cooperative development programmes within the department. Cooperatives in the sector are supported among others to strengthen the governance issues, business planning, market access, food safety and quality assurance, self-diagnosis using the Agri-appraisal tool. Cooperatives are also supported fi nancially through departmental fi nancing instruments such as Mafi sa, CASP and the AgriBEE Fund.
33
ANNEXURES
8.1 Business analysis sheet (data collecting questionnaire)
1 2
Co-op/SHG Mafi sa
COOPERATIVES AND ENTERPRISE DEVELOPMENTBUSINESS ANALYSIS SHEET
Part 1
Summary business description
Province
District
Municipality
Ward
Name of business
Postal address
Physical address
Contact Person
Contact Number
Latitude (coordinates)
Longitude (coordinates)
Name of bank
Type of Account
Type of business
Main activity
Size of land(ha) (crops) Total ha Grazing Cropping Under irrigation
Dry land
Landownership Title deed Lease PTO Other
Number of animals (livestock Business)
Totalanimals
livestock Small stock
Pigs
Number of Birds (poultry business) Total number of chicken Poultry (layers and broilers) Ostrich
Secondary activity
Marketing Information Formal markets (list names) Informal markets (list names)
Year of registration
Registration number
Beginning of the Business
Legal status (co-operative, self help group, NPO, individuals, etc.)
34
Part 2
Basic information
Type of Enterprise (Tick the applicable one only)
Group enterprise Individual enterprise
Select the type of enterprise in terms of gender, people with disability or non-specifi ed
Male dominated
Female dominated
Youth dominated
People with disability dominated
Non-specifi ed
Form of Co-operative (Please tick the applicable form)
Primary co-op Secondary co-op Tertiary co-op
Is the business active or dormant? Active Dormant
NB: Total number of members = sum total of males and females members
Total Number of members (M + F)
(M)ales (F)emales (Y)outh (D)People with disabilities
Total number of registered members
Number of active members
Number of members attending AGM
Last AGM held number of members attending)
Number of management committee members
Chairperson of committee
Manager
Manager’s qualifi cations
Employees (full time)
Employees (part time)
Part 3
Current status of the business (NB: Please tick one option)
Tick Tick
Operational & Expanding Dormant but has potential
Operational & Stable Dormant but has no potential
Unstable but has potential Liquidation
Unstable but has no potential Closed
New & stable
35
Part 4
INTERNAL EVALUATION Yes No
Feasibility study conducted/ business plan study
Recommendations on the study conducted (if yes)
Is there any monitoring and evaluation system/plan Yes No
Outline plan (if yes)
Are there any plans to have one (if no)
Mentorship/Strategic Partner
Exit strategy ensuring that business activities can continue on a sustainable basis
Type of subcommittees Finance Marketing Training Other (specify)
Part 5
Budget (Please indicate year of fi gures)
PREVIOUS YEAR CURRENT YEAR
Expenditure per annum Wages
Operations
Turnover per annum
Part 6
Funding
Source of funding Amount Programme Financial Year
e.g. Department of Agriculture
e.g. 200 000 e.g. CASP e.g.2008/09
Equity(Own Funding)
Grants 1.
2.
3.
4.
Borrowings (Loans) 1.
2.
3.
4.
36
Part 7
Training
Type of trainingreceived
Duration of training
NQF/Skills programmelevel
Service provider/funder
Year of training
Number of members attended
M F Y D
Financial Management
Corporate Governance
Planning and Controls
Marketing
Other (specify)
Part 8
Internal controls
Accounting and bookkeeping Available Not available
Annual fi nancial audit Comply Not comply
VAT Compliance Comply Not comply
Profi t tax compliance Comply Not comply
Cooperative principles Comply Not comply
Part 9
Main threats
Outstanding loans owed to banks
Outstanding loans owed to members
Outstanding payments to members
Number of competitors
Other types of threats e.g. theft, draught, etc.
Year of data collection/update: ..............................................................................................................................................Completed by ............................................. Position .......................................... Date .......................................................Signature ....................................................
Comments by Extension Offi cer................................................................................................................................................................................................................................................................................................................................................................................................................................................................................................................................................................................................................................................................................................................................................................................................
Checked by .................................................. Date ................................................
Contact details of the Local Agricultural Offi ce (land line): ....................................................................................................NB: M= Male, F= Female, Y= Youth and D= People with disabilities

Notes

Notes

Notes

Notes