compendium of management practices for statistical
TRANSCRIPT

Catalogue no. 11-634-X ISBN 978-0-660-05813-9
Compendium of Management Practices for Statistical Organizations from Statistics Canada’s International Statistical Fellowship Program
Release date: July 6, 2016

Standard table symbolsThe following symbols are used in Statistics Canada publications:
. not available for any reference period
.. not available for a specific reference period
... not applicable 0 true zero or a value rounded to zero 0s value rounded to 0 (zero) where there is a meaningful distinction between true zero and the value that was rounded p preliminary r revised x suppressed to meet the confidentiality requirements of the Statistics Act E use with caution F too unreliable to be published * significantly different from reference category (p < 0.05)
How to obtain more informationFor information about this product or the wide range of services and data available from Statistics Canada, visit our website, www.statcan.gc.ca. You can also contact us by email at [email protected] telephone, from Monday to Friday, 8:30 a.m. to 4:30 p.m., at the following toll-free numbers:
• Statistical Information Service 1-800-263-1136 • National telecommunications device for the hearing impaired 1-800-363-7629 • Fax line 1-877-287-4369
Depository Services Program
• Inquiries line 1-800-635-7943 • Fax line 1-800-565-7757
Published by authority of the Minister responsible for Statistics Canada
© Minister of Industry, 2016
All rights reserved. Use of this publication is governed by the Statistics Canada Open Licence Agreement.
An HTML version is also available.
Cette publication est aussi disponible en français.
Note of appreciationCanada owes the success of its statistical system to a long-standing partnership between Statistics Canada, the citizens of Canada, its businesses, governments and other institutions. Accurate and timely statistical information could not be produced without their continued co-operation and goodwill.
Standards of service to the publicStatistics Canada is committed to serving its clients in a prompt, reliable and courteous manner. To this end, Statistics Canada has developed standards of service that its employees observe. To obtain a copy of these service standards, please contact Statistics Canada toll-free at 1-800-263-1136. The service standards are also published on www.statcan.gc.ca under “Contact us” > “Standards of service to the public.”

Statistics Canada – Catalogue no. 11-634-X 3
Table of Contents
Table of Contents
Foreword .................................................................................................................................................. 5Introduction .............................................................................................................................................. 6Acknowledgements .................................................................................................................................. 8
Section 1 – Characteristics of an effective national statistical system ....................... 9
Introduction .............................................................................................................................................. 9Chapter 1.1 – Leadership and coordination of the national statistical system ...................................... 11Chapter 1.2 – The United Nations Fundamental Principles of Official Statistics ................................... 21Chapter 1.3 – Following international standards .................................................................................... 31Chapter 1.4 – Understanding users’ needs and maintaining relationships ............................................ 41Chapter 1.5 – Quality Management ....................................................................................................... 51Chapter 1.6 - Partnerships on a cost-recovery basis ............................................................................ 61
Section 2 – Core management practices............................................................................... 69
Introduction ............................................................................................................................................ 69Chapter 2.1 – Organizational structure and matrix management .......................................................... 71Chapter 2.2 – Integrated Strategic Planning .......................................................................................... 81Chapter 2.3 – Financial Management .................................................................................................... 93Chapter 2.4 – Project Management Framework .................................................................................... 99Chapter 2.5 – Human resources planning and management ............................................................... 107Chapter 2.6 – Internal communications ............................................................................................... 121Chapter 2.7 – Information Management .............................................................................................. 127Chapter 2.8 – Program Evaluation ....................................................................................................... 133Chapter 2.9 – Internal audit .................................................................................................................. 139
Section 3 – Improving, modernizing and finding efficiencies ...................................... 143
Introduction .......................................................................................................................................... 143Chapter 3.1 – Corporate Business Architecture ................................................................................... 145Chapter 3.2 – Modernization of Information Technology and Informatics Services ............................ 155Chapter 3.3 – Enhancing how surveys are conducted......................................................................... 175Chapter 3.4 – Data collection planning and management ................................................................... 187Chapter 3.5 – Acquisition, use and management of administrative data and alternative data ............ 197Chapter 3.6 – Gender Statistics ........................................................................................................... 205
Compendium of Management Practices for Statistical Organizations From Statistics Canada’s International Statistical Fellowship Program

Statistics Canada – Catalogue no. 11-634-X4
Compendium of Management Practices for Statistical Organizations From Statistics Canada’s International Statistical Fellowship Program
Section 4 – Communicating with key stakeholders ........................................................ 213
Introduction .......................................................................................................................................... 213Chapter 4.1 – Disseminating data through the website ....................................................................... 215Chapter 4.2 – External communications and outreach ........................................................................ 223Chapter 4.3 – Management of, and access to, metadata .................................................................... 233Chapter 4.4 – Access to microdata ...................................................................................................... 237Chapter 4.5 – Relations with survey participants ................................................................................. 243Chapter 4.6 – Respecting privacy and protecting confidentiality ........................................................ 249
Conclusion ........................................................................................................................................... 257

Statistics Canada – Catalogue no. 11-634-X 5
Foreword
Foreword
by Johannes Jütting, Manager, Secretariat of the Partnership in Statistics for Development in the 21st Century (PARIS21)
The year 2015 marked a milestone for the relevance of data and statistics in the world of development. The international community agreed to commit to a new development agenda that sets goals and targets that will challenge, and also to give prominence to statistical systems in both developing and developed countries alike. The Sustainable Development Goals (SDGs) create an unprecedented demand for data in a broad range of policy fields, triggering new momentum for engagement in statistical capacity building while drawing attention to the importance of data for sustainable development. The discussions around the complex SDG indicator framework, recently endorsed by the United Nations Statistical Commission in New York, have accelerated this process.
Governments from around the world will need timely, accurate and comprehensive data in order to make the right decisions to implement their national SDG action plans and effectively contribute to the 2030 Agenda for Sustainable Development. Yet, policy makers will be faced with a very diverse set of challenges in order to access this information. The Millennium Development Goals, which focussed primarily on traditional development topics, have shown the difficult nature - especially for least developed countries - of measuring progress even in the most basic areas such as poverty reduction or maternal mortality. This is primarily a consequence of inadequate human, technical and financial resources that need to be addressed by the development community in order to empower local governments. Furthermore, special hardship circumstances such as lack of security or difficult accessibility also play a central role.
Yet, while some of these obstacles to measuring progress are likely to remain for many developing countries under the SDG framework, opportunities to draw from new sources of data have dramatically increased in recent years. In addition to information stemming from traditional sources such as census or civil registration data, governments today can consider the use of crowdsourced data from web applications, big data produced by commercial and non-governmental organisations and data collected through satellite or drone technology. This is an important aspect of what is understood as the Data Revolution, a process that, as the High-level Panel report on the Post-2015 Agenda states, “draws on existing and new sources of data to fully integrate statistics into decision making, promote open access to, and use of, data and ensure increased support for statistical systems.”
Today, we are confronted with a situation in which statistical capacity building has the potential of tipping the scales for global development; in which old challenges remain and new opportunities emerge. The agreement on the 2030 Agenda for Sustainable Development was reached through an unprecedented global governance effort, but it will be primarily up to national and local governments to provide real impact for citizens. The data community therefore needs to continue to focus on improving national statistical systems, harnessing the current momentum and especially helping governments make use of the new technical and political opportunities that are available.
Statistics Canada’s Compendium of Management Practices for Statistical Organizations is a very important and timely contribution to this effort. By focusing on the organisation’s expertise in advancing managerial capacity in the national statistical offices of developing countries, the publication empowers governments to make the right decisions and properly track their progress on SDG and their national statistical development strategy (NSDS) implementation. It addresses central aspects of effective management, such as leadership and co-ordination, quality control, budgeting, external relations and partnerships as well as the integration of best practices and international norms. Advancing national statistical offices in these areas is not only important to improve core competencies and strengthen their role as the national statistical system coordinator but it also creates a foundation to develop human and technical capacities so that new areas of operation can be explored and opportunities from the data revolution leveraged.
Finally, a fundamental aspect of this publication is its emphasis on previously successful applications of managerial practices. By determining success factors for each chapter and developing subsequent strategic implications, the Compendium of Management Practices is a hands-on guide for practitioners to create effective organisational improvements. Statistics Canada presents a crucial approach to transforming experience and knowledge in statistical capacity building into practical solutions for officials in national statistical offices. This work is a highly valuable contribution to the continued effort of helping statistical offices around the world adapt to a new era of development. We hope that this publication will facilitate and guide the statistical work of national statistical offices to achieve success.

Statistics Canada – Catalogue no. 11-634-X6
Compendium of Management Practices for Statistical Organizations From Statistics Canada’s International Statistical Fellowship Program
Introduction
On behalf of Statistics Canada, I am very pleased to present this compendium of management practices for statistical organizations. It is based on the many achievements of Statistics Canada’s International Statistical Fellowship Program (ISFP).
The ISFP was established in February 2011 under a five-year co-operation agreement between Statistics Canada and the Canadian International Development Agency (now part of Global Affairs Canada), with the goal of making it easier to share knowledge and best practices in leadership and management with the top managers of national statistical offices of countries in Africa, Latin America and the Caribbean. To fill the management capacity needs and deficiencies identified by these organizations, the ISFP sought to build the knowledge of senior managers, develop lasting solutions to local challenges, and increase accountability at the regional and local levels with respect to the adoption and sharing of best management practices.
Fourteen ISFP seminars were held to train nearly 165 top managers from more than 45 countries. These seminars, each lasting five to eight days, gave senior managers from ISFP target countries an opportunity to attend presentations given by Statistics Canada’s senior executives and managers and to talk about the possibilities, opportunities and solutions of adaptation and applicability, taking local or regional specificities into account.
To ensure that sharing this knowledge lasts and to broaden its use and utility, Statistics Canada decided to develop this compendium of lessons learned and best practices. It consists of 28 chapters divided into four main sections:
• Characteristics of an effective national statistical system
• Core management practices
• Improving, modernizing and finding efficiencies
• Communicating with key stakeholders
The content of the chapters is structured the same for readability. Each chapter deals with a specific topic and analyzes the context, the strategies, mechanisms and tools used, the key factors for success, and the challenges, and ends with a look toward the future. The content is largely based on Statistics Canada’s experience, since it served as the backdrop for the program. However, the chapters were written not as a list of recipes to be followed systematically and in their entirety, but rather as a collection of techniques, principles, mechanisms and tools that an effective national statistical office should consider and adapt to its own national circumstances. These are illustrated by examples from Statistics Canada and enhanced by content from ISFP participating countries.
The compendium is not intended to replicate what already exists, but rather to supplement reference works on management for statistical organizations,1 based on Statistics Canada’s experience.
I hope that this compendium will be very useful in strengthening statistical systems and capabilities. I hope you enjoy consulting it.
Wayne R. Smith
Chief Statistician of Canada
1. This list is not exhaustive. It identifies various reference works, including the following:
• African Union (2009). African Charter on statistics. Consulted on the 31st of March 2016. Retrieved from http://www.paris21.org/sites/default/files/AU-English_African_Charter-web.pdf
• Kiregyera, Ben (2015). The Emerging Data Revolution in Africa: Strengthening the Statistics, Policy and Decision-making Chain. Stellenbosch, South Africa: African Sun Media.

Statistics Canada – Catalogue no. 11-634-X 7
Introduction
• Organization for Economic Co-operation and Development (2015). Draft Recommendation of the Council on Good Statistical Practice, Note by the Secretary-General. Consulted on 11th of March 2016. Retrieved from http://acts.oecd.org/Instruments/ShowInstrumentView.aspx?InstrumentID=331&InstrumentPID=380&Lang=en&Book=
• PARIS 21 (2014). National Strategy for the Development of Statistics (NSDS). Consulted on the 31st of March 2016. Retrieved from http://nsdsguidelines.paris21.org/
• United Nations (2005). Handbook of Statistical Organization, Third Edition. The Operation and Organization of a Statistical Agency. Studies in Methods, Series F, no. 88. New York. Consulted on 11th of March 2016. Retrieved from http://unstats.un.org/unsd/publication/SeriesF/SeriesF_88E.pdf
• United Nations (2014). Fundamental Principles of Official Statistics. Resolution A/68/L.36. March 3. General Assembly. New York. Consulted on 11th of March 2016. Retrieved from http://unstats.un.org/unsd/dnss/gp/FP-New-E.pdf
• United Nations (2016). Guidelines for managers in statistical organizations. Note by the Modernisation Committee on the Organizational Framework and Evaluation, under the High Level Group for the Modernisation of Official Statistics.

Statistics Canada – Catalogue no. 11-634-X 8
Acknowledgments
Acknowledgements
This compendium was prepared within the framework of the International Statistical Fellowship Program (ISFP) under the general direction of Valérie Bizier, program manager, together with Kenza Bouchaara, its main author and publication coordinator.
Statistics Canada wishes to thank Global Affairs Canada, ISFP sponsor, for its financial contribution to the publication of this compendium. Without that funding, this project would not have been possible.
We also wish to acknowledge the hard work of many people at Statistics Canada, in particular the following:
Project team: Valérie Bizier, Kenza Bouchaara, Andrea Ness and Alex Renaud
Writers: Kenza Bouchaara, Nancy Zukewich, Valérie Bizier, Robert McLellan and Jennifer Stevens
Steering committee: Sylvie Michaud, Gabrielle Beaudoin, Stéphane Dufour, Connie Graziadei, Karen Mihorean and Eric Rancourt
Editors: Richard Barnabé and André Castonguay
Also, still at Statistics Canada, the following collaboration was important to complete the project: the support, contribution to content and feedback of experts in programs and subject-matter divisions; editing and translation provided by Communications Division’s services; Norma Chhab-Alperin and Hew Gough for Spanish editing; and the web dissemination services provided by the Dissemination Division.
Lastly, it is important to mention the co-operation of external partners in enhancing the content of the compendium and ensuring its relevance, through the contribution of Paris 21 and the national statistical offices of the United Kingdom, Cape Verde, Senegal, Colombia and Ecuador.

Statistics Canada – Catalogue no. 11-634-X 9
Section 1 - Characteristics of an effective national statistical system Introduction
Section 1 – Characteristics of an effective national statistical system
IntroductionThis section addresses the characteristics, or foundations, of an effective national statistical system.
To ensure the credibility, relevance and sustainability of a statistical system, certain foundations are essential. In this section, each of the foundations will be examined in detail in its own chapter. The chapters will convey good management practices for each relevant field, and explain the significance of these practices and how to implement them. These chapters will also focus on Canadian practices within the context of a national statistical agency operating as part of a centralized system.
The first chapter of this section concerns the leadership and coordination of a national statistical system. It highlights the importance of the legal context in which the system operates, irrespective of the type of statistical system; the role of the chief statistician; the fundamental values of the statistical agency; and the planning and management mechanisms.
The second chapter considers the importance of the ten United Nations Fundamental Principles of Official Statistics, and the reasons for which statistical agencies should view them as pillars of their activities. Examples are provided to acquaint readers with the mechanisms and tools used by Statistics Canada, and to demonstrate how the agency ensures that each principle is observed.
The third chapter describes the need for statistical agencies to use international standards and apply them in the way most appropriate and relevant to their specific context. This chapter highlights the strategic considerations and processes associated with adopting, implementing and maintaining international standards.
The fourth chapter presents the need to consult with data users and maintain key relationships with them. To ensure that its data are relevant, a statistical agency must be attuned to its users and must understand and address user needs to the best of its ability. Examples are provided to demonstrate the consultation strategies and mechanisms Statistics Canada uses to reach out to its different audiences.
The fifth chapter examines quality management as a key determinant of the sustainability of the statistical system. It describes not only the different dimensions of quality, but also the mechanisms and tools that a statistical agency should develop and implement for optimal quality management.
The last chapter explores the opportunity for statistical agencies to carry out cost-recovery projects to enhance the relevance of their statistical product line and reduce data gaps. It also describes the preconditions of acceptance for such projects and the benefits they can produce, within both the statistical agency supplying the data and the organization receiving the data.

Statistics Canada – Catalogue no. 11-634-X10
Compendium of Management Practices for Statistical Organizations From Statistics Canada’s International Statistical Fellowship Program

Statistics Canada – Catalogue no. 11-634-X 11
Section 1 - Characteristics of an effective national statistical system Chapter 1.1 - Leadership and coordination of the national statistical system
Chapter 1.1 – Leadership and coordination of the national statistical system
ContextAlthough there is no official consensus within the United Nations or among other international organizations on the definition of a national statistical system (NSS), a generalized description—namely, “the ensemble of statistical organisations and units within a country that jointly collect, process and disseminate official statistics on behalf of the national government” 1—seems acceptable.
Accordingly, the objective of an NSS is to provide relevant, comprehensive, accurate and objective statistical information that sheds light on the major social, economic and environmental concerns and challenges of the country in question.2
While considering the foundations of and prerequisites for an effective national statistical system, as well as the advantages and disadvantages of “centralized” and “decentralized” systems, this chapter provides an overview of Canada’s centralized statistical system, as well as the leadership and coordination mechanisms used at Statistics Canada in the context of such a system.
Prerequisites of an effective national statistical system
An NSS3 comprises four stakeholder groups: data producers, data suppliers, data users, and researchers and training institutes. The following prerequisites must be met for an NSS to be effective:
• Adopt an approach centred on user needs: the information produced and published must be considered relevant and must meet the expectations and needs of users.
• Build statistical capacity and a facilitating infrastructure: resources (legal context, physical infrastructure, human resources, information and budget), statistical methods and practices, adapted information technologies, and appropriate professional and technical skills.
• Provide statistical coordination, which includes collaboration between NSS players, the reduction of duplication, information sharing, and the reduction of response burden.
• Provide effective governance in the public interest, based on strong leadership and solid management structures and practices.
• Encourage government-wide engagement and mobilization.
National statistical system models
Statistical systems are considered either centralized or decentralized, depending on the degree and scope of centralization in the production of official statistics between the central institution and the other data producing stakeholders.
The centralized and decentralized models have both advantages and disadvantages. Statistical systems are generally situated on a continuum i along which there are no fully decentralized or centralized systems. Systems are considered centralized when most statistical products are produced by the central organization. The best known examples of centralized statistical systems are the Australian Bureau of Statistics and Statistics Canada.
In contrast, systems are considered decentralized when the statistics are produced by several government entities. There can be several forms of such decentralization. When the production of official statistics is carried out by field of specialization—for example, when statistics pertaining to health, education and justice are the responsibility of their respective government departments or ministries—this is referred to as “horizontal”
1. UNITED NATIONS STATISTICS DIVISION. 2012. p. 10.2. FELLIGI. 1996. P.1693. KIREGYERA. 2015. p. 63–93.

Statistics Canada – Catalogue no. 11-634-X12
Compendium of Management Practices for Statistical Organizations From Statistics Canada’s International Statistical Fellowship Program
decentralization.” “Vertical decentralization”, on the other hand, occurs when different levels of government are involved in producing official statistics. This type of decentralization is often present in federations. The statistical system of the United Kingdom (UK) is an example that illustrates both types of decentralization (see Box 1.1.1).
As a general rule, centralized systems offer solid integrity and efficiency, but pose challenges with regard to relevance and the nature of their relationships with data suppliers and users. As for decentralized systems, their strength lies in proximity: their social and economic statistical units are part of the government departments or entities that operate in the same field, which facilitates relationships with policy makers.4
The advantages and disadvantages of both systems are summarized in Table 1.1.1, “The advantages and disadvantages of centralized and decentralized statistical systems.” Interestingly, the advantages of one system tend to be the disadvantages of the other.
Table 1.1.1The advantages and disadvantages of centralized and decentralized statistical systems
Centralized NSS Decentralized NSS
Advantages • CapaAbility to plan and coordinate across the entire statistical system
• Synergy that enables the grouping together of activities within the same organization
• Ability to establish and fund long-term priorities
• A centralized location for statistics
• Organizational policy orientations emphasize integrity, impartiality and common goals
• Closeness to policy makers means more relevant statistical products for these policies
• Statistics are closely tied to the management of administrative data and to information systems
Disadvantages • Lack of closeness to government users
• Perceived lack of flexibility or responsiveness if user consultation mechanisms are inadequate
• Difficulty coordinating and planning the system as a whole, and sectoral interests can take precedence over the common good
• Vulnerability to potential political pressures or the appearance thereof
• Difficulty establishing common standards
• Higher risk of duplicated efforts
• Harder-to-control response burden
Portrait of Canada’s statistical system
Canada is a confederation consisting of ten provinces and three territories. Constitutional powers are distributed between the federal government and the provinces and territories.
Since its inception in 1867, the Constitution of Canada has granted the federal government exclusive jurisdiction over “the Census and Statistics.” Thus, The Dominion Bureau of Statistics was founded in 1918. In turn, the legal foundation on which a centralized federal statistical body was created was made official by the Statistics Act, which became the instrument that granted Statistics Canada the legal authority to collect information and produce data, while protecting the confidentiality of respondents.
As a result, Statistics Canada stands at the centre of Canada’s centralized statistical system, and the Statistics Act grants it a permanent and very broad mandate. In addition to censuses, the agency produces a wide variety of social and economic data, including national accounts and the balance of payments.
4. MCLENNAN. 2002.

Statistics Canada – Catalogue no. 11-634-X 13
Section 1 - Characteristics of an effective national statistical system Chapter 1.1 - Leadership and coordination of the national statistical system
Other federal government departments and agencies develop a very limited number of statistical activities in very specialized fields. In most situations, they provide Statistics Canada with administrative data, which serve to produce official statistics. Each province and territory has its own statistical office, the size and importance of which vary by province or territory, ranging from a small group of people responsible for liaison and coordination, to an established office with analytical and operational capacity. In recent years, these offices have produced data that complement the data that Statistics Canada produces. However, even the most established offices are only a fraction of the size of Statistics Canada.
In summary, the Canadian national statistical system is composed of the following data producers:
• Statistics Canada, a central agency that is distinct but has the same legal status and administrative responsibilities as other federal departments and agencies;
• the central bank (responsible for monetary statistics);
• the provincial and territorial statistical offices (for matters under provincial jurisdiction, such as health, education and the administration of justice);
• the Canadian Institute for Health Information (CIHI), responsible for statistics from health-care institutions.
Strategies, mechanisms and tools The mechanisms and tools that characterize the efficacy of an NSS (whether centralized or decentralized) can be subsumed under four major components:
• the legal framework
• the role of the Chief Statistician
• the protection of fundamental values
• leadership and coordination with regard to four functions
− positioning the NSS
− holding consultations and maintaining partnerships
− influencing the national and international environments
− ensuring the appropriateness of planning, management and control mechanisms
1. The legal framework established by the Statistics Act
The legal framework is of crucial importance to the efficacy of an NSS, since it is through such a framework that leadership and coordination mechanisms are developed, and that the conditions surrounding the collection of information for statistical purposes are defined. This framework thus serves as an operational framework and a kind of navigational chart for all stakeholders.
In general terms, the Statistics Act grants two essential responsibilities to the statistical agency: (1) data collection and production; and (2) leadership and coordination with regard to statistics.
In the case of Statistics Canada, these responsibilities are articulated as follows.
1.1 Data collection and production
The Statistics Act empowers the agency to “collect, compile, analyze, abstract and publish statistical information relating to the commercial, industrial, financial, social, economic and general activities and condition of the people.”5
For the agency to carry out that function, the act includes the following provisions:
• authority to produce data related to virtually any social or economic matter (section 22);
5. GOVERNMENT OF CANADA. 2005.

Statistics Canada – Catalogue no. 11-634-X14
Compendium of Management Practices for Statistical Organizations From Statistics Canada’s International Statistical Fellowship Program
• authority to access to information held by third parties (departments and agencies, municipal offices, corporations, businesses, and other organizations) for statistical purposes, or or to correct or complete existing information (section 13);
• requirement to produce a census of population every five years (section 19)
• requirement to produce a census of agriculture every ten years (section 20).
The Statistics Act also specifies that all information requests from Statistics Canada are mandatory, unless expressly declared voluntary by the Minister responsible for the statistical institute. However, it is important to mention that this broad power to collect information comes with a strict guarantee that the confidentiality of the collected information will be protected. For more details, see Chapter 4.6 - Respecting privacy and protecting confidentiality.
1.2 Role of leadership and coordinator of statistical mattersThe Statistics Act grants Statistics Canada the role of leader, along with the responsibility for developing and promoting integrated social and economic data and for coordinating these functions with other federal departments, as well as the provinces and territories. For this collaboration to be managed effectively, Statistics Canada must consult its partners at the federal, provincial and territorial levels, and thus ensure that information needs are understood and considered, that programs remain relevant, and that priorities are current. These consultations also help avoid program overlap through data sharing; allow for agreements that provide access to administrative data, while establishing the terms and conditions for sharing the data; and assist in harmonizing definitions, standards and practices.
2. The role of the Chief Statistician
The Chief Statistician’s role in exercising the leadership and coordinating functions with regard to the national statistical system is just as important as the legal framework within which it operates. The Chief Statistician’s role and powers, his place in the hierarchy, his political independence, and his public image are key factors for the sound operation of the statistical system. 6
In Canada, the position of Chief Statistician corresponds to the highest echelon of the public service; it is equivalent to the office of Deputy Minister, in Canada, or Undersecretary, in the United States. By virtue of this seniority the Chief Statistician must attend all regular meetings of deputy ministersto be kept abreast of government priorities. This inclusion in the circle of senior public servants means that the Chief Statistician has not only a front-row seat in assessing the issues of the day, but also the opportunity to share knowledge and prove the relevance of statistical information to government decision makers.
In Canada, appointments to deputy-minister positions are non-partisan. In addition, deputy ministers can be transferred from one department or agency to another. However, this rule does not generally apply to the Chief Statistician, given the specific personal and professional skills required by the incumbent of this position.
In the current context, Statistics Canada falls under the authority of the Minister of Innovation, Science and Economic Development. However, the organization does not actually belong to that department; it simply reports to the same minister.
3. The protection of fundamental values
Three fundamental values characterize national statistical systems, regardless of type: credibility, legitimacy, and the protection of confidentiality.
Credibility is achieved through solid expertise and the resulting quality and relevance of the statistical data. Information deemed not credible is neither considered nor used. Legitimacy is tied to the importance that society ascribes to statistical activities, and to its understanding that such activities are in the public interest.
6. FELLEGI. 1996. p. 167–169.

Statistics Canada – Catalogue no. 11-634-X 15
Section 1 - Characteristics of an effective national statistical system Chapter 1.1 - Leadership and coordination of the national statistical system
As far as the protection of confidentiality is concerned, the Statistics Act defines the agency’s obligations and confers a personal responsibility on each employee. Even the courts cannot have access to identifiable statistical data without the interested person’s informed consent. The details of the various protective methods and measures used within the agency are provided in Chapter 4.6, “Respecting privacy and protecting confidentiality.”
Thus, leadership is the art of striking the right balance between maintaining and improving statistical data quality and relevance and protecting confidentiality.
4. Leadership and coordination – Four key functions
4.1 Positioning the national statistical system Positioning the statistical system means making the necessary choices to optimize the relevance of the statistical information produced. It also means giving an orientation to the statistical system by developing and communicating a vision, a mission, strategic orientations and clear values for the organization and for the system as a whole. This mandate can be carried out only if senior managers have a very good understanding of (1) the social, economic and environmental issues of concern; (2) the political environment in which they evolve; (3) emerging statistical needs and their solutions; (4) the constraints that senior managers face; and (5) the opportunities available to them. Lastly, it is crucial to protect the system’s integrity. This means protecting the system against political intervention, protecting the confidentiality of collected information, ensuring impartiality, respecting the public interest, and guaranteeing exemplary quality. To ensure that the statistical system is positioned effectively, statistical agencies can rely on the 10 Fundamental Principles of Official Statistics of the United Nations as guidance. These principles are stated and analyzed in detail in Chapter 1.2 - The United Nations fundamental principles of official statistics.
4.2 Holding consultations and maintaining key partnerships There are a variety of mechanisms and forms of consultation. The most important ones include deputy-minister level committees, the National Statistics Council, the Federal-Provincial-Territorial Consultative Council on Statistical Policy, and advisory committees.
The National Statistics Council is one of the pillars of the Canadian statistical system. The council is an additional ally against politicization. Its mandate is to advise the Chief Statistician about policies and priorities. The council is composed of eminent members from the business, university, research institute, provincial government, labour, as well as media communities—but not from the federal government.
In addition, as part of the Federal-Provincial-Territorial Consultative Council on Statistical Policy, the Chief Statistician meets with these provincial and territorial coordinators once a year to discuss priorities and concerns regarding statistical policies and programs.
The details concerning these councils and other mechanisms for consulting and partnering with the various levels of government, and with researchers, the private sector, and non-profit organizations, are discussed in Chapter 1.4 - Understanding users’ needs and maintaining relationships.
4.3 Influencing the national and international environments in which statistical information is used to better support research and decision makingFirst, this influence requires the ability to continually make the case that statistics are important to the advancement of societies, and should be used more extensively in decision making. It also requires the ability to rally all stakeholders around a shared vision of the orientation that the system should take. Lastly, it requires relationship building through networks, seminars, expert groups, and other formal and informal platforms at the national and international levels to ensure coherence, coordination and collaboration in statistical activities. This entails the ability to influence decision making at the national and international levels, and wherever such decisions have an impact on the direction of statistics-related practices. Avenues in this regard include the development of common standards, the adoption of new classification systems, and the promotion of internal practices to broader communities.

Statistics Canada – Catalogue no. 11-634-X16
Compendium of Management Practices for Statistical Organizations From Statistics Canada’s International Statistical Fellowship Program
For example, in the 2010s, as Chief Statistician of Canada, Wayne Smith helped influence the development of an international framework and international tools and partnerships for managing the data revolution, notably through his active participation in the Conference of European Statisticians, which he chairs, as well as the United Nations Secretary General’s Independent Expert Advisory Group on a Data Revolution for Sustainable Development (IEAG). Through his speeches, such as the one made in February 2014 to the United Nations Statistical Commission, or the one given in May 2015 at the third International Open Data Conference, he advocates for greater collaboration and coordination within the international community, and for the adoption of the common framework proposed by the IEAG, to better seize the opportunities afforded by the data revolution, and to better respond to the need for reliable data in support of decision making in democratic societies. This advocacy is backed by concrete action, such as Statistics Canada’s active involvement in the High Level Group for Modernization of Statistical Processes and its sharing of knowledge and tools within the statistical community. It is also worth noting that the International Statistical Fellowship Program was implemented under the Chief Statistician’s guidance. This program has enabled certain developing countries to integrate advancements and strategies aimed at improving the quality and efficiency of statistical production.
4.4 Ensure that the appropriate foundations (for planning, management and control) are in place to support the production, management, availability and use of high-quality statistical information To provide the appropriate foundations for a national statistical agency, planning, management and control mechanisms must be in place, along with the infrastructure needed to achieve the desired results:
• Sound human-resource management: Leadership does not mean running the system single handedly; rather, it means that the leader implements and builds an organization and a team that will mobilize to achieve the organization’s objectives. The details on this subject are available in Chapter 2.5 - Human-resource management.
• Effective communication networks within the organization: To promoting the leader’s vision, one must ensure that employees follow a shared vision and values, as well as keep information and communication channels open and transparent. Employees must be consulted and mobilized around the organization’s activities and priorities. To learn more about the internal mechanisms used to inform, consult with, and mobilize employees, see Chapter 2.6 - Internal communications, which is dedicated to the topic.
• Implementation and development of a transparent and effective planning process: This process should also be flexible enough to remain open to new initiatives and innovation. For more details, see Chapter 2.2 - Integrated strategic planning.
• Budget management: In general, the Chief Statistician has full authority to establish the agency’s priorities within an overall budgetary envelope. By implementing a control system with the appropriate checks and balances, the leader can delegate his or her powers, while ensuring that the system is managed appropriately. Chapter 2.3 - Financial management, provides the relevant details.
Key success factors In a centralized system like Statistics Canada, the benefit of having a single person at the helm of the statistical system is a key factor of vital significance. The Chief Statistician’s high level in the federal government hierarchy gives the incumbent access to political decision-making spheres. This also enables the Chief Statistician to promote the visibility and importance of high-quality official statistics to the authorities within the country, and to establish the contacts required to understand their needs well.
Opting for a centralized statistical system in Canada made it possible to create and develop numerous bilateral and multilateral, adapted and relevant coordination mechanisms, by subject. This allows for adjustments to policies, programs and services, and therefore, ensuring the relevance of disseminated statistical data.
In addition, the system grants some authority over the administration of Statistics Canada in terms of staffing, financial management, priority-setting, and implementing concepts and methodologies.

Statistics Canada – Catalogue no. 11-634-X 17
Section 1 - Characteristics of an effective national statistical system Chapter 1.1 - Leadership and coordination of the national statistical system
ChallengesThe challenges to be managed are generally associated with the disadvantages of a centralized statistical system. Statistics Canada continues to ascribe considerable importance to channels that allow information to be collected from users to compensate for the potential lack of proximity. The very fact that the organization is a national agency means it must ensure that the expectations and needs of its many audiences are met (see Chapter 1.4 - Understanding users’ needs and maintaining relationships).
To bridge the gaps in the system and avoid contributing to the development of statistics units within the various government departments and agencies, Statistics Canada must continue to develop its ability to carry out projects on a cost-recovery basis (see Chapter 1.6 - Partnerships on a cost-recovery basis).
Looking aheadStatistical systems are complex entities that must continually adapt to users’ needs and deliver indisputable quality to ensure the credibility and legitimacy of the statistical organization.
The key operational factors that ensure a statistical system has the capacity to regenerate and remain relevant are, and have always been, the following: consultations and interactions with a multitude of users, a strategic planning system that integrates priorities, and the mobilization of the resources suited to achieving the established objectives.
Box 1.1.1Governance and coordination mechanisms in the decentralized UK system for official statistics, by the UK Statistics Authority
1. UK devolutionThe United Kingdom of Great Britain and Northern Ireland is a unitary state, but, in practice, it has many of the features of a federal union between its four nations of England, Scotland, Wales and Northern Ireland.
Many policy areas fall under the purview of the UK Parliament:
• international relations, development and trade
• defence
• fiscal, economic and monetary policy
• immigration and nationality
• health and safety
• UK energy supply
• transport infrastructure
• employment and social security
The mechanisms and scope of devolution (dilution of powers) in the nations of Scotland, Wales and Northern Ireland are different in each case. However, each of these nations has a legislative assembly and a government with responsibility for policy decisions and delivery in the following broad areas:
• agriculture, forestry, fisheries and food
• education and training
• environment
• health
• housing
• local government
• policing and justice
• sport and recreation
• regional and local transport

Statistics Canada – Catalogue no. 11-634-X18
Compendium of Management Practices for Statistical Organizations From Statistics Canada’s International Statistical Fellowship Program
In accordance with the principle that each of these reserved and devolved policy areas needs a statistical evidence base, the UK statistical system mirrors this pattern of devolution. UK policy matters are underpinned by official statistics produced by the UK’s national statistics institute (Office for National Statistics), as well as official statistics produced by the government departments with a UK policy responsibility. For their part, the devolved governments for Scotland, Wales, and Northern Ireland support devolved policy matters with their own official statistics.
The principle of devolution in official statistics is found in the Statistics and Registration Service Act 2007. The act provides that the Office for National Statistics may not produce devolved statistics without the consent of the Ministers of Scotland, the Ministers of Wales, or the Department of Finance and Personnel for Northern Ireland.
2. UK decentralizationUnlike Scotland, Wales and Northern Ireland, England does not have its own legislative assembly or government. The Office for National Statistics and the government departments that have responsibility for policy matters for England (or England and Wales, or indeed the UK) are responsible for official statistics for both England and the UK Thus, for example, official statistics on personal and corporation tax, value-added tax, and fuel and alcohol duties are compiled by statisticians in the government department for Revenue and Customs.
3. Coherence through governance and coordinationIt can be seen that devolution and decentralization in the UK is complex, and the necessary devolution and decentralization of official statistics is also complex. Benefits arise from having both statisticians and statistics as close as possible to the key users of those statistics—public policy-makers. The risk is that this closeness may result in a loss of statistical independence, professionalism, coherence and harmonization. The Statistics and Registration Service Act 2007 was expressly designed to establish the governance and coordination mechanisms necessary to build U.K. public confidence in a devolved and decentralized statistical system.
The Statistics and Registration Service Act 2007 created a Statistics Board, known as the UK Statistics Authority. The UK Statistics Authority has a statutory duty to promote and safeguard the production of all official British statistics with a view to ensuring they serve the public good. The authority’s Board consists of a non-executive chair, non-executive directors, and executive members, including the Chief Executive, the National Statistician, and the Director General for Regulation. The authority governs its executive office, the Office for National Statistics. The authority monitors the work of the decentralized Government Statistical Service, including the work of the area chiefs and of the chief statisticians of the devolved administrations. The principles and practices required of all producers of official statistics for the United Kingdom are established in the authority’s Code of Practice for Official Statistics.
The National Statistician
The National Statistician is a statutory office, and a Crown appointment. The role is positioned at the most senior level of the public service, and appointments are, therefore, made through open competition and after scrutiny by the public appointments committee of the UK Parliament. The National Statistician is the Chief Executive of the UK Statistics Authority, the Head of the Office for National Statistics, the professional leader of the Government Statistical Service, and the UK’s representative in international statistical forums. As the head of the UK’s National Statistics Institution, the National Statistician is responsible for the coordination of the UK’s European Statistics and is the UK’s representative to the European Statistical System Committee. The National Statistician is the ultimate statistical authority under the Code of Practice for Official Statistics.
Director General for Regulation
The Director General for Regulation is a statutory office, and is appointed by the non-executive members of the authority. The Director General for Regulation is responsible for monitoring compliance with the Code of Practice. An official statistic can be called a national statistic only when the authority, as advised by the Director General for Regulation, concludes that it complies with the high standards demanded by the Code. This feature of the UK statistical system (positive accreditation of National Statistics) is an essential feature of ensuring coherence and quality in our devolved and decentralized system. Any National Statistic that is found to be not compliant with the Code is de-classified, and improvement measures are delegated to the responsible statistician. The Director General for Regulation has approximately 20 staff who work on the assessment and accreditation of National Statistics.
The Office for National Statistics
The Office for National Statistics (ONS) is the executive office of the UK Statistics Authority, responsible for producing key social, economic and demographic statistics that are essential to the matters reserved to British government and

Statistics Canada – Catalogue no. 11-634-X 19
Section 1 - Characteristics of an effective national statistical system Chapter 1.1 - Leadership and coordination of the national statistical system
Parliament. It is the National Statistics Institution for the purposes of European Statistics, and therefore has a coordinating role for ensuring the coherence of the United Kingdom’s European Statistics.
The Government Statistical Service
The Government Statistical Service (GSS) is the cross-government association of members of the statistics profession. It delivers the professional training and development of government statisticians and is essential to ensuring the adoption of a culture of quality in official statistics and of harmonized standards and practices. Its members contribute to committees responsible for Statistical Policy and Standards, for Professional Development, and for Theme Leadership. Sub-groups focus on the statistics themes, the data strategies, and the international strategy.
The GSS Competency Framework sets out the professional standards that are expected of professional statisticians. The standards are differentiated by levels of experience, ranging from new entrants to experienced, senior statisticians. The Framework ensures common standards, and guides recruitment and promotions. It enhances professional development plans to maintain and build the professional capability of the GSS.
The GSS has a Good Practice Team (GPT), which was created to help enable the GSS to be the best that it can be. The role of the GPT is to promote and share good statistical practices across the GSS, and to create opportunities for collaboration within and between departments. This is achieved, in part, through providing guidance and producing standards. Often, the best innovation comes from giving statisticians the ability to innovate in their own areas, and then to share those innovations within departments and across departments. This is supported by conducting peer reviews to identify and share good practices, and by appointing champions in each government department. For example, there is a GSS network of presentation champions.
Area chiefs and the chief statisticians of the devolved administrations
The professional leadership of the GSS consists of the area chiefs for statistics in each government department and the chief statisticians of the devolved administrations. The Head of Profession is appointed jointly by the National Statistician and the permanent secretary of the relevant department. They are the champions for statistics in their respective government administrations, in particular, with respect to ensuring compliance with the Code of Practice as well as the harmonization of the GSS’s quality policies.
The Code of Practice for Official Statistics
The Code of Practice is perhaps the single most important mechanism for ensuring coherence, professional independence, and quality in the decentralized and devolved UK official statistics system. The Code is consistent with the United Nations’ Fundamental Principles of Official Statistics and the European Statistics Code of Practice. All official statistics should be produced according to the Code, as a matter of good practice. Most importantly, official statistics that are to be designated as national statistics must be assessed as compliant with all 74 practice statements of the Code of Practice for Official Statistics by the Director General for Regulation. Once statistics have been designated, it is a statutory obligation on the producer to ensure continued compliance with the Code. This provides the UK Statistics Authority with leverage for deploying all the component mechanisms for professional independence, coherence and quality in the UK statistical system.
The question is whether these mechanisms address the inherent risks to professional independence, coherence and quality in a devolved and decentralized statistical system, to the extent that the benefits of policy relevance are realized. The UK carries out surveys of public confidence in official statistics. The negative results of one of these surveys in 2005 was one of the stimuli for the Statistics and Registration Service Act 2007 and the statutory establishment of the mechanisms described in this article. Subsequent surveys7 have found a steady improvement in public confidence in UK official statistics. The remaining issues of confidence are about the way politicians are perceived by the public to use the UK’s professionally independent, coherent and high-quality statistics.
In conclusion, the UK decided, in 2007, to maintain a highly devolved and highly decentralized statistical system as the model best able to deliver high-quality statistics where they are most needed. It simultaneously decided to modify existing mechanisms and to introduce new statutory mechanisms to build public trust in the professional independence, coherence, and quality of those statistics.
7footnote for box note #7
7. NATCEN. 2015.
Statistics Canada – Catalogue no. 11-634-X20
Compendium of Management Practices for Statistical Organizations From Statistics Canada’s International Statistical Fellowship Program
Bibliography EUROSTAT. 2011. European Statistics Code of Practice for the National and Community Statistical Authorities. Catalogue no. KS-32-11-955-EN-C. Retrieved from http://ec.europa.eu/eurostat/documents/3859598/5921861/KS-32-11-955-EN.PDF/5fa1ebc6-90bb-43fa-888f-dde032471e15 (accessed January 11, 2016).
Fellegi, Ivan P. 1996. Characteristics of an Effective Statistical System. International Statistical Review. Vol. 64, No 2. August. p. 165–187.
GOVERNMENT OF CANADA. 2005. Statistics Act. L.R.C 1985, c. S-19. Amended by 1988, c. 65, s. 146; 1990, c. 45, s. 54; 1992, c. 1, ss. 130, 131; 2005, c. 31; 2005, c. 38. Retrieved from http://laws-lois.justice.gc.ca/eng/acts/S-19/FullText.html (accessed January 11, 2016).
KIREGYERA, Ben. 2015. The Emerging Data Revolution in Africa: Strengthening the Statistics, Policy and Decision-making Chain. Stellenbosch, South Africa: African Sun Media.
MCLENNAN, Bill. 2002. The role and position of the national statistical office in the overall government structure: Differences between centralised and decentralised systems. Presentation at UNSD workshop on “Selected good practices in the organization and management of statistical systems.” December. Yangon, Myanmar. Retrieved from http://unstats.un.org/unsd/methods/statorg/Workshops/Yangon/Session3_StatisticalSystems_McLennan.pdf (accessed January 11, 2016).
NATCEN. 2015. Public Confidence in Official Statistics. London, UK. Retrieved from http://www.natcen.ac.uk/media/833802/public-confidence-in-official-statistics_final.pdf.(accessed January 11, 2016).
PARIS21. 2005. Models of Statistical Systems. PARIS21 Document Series, no. 6 (October). Retrieved from
http://www.paris21.org/sites/default/files_2101.pdf.(accessed January 11, 2016).
UK STATISTICS AUTHORITY. 2009. Code of Practice for Official Statistics, Edition 1.0. London, UK. Retrieved from http://www.statisticsauthority.gov.uk/assessment/code-of-practice/.(accessed January 11, 2016).
UNITED KINGDOM GOVERNMENT. 2007. Statistics and Registration Service Act 2007, c. 18. Retrieved from http://www.legislation.gov.uk/ukpga/2007/18/contents.(accessed January 11, 2016).
UNITED NATIONS. 2005. Handbook of Statistical Organization, Third Edition. The Operation and Organization of a Statistical Agency. Studies in Methods, Series F, no. 88. New York. Retrieved from http://unstats.un.org/unsd/publication/SeriesF/SeriesF_88E.pdf. (accessed January 11, 2016).
UNITED NATIONS. 2014. Fundamental Principles of Official Statistics. Resolution A/68/L.36. March 3. General Assembly. New York. Retrieved from http://unstats.un.org/unsd/dnss/gp/FP-New-E.pdf (accessed January 11, 2016).
UNITED NATIONS STATISTICS DIVISION. 2012. Template for a Generic National Quality Assurance Framework – Glossary. United Nations Expert Group on National Quality Assurance Frameworks. New York. Retrieved from http://unstats.un.org/unsd/dnss/docs_nqaf/NQAF%20GLOSSARY.pdf (accessed January 11, 2016).

Statistics Canada – Catalogue no. 11-634-X 21
Section 1 - Characteristics of an effective national statistical system Chapter 1.2 - The United Nations Fundamental Principles of Official Statistics
Chapter 1.2 – The United Nations Fundamental Principles of Official Statistics
ContextNational statistical offices (NSOs) are looking into specific legal, institutional and international frameworks and instruments, driven by policy demand and social development, to help them benchmark their statistical systems against international good practices.
Good practices relate to, for instance, legal provisions to guarantee the professional independence of statistics producers while ensuring that scientific standards, statistical quality, and stringent and explicit confidentiality measures are in place.
Existing codes of practices could be adopted directly or serve as references for statistical agencies:
• The United Nations Fundamental Principles of Official Statistics
• The 2011 European Statistics Code of Practice8
• Code of Good Practice in Statistics for Latin America and the Caribbean9
• African Charter on Statistics.10
The United Nations Fundamental Principles of Official Statistics were first adopted in 1994 at a special session of the United Nations Statistical Commission.11 The principles, developed originally by the Conference of European Statisticians, help define, at an international level, what constitutes a good system of official statistics and what role that system should play in national governments. Ten years later, in January 2014, the principles were endorsed by the United Nations General Assembly,12 which stated that, “in order to be effective, these fundamental values and principles should be guaranteed by legal and institutional frameworks and be respected at all political levels and by all stakeholders in national statistical systems.”
As a member of the United Nations statistical community and as an active participant in the activities of the United Nations Statistical Commission, Statistics Canada fully supports the United Nations Fundamental Principles of Official Statistics (http://www.statcan.gc.ca/about-apercu/fpos-pfso-eng.htm).
As part of the celebration of the 2013 International Year of Statistics, Statistics Canada developed and promoted a video summarizing and highlighting the importance of these ten fundamental principles of official statistics and showing how they are entrenched in the organization’s values.
This chapter outlines
• importance of each principle and why it is crucial for statistical agencies to consider each principle
• how Statistics Canada implements each of these principles
• the reference between each principle and the chapter providing details about that matter in this compendium
For a more complete overview of how these principles can be implemented, statistical organizations are invited to consult the implementation guidelines prepared by the Friends of the Chair group established by the United Nations Statistical Commission at its forty-second session, in 2011.13
8. EUROSTAT. 2011.9. UNITED NATIONS ECONOMIC COMMISSION FOR LATIN AMERICA AND THE CARIBBEAN. 2011.10. AFRICAN UNION COMMISSION. 2009.11. UNITED NATIONS STATISTICS DIVISION. 1994.12. UNITED NATIONS. 2014.13. UNITED NATIONS STATISTICS DIVISION. 2015.

Statistics Canada – Catalogue no. 11-634-X22
Compendium of Management Practices for Statistical Organizations From Statistics Canada’s International Statistical Fellowship Program
Principle 1: Official statistics provide an indispensable element in the information system of a democratic society, serving the government, the economy and the public with data about the economic, demographic, social and environmental situation. To this end, official statistics that meet the test of practical utility are to be compiled and made available on an impartial basis by official statistical agencies to honor citizens’ entitlement to public information.
Countries require vast amounts of information to function effectively and to support their decision-making.
Like other national statistical organizations, Statistics Canada works collaboratively with partners and stakeholders to develop a national statistical system that meets the needs of Canadians.
RelevanceAs set out in Canada’s Statistics Act, the scope of subjects to be covered by the agency is broad and encompassing. According to the act, Statistics Canada has a mandate to “report on the commercial, industrial, financial, social, economic, and general activities and condition of the people of Canada.”
For example, Canada’s economic accounts (gross domestic product, gross national income, etc.) provide up-to-date portraits of national, provincial, and territorial economies and their structures, based on an internationally recognized set of concepts. Labour market indicators provide key indicators, including how many people are employed and how many are unemployed; the unemployment rate; the industries and occupations in which people work; the hours they work; the wage and non-wage benefits they receive; labour mobility; and unionization.
In addition to providing information about the state of the economy and society, Statistics Canada keeps abreast of the evolving data needs of Canadians and ensures that its products and services meet these needs. Statistics Canada relies on a well-established set of advisory committees to provide input on current and future programs. At the strategic level, the National Statistics Council (NSC) advises the Chief Statistician on program priorities. Members of the NSC include leaders from business, universities, research institutions, and the media.
In addition to the NSC, there is a wide range of professional advisory committees, including subject-matter experts in the following areas: agricultural statistics, price measurement, and labour and income statistics. The agency also receives direct feedback from subject-matter experts, stakeholders, clients, and the Canadian general public through a number of channels, including the agency’s website. All this input ensures that Statistics Canada receives the necessary information to keep its programs relevant.
Other examples include formal multilateral and bilateral mechanisms for communications with federal departments and a comprehensive set of federal-provincial-territorial committees, such as the overarching Federal-Provincial-Territorial Consultative Council on Statistical Policy, which provide advice to Statistics Canada on a variety of topics.
[Reference: Chapter 1.4 – Understanding users’ needs and maintaining relationships].
Objective and neutral data source To be credible, NSOs must be—and be seen to be—strictly neutral with regard to political matters. Successive Canadian governments, without exception, have ensured this credibility by maintaining an arm’s-length relationship between the Chief Statistician and the minister responsible for Statistics Canada. While governments have established the general budgetary parameters, and have occasionally provided targeted funding for new initiatives and guidance on program priorities, Statistics Canada’s day-to-day operations have been kept free of intervention from the political side of government. The agency is expected to compile and publish its findings “without fear or favour,” and has done so consistently since its inception.
[Reference: Chapter 1.1 – Leadership and coordination of the National Statistical System].

Statistics Canada – Catalogue no. 11-634-X 23
Section 1 - Characteristics of an effective national statistical system Chapter 1.2 - The United Nations Fundamental Principles of Official Statistics
Impartiality and public accessibility to Statistics Canada’s dataStatistics Canada makes its information holdings widely and publicly accessible to Canadians on its website. Statistics Canada’s website is the agency’s main method of communicating with Canadians: it records millions of visits per year. Data, products and publications are released each business day at 8:30 a.m., Eastern time, through The Daily, the agency’s official release bulletin. The Daily is prominently featured on the website’s home page, making the information released online easy to find.
[Reference: Chapter 4.1 – Disseminating data through the website].
The Daily supports the agency’s mandate to publish statistical information on Canada’s economy and society. New datasets and information products are released through an announcement in The Daily. This practice ensures that all Canadians have equal access to Statistics Canada’s information.
For major economic indicators and census releases, accredited media can have advance access to the information by attending lockups. Stringent security measures are applied to prevent any public release prior to 8:30 a.m. The release dates for these programs are posted on the agency’s website one year in advance.
Impartiality and equal access to official releases is ensured by having fixed dissemination schedules, by being compliant with legal requirements for publishing the data, and by maintaining strict safeguards against access to pre-release material.
[Reference: Chapter 4.2 – External communications and outreach].
Research data centres are the results of a collaborative partnership between Statistics Canada and Canadian universities at campuses across Canada. By providing access to over 350 confidential microdata files in secure academic research facilities, on 26 Canadian university campuses and in a research institute, Statistics Canada enhances the relevance of its data by better meeting the varying needs of researchers—by supporting research data centres and providing a platform for training quantitative researchers.
Similarly, through the development of the Canadian Centre for Data Development and Economic Research (CDER), Statistics Canada provides researchers with secure access to business and economic microdata for analytical research. CDER has served to strengthen Statistics Canada’s organization of its business micro-economic data resources for the purpose of supporting information needs.
In February 2012, Statistics Canada eliminated all fees for its standard data products, which are now available for free through its website. As well, the agency removed all restrictions regarding, and all fees for, re-disseminating its data, moving from a policy of re-dissemination restriction to one of encouragement.
[Reference: Chapter 4.4 – Access to microdata].
Principle 2: To retain trust in official statistics, the statistical agencies need to decide according to strictly professional considerations, including scientific principles and pro-fessional ethics, on the methods and procedures for the collection, processing, storage and presentation of statistical data.
Statistics Canada recognizes that trust in the accuracy and quality of its data is inherent to the agency’s credibility and its role as Canada’s national statistical agency. The agency systematically builds quality into all its programs and products. The quality of its official statistics is founded on the use of sound scientific methods, which are adjusted over time to reflect changing client needs, budgetary circumstances, the changing reality that the agency aims to measure, and the capacity of respondents to supply source data.
Building and maintaining public trust requires not only transparency of methodology, the application of professional and ethical guidelines, and objectivity in reporting, but also the assurance that all statistical decisions are based on scientific criteria. The main strategies used are strong recruitment; professional and career development programs in all core professional groups; maintaining programs that build a positive, exciting and healthy workplace; introducing programs to stimulate creativity and innovation, particularly at the “grass roots” level; and participating actively, nationally and internationally, in professional communities engaged in official statistics.
Statistics Canada continues to ensure that the workforce is professional, motivated and innovative; a strong focus on its workforce is a recognized hallmark of the agency.

Statistics Canada – Catalogue no. 11-634-X24
Compendium of Management Practices for Statistical Organizations From Statistics Canada’s International Statistical Fellowship Program
Data qualityTo ensure that the most appropriate methods and procedures are being used, the agency has developed and implemented a series of governing instruments to guide the many statistical processes within the organization. At the highest level, the agency has developed a Quality Assurance Framework, which provides analysts with the definition of data quality and with standards by which to measure it.
Within this framework, the quality of information is defined in terms of a multi-dimensional concept that embraces both the relevance of information to users’ needs and the characteristics of this information, such as accuracy, timeliness, accessibility, interpretability and coherence. Transparency about these various dimensions helps users judge the extent to which a statistical product is fit for a specific purpose. A significant feature of quality management, which is highlighted in the framework, is balancing quality objectives against the constraints of financial and human resources, the goodwill of respondents in providing source data, and the competing demands for greater quantities of information.
Another way in which quality considerations are embedded into the practices of the organization is through the agency’s Management Committee on Methods and Standards. This committee provides advice and guidance on developing and applying statistical standards, approving and adopting statistical concepts, developing and using sound statistical methods, and setting priorities for statistical research and innovation.
In addition, Statistics Canada has an external Advisory Committee on Statistical Methods, which advises the Chief Statistician on the use of efficient statistical methods in the agency’s programs, and on the agency’s program of research and development in statistical methods. The committee’s members are experts from private industry and academia.
Internally, Statistics Canada has a Quality Secretariat dedicated to supporting the development and implementation of policies and procedures that promote sound quality management practices; to designing and managing studies related to quality management; and to providing advice and assistance to program areas on quality management.
[Reference: Chapter 1.5 – Quality management].
Communicating about data qualityIn addition to applying rigorous quality-assurance mechanisms in order to provide data users with reliable statistical information, the agency is also responsible for informing users about data quality. The Policy on Informing Users of Data Quality and Methodology requires that all statistical products include or refer to documentation on data quality and methodology. These standards and guidelines describe the kind of documentation that is expected for each data release.
This policy also requires that, for each statistical program, users be provided with the information necessary to understand both the strengths and limitations of the data being disseminated. Documentation on methodology must permit users to assess whether the data adequately approximate what they wish to measure, and whether the data were produced within the tolerances accepted for their intended purpose. Extensive documentation on quality, concepts and methodology, and other explanatory information, are also made available via Statistics Canada’s Integrated Metadatabase on its website.
[Reference: Chapter 4.3 – Management and access to metadata].
Principle 3: To facilitate a correct interpretation of the data, the statistical agencies are to present information according to scientific standards on the sources, methods and procedures of the statistics.
NSOs continuously aim to introduce and maintain methodological improvements into concepts, methods and procedures to improve official statistics.
Statistics Canada is responsible for informing users of the concepts and methodology used in collecting, processing and analyzing its data; of the accuracy of these data; and of any other features that affect their quality, or “fitness for use.”

Statistics Canada – Catalogue no. 11-634-X 25
Section 1 - Characteristics of an effective national statistical system Chapter 1.2 - The United Nations Fundamental Principles of Official Statistics
A key aid to Statistics Canada’s clients is interpretation of data as they are released. Commentary in The Daily, and in associated materials, focuses on the primary messages that the new information contains. Directed particularly at the media, such commentary increases the likelihood that the first level of interpretation to the public will be clear and correct and increases the likelihood that mass media will integrate the material in its output, thus making it visible to vast audiences. Such mass dissemination is a key ingredient in ensuring the visibility and credibility of an official statistics agency. The Policy on Highlights of Publications requires that all statistical publications contain a section that highlights the principal findings in the publication.
Statistics Canada’s standards and guidelines for the provision of metadata derive from the Policy on Informing Users of Data Quality and Methodology. The policy lays out requirements and guidelines on how to provide information on data quality and methodology with every statistical product. The Integrated Metadatabase is the repository used to store this information for each survey, in addition to other related metadata.
Statistics Canada participates in international committees to be fully aware of the current standards in the dissemination of metadata. The agency’s experts also write scientific papers on methods, present them to the public, and make them available for use by the public.
[Reference: Chapter 1.3 – Using international standards].
Principle 4: The statistical agencies are entitled to comment on erroneous interpretation and misuse of statistics.
Statistics can be used and interpreted in many different ways, and they may also be used for advertising and political purposes. It is then important for NSOs to maintain trust and credibility by drawing attention to obvious public incorrect use or interpretation.
Statistics Canada’s Directive on Media Relations sets forth the guidelines for responding to erroneous statements in news reports. When news coverage (in print or online) contains erroneous statements about Statistics Canada and its programs or policies, or misinterpretations of data, communications staff send a formal response to the media to request that the information be updated online, or that a correction be issued in the newspaper.
Statistics Canada carries out activities to educate users, including the media, on how to use data. One example is “concept brief” presentations for the Census of Population and the Census of Agriculture, which are posted on the website in advance of the data being released. While data or findings are not discussed, members of the media receive a briefing on census concepts prior to release day so that they can readily understand the data being released.
A second example is that media are briefed about important changes or revisions to data prior to their release. For example, when Statistics Canada revised data from the System of National Accounts, members of the media who attended lockups for economic data received a briefing. Media outlets were also informed of the changes through a statistical announcement posted on the agency’s website. The Media Relations service of Statistics Canada holds lockups for major economic indicators and census releases, during which subject-matter experts are present to answer questions related to the data released.
[Reference: Chapter 4.2 – External communications and outreach].
Principle 5: Data for statistical purposes may be drawn from all types of sources, be they statistical surveys or administrative records. When choosing the source, statistical agencies must consider quality, timeliness, costs and the burden on respondents.
Producing official statistics is a costly and labour-intensive task for statistical agencies, and is demanding from a respondent perspective. Therefore, statisticians have to apply methods in the least intrusive way and choose the most cost-efficient data sources, without compromising data quality.
The Statistics Act confers substantial powers on Statistics Canada to obtain information for statistical purposes through surveys of Canadian businesses and households. By default, response to Statistics Canada’s surveys is mandatory under the act; refusal to participate could be subject to legal penalty. The act includes provisions to

Statistics Canada – Catalogue no. 11-634-X26
Compendium of Management Practices for Statistical Organizations From Statistics Canada’s International Statistical Fellowship Program
make participation in some surveys voluntary, and Statistics Canada has generally done so for household surveys other than the Census of Population, and for the Labour Force Survey, which produces critical economic data. Surveys of businesses, including agricultural businesses, are conducted on a mandatory basis.
Statistics Canada can also, by law, access all administrative records, including tax data, customs declarations, and birth and death records. Such records are very important sources of statistical information, because they reduce response burden on business and individual respondents. When feasible, Statistics Canada uses administrative data, to reduce the burden on businesses and households. Additional efforts in using administrative data to reduce the burden on Canadians and businesses will continue to be a focus of the agency for years to come. While legal authority is a most useful tool, the agency favours relying on collaborative partnerships to secure access to administrative data.
Partnerships with other federal departments, other jurisdictions, and external organizations play a large role in reducing response burden. Statistics Canada continues to foster these arrangements as they serve the needs of stakeholders, the national statistical system and the Canadian research community. In tandem with these powers, the agency is charged with ensuring the confidentiality of the information in its hands, and with limiting the use of this information to statistical purposes.
[Reference: Chapter 4.5–Relations with survey respondents].
Principle 6: Individual data collected by statistical agencies for statistical compilation, whether they refer to natural or legal persons, are to be strictly confidential and used exclusively for statistical purposes.
A fundamental requirement for official statistics is protecting confidentiality. This requirement is expected to be strictly implemented in each and every aspect of the statistical process—from survey planning to dissemination of statistical products.
Confidentiality protectionThe strong power given to Statistics Canada to collect and access information is counterbalanced by a guarantee of confidentiality: all agency employees are personally liable for ensuring statistical confidentiality, and even courts cannot have access to individually identifiable statistical information without the informed consent of respondents.
The most important specific tool to deal with this matter is the Statistics Act, which spells out the agency’s obligations and the personal liability of all employees. This message is reinforced through
• training, starting with an introductory course;
• physical perimeter security, which serves as a daily reminder;
• an especially secure computing environment that makes it physically impossible to penetratethe network, thus preventing access by potential hackers;
• an extremely strong cultural tradition that is passed on from generation to generation.
In addition, various corporate committees have been put in place to ensure proper access and protection of individual data: the Microdata Access Management Committee, the Information Management Committee, the Communications and Dissemination Committee, and the Security Coordination Committee. In addition, the following policies are in place to provide the necessary framework for protecting individual data: Policy on Privacy and Confidentiality, Policy on Microdata Release, Policy on Microdata Access, Policy on Privacy Protection and Policy on Network Use. Finally, a Disclosure Control Resource Centre conducts and coordinates research for the protection of respondent confidentiality in data disseminated by Statistics Canada.
Privacy protectionAll statistical surveys represent a degree of privacy invasion, which is justified by the need for an alternative public good, namely information. The relevant issues are the methods used to ensure that questionnaire content is minimally intrusive, that respondents are informed of the purposes to be served by the data collection, and that the total reporting burden imposed on the population is regularly measured, controlled, and equitably distributed.

Statistics Canada – Catalogue no. 11-634-X 27
Section 1 - Characteristics of an effective national statistical system Chapter 1.2 - The United Nations Fundamental Principles of Official Statistics
A special issue relates to the very sensitive topic of record linkage. Given the wide scope for record linkage within a centralized statistical system, particularly that of Statistics Canada, which has broad access to the data holdings of other departments, the agency developed a multi-level review procedure, as well as extensive ongoing consultation mechanisms with stakeholder groups and the Office of the Privacy Commissioner of Canada. These mechanisms aim to ensure that all record linkage activities serve a clear public-interest purpose and that linked data will be retained only as long as operationally required.
[Reference: Chapter 4.6 – Respecting privacy and protecting confidentiality].
Principle 7: The laws, regulations and measures under which the statistical systems operate are to be made public.
High-quality legislation is critical to the effective performance of a national statistical system. Statistics Canada is governed primarily by the Statistics Act, which sets out the agency’s mandate, defines its powers, and establishes the regulations under which it operates. In addition, under the Corporations Returns Act, Statistics Canada collects financial and ownership information on corporations conducting business in Canada.
One of the Chief Statistician’s key responsibilities is to ensure that Statistics Canada’s operations are transparent and independent of government influenceThe agency is proactive and fully transparent in disclosing its methods and standards. It is also subject to legislation concerning access to Iinformation that is used by various third parties, among other things, to investigate the rationale behind the decisions that are taken.
[Reference: Chapter 1.1 – Leadership and coordination of the National Statistical System].
Under the guidelines of the Policy on Informing Users of Data Quality and Methodology, Statistics Canada applies rigorous quality-assurance mechanisms to provide data users with reliable statistical information. The agency is also responsible for informing users about data quality, which involves applying consistent measures to identify, record, approve, and correct post-release errors and unplanned revisions, and to report thereon.
Statistics Canada keeps Canadians informed of the agency’s various priorities and activities through regular reports, such as the Report on Plans and Priorities, the Departmental Performance Report, and the Corporate Business Plan. In addition, the agency regularly communicates with the public using communication vehicles such as blogs, other social media, videos, and statistical announcements.
Principle 8: Coordination among statistical agencies within countries is essential to achievinge consistency and efficiency in the statistical system.
According to the United Nations Statistics Division, General Review 2013, “No matter what the organizational arrangements are for producing official statistics, coordination of NSO should be undertaken to avoid duplication of work, and to facilitate the integration of data from different sources through the use of statistical standards.”
The Statistics Act authorizes Statistics Canada to, and requires that the agency, coordinate and lead the national statistical system. As part of this effort, it permits the agency to enter into two kinds of joint collection and data-sharing agreements: 1) with any government department, provided that respondents are notified and that they register no objection; and 2) with a provincial statistical agency that has legislative confidentiality protection comparable with that of Statistics Canada.
Furthermore, the Statistics Act requires that Statistics Canada coordinate the national statistical system, specifically to avoid duplication in the information collected by government. To this end, the Chief Statistician may enter into joint collection or data-sharing agreements with provincial and territorial statistical agencies, as well as with federal, provincial and territorial government departments. These agreements are subject to confidentiality guarantees for identifiable statistical information.
In each of the areas of major provincial jurisdiction, the Chief Statistician has a forum for discussing statistical priorities with the appropriate provincial deputy ministers. These fora, however, are also used for another purpose. Large portions of the statistical system depend on provincial administrative records from the of health, education and justice sectors.. Therefore, to compile consistent national statistics in these areas, the provincial administrative systems need to be harmonized. Meetings of the responsible provincial deputy ministers provide occasions to

Statistics Canada – Catalogue no. 11-634-X28
Compendium of Management Practices for Statistical Organizations From Statistics Canada’s International Statistical Fellowship Program
discuss and resolve any challenges and issues that may exist. In each of these domains, an elaborate working-level mechanism exists to develop practical program options and to put the decisions reached by deputy ministers into effect.
Understanding provincial priorities in all other areas takes a different form. Every provincial government appoints a senior official to interact with Statistics Canada on its behalf. This official, the provincial liaison provides an integrated picture of provincial priorities. The Chief Statistician and the focal points constitute a Federal-Provincial-Territorial Consultative Council on Statistical Policy, which oversees about a dozen federal-provincial committees dealing with particular subject-matter areas or cross-cutting issues.
Thus, Statistics Canada endeavours to work in very close concert with other official data producers, providing them with statistical services (e.g., frames and data; methodology services) and receiving data from them, as well as working together to support Canada’s involvement in various international organizations. The agency works carefully with other data producers to avoid overlapping programs, and, often, this coordination happens at a program level rather than at the agency level.
[Reference: Chapter 1.4 – Understanding users’ needs and maintaining relationships].
Principle 9: The use by statistical agencies in each country, of international concepts, classifications and methods promotes the consistency and efficiency of statistical systems at all official levels.
Comparability is an important dimension of quality. Without common standards, frameworks, classifications and metadata, comparability between countries would not be possible.
International standards are applied by Statistics Canada as much as possible, and are adapted to national circumstances in fields such as national accounting, census and demographic statistics, social statistics, and environment statistics. In providing technical assistance to other countries, the agency always promotes the use of internationally recognized standards of classification and methods.
In addition, Statistics Canada actively participates in international discussions, deliberations and elaboration of standards and guidelines. In fact, Statistics Canada is recognized as an active participant internationally, and provides a great deal of technical leadership in developing international classifications and concepts.
[Reference: Chapter 1.3 – Using international standards].
Principle 10: Bilateral and multilateral co-operation in statistics contributes to the improvement of systems of official statistics in all countries.
NSOs should actively participate in developing bilateral and multilateral co-operation to improve data quality by sharing lessons learned and best practices.
Statistics Canada has played an active role with other national statistical agencies and international statistical organizations. The agency shares statistical technical expertise and best practices, and works co-operatively to develop international standards and statistical classifications, as well as frameworks for the international and national development of official statistics. Statistics Canada plays a key role in providing technical support internationally. Moreover, the agency is actively involved with international organizations, including the Organisation for Economic Co-operation and Development, the United Nations Economic Commission for Europe, the United Nations Statistical Commission, and the Economic Commission for Latin America and the Caribbean. Finally, Statistics Canada is a member of several international working groups responsible for developing international standards. Canada’s Chief Statistician is also actively involved in the United Nations Statistical Commission.
In 2011, with the support of the Department of Foreign Affairs, Trade and Development (DFATD), Statistics Canada launched the International Statistical Fellowship Program. The program provides leaders of statistical agencies in developing countries with an executive training session that addresses leadership and management issues. The session is followed by a two-year development and implementation of a governance project under Statistics

Statistics Canada – Catalogue no. 11-634-X 29
Section 1 - Characteristics of an effective national statistical system Chapter 1.2 - The United Nations Fundamental Principles of Official Statistics
Canada’s monitoring. The goal of the program is to share knowledge and best practices in order to help these countries manage their operations and, more importantly, to help them provide their countries with reliable, relevant and timely data.
In 2015, Statistics Canada renewed its partnership with DFATD for a seven-year initiative called the Project for the Regional Advancement of Statistics in the Caribbean (PRASC). The intent of the PRASC is to enhance statistical capabilities in the fourteen (14) eligible countries of the Caribbean in four major components: national accounts, infrastructure for economic surveys, infrastructure for social surveys, and information-sharing.
In addition, from the bilateral perspective, Statistics Canada is working with a number of NSOs to support them in developing modern and efficient statistical systems.
Statistics Canada also actively participates in several multilateral co-operation projects. For example, since 2010, a number of countries, including Canada, have been exploring cost efficiencies through the joint development of key tools, as part of the high-level Group for the Modernisation of Official Statistics. The objective is to develop a common framework for metadata, including for the dissemination of metadata. Statistics Canada is involved mainly in developing a generic information management system and in using and developing innovative dissemination approaches.
[Reference: Chapter 3.1 – Corporate Business Architecture].
Challenges and looking aheadWhile the United Nations Fundamental Principles of Official Statistics provide a useful reference point, they are general in nature and, until recently, have not been accompanied by more specific guidance.
In addition to the UN principles, NSOs will be able to also refer to the new Good Statistical Practices of the Organisation for Economic Cooperation and Development, which were endorsed in 2015 (these practices will be published later in 2016). However, each NSO evolves in a specific national context where these guiding principles and practies need to be adapted and tailored to national specifications.

Statistics Canada – Catalogue no. 11-634-X30
Compendium of Management Practices for Statistical Organizations From Statistics Canada’s International Statistical Fellowship Program
BibliographyAFRICAN UNION. 2009. African Charter on Statistics, Addis Ababa. Consulted on the 11th of March 2016, and retrieved from http:/www.au.int/en/sites/default/files/AFRICAN_CHARTER_ON_STATISTICS.pdf
EUROSTAT. 2011. European Statistics Code of practice for the National and Community Statistical Authorities. Catalogue no. KS-3211-955-EN-C. Consulted on the 11th of March 2016, and retrieved from http://ec.europa.eu/eurostat/documents/3859498/5921861/KS-32-11-955-EN.pdf/5fa_l_ebc6-90bb-43fa-888fdde03247_l_e15
GOUVERNMENT OF CANADA. 2005. Statistics Act, L.R.C 1985, c. S-19 amended by 1988, c. 65, s. 146 1990, c. 45, s. 54 1992, c. 1, ss. 130, 131. 2005, c. 31, 2005, c. 38. Consulted on the 11th of March 2016, and retrieved from http://laws-lois.justice.gc.ca/eng/acts/S-19/FullText.html
STATISTICS CANADA. 2000. Policy on Informing Users of Data Quality and Methodology, Ottawa. Consulted on the 11th of March 2016 and retrieved from http://www.statcan.gc.ca/eng/about/policy/info-user
STATISTICS CANADA. 1987. Policy on Microdata Release, Ottawa. Internal document. Accessible on demand.
STATISTICS CANADA. 2012. Policy on Microdata Access, Ottawa. Internal document. Accessible on demand.
STATISTICS CANADA. 1998. Policy on Network Use, Ottawa. Internal document. Accessible on demand.
STATISTICS CANADA. 2012. Policy on Privacy and Confidentiality, Ottawa. Internal document. Accessible on demand.
STATISTICS CANADA. 2014. Video on the principles of official statistics, Statistics Canada. Consulted on the 11th of March 2016, and retrieved from http://www.statcan.gc.ca/eng/sc/video/index#a1.
UNITED NATIONS STATISTICS DIVISION (UNSD). 2014. Fundamental Principles of Official Statistics. Resolution A/68/L.36. March 3. General Assembly. New York. Consulted on the 11th of March 2016 and retrieved from http://unstats.un.org/unsd/dnss/gp/FP-New-E.pdf
UNITED NATIONS ECONOMIC COMMISSION FOR EUROPE, High-Level Group for the Modernization of official statistics – website. Consulted on the 11th of March 2016, and retrieved from http://www1.unece.org/stat/platform/display/hlgbas/High-Level+Group+for+the+Modernisation+of+Official+Statistics
UNITED NATIONS ECONOMIC COMMISSION FOR LATIN AMERICA AND THE CARIBBEAN (ECLAC). 2011. Code of practice in Statistics for Latin America and the Caribbean. Consulted on the 11th of March 2016 and retrieved from http://www.cepal.org/deype/puclicaciones/externas/6/47276/codigo-regional-buenas-practicas/ALC-ENG.pdf.
UNITED NATIONS STATISTICS DIVISION (UNSD). 1994. Official Records of the Economic and Social Council, Supplement No. 9 (E/1994/29), chap. V. Consulted on the 11th of March 2016, and retrieved from http://unstats.un.org/unsd/statcom/doc94/e1994.htm.
UNITED NATIONS STATISTICS DIVISION (UNSD). 2015. United Nations Fundamental Principles of Official Statistics – Implementation Guidelines, New York. Consulted on the 11th of March 2016, and retrieved from http://unstats.un.org/unsd/dnss/gp/impguide.aspx.

Statistics Canada – Catalogue no. 11-634-X 31
Section 1 - Characteristics of an effective national statistical system Chapter 1.3 - Following international standards
Chapter 1.3 – Following international standards
Context Standards generally refer to “a comprehensive set of documented agreements containing technical specifications or other precise criteria to be used consistently as rules, guidelines, or definitions of characteristics, to ensure that materials, products, processes and services are fit for their purpose. They are usually established by consensus and approved by a recognized body, generally by International Organizations such as United Nations Statistics Division (UNSD), International Monetary Fund (IMF) and Organization for Economic Co-operation and Development (OECD), and aim at the achievement of the optimum degree of order in a given context.14
In the statistical context, there are three types of standards:
• standards about statistical units, populations, concepts, variables and classifications in statistical programs that define the content and the structure of what is being measured;
• statistical frameworks, such as the System of National Accounts, that provide a basis for compiling statistical information about certain sectors or dimensions of the economy, society and environment;
• reference frameworks for modernization that provide a common structure and a shared vocabulary to develop, produce and disseminate statistical information consistently across all statistical programs and statistical organizations.
The motivation behind the adoption and use of standards by statistical agencies includes the following:
• Informing Canadians, by providing consistent, coherent and relevant statistical information, about the country’s economy and society;
• Producing information compiled according to sound, internationally agreed-upon established approaches and best practices with regard to concepts, data sources and methods;
• Allowing comparability within and between countries; and
• Fostering interoperability and greater integration in official statistics by using a common statistical production architecture.
In other words, the use of standards is essential to maximize the effectiveness of statistical outputs and the efficiency of the production process in terms of inter-temporal, national and international comparability. It is key to the coherence and integration of statistics over time and across statistical programs and geographical boundaries.
The use of generally recognized standards should therefore be seen as a key strategic objective for all official statistical organizations, in particular because it has an impact on their legitimacy. Indeed, if statistical outputs are not coherent and comparable, their relevance to users is diminished. Since relevance for users must be the first attribute of high-quality statistics, any reduction in the relevance of a statistical agency’s outputs could very negatively affect its credibility.
Moreover, the data revolution15 currently under way is a transformative impetus for official statistics that calls for a standards-based modernization agenda to facilitate exchange of practices and technologies within individual agencies, and within the official statistics “industry” as a whole.
Strategies, mechanisms and toolsThis section includes a number of important considerations for the adoption and use of international standards. It focuses on the strategies and processes that national statistical offices (NSOs) should consider when planning and implementing any type of standards. Specific examples about Statistics Canada are provided as additional and complementary content.
14. UNITED NATIONS STATISTICS DIVISION. 2012.15. SMITH. W. 2015.

Statistics Canada – Catalogue no. 11-634-X32
Compendium of Management Practices for Statistical Organizations From Statistics Canada’s International Statistical Fellowship Program
This section is divided into four subsections:
1. Generic strategic considerations in adopting and using international frameworks and standards;
2. Strategies and processes for the adoption and the use of standardized statistical units, populations, concepts, definitions, variables and classifications;
3. International statistical frameworks; and,
4. Reference frameworks for modernization.
1. Generic strategic considerations in adopting and using international standards
Implementing an international standard requires a comprehensive strategic process to better inform statistical production and dissemination. As mentioned earlier in this chapter, there is often a strong link between the use of international frameworks and standards, the relevance for users of the data produced, and the efficiency of statistical systems. Although it is important to adopt international frameworks and standards, doing so can be a costly and demanding endeavour. Decisions about what to implement, when to implement, and how to implement must be well thought through, and must lead to realistic implementation plans.
The followings are a series of questions that NSOs should address prior to the implementation of an international standard:
• Does the international standard address the realities of the society, the economy and the physical environment of the country?
• Does the international standard inform the development of statistical programs?
• Are all components of the standards relevant to local realities and users’ needs? What components should be considered and which ones should be ignored? What are the most important components to include? What is the rationale for not following certain aspects of a standard, and what would be the impact? How much does the NSO need to deviate from the standard to meet the needs of its own context while respecting the underlying principle of comparability?
• Has the NSO widely consulted its key stakeholders and data users to get their feedback? Were their points of view considered and their concerns addressed? Will the resulting data products be relevant in the national context?
• Does the NSO have the appropriate funds to implement and maintain this new standard and to reconcile what is available now with what is expected to be coming further to the new implementation?
• Does the NSO have the core infrastructure (statistical, information technology, human resources) to populate statistical data using this new standard?
It is important to emphasize the fact that applicability of any kind of standard or framework should be the object of deep consultations with key users and stakeholders. Consultations, engagement, and open and ongoing communications are crucial, because key users and stakeholders need to be consulted early in the process on potential changes and their impact; and once the NSO decides to implement a new standard or a change a standard, it is imperative that stakeholders and users be made aware, in advance, of the implementation plan and changes.

Statistics Canada – Catalogue no. 11-634-X 33
Section 1 - Characteristics of an effective national statistical system Chapter 1.3 - Following international standards
2. Strategy and process for the adoption and use of standardized statistical units, populations, concepts, definitions, variables and classifications
As previously mentioned, the adoption and use of standardized statistical units, populations, concepts, definitions, variables and classifications is key to ensuring statistical information coherence, integration and comparability across programs and geographical boundaries. Text box 1.3.1, below, provides definitions of the key concepts.
Box 1.3.1Definitions
A statistical unit refers to the unit of observation or measurement for which data are collected or derived. On the social side, the most common statistical units include person, census family, economic family, household, and dwelling, while business surveys tend to target a location, an establishment, a company, and an enterprise. The universe formed by all statistical units within a dataset is referred to as the population. A concept is a general or abstract idea that expresses the social and/or economic phenomenon to be measured and is usually contained in a definition. A statistical classification is a set of categories that may be assigned to one or more variables registered in statistical surveys or administrative files, and used in the production and dissemination of statistics. Finally, a variable combines a concept with a statistical unit and defines the characteristic that is to be measured.
Good management practices in the use of international standards usually include the following:
• a governance structure supported by consultation mechanisms ensuring that the impacts of any decision on the internal producers and external users of the statistics to which the standards will apply are taken into account.
• the creation of specific and specialized organizational units, with the appropriate level of seniority, responsible for (1) taking the lead in the adoption and development of statistical standards, (2) supporting statistical programs/domains in their efforts to develop standards, where such standards do not exist or have become outdated, and (3) providing coherence or mapping between different versions of standards for time series.
• a process to monitor the extent to which statistical standards are used by the statistical programmes/domains and make them accountable for their application of the standards; and
• a communications strategy to ensure that all relevant staff are aware of statistical standards and any changes made to them, as well as the degree to which the application of each standard is compulsory.16
In Statistics Canada, the use of standardized statistical units, populations, concepts, definitions, variables and classifications benefits from a specific governance structure and a policy that aim for an effective and consistent approach.
Statistics Canada’s Policy on Standards provides a framework for reviewing, documenting, authorizing, and monitoring the use of standard names and definitions for populations, statistical units, concepts, variables and classifications used in Statistics Canada’s programs. The policy prescribes different levels of implementation requirements for standards approved by the appropriate senior committee (the Methods and Standards Committee):
• departmental standard – application is compulsory, unless an exemption has been explicitly obtained under the terms of the policy;
• recommended standard – a standard that has been recognized with or without a trial period of a specified duration, after which it may be declared a departmental standard;
• program-specific standard – a standard adopted by a statistical program.
Statistics Canada also has a mature and effective governance and management structure that ensures an integrated approach to strategic priority-setting, decision making and accountability (see chapter 2.2 – Integrated Strategic Planning). Responsibilities for adopting and using international standards are shared among three
16. UNITED NATIONS STATISTICS DIVISION. 2012

Statistics Canada – Catalogue no. 11-634-X34
Compendium of Management Practices for Statistical Organizations From Statistics Canada’s International Statistical Fellowship Program
entities: the Standards Division, the Methods and Standards Committee, and program areas. The latter two are expected to ensure that the impact on end users of statistics is understood and factored into any standards-related decision.
The Standards Division’s mandate is to develop, maintain and communicate statistical standards, to promote and monitor their implementation, to provide guidance on their interpretation, and to produce bridging mechanisms (for example, concordance tables) that facilitate the comparison or transfer of data across different classification schemes. The Standards Division is also mandated to develop, maintain and disseminate statistical metadata for the agency’s surveys and statistical programs, under the terms of the Policy on Informing Users of Data Quality and Methodology.
The Standards Division is guided by international standard developments, by organizational needs or by program needs. The Methods and Standards Committee is the governance mechanism for strategic direction as well as for monitoring compliance and approving exceptions to the standards. It also receives guidance from a number of other internal committees, such as the Information Management Committee (see chapter 2.7 – Information Management), subject-matter committees, and external expert groups. Figure 1 illustrates the links within and outside the governance structure of the Standards Division.
The Methods and Standards Committee is a senior management committee whose role is to
• assist and advise on the development and application of statistical standards and metadata within the agency’s programs;
• approve the adoption of statistical concepts, variables and classifications as departmental standards;
• approve exemptions to departmental standards where appropriate;
• advise on the development and use of sound statistical methods;
• provide guidance on priorities for statistical research and innovation; and,
• act as the focal point for the review and monitoring of corporate data-quality practices and issues.
This committee reports to the agency’s senior management board; i.e., the Executive Management Board (EMB), to ensure global coherence of all management practices. Final decisions about departmental standards are the responsibility of the EMB based on recommendations from the Methods and Standards Committee.
Once standards are approved by this committee, they are implemented by survey programs. The program areas are responsible not only for implementing standards and communicating them to users, but also submitting to the Methods and Standards Committee applications for the declaration as standards of names and definitions of populations, statistical units, concepts, variables or classifications.

Statistics Canada – Catalogue no. 11-634-X 35
Section 1 - Characteristics of an effective national statistical system Chapter 1.3 - Following international standards
The illustration 1.3.1 highlights the governance structure for standards in Statistics Canada:
Figure 1.3.1External and internal governance with regard to standards and classification at Statistics Canada
While the Policy on Standards and Governance provides control and balance over the application of international standards within the organization, Statistics Canada has developed tools to support the use of standards and to gain in efficiency in applying them.
First, to facilitate the implementation of standards by program areas, the agency developed harmonized content for social surveys. In addition to providing efficiencies to survey managers who re-use questions and programming for applications rather than re-developing them for every survey or survey cycle, the goal of the harmonized content initiative is to increase comparability of survey data across cycles and surveys. Several concepts have been harmonized. These include a set of standardized questions and response categories, pre-packaged metadata to accompany questions, variables and classifications, automatic retrieval in the Questionnaire Development Tool, pre-programmed computer-assisted applications, and processing rules. The use of harmonized content has been made mandatory for all surveys except where an exemption has been granted.
Coding, which is the procedure for classifying the provided data on a questionnaire to standardized statistical classification—has also been facilitated through the use of a programming tool (G Code17) and a coding interface (Classification Coding System). G-Code is an automated system which assigns codes to descriptions. It does so by matching input text descriptions, which could be from a questionnaire, with “parsed” or “standardized” descriptions in a G-Code database. The CCS is an electronic, generalized, interactive coding tool designed to assist with the assignment of numeric codes for the specified classification. It is the key corporate tool for computer-assisted “manual” coding. The system offers codes for industry, occupation, instructional classifications and products. It provides a common set of files and rules and thus ensures consistency in coding. It is designed to be easily customizable to suit individual requirements. Other advantages include (1) the ability to code to more than one classification, (2) the ability to search through the reference file or the classification code, title, description, or notes, and (3) the ability to embed CCS into a coding application and import other data sources, such as questionnaire responses.
The ability to code to more than one classification is particularly important when different international organizations require the statistical agency to report the same information according to different standards. In Canada, for example, industries are classified according to the North American Industry Classification
17. PICARD, V. 2015.

Statistics Canada – Catalogue no. 11-634-X36
Compendium of Management Practices for Statistical Organizations From Statistics Canada’s International Statistical Fellowship Program
System (NAICS). This standard is used to classify enterprises from the bottom up, according to the value-added of the primary unit activity. As per its name, this classification is used in Canada, the United States and Mexico; it is negotiated and revised trilaterally.
However, the international standard for industry is the United Nations International Standard Industrial Classification (ISIC). The primary focus of the ISIC classification system is the type of activity in which establishments or other statistical entities are engaged. The main criteria used are the following: (1) the nature of the goods and services produced; (2) the uses to which the goods and services are put; and (3) the inputs, the process and the technology of production. The third criterion corresponds to the conceptual basis of NAICS. Canada is therefore required to use ISIC to report its data to international organizations such as the UNSD, the IMF, and the OECD. Although the two classifications are moving towards greater coherence, both classifications must be maintained. To achieve this in an efficient manner, concordance tables have been developed. Canada reports industrial data on an ISIC basis using a concordance between NAICS and ISIC and performs the manual resolution of the non-unique match using the CCS.
3. Strategy and process for the use of international statistical frameworks
To ensure that the application of scientifically-based statistical methodology meets the requirements of international standards and the principles of official statistics, NSOs are encouraged to follow international statistical frameworks.
The most commonly used ones are probably those related to the production of national accounts, balance of payments, consumer and production prices indexes, and population censuses. There is also a variety of other frameworks on specific topics, including environment, health, income and wealth, labour.
An effective and strategic approach to adopting and using international frameworks normally involves a five-step process: (1) participating in international forums or committees where new frameworks are developed or revised; (2) planning; (3) consulting users and stakeholders; (4) developing an implementation and maintenance plan; and (5) pro-actively communicating with users and stakeholders “before and after” the implementation of the new framework.
In fact, the starting point is to stay informed of new standards being developed or revised and to participate in their adoption. This can be done at two levels. First, NSOs can participate or be represented in expert groups consisting of international experts in the domain where best practices and new frameworks are defined. Second, NSOs are usually invited to participate in the final discussions prior to the adoption of a new statistical framework. Active participation in international working groups and meetings is an effective vehicle for the agency to make its voice heard, to raise potential concerns, and to influence, to the extent possible, the end result. By doing so, the agency minimizes the need for adjustment to its specific national context. The discussions and developments for new or improved frameworks are usually led by international organizations, such as the UNSD, the IMF, the various regional United Nations economic commissions,18 the OECD, the Food and Agriculture Organization (FAO) of the United Nations, the World Health Organization (WHO), and the United Nations Educational, Scientific and Cultural Organization (UNESCO).
When it is time for the agency to consider adopting or implementing a new statistical framework, consultations with users and stakeholders are activated, to ensure it is appropriate to the national context or to discuss appropriate adjustments that can be made. In parallel, designing and developing an implementation and maintenance plan requires agreeing on key milestones, on funds and resources that need to be put in place in advance, and on communications strategies to maintain ongoing dialogue and engagement with key users and stakeholders.
At Statistics Canada, each subject-matter division is responsible for managing and implementing the appropriate international frameworks that are relevant to the data for which the division is responsible. Statistics Canada’s System of National Accounts is provided as an example in text box 1.3.3, at the end of this chapter.
18. The various regional United Nations economic commissions include: UNITED NATIONS ECONOMIC COMMISSION FOR AFRICA (UNECA), UNITED NATIONS ECONOMIC COMMISSION FOR EUROPE (UNECE), ECONOMIC COMMISSION FOR LATIN AMERICA AND THE (ECLAC), UNITED NATIONS ECONOMIC AND SOCIAL COMMISSION FOR ASIA AND THE PACIFIC (UNESCAP), and UNITED NATIONS ECONOMIC AND SOCIAL COMMISSION FOR WESTERN ASIA (UNESCWA).

Statistics Canada – Catalogue no. 11-634-X 37
Section 1 - Characteristics of an effective national statistical system Chapter 1.3 - Following international standards
4. Strategy and process for the use of reference frameworks for modernization
More recently, there has been growing interest for a standards-based modernization agenda. The High-Level Group for the Modernization of Statistical Production and Services, which reports annually to the Conference of European Statisticians (CES), has reviewed and adopted the standards necessary to support collaboration between agencies. In this respect, the Generic Statistical Business Process Model (GSBPM), the Generic Statistical Information Model (GSIM) and the Common Statistical Production Architecture (CSPA) have been identified as key standards to drive the modernization of official statistics.
The GSBPM19 is intended to apply to all activities carried out by producers of statistics, at both national and international levels, which result in data outputs. The GSBPM is designed to be independent of data sources; it can therefore be used for the description and quality assessments of processes based on surveys, censuses, administrative records, and other non-statistical or mixed sources.
The rapid adoption of the GSBPM (or closely related national versions thereof) by statistical agencies around the world shows a wide acceptance of the idea that all statistical production can be modelled in terms of different combinations of less than 50 generic sub-processes. By mapping current and planned statistical processes to the GSBPM, it becomes easier to see where synergies can be found between processes, both within and across agencies. This, in turn, helps to identify good practices and improve efficiency within each sub-process. The GSBPM is also increasingly being used as a tool to identify the cost of different parts of the production process, and to inform strategic decisions on resource allocation.
The GSIM complements the GSBPM and provides a link to data and metadata standards such as the Data Documentation Initiative (DDI) and the Statistical Data and Metadata eXchange (SDMX). The GSIM is a reference framework of internationally agreed-upon definitions, attributes and relationships that describes the pieces of information used in the production of official statistics (information objects). This framework enables generic descriptions of definitions, and management and use of data and metadata throughout the statistical production process. The GSIM provides a common language to describe information that supports the whole statistical production process, from the identification of user needs through to the dissemination of statistical products. GSIM is a strategic approach designed to bring together experts from different disciplines (e.g., information technology, statistics, subject-matter areas.) to modernize and streamline the production of official statistics.
The CSPA provides a blueprint for designing and developing statistical production components in a way that makes them much easier to share within and between organizations.
These frameworks, in particular the GSBPM and the GSIM, have been adopted by the Methods and Standards Committee of Statistics Canada as departmental standards. They support the implementation of the Corporate Business Architecture (CBA) principles that dictate Statistics Canada’s modernization strategy. For details refer to Chapter 3.1 – Corporate Business Architecture.
Key Success FactorsTo ensure efficiency and relevancy in adopting international frameworks and standards, it is very important for NSOs to consider the planning, consultation and communication phases, as outlined in the previous section.
Working closely with international organizations and other NSOs to develop standards for key statistical measures (e.g., economic accounts, labour force characteristics, price indices, environmental accounts), as well as internationally coherent classifications of industries, occupations and other characteristics, greatly contributes to a better understanding of the nature of the characteristics to be measured, as well as how to measure the characteristics more accurately.
Because Statistics Canada has built an expertise in developing and using standards, the organization is well-positioned to support other federal departments in using these standards and classifications for statistical purposes, as well as for administrative purposes. This can greatly contribute to the statistical usability of administrative data produced by these departments.
19. UNITED NATIONS ECONOMIC COMMISSION FOR EUROPE. 2013.

Statistics Canada – Catalogue no. 11-634-X38
Compendium of Management Practices for Statistical Organizations From Statistics Canada’s International Statistical Fellowship Program
The fact that Statistics Canada operates in a centralized statistical system helps establish a strong culture of support in implementing statistical standards. It also facilitates the development of standards-based statistical programs, such as the Integrated Business Survey Program, the harmonized content initiatives for social and business statistics, and the adoption of the GSBPM and GSIM as key reference frameworks for modernization.
ChallengesNSOs in general need to continue to balance between the compliance to international standards and their own realities (e.g., maintaining time series, confidentiality of published data, user requirements, flexibility of creating variants, and available resources). When there are multiple standards to measure social, environmental or economic characteristics, it might also be challenging to choose the right one or to comply with all of the applicable ones. Although greater alignment between standards represents the longer-term solution to this issue, the short-term solution might be, as suggested by the guidelines for the implementation of the United Nations Fundamental Principles of Official Statistics, to “use the standard most frequently requested by users, and to maintain documentation on differences, including mappings, where applicable, to facilitate reporting according to alternative standards when necessary.”20
Looking aheadWith globalization, NSOs are moving towards global-level standards and a greater degree of international collaboration in building common statistical infrastructures. Adopting common frameworks and standards needs to be efficiently, consistently and systematically integrated into and linked with the Quality Assurance Framework (for more details, refer to Chapter 1.5 – Managing quality), business/information architectures, and structures for statistical classifications and other statistical metadata. Box 1.3.2
20. UNITED NATIONS STATISTICS DIVISION. 2015.

Statistics Canada – Catalogue no. 11-634-X 39
Section 1 - Characteristics of an effective national statistical system Chapter 1.3 - Following international standards
Box 1.3.2Example of the use of an international statistical framework at Statistics CanadaThe System of National Accounts
The System of National Accounts (SNA) is the internationally agreed-upon standard set of recommendations on how to compile measures of economic activity. The SNA describes a coherent, consistent and integrated set of macroeconomic accounts in the context of a set of internationally agreed-upon concepts, definitions, classifications and accounting rules.
In addition, the SNA provides an overview of economic processes, recording how production is distributed among consumers, businesses, government and foreign nations. It shows how income that originates in production, and that is modified by taxes and transfers, flows to these groups, as well as how they allocate these flows to consumption, saving and investment. Consequently, the national accounts are one of the building blocks of macroeconomic statistics, forming a basis for economic analysis and policy formulation.
The SNA is intended for use by all countries, having been designed to accommodate the needs of countries with economies that vary in nature, complexity and level of development. It also provides an overarching framework for standards in other domains of economic statistics, facilitating the integration into the national accounts of the data produced by these statistical systems.
In Canada, the majority of national, provincial and territorial macroeconomic indicators originate from the Canadian System of Macroeconomic Accounts (CSMA) program. These indicators include such things as gross domestic product, net worth, savings, household disposable income, and government debt.
Statistical revisions are carried out regularly in the CSMA to incorporate the most current information from censuses, annual surveys, administrative statistics, public accounts, for example, and to implement improved estimation methods. These types of revisions are referred to as annual revisions, and are generally restricted to the most recent three to four years of annual estimates.
Statistics Canada also conducts what are often referred to as “historical” or “comprehensive” revisions to the CSMA. These revisions reflect new concepts, accounting treatment, classification systems or methods, as specified by international accounting standards, or are the result of ongoing research at Statistics Canada. Statistics Canada conducted these types of revisions every 10 to 15 years, with major revisions taking place in 1986, 1997 and, most recently, 2012.
The most recent update came from the new SNA manual, released by the United Nations Statistical Commission in 2008. On this basis, Statistics Canada has determined that, following the 2012 release, revisions relating to concepts, methods, classification systems, and accounting standards will be conducted more frequently, and will be rolled into the annual CSMA revision process. Two factors drive this change. The first is to ensure that the CSMA remains relevant and reflects the current state of the Canadian economy. The second is to ensure that the CSMA remains internationally comparable. Most other G-20 nations are conducting comprehensive revisions with increased frequency, and the CSMA is aligning itself accordingly. While the revisions to CSMA concepts, methods and accounting treatment will occur more frequently, they will be smaller in scale than those carried out in the past.
Upcoming revisions are usually included in Statistics Canada’s 10-year investment plan to ensure that proper resources will be available. They are also managed by experts from the Macroeconomic Accounts branch using Statistics Canada’s Project Management Framework. The use of this framework ensures that the implementation of the revisions stays on budget, in scope and on time and that changes, risks and interdependencies with other statistical programs are properly addressed.
Communication plans are also developed to communicate upcoming revisions well in advance, so that users can understand the revisions and adapt systems, analysis and models to incorporate new estimates.

Statistics Canada – Catalogue no. 11-634-X40
Compendium of Management Practices for Statistical Organizations From Statistics Canada’s International Statistical Fellowship Program
BibliographyPICARD, Vincent. 2015. High-speed coding, Statistics Canada, Internal publication. Accessible on demand.
SMITH, Wayne. 2015. The Data Revolution – Presentation to the 3rd International Open Data Conference Presentation, Wayne Smith, Chief Statistician.
STATISTICS CANADA. 2004. Policy on Standards, Ottawa. Internal document. Accessible on demand.
STATISTICS CANADA. 2000. Policy on Informing Users of Data Quality and Methodology, Ottawa. Consulted on 11th of March 2016 and retrieved from http://www.statcan.gc.ca/eng/about/policy/info-user
UNITED NATIONS. 2014. Fundamental Principles of Official Statistics: Implementation guidelines. Consulted on 11th of March 2016. Retrieved from http://unstats.un.org/unsd/dnss/gp/impguide.aspx
UNITED NATIONS ECONOMIC COMMISSION FOR EUROPE. 2013. Generic Statistical Business Process Model. Consulted on 11th of March 2016 and retrieved from http://www23.statcan.gc.ca/standards-normes/gsbpm-msgpo/2013/index-eng.html
UNITED NATIONS STATISTICAL DIVISION. 2012. Global Inventory of International Statistical Standards. Prepared by the Committee for the Coordination of Statistical Activities (CCSA). Consulted on 11th of March 2016 and retrieved from http://unstats.un.org/unsd/iiss/MainPage.ashx

Statistics Canada – Catalogue no. 11-634-X 41
Section 1 - Characteristics of an effective national statistical system Chapter 1.4 - Understanding users’ needs and maintaining relationships
Chapter 1.4 – Understanding users’ needs and maintaining relationships
ContextInformation produced by national statistical offices (NSOs) must be relevant and must inform programs and policies, the socio-economic environment, and the public economic and social debate. Information needs are constantly changing and are becoming more and more sophisticated. As a result, NSOs need to constantly adapt to changes to ensure relevance.
To reach that goal, a statistical agency has to understand its stakeholders and its users’ needs. “The statistical agencies should build and sustain very good relationships with all of their key stakeholders, including users, data providers, funding agencies, senior government officials, relevant community organizations, and the media.”21
It is important to consult stakeholders and users for the following reasons:
• They contribute to identifying data gaps in statistical programs;
• They participate in consultations as new surveys are developed or existing surveys are improved;
• They provide data;
• They provide administrative data files that can be used to complement survey programs;
• They use data to inform programs and policies.
A statistical agency must always endeavour to find out what information users need. One of the major pitfalls to avoid is to assume that the agency can determine, on its own, users’ needs. While the statistical organization will inevitably have to make difficult choices among competing demands for information in a context of limited resources, these choices must be backed by solid knowledge, based on high-level consultations with users and experts, of the policy implications of each competing demand. Such knowledge is an essential input to successful strategic planning by a statistical agency. Here are the principles that should guide statistical organizations’ relationships with their users:
• The quality of the information produced must always be properly defined to users. That is essential for users to be able to assess fitness for purpose and to uphold the credibility of the organization.
• Regular exchanges with users, particularly on issues of relevance and quality, establish and maintain trust and legitimacy in the eyes of users and respondents.
• This trust often leads to additional requests for statistical data produced for users on a cost-recovery basis; that is, for a fee. To maintain the reputation of a neutral, professional organization, Statistics Canada can take on this work only if it has the required capacity and the work is congruent to the national statistical agency’s mandate and adds value to the national statistical system. Please refer to Chapter 1.6 – Partnerships on a cost-recovery basis.
Statistics Canada understands the importance of meeting users’ needs. This is a requirement under the Statistics Act. As the core of a centralized statistical system, Statistics Canada has the obligation to serve all statistical needs, to the greatest extent possible, among levels of government, research communities, businesses and the general public (for more details on the centralized statistical system, please refer to chapter 1.1 – Leadership and coordination of the National Statistical System.
21. UNITED NATIONS STATISTICS DIVISION. 2012.

Statistics Canada – Catalogue no. 11-634-X42
Compendium of Management Practices for Statistical Organizations From Statistics Canada’s International Statistical Fellowship Program
Strategies, mechanisms and toolsA number of strategies, mechanisms and tools are available to statistical agencies to help them continually improve relationships with data users. There are two guiding principles in this regard: one is to ensure that consultations take place with various types of users (from different communities); and the other is to ensure that it be done consistently rather than in an ad-hoc way.
Statistics Canada counts on a broad range of users with a wide scale of technical skills sets to access and use the data:
• federal departments
• provincial, territorial and municipal governments
• non-governmental organizations
• businesses
• academic bodies and think tanks
• media
• general public
• international organizations.
Those users are regularly consulted through a variety of approaches. This section describes the most relevant and efficient strategic approaches followed by Statistics Canada.
1. The National Statistics Council
The formal mandate of the National Statistics Council (NSC) is to “advise the Chief Statistician in setting priorities and rationalizing Statistics Canada programs.” Members of the NSC are appointed for a period of three years, subject to renewal. The NSC comprises about 40 members.
Originally members were appointed by the Minister from a list of persons recommended by the Chief Statistician. In 2010 the Minister delegated this to the Chief Statistician, and since that time all members are now appointed by the Chief Statistician.
Members of the NSC act on an individual basis; they do not act as representatives of particular interests.
The factors that optimize the NSC’s impact are the following:
• diverse representation and interests;
• experience in a broad range of sectors from across the country ;
• recognition of members in their field.
As a result of these measures, the NSC is a very knowledgeable, diverse, and representative group.
The NSC normally meets twice a year. Included among regular agenda items are “Statements by Members,” in which NSC members may raise questions or concerns either for immediate response or subsequent discussions, and an in-depth report by the Chief Statistician on recent developments at Statistics Canada (including new substantive initiatives, analytical insights, forward planning and budgetary expectations). Other agenda items usually deal with major program updates—such as the censuses, environment statistics, longitudinal data, issues in social statistics, National Accounts, dissemination practices, pricing policy, privacy and record linkage, contingency planning in the face of expected budget cuts, and significant statistical information gaps.
The meeting agenda is composed of items raised by members and issues identified by Statistics Canada in discussion with the Chairperson. From time to time, a subgroup of the NSC is formed to address particular issues (e.g., access to historical censuses).
The NSC generally provides feedback to the Chief Statistician through discussion among its members. Consensus is usually (though not always) achieved. Resolutions and formal recommendations are rare, although

Statistics Canada – Catalogue no. 11-634-X 43
Section 1 - Characteristics of an effective national statistical system Chapter 1.4 - Understanding users’ needs and maintaining relationships
the Chairperson has been authorized by the NSC, on a few occasions, to write to the responsible Minister, on topics such as securing funding for testing the 1991 Census and the impact of potential additional budget reductions on the outputs of Statistics Canada.
The Chief Statistician considers the NSC’s advice as substantially beneficial. In addition, through the recognition of its members and on the basis of precedent, the NSC has evolved into an additional and—should the need arise—undoubtedly very influential bulwark in the defense of the objectivity, professional integrity and independence of Canada’s national statistical system.
2. Committees and official meetings with major federal government users
Statistics Canada interacts with all federal departments and agencies. Consultation mechanisms are in place, particularly for the major federal government users listed in the text box 1.4.1.
Box 1.4.1Main users of Statistics Canada’s information in the federal government
Bank of Canada
Department of Finance Canada
Innovation, Sciences and Economic Development Canada
Health Canada
Environment and Climate Change Canada
Agriculture and Agri-Food Canada
Indigenous and Northern Affairs Canada
Canadian Institute of Cultural Affairs
Department of Justice Canada
Immigration, Refugees and Citizenship Canada
Canada Revenue Agency
Global Affairs Canada
Transport Canada
Travel and Tourism
Infrastructure Canada
Natural Resources Canada
National Defense and the Canadian Armed Forces
Heritage Canada
Canada Mortgage and Housing Corporation
Service Canada
These government departments and agencies are Statistics Canada’s primary stakeholders: their programs and policies are the main drivers of much of the agency’s statistical programs, and they finance the vast majority of the cost-recovery work carried out by Statistics Canada.
It is thus crucial to maintain strong relationships with these departments and agencies. This is done through both horizontal and bilateral relationships, at every level of the government hierarchy, from the Deputy Minister to working analysts. These relationships have developed through regular meetings (horizontal and vertical), the creation of committees, and data sharing agreements.
The Chief Statistician is a member of the Deputy Minister community. This group meets weekly and the current and forward-looking issues on which the government is focusing are discussed. He also meets, usually on an annual basis, with the Clerk of the Privy Council, who is the head of the federal public service, to discuss the performance of, and issues facing, Statistics Canada.
The Chief Statistician also participates in several horizontal Deputy Minister-level committees on the economy, social trends and public-sector administration (the list of the major committees and their mandates is provided in Table 1.4.1).

Statistics Canada – Catalogue no. 11-634-X44
Compendium of Management Practices for Statistical Organizations From Statistics Canada’s International Statistical Fellowship Program
Table 1.4.1List and mandates of Deputy Minister-level, horizontal committees on the economy, social trends and public-sector administration attended by the Chief Statistician
Committees Mandates
Public Service Management Advisory Committee
To provide a forum for discussion of the public service management agenda.
Deputy Ministers’ Committee on Economic Trends and Policies
To examine trends and develops scenarios with respect to economic issues and future challenges to Canadian competitiveness and long-term prosperity, including flows in trade and investment, the effects of new technologies on policy, ethical issues and regulatory capacity.
To examine the role of government and the impact of policy interventions, such as regulatory frameworks, labour market policies, and incentives for investment, in sectors such as transport, infrastructure, manufacturing, natural resources, fisheries and agriculture.
Deputy Ministers’ Committee on Social Trends, Policies and Institutions
To examine trends and develop scenarios with respect to social issues, including inequality and the exclusion of at-risk groups, crime and justice issues, and threats to our health and well-being, individually and in our communities.
To examine the impact of policy interventions to address these issues, and to strengthen communities and belonging as well as the role played by institutions and jurisdictions in these efforts.
Policy Horizons Canada Deputy Ministers’ Steering Committee
To provide timely and integrated perspectives on emerging policy issues for the Deputy Ministers’ community by the following means: bridging people, ideas, data, issues, and evidence in an open and constructive environment; co-creating knowledge for understanding complex Canadian policy challenges; and experimenting with new tools and methods.
Deputy Ministers’ weekly Meeting
Weekly meetings where deputy ministers are debriefed on the government’s priorities and where they discuss plans and priorities.
Source : PRIVY COUNCIL OFFICE (2015), POLICY HORIZONS CANADA (2015).
A statistical agency must also take full advantage of meeting with the heads of key user organizations. For example, an annual meeting with the Governor of the Bank of Canada and his most senior officials is a key opportunity for the Chief Statistician and his assistant chief statisticians to discuss important issues regarding the data produced by Statistics Canada.
At different levels of the organization, assistant chief statisticians, directors general, and directors participate in horizontal-level committees on strategic directions for developing statistical information. They meet with their counterparts of policy departments once or twice a year, according to the nature of their programs. These committees are key to governing relations and discussing priorities with key policy departments. It is important to clarify that these meetings are not taking place at the same time but, rather, department by department to focus on specific issues and topics and maintain high-level involvement and interest.

Statistics Canada – Catalogue no. 11-634-X 45
Section 1 - Characteristics of an effective national statistical system Chapter 1.4 - Understanding users’ needs and maintaining relationships
3. Committees and agreements with provincial, territorial and municipal government users
Canada is a confederation, where responsibility for government programs is shared across federal, provincial, territorial and municipal jurisdictions.
Statistics Canada, through the Statistics Act, is responsible for overseeing the national statistical system. This includes coordination of statistical activities across the provinces and territories. This also requires that Statistics Canada, to the maximum extent possible, cater to the statistical needs of all levels of government, as well as those of the private sector.
Provinces and territories have major jurisdiction in areas, such as administration of justice, health and education. The provincial and territorial programs and policies can and do differ across the thirteen jurisdictions. Thus, the determination of horizontal needs for statistical information access and use of data can become quite complex.
To support this role, Statistics Canada has put in place three mechanisms:
3.1 Federal-Provincial-Territorial Consultative Council on Statistical Policy and its subordinate committeesEstablished in 1974, the Council’s mandate is to coordinate federal-provincial-territorial aspects of the national statistical system. One of the main purposes of this mechanism has been to serve the needs of the respective governments for information from Statistics Canada.
Statistics Canada has asked each province and territory to name an individual within their administration to serve as a focal point on statistical matters. Most provinces have chosen to name the head of their provincial or territorial statistical office. Each provincial and territorial counterpart signed a Memorandum of Understanding (MOU) in 1989, setting out relative roles and responsibilities.
In its operations, Statistics Canada liaises with the focal points on an ongoing basis. In addition, every year, the Chief Statistician meets with the focal points at the Federal-Provincial-Territorial Consultative Council on Statistical Policy to discuss high-level issues of priorities, statistical policies and programs.
The Council ensures that
• information requirements and outputs are reviewed to maintain the relevance of programs;
• changes in priorities are ascertained, to avoid program duplication by data sharing;
• arrangements for the supply of administrative data are made; and
• definitions, standards and practices are harmonized.
Under the aegis of the Council, a number of more specialized committees have been struck to discuss more detailed issues of program operations and implementation.
Thus the Council oversees six subordinate statistical committees focused on specific domains:
• Agriculture Statistics
• Economic Accounts
• Census of Population
• Demography
• Labour Statistics
• Social Statistics.
Each of these committees is chaired by a senior executive from Statistics Canada, and meets annually.

Statistics Canada – Catalogue no. 11-634-X46
Compendium of Management Practices for Statistical Organizations From Statistics Canada’s International Statistical Fellowship Program
3.2 Data sharing agreements with provincial and territorial governments Data sharing agreements relate to the sharing of statistical activities that take place in that province or territory. While ensuring confidentiality is protected, these agreements are in place to enhance the collaboration between Statistics Canada and the provinces and territories and also avoid duplication in the information collected by government departments.
3.3 Consortia of municipalities and non-governmental organizationsIn November 2013, Statistics Canada initiated extensive dialogue with a number of municipalities to explore avenues for making effective use of existing administrative data held by municipalities in order to fill data gaps, with particular attention being given to the need for small-area information. To facilitate this process, in early 2014, Statistics Canada recruited representation from the municipal-government level to its NSC.
4. Advisory committees
In addition to the National Statistics Council, which sits at the pinnacle of a system of advisory committees, there are other advisory committees that bring together distinguished experts in a particular field (from business, government, non-governmental organizations, and academia) to provide more detailed guidance on program operation and implementation.
The role of these advisory committees is to provide advice and guidance to Statistics Canada and the Chief Statistician on all aspects of the agency’s statistical and analytical programs, including advice on program priorities, survey design and content, dissemination of information, and statistical methods. These advisory committees fall under the authority of the agency’s Executive Management Board.
Members of the various committees are appointed by the Chief Statistician on the recommendation of subject-matter areas. They are selected on the basis of their unique insights, abilities, and professional qualifications. They do not represent the views of their employer or those of any other group or body of which they might be a member. Appointments are for three-year terms, with the possibility of renewal.
The list of the various advisory committees is provided in Box 1.4.2.
Box 1.4.2List of advisory committees at Statistics Canada
• Agriculture Statistics
• Canadian Health Measures
• Demographic Statistics and Studies
• Dissemination
• Environment Statistics
• International Trade
• Labour and Income Statistics
• National Accounts
• Population Health Survey
• Postsecondary Education Statistics
• Price Measurement
• Services Statistics
• Social Conditions
• Statistical Methods
5. Networking with businesses
Businesses are both respondents and data users. Statistics Canada considers that two issues are very important to businesses:
• The burden for respondents to complete Statistics Canada’s surveys. Large businesses regularly receive more than one survey to complete.
• The need to safeguard confidentiality, to prevent the sharing of their confidential information with their competitors.

Statistics Canada – Catalogue no. 11-634-X 47
Section 1 - Characteristics of an effective national statistical system Chapter 1.4 - Understanding users’ needs and maintaining relationships
To address these concerns, Statistics Canada has made inroads to replace survey data with administrative data, for example, tax data. Temporary relief measures have also been implemented when certain respondent burden thresholds have been reached.
In fact, as part of Statistics Canada’s efforts to reduce respondent burden, an ombudsman is available to help business survey respondents.
The ombudsman’s role is to investigate complaints from business survey respondents who believe they are unduly burdened or have been treated unprofessionally by Statistics Canada. The ombudsman’s services are impartial and free of charge.
6. Networking with academics and think tanks
For academics, Statistics Canada has created secure research data centres in universities across Canada, where students and professors can access social statistics microdata under tight security provisions that are meant to safeguard the confidentiality guarantee that Statistics Canada gives to its respondents. Statistics Canada allows limited access to business microdata from its headquarters, located in Ottawa, given the greater issues of confidentiality with business records. For more information, please refer to Chapter 4.4 – Access to microdata.
Statistics Canada also participates in a certain number of conferences and events with the academic community.
7. The media and the general public
To maintain the trust of and collaboration with the general public, Statistics Canada has established ongoing relationships with the media and the general public through appropriate channels, including
• the media, through ongoing access to Statistics Canada spokespersons and experts in the field;
• social media platforms and interactive features accessible through the agency’s website, such as blogs and online chat sessions with Statistics Canada experts;
• events and informal consultation sessions, such as the Talking Statistics series;
• the Statistical Information Service.
The public hears about Statistics Canada through the media. It is therefore crucial to maintain effective media relations. Chapter 4.2 – External Communications and Outreach details the mechanisms used to inform, and to connect and engage with, the media and the general public.
8. Networking and partnerships with international organizations
Participating in activities of international organizations—such as the United Nations, the World Bank, the International Monetary Fund and the Organization for Economic Co-operation and Development—promotes coherence with international standards and methods, and with statistical definitions and concepts. Statistics Canada exchanges with its peers, who are mostly part of the international statistical methods community.
Contacts are established and maintained through exchanges of technical materials, visits, and attendance at international conferences in order to leverage best practices, which are key to ensuring professional relevance of the agency’s methods.
Key success factors Consultations should be perceived and implemented as a two-way mechanism. A national statistical agency can produce relevant, quality data, only if it understands the major analytical requirements of the end user at a very early stage in designing or improving statistical programs.
The other important element is educating users on proper use of statistical data, including analytical workshops, data interpretation workshops, school curriculum textbooks and dissemination of metadata.
Finally, increasing the use of bilateral meetings over multilateral meetings is key to more efficient mechanisms for consulting on, and for discussing and understanding, users’ needs.

Statistics Canada – Catalogue no. 11-634-X48
Compendium of Management Practices for Statistical Organizations From Statistics Canada’s International Statistical Fellowship Program
Challenges and looking aheadFinally, it is crucial to recognize that neither Statistics Canada nor any other statistical agency can satisfy and address all users’ needs. However, knowing that relationships with users are critical to building quality statistical outputs, statistical organizations should analyze their users’ needs with due diligence and ensure that they:
• understand users’ most important requirements;
• obtain and maintain their trust; and
• address their real concerns about confidentiality, privacy and burden, as they are also respondents.

Statistics Canada – Catalogue no. 11-634-X 49
Section 1 - Characteristics of an effective national statistical system Chapter 1.4 - Understanding users’ needs and maintaining relationships
BibliographyPOLICY HORIZONS CANADA. 2015. Who we are. Ottawa. Consulted on the 14th of January 2016 and retrieved from http://www.horizons.gc.ca/eng
PRIVY COUNCIL OFFICE. 2015. Deputy Minister Committee Mandates and Memberships. Ottawa. Consulted on the 14th of January 2016 and retrieved from http://www.pco.gc.ca/index.asp?lang=eng&page=secretariats&sub=spsp-psps&doc=comm/mandat-eng.htm
STATISTICS CANADA. 2015. Corporate Business Plan: Statistics Canada 2015-2016 to 2017-2018. Ottawa. Consulted on the 14th of January 2016 and retrieved from http://www.statcan.gc.ca/eng/about/bp
STATISTICS CANADA. 2014. Ombudsman for business survey respondents. Statistics Canada. Consulted on the 14th of January 2016 and retrieved from http://www.statcan.gc.ca/eng/survey/ombudsman
UNITED NATIONS STATISTICS DIVISION. 2012. Guidelines for the Template for a Generic National Quality Assurance Framework (NQAF). Prepared by the United Nations Expert Group on National Quality Assurance Frameworks. New York. Consulted on the 14th of January 2016 and retrieved from http://unstats.un.org/unsd/dnss/docs-nqaf/GUIDELINES%208%20Feb%202012.pdf

Statistics Canada – Catalogue no. 11-634-X50
Compendium of Management Practices for Statistical Organizations From Statistics Canada’s International Statistical Fellowship Program

Statistics Canada – Catalogue no. 11-634-X 51
Section 1 - Characteristics of an effective national statistical system Chapter 1.5 - Quality Management
Chapter 1.5 – Quality Management
ContextTo adequately inform decisions and public debate, National Statistical Offices (NSOs) need to provide credible statistical information to the public. Credibility can be achieved only if users have faith in the quality of the data produced and in the integrity of the statistical system. An NSO’s reputation as an independent source of trustworthy information could be undermined if the quality of its statistical products is suspect; effective quality management is, therefore, imperative.
While there are several general definitions of “quality” in the statistical context, one of the most succint and commonly used definitions is fitness for use or fitness for purpose. In other words, the concept of data quality refers to the degree to which a set of inherent characteristics fulfils requirements. It is generally recognized that the quality of statistical information is multi-dimensional and cannot be measured through a single dimension.
Box 1.5.1Quality dimensions/components
The six generally accepted dimensions, or components, of data quality are the following:
• Relevance: the degree to which information meets the needs or requirements of clients, users, stakeholders or the audience (refer to chapter 1.4 – Understanding users’ needs and maintaining relationships).
• Accuracy and reliability: the degree of closeness of estimates to true values.
• Timeliness and punctuality: Timeliness refers to how fast the data are released or made available, while punctuality refers to whether data are delivered on the dates promised, advertised or announced (refer to two chapters: chapter 2.4 – The Departmental Project Management Framework and Chapter 3.1 – The Corporate Business Architecture).
• Accessibility and clarity: the degree to which statistics can be found or obtained without difficulty. Data are presented clearly and in such a way that they can be accessed and understood, by all types of users, on an impartial and equal basis. The data are available in various convenient formats, as well as affordable, if not offered free of charge (refer to two chapters: Chapter 4.1 – Disseminating data through the website and Chapter 4.2 – External communications and outreach).
• Coherence and comparability: statistics should be consistent internally and comparable over time, and should be produced using common standards with respect to scope, definitions, classifications and units (refer to Chapter 1.3 – Using international standards).
• Interpretability and metadata: information about the underlying concepts, variables and classifications used, the methodology of data collection and processing, and indications of quality of the statistical information are available for users (refer to Chapter 4.3 – Access to, and management of, metadata.
Other dimensions of quality, such as integrity, topicality, serviceability and methodological soundness, can also be considered or included as a subset of the above dimensions. It is important to note that these dimensions are complementary and balanced with one another. Finally, it can be argued that the relevance dimension is paramount. If the information that is produced responds to the needs of users, the other dimensions become very important. If it does not, the other dimensions are irrelevant.
Because quality is so fundamental to statistical practices, every statistical organization should have a quality management system (or equivalent) to ensure that the desired level of quality is achieved through management of institutional aspects, processes and outputs.22 This chapter will focus on strategies, mechanisms and tools that could be adopted by statistical agencies to improve their quality management practices.
22. UNSD. 2012.

Statistics Canada – Catalogue no. 11-634-X52
Compendium of Management Practices for Statistical Organizations From Statistics Canada’s International Statistical Fellowship Program
Strategies, mechanisms and toolsNSOs typically use various mechanisms and tools to manage quality and develop a quality culture within their organization. These tools can be grouped into four categories:
• a strong quality management governance
• a quality management framework and guidelines
• quality assessments and reporting tools
• other management frameworks contributing to quality enhancement.
1. Quality management governance
In order to champion quality management initiatives, statistical agencies or systems should consider establishing a neutral focal point or resource centre for quality management that is supported and empowered by senior management. Having such a quality unit ensures that quality remains a constant priority and that quality assurance mechanisms and tools are continuously improved upon to meet the demands resulting from a changing environment.
It is with this perspective that Statistics Canada has created a quality unit called the Quality Secretariat, whose mandate is to promote and support the use of sound quality management practices across the organization. The role of the Secretariat is to
1. support the development, revision and implementation of key quality management documents, such as a quality assurance framework, quality guidelines, and policies;
2. support the development and implementation of new quality improvement initiatives or procedures;
3. promote sound quality management practices;
4. provide advice and assist programs as regards compliance with good practices that support quality;
5. support corporate management in the preparation of performance reports on quality;
6. answer requests from other statistical agencies for information or assistance related to quality management.
The activities of the Quality Secretariat are overseen by the Methods and Standards Committee, whose role is to act as the focal point for the review and monitoring of corporate data quality practices and initiatives and to ensure that these activities are coherent with other management frameworks and policies. The Methods and Standards Committee reports to Statistics Canada’s most senior management committee, the Executive Management Board. Through this governance structure, the Quality Secretariat is neutral with respect to statistical programs, and is supported by senior management. Neutrality ensures that quality assurance tools are uniformly relevant across statistical programs, and senior management support guarantees compliance.
It is also a recommended practice to have a quality unit or focal point within statistical programs. The objective is not to absolve all other team members from taking responsibility for quality assurance. On the contrary, the responsibilities of a program-level quality unit include the following:
• encouraging and monitoring quality assurance activities;
• monitoring and interpreting performance indicators;
• investigating quality issues when they arise;
• staying up-to-date on quality-related policy instruments and how they apply to the program;
• liaising with the Quality Secretariat; and
• tailoring quality management practice,s as necessary, to the subject-matter particularities of the program.

Statistics Canada – Catalogue no. 11-634-X 53
Section 1 - Characteristics of an effective national statistical system Chapter 1.5 - Quality Management
2. Quality Management Framework and Guidelines
Although various quality management approaches, models and frameworks exist within the statistical community, systematic quality management within a national statistical office or system usually takes the form of a national quality assurance framework (NQAF). A NQAF is typically an overarching framework that provides context for quality concerns, activities and initiatives, and explains the relationships between the various quality concerns. Recognizing the importance of such a document in quality management, the statistical community has asked an expert group to prepare a Template for a Generic National Quality Assurance Framework and some accompanying guidelines to assist national statistical systems in developing, implementing and enhancing their NQAF. While the template should not be approached as a one-size-fits-all framework, it provides examples of elements required to manage quality at four levels: statistical system, institutional environment, statistical processes and statistical outputs.
Statistics Canada’s first Quality Assurance Framework was published in 1997. It was followed by a second version, in 2002, and a third one in 2016. As the statistical environment is not static, the subsequent versions of Statistics Canada’s quality assurance framework have taken into account the evolution of the organization’s programs, methodology, technology and policies, as well as the progress made internationally in quality management practices.
While this document was originally intended for reference and training purposes, it has become central to developing a quality culture within the organization and in providing a baseline to continuous quality practices improvement. It also contributes to greater transparency and, therefore, reinforces the image of the organization as a credible source of statistics. Finally, it allows Statistics Canada to share ideas and best practices on quality management nationally and internationally.
Another key document in managing quality at Statistics Canada is the Quality Guidelines.23 The first version was published in 1998, followed by new versions in 2003 and 2009. These guidelines are expected to be revised periodically as methodologies and approaches evolve. They are highly valuable in terms of ensuring the use of sound and consistent methodologies throughout the various programs. The focus is on how to assure quality with respect to the effective and appropriate design or redesign of a statistical project or program from inception through to data evaluation, dissemination and documentation. The guidelines provide strategies and tools to minimize the risk of introducing sampling and non-sampling errors in the survey process and to address some of the quality concerns related to the use of administrative data.
In 2009, Statistics Canada developed and adopted a reference model describing the sub-processes in the production of statistical products based on the Generic Statistical Business Process Model (GSBPM) developed by the United Nations Economic Commission for Europe (UNECE), whose membership includes non-European countries, such as Canada and the United States. This process model, which was revised in 2013,24 is now used to establish and communicate quality assurance practices for particular activities in the production of statistical products; it is also used for reference and training. The GSBPM will be applied to the development of future versions of Statistics Canada’s quality guidelines.
It is important to mention that the array of possible quality measures proposed by the quality guidelines are not necessarily applied uniformly to every program: program managers have the responsibility to determine which measures should be applied and to make these choices very explicit. However, most programs should be subject to a periodic, independent and systematic quality review to ensure proper checks and balances.
Most recently, in September 2015, the Organisation for Economic Co-operation and Development (OECD) Council on Good Statistical Practice issued draft recommendations.25
From an OECD perspective, the quality of its statistics and analytical work depends largely on the quality of official statistics produced and transmitted by countries. This draft Recommendation would provide a common reference against which the quality of national statistical systems can be assessed. In addition, the good practices contained in this draft Recommendation would also serve as a reference for the statistical work done by the OECD. Further, the draft Recommendation and its good practices would be referred to in the context of applying the Organization’s Quality Framework and Guidelines for OECD Statistical Activities.
— Draft Recommendation of the Council on Good Statistical Practice (Note by the Secretary-General).
23. STATISTICS CANADA. 2009. 24. UNITED NATIONS ECONOMIC COMMISSION FOR EUROPE (UNECE). 2013. http://www23.statcan.gc.ca/standards-normes/gsbpm-msgpo/2013/index-eng.html (accessed January 18, 2016).25. Organisation for Economic Co-operation and Development (OECD). 2015. Draft Recommendation of the Council on Good Statistical Practice (Note by the Secretary-General). September 30.

Statistics Canada – Catalogue no. 11-634-X54
Compendium of Management Practices for Statistical Organizations From Statistics Canada’s International Statistical Fellowship Program
3. Quality Assessment and Reporting Tools
Quality can be assessed through multiple means: self-assessments, audits, peer reviews or certification processes. This work can be performed by internal or external experts. Assessment processes can lead to the awarding of an official statistics or certification label. The breadth, depth and length of these evaluations can vary depending on the scope. However, the objective of all quality assessment is more or less identical: “the identification of improvement actions or opportunities in processes and products.”26
Quality assessment at Statistics Canada has evolved. There has been a long tradition of assessing statistical quality at Statistics Canada. Through the 1990s and early 2000s, this was done by means of the Quality Assurance Framework. User feedback has also been an important feature in quality assessment at Statistics Canada, directly reflecting the relevance, coherence, accessibility, interpretability and timeliness of statistical products. In 2006, the agency started conducting quality assurance reviews, which were aimed at identifying risks to data quality, and sharing good practices to mitigate those risks. Independent program evaluations conducted by a specialized internal organizational unit that follows a formal protocol to evaluate relevance, quality and efficiency were reinitiated in 2011, following a period during which this function was carried out by program managers as part of their ongoing responsibilities (see Chapter 2.8 – Program Evaluation). Recently, beginning in 2015, the focus has been on strengthening the quality assessment aspect of Program Evaluation, particularly with regard to how the implementation and execution of statistical programs is assessed.
Quality reporting is also an important aspect of quality management. First, product quality indicators shared with data users allow them to determine whether the statistical product fulfills the requirements of their intended use. Second, process and intermediate product indicators can be used by producers and managers to monitor data production and improve quality practices on an ongoing basis. Finally, at the corporate level, quality performance indicators allow an organization to assess how well it is performing on the quality front and to address any risks that might prevent it from successfully fulfilling its mandate.
Statistical agencies communicate about quality, using quality indicators and quality reports. At Statistics Canada, quality indicators and reports are produced by the various programs during data production. While the type of quality indicators produced internally might differ from one program to another, the adoption of the GSBPM and a corporate business architecture will serve to rationalize the development of a common set of quality indicators for data production in the near future.
Quality reporting for both internal and external audiences is standardized in both its structure and content through the Standard on Statistical Metadata. Quality of statistical products is communicated to users in a common format prescribed by the Policy on Informing Users of Data Quality and Methodology (see Chapter 4.3 – Management of, and access to, metadata).
Finally, in order to know how well Statistics Canada performs in terms of quality management, performance measures have been developed. The corporate suite of performance indicators includes several indicators of product and process quality (for the detailed list of performance indicators, refer to Appendix A). A dashboard will allow program managers to view their performance indicators at any time. They can tailor their display to compare performance against targets and to monitor levels. Corporate-level indicators required by Treasury Board Secretariat—the federal department responsible for overseeing corporate reporting and performance measurement— are produced on a quarterly and annual basis.
In the context of decentralized statistical systems, quality assessment processes can also be a tool to improve the quality of statistical products across the system. Box 1.5.2 describes how Colombia’s National Administrative Department of Statistics implemented a quality certification process for all official statistics.
26. UNSD. 2012. p. 51.

Statistics Canada – Catalogue no. 11-634-X 55
Section 1 - Characteristics of an effective national statistical system Chapter 1.5 - Quality Management
Box 1.5.2Implementation of quality assessment of the statistical process in Colombiaby Colombia’s National Administrative Department of Statistics (DANE)
How is quality assessment of the statistical process carried out in Colombia?
The quality assessment of the statistical process is defined as the set of procedures that determines the level of compliance of a statistical operation with the quality requirements established by DANE. These, in turn, are based on the quality attributes defined by the United Nations (UN), the International Monetary Fund (IMF), the Organisation for Economic Co-operation and Development (OECD), and EUROSTAT.
With this initiative, DANE seeks the improvement of its statistical production and various other entities of the Colombian State, and the generation of statistical information that is credible, reliable and transparent to be used by the general public. The methodology for quality assessment establishes tools, processes and instruments for the measurement of conformity with the attributes and quality requirements adopted and adapted by DANE.
The process is structured in four stages: awareness-raising, collection, assessment and certification. It was developed by a Committee of Independent Experts (CEI, its acronym in Spanish), consisting of a subject-matter expert, a statistical expert and an expert in the statistical process, and is supported by DANE. This committee is responsible for verifying compliance with the quality requirements related to relevance, accuracy, punctuality and timeliness, accessibility, interpretability, coherence, integrity and consistency in statistical operations, such as censuses, sampling, and operations based on administrative records. There are three types of certification based on the grade obtained in the assessment process: A, B and C.
Positive effects and impact This initiative has renewed and strengthened the image of DANE as the governing and coordinating body of the National Statistical System (NSS). DANE has identified the main weaknesses in the production process for statistics from NSS information-producing entities, and promoted the implementation of standards and best practices recognized internationally. NSS statistical operations have improved in the following respects:
• Documentation of statistical operations (methodological sheet and general methodology) and of databases (data dictionary, validation and consistency manual, etc.) generated.
• Integrity and consistency of databases (correction of inconsistencies found in the databases of the statistical operations, as well as in fields, registers and variables).
• Timely dissemination of results with respect to the period in which the phenomenon is being measured. Dissemination of historic series begun, and access to microdata provided.
• Emphasis on the needs of major users, and development of new ways to contact them and increase their participation in technical committees.
• The number of NSS entities implementing nomenclatures and classifications has increased.
Lessons learned in the implementation of the quality certification process in ColombiaThe first regulations regarding quality assessment and certification of statistics were issued on November 2, 2006. Since then, DANE has faced a number of challenges, from which it has drawn the following lessons:
• It was not appropriate to have the same CEI to assess statistical operations of different subjects. Consequently, the composition of the CEI was changed to include a subject-matter expert with expertise in the subject of the operation under assessment.
• To encourage producers of statistics to agree to have their statistical processes assessed, it was necessary to strengthen the regulatory framework for statistical quality. With this in mind, in 2011, regulations were issued regarding the reassignment of the “coordination and certification of good practices in the process of statistical production” to DANE, and a regulated assessment process was instituted. These regulations resulted in greater participation by entities in the assessment process for their statistical operations.
• Given that the assessment and certification process is voluntary for entities, a campaign to raise awareness was needed. For this reason, the first stage was included.
• To achieve better quality statistics,it was necessary to follow up on the implementation of the recommendations from the assessment. Hence, a team to monitor the implementation of improvements plans was established.

Statistics Canada – Catalogue no. 11-634-X56
Compendium of Management Practices for Statistical Organizations From Statistics Canada’s International Statistical Fellowship Program
4. Other management frameworks contributing to quality enhancement
Most operations and functions of a statistical agency have an impact on the quality of the agency’s information. The management of quality is therefore an integral part of the management of almost every statistical activity carried out by the agency and an important component of the agency’s management as a whole. Frameworks are used to manage a statistical agency’s quality, human resources, financial resources and overall performance towards achieving its objectives or mandate.
The extent to which a statistical agency can fulfill its mandate and related objectives depends on its ability to optimize its management and operations through organizational efficiency. A significant feature of the management of quality is the balancing of quality and quantity objectives against financial and human resources constraints. These trade-offs, while inevitable in the real world, must be made as explicit as possible so that users can understand the limitations of certain data and why they exist. Ethical standards, fundamental values and principles, and utmost transparency should guide the personnel of a statistical agency in fulfilling their official duties and responsibilities. These principles serve to maintain and enhance public and user confidence in the integrity of the agency. To achieve its mandate and objectives, a statistical agency needs an effective governance and management structure, one that integrates strategic priority setting and decision making and ensures accountability.
At Statistics Canada, quality-management strategies are coherent with the mandate and objectives of management committees for such things as information management, communications and dissemination, administrative data management, collection planning, corporate business architecture and human resources management. Ultimately, this coherence is achieved through strong governance mechanisms, including coordination of all management committees through the Executive Management Board and clear and consistent promotion of corporate priorities and strategies.
Key success factorsOne of the most important factors contributing to successful quality management is having a quality culture. At Statistics Canada, this culture is developed and maintained through various means:
• The acknowledgement that every employee involved in the production and the dissemination of statistics has a role to play in quality assurance and that quality should be an integrated dimension of every management practice;
• The inclusion of the concept of quality in Statistics Canada’s mission statement and mandate. Quality is also considered to be a core value in the corporate management framework;
• Quality-assurance good practices are incorporated into flagship training courses;
• The Quality Guidelines and the Quality Assurance Framework serve as training and reference material;
• Investment proposals (see Chapter 2.2 - Integrated Strategic Planning) are assessed in terms of their contribution to enhancing quality of statistical products or their potential for reducing risks that could impact quality.
Effective quality management requires clear governance, as well as engagement and buy-in from senior management. In fact, success depends not only on strong leadership and clear governance, but also on the professionalism, dedication and diligence of employees. A positive work environment that respects human values and promotes career development and innovation is the atmosphere in which people will exercise their commitment to quality on a daily basis.
The road to consolidation
Consolidation of the quality assessment of the statistical process requires that technical and methodological capacities within DANE’s technical team be enhanced to enable the organization to carry out its new responsibilities, under the National Development Plan. The goal is to improve the assessment model and confirm DANE’s transparency, credibility and capacity in the implementation of this model.

Statistics Canada – Catalogue no. 11-634-X 57
Section 1 - Characteristics of an effective national statistical system Chapter 1.5 - Quality Management
Finally, having a permanent statistical unit (the Quality Secretariat for Statistics Canada) allows the agency to ensure that quality management is considered in all modernization initiatives, and that quality management tools reflect modernized business processes and structure.
ChallengesDeveloping and maintaining credibility is a particular challenge for NSOs. Without the trust of the public and policy makers, statistical products have little value. To achieve this level of trust, quality needs not only to be ensured, but also to be continually improved. One way to do this is through certification from a recognized source, such as the International Organization for Standardization or the IMF, or through satisfying the requirements for OECD membership. Although the stamp of approval is a clear demonstration that certain clearly defined quality measures are in place, the effort required to achieve and maintain the certification can be significant, and the effectiveness (impact on actual quality) is not guaranteed. The quality improvement principles of Lean27 and Six Sigma28 were developed for application in manufacturing; however, they are a good fit with the core business of producing official statistics, and some NSOs have adopted them, in whole or in part.
It is often a challenge for people to recognize what quality assurance practices they can incorporate into their work activities. It might take a culture shift to get people to think in terms of validating their deliverables, producing diagnostics to demonstrate the effectiveness of their efforts, following a checklist of tasks, or signing off that a particular activity has been completed. These seemingly simple checks represent the most basic examples of quality assurance.
Another challenge, still on the theme of staff resistance, relates to quality assessment and reporting. There is often a misconception that an outcome of quality assessment will be some form of punishment for poor performance. Nothing could be further from the truth. The commitment to quality needs to permeate from senior management all the way down to the most junior and inexperienced staff members, and the message needs to be consistent: the goal of quality assessment is to maintain and improve the quality of processes and products, not to manage people.
Another challenge is getting and sustaining buy-in, particularly at the middle-management level. The commitment of middle managers to quality management is absolutely essential because they have the authority to supervise and direct the activities of their staff and the opportunity to lead by example. If quality assurance activities are reduced when budgets are cut or timelines shortened, the implicit message to staff is that quality assurance is not a priority. It is a challenge for the entire organization to resist the temptation to cut corners on quality when times get tough.
Finally, compliance is a challenge as there is a growing body of policies, directives, guidelines and best practices, many of them related to quality. Program managers sometimes need time and resources to adopt new practices or migrate to new tools and concepts. Compliance challenges should be considered in the resource allocation process and supported by a team of quality experts if necessary.
Looking aheadThe organization participates in an international working group to develop quality indicators for all phases of the GSBPM. The agency is reaching a state of indicator overload. To make the most effective use of indicators, there is a need to organize and streamline them and to present them in a format that facilitates comprehension and appropriate reaction. This should be automated to the extent possible.
Considerable resources have been dedicated towards maximizing the use of administrative data, in particular, of Big Data. Frameworks have been developed guiding the agency’s practices for acquiring, exploiting and maintaining large data holdings. Although the quality principles are the same as for survey data, the challenges, expectations and uses are quite different. It is therefore important to ensure that quality assurance practices for alternative data sources be relevant and effective.
27. Cardiff University. 2015. The Five Principles of Lean Thinking. http://www.cardiff.ac.uk/lean/principles/ (accessed January 19, 2016).28. Wikipedia. 2015. Lean Six Sigma. http://en.wikipedia.org/wiki/Lean_Six_Sigma (accessed January 19, 2016).

Statistics Canada – Catalogue no. 11-634-X58
Compendium of Management Practices for Statistical Organizations From Statistics Canada’s International Statistical Fellowship Program
Appendix A: Examples of corporate performance indicators
Quality dimension Performance Indicator
Punctuality and timeliness Number of data products released as scheduled
Timeliness of release
Accuracy Post-release corrections for reasons of accuracy
Response rate
Mean absolute revision
Level of accuracy achieved
Interpretability Number of pages viewed in the sources and methods documents available on the Statistics Canada website
Up-to-date metadata in the Integrated Metadatabase
User guide documentation up-to-date
Coherence Compliance with standard variables and classifications
Accessibility Number of visits to the Statistics Canada website
Number of visits to The Daily
Number of analytical and data products accessed
Number of media citations
Number of professional citations
Percent of clients who receive the information that they requested
Percent of website visitors that found the information they were looking for
Number of users engaged in Statistics Canada’s social media
Number of postsecondary institutions and governmental and other organizations receiving access to microdata files
Number of cycles of confidential microdata files and public-use microdata files available to Canadian postsecondary institutions, research data centres and other institutions
Number of active deemed-employee researcher contracts
Real-time Remote Data Access—Number of account-submissions

Statistics Canada – Catalogue no. 11-634-X 59
Section 1 - Characteristics of an effective national statistical system Chapter 1.5 - Quality Management
Quality dimension Performance Indicator
Cost efficiency Annual operational costs
Efficiency index
Percent of respondents that were offered an e-questionnaire
Index of response burden hours
Business surveys using tax/administrative data
Volume of cost-recovery contracts conducted by Statistics Canada— Statistical surveys and related surveys
Value of cost-recovery contracts conducted by Statistics Canada—Statistical surveys and related surveys
Value of cost-recovery contracts conducted by Statistics Canada—Custom requests and workshops
Relevance to measure the effectiveness of statistical infrastructure programs
Percent of programs using methodology services
Percent of programs using statistical infrastructure services
Percent of programs using operational statistical services
Number of programs that undergo a review of their methodology and/or statistical infrastructure
Percent of programs reviewed to which the methodology and/or statistical infrastructure provided approved solutions
Proportion of proposed solutions adopted by the programs
Percent of Collection and Operations Services Agreements (COSA) components that are met (main estimates)
Percent of Collection and Operations Services Agreements (COSA) components that are met (cost-recovery)
Percent of investments in the Continuity and Quality Maintenance Investment Plan implemented as planned

Statistics Canada – Catalogue no. 11-634-X60
Compendium of Management Practices for Statistical Organizations From Statistics Canada’s International Statistical Fellowship Program
BibliographyBRODEUR, DOHERTY, DUFOUR, LUSSIER, MAYDA, McAULEY, MÉNARD,RIDGEWAY, ROYCE AND SMITH. 2009. Statistics Canada. Report of the Task Force on Corporate Business Architecture.
CARDIFF UNIVERSITY. 2015. Lean Principles. Retrieved from http://www.cardiff.ac.uk/lean/principles and Wikipedia. 2015. Lean Six Sigma. Retrieved from http://en.wikipedia.org/wiki/Lean_Six_Sigma
HAHN, Bill, et Hans SKALLE (2013). Applying Lean, Six Sigma, BPM, and SOA to Drive Business Results, An IBM Redguide publication (document en anglais seulement) . Consulted on March 11 2016 and retrieved from http://www.redbooks.ibm.com/Redbooks.nsf/RedbookAbstracts/redp4447.html?OpenDocument
ORGANISATION FOR ECONOMIC COOPERATION AND DEVELOPMENT (OECS). September 30, 2015. Draft Recommendation of the Council on Good Statistical Practice. (Note by the Secretary-General).
UNITED NATIONS ECONOMIC COMMISSION FOR EUROPE (UNECE). 2013. Generic Statistical Business Process Model. Consulted on the 11th of March 2016, and retrieved from http://www23.statcan.gc.ca/standards-normes/gsbpm-msgpo/2013/index-eng.html
UNITED NATIONS STATISTICAL DIVISION (UNSD). 2012. Guidelines for the template for a generic national quality assurance framework (NQAF). Consulted on the 11th of March 2016, and retrieved from http://unstats.un.org/unsd/dnss/QualityNQAF/nqaf.aspx

Statistics Canada – Catalogue no. 11-634-X 61
Section 1 - Characteristics of an effective national statistical system Chapter 1.6 - Partnerships on a cost recovery basis
Chapter 1.6 - Partnerships on a cost-recovery basis
ContextIdeally, national statistical offices (NSOs) may have the authority to provide professional services on a cost-recovery basis. This means that the client covers all costs of the service requested.
The rationale behind these cost-recovery services is that they contribute to enhancing the overall quality of the NSOs’ statistical programs. In fact, without the ability to respond quickly to other organizations’ needs, the statistical agency could be at risk of missing opportunities to increase the relevance of its activities. In other words, cost recovery of statistical services provides an opportunity to fill data gaps that could remain unfilled if the statistical agency does not receive directly the budgets necessary to address them, or if existing surveys cannot respond to information needs. Cost-recovery projects are a way to increase relevance and answer data users’ needs by providing them with high-quality information.
Cost-recovery projects allow the NSO to support a more integrated statistical system by avoiding duplication and offering the opportunity to occupy a space that would, otherwise, be spread across the National Statistical System (NSS) or outside of it, thereby allowing the NSO to have an implicit, enhanced way to coordinate the NSS.
It is important, however, that cost-recovery projects be congruent with the mandate and ongoing activities of the statistical agency. They should be seen as activities that the agency might carry out of its own volition if it had the financial resources to do so.
Cost-recovery activities can, and often should, extend to the analytical phase, provided the analysis remains within the policy-neutral boundaries. The client can thus benefit from the statistical agency’s analytical expertise and from its ability to draw from its many other information holdings to enrich the analysis and make it more relevant to the issues being addressed by the client.
Another important benefit of providing services on a cost-recovery basis is the increase in staff’s capability, expertise, and depth of knowledge. Working on cost-recovery projects allows the organization to develop and/or enhance customized and innovative solutions to its heretofore unmet or new data needs. The staff assigned to these projects is expected to be very innovative, flexible, client-oriented and responsive, and to be focused on an inclusive approach that integrates methodology, collection tools, project management and other statistical production areas. This expertise can then be applied throughout the organization.
When Statistics Canada delivers custom survey and analysis services to Canadian organizations on a cost-recovery basis, the costs charged to the client must cover all resources expended on the client’s project. Such custom services are not funded by the budget that Parliament allocates annually to Statistics Canada; therefore, clients must cover the direct and indirect costs of doing the work. Direct costs include salary costs for highly skilled staff, non-salary costs such as translation, travel, training, professional services, supplies and other costs. Indirect costs include corporate administrative services and the marginal costs associated with the fact that Statistics Canada’s statistical and administrative infrastructure is larger than it would be if it supported only the activities funded from the agency’s budget. The matrix management and the associated analytical cost accounting approaches used by Statistics Canada are very useful for estimating and properly measuring the cost of this additional infrastructure, as they are for tracking the direct costs of cost-recovery activities. For more details, please refer to the Chapter 2.3 – Financial Management. Typically, the agency provides the service first and then recovers those costs once the service has been provided. For very large and multi-year projects, progress billing can be employed.
All cost-recovery projects are not systematically approved and carried out by Statistics Canada. Projects must satisfy several criteria:
• The project must be compatible with Statistics Canada’s mandate, which is to collect, compile, abstract and publish statistical information relating to the commercial, industrial, financial, social, economic and general condition of Canadians;
• The project must be statistical in nature;
• The project must not compromise Statistics Canada’s reputation;
• The project must not harm the agency’s relationships with respondents;

Statistics Canada – Catalogue no. 11-634-X62
Compendium of Management Practices for Statistical Organizations From Statistics Canada’s International Statistical Fellowship Program
• The required capacity and resources are available and ready so that this work can be completed within the set deadlines; and
• The results, or outputs, are treated in the same way as those of regular Statistics Canada information products. They become part of the public domain and are made available to all Canadians, under the same confidentiality principles and rules.
In Canada, partners for cost-recovery projects are mostly federal departments, provinces or municipalities, while very few projects are commissioned by the private sector.
Clients are not required to use the services of Statistics Canada. Rather, they choose to do so. There are three main reasons for this. First, Statistics Canada’s brand is a valuable attribute; it gives the output of these projects the character of “official” statistics, and carries with it the agency’s reputation for quality, impartiality and credibility. Second, all statistics produced by Statistics Canada must be placed in the public domain. This is to provide a sound mechanism to ensure that results are widely known and available through the agency’s well-developed dissemination infrastructure. Third, some of these cost-recovery projects are on a very large scale and require extensive national survey-taking infrastructure, conditions that give the agency a competitive edge.
As illustrated in figure 1.6.1, the demand for cost-recovery services remains high, even though the total amount of recoverable revenue has declined since 2011-12, further to government pressure on federal expenditures. For the last four years, cost-recovery revenues have been in the magnitude of CAN$84 million to CAN$104 million. This represents about 15% to 17% of the total expenditures of the organization.
Recoverable revenue ($) Recoverable revenue as a % of total Statistics Canada expenditures
Figure 1.6.1 Cost-recovery revenues as a total amount and as a percentage of total Statistics Canada expenditures, Statistics Canada, 2011-12 to 2015-16
2011-12 2012-13 2013-14 2014-15 2015-16
18%
16%
14%
12%
10%
8%
6%
4%
2%
0%
150,000,000.00
140,000,000.00
130,000,000.00
120,000,000.00
110,000,000.00
100,000,000.00
90,000,000.00
80,000,000.00
70,000,000.00
60,000,000.00
The demand for cost-recovery services relates mainly to social, health and education data (55% of total demand), economic data (22% of total demand), and statistical infrastructure (such as support work performed under international cooperation initiatives, special analysis requests, custom tabulations from business register data) (7% of total demand).

Statistics Canada – Catalogue no. 11-634-X 63
Section 1 - Characteristics of an effective national statistical system Chapter 1.6 - Partnerships on a cost recovery basis
Strategies, mechanisms and toolsThis section describes the strategies and tools used by Statistics Canada for cost-recovery projects.
1. Services and tools offered as cost-recovery services
1.1 Types of cost-recovery services offeredStatistics Canada is often called upon to
• design, build and deliver statistical products that integrate a variety of data sources to support research, decision making and policies;
• conceptualize, design, plan and conduct new surveys, from beginning to end;
• perform microdata linkages and extract integrated custom datasets for research projects;
• produce custom data tabulations;
• carry out research and conduct special studies;
• develop new measurement frameworks and indicators to support program development; implementation, monitoring, and performance assessment; and,
• supply technical assistance.
1.2 Specific statistical expertise Statistics Canada is known to provide quality survey methods and results because it can capitalize on the following advantages:
• large and methodologically sound samples that can be drawn from scientifically proven frames;
• collection and processing practices;
• sampling and estimation;
• explicit methods to measure, and inform on, accuracy (this includes reliability indicators determined by statistical methodology experts);
• sound and documented methods;
• data analysis;
• policy-relevant socio-economic, macroeconomic, demographic and health modeling;
• data integration.
2. Key entry points
These cost-recovery services are managed through the following main entry points:
• Statistical Information Services (SIS) are located in Statistics Canada’s regional offices. They handle custom tabulations (approximately 900 Census tables and over 1,000 custom tabulations from other sources) on an annual basis. In terms of volume, SIS receive the most requests.
• The Special Survey Division provides customized and innovative solutions for ad hoc or new data needs, for both internal and external users in the social field. It also collects, processes and disseminates social statistics and develops new data files through record linkage to data in the social domain. The division also manages the most significant portion of cost-recovery services in terms of the value of contracts.
• The Centre for Special Business Projects offers a wide range of services with regard to business data: from integrated business microdata, database extractions tailored to specific research needs, and data analysis, to custom business surveys. The Centre is the point of entry to Statistics Canada’s expertise on business data.

Statistics Canada – Catalogue no. 11-634-X64
Compendium of Management Practices for Statistical Organizations From Statistics Canada’s International Statistical Fellowship Program
• The Statistical Consultation Group (SCG) offers statistical consultation, project management services, and statistical training to federal departments and agencies, provincial and territorial departments, and public institutions and administrations.
3. Key management skills29
To conduct an effective cost-recovery service, the following conditions must prevail:
3.1 Legal and statistical frameworksFirst and foremost, a national statistical agency should know when to accept a request for its services, and when to say “no” to any project for which there is no legal justification, to support it, or that is not aligned with the agency’s mandate (see paragraph in the context of specifying conditions for Statistics Canada to carry out a cost-recovery service).
In addition, the statistical organization should avoid being involved in, for example, public opinion or marketing polling, where the statistical office may be perceived as judging the appeal of policies or of specific goods or services.
3.2 Project managementStatistics Canada has made great efforts to improve its project management capacity and the rigour and consistency with which it is applied. It has developed a Project Management Framework, where the stages of a project are identified, as are the gatekeeping (approval) steps required to move a project from one stage to the next, as well as all necessary documentation associated with each step. For more details, please refer to Chapter 2.4 - Project Management Framework.
Essentially, the Project Management Framework at Statistics Canada is designed to ensure that projects remain: (1) in scope (meaning that they do not deviate from the planned objectives); (2) on budget; and (3) on time.
At Statistics Canada, the more complicated projects, such as custom surveys, usually have a steering committee or project committee made up of a team with members from all interested parties in the organization. Typically, this would involve a subject-matter or survey manager lead, with participants from methodology, data collection, and information technology, and from any other service required to ensure the success of the project.
3.3 Financial management An important element of any cost-recovery project within a statistical office is the financial management of the service. It is important to develop realistic cost estimates by ensuring that all relevant costs can be directly associated with the project—salary costs (for employees and contractors, including benefits) and non-salary costs (travel, special equipment, etc.). All other costs not directly associated with the project are considered indirect costs (meeting space, information technology and communication devices, general costs such as heating and cooling of the building, and electricity). Cost-allocation formulae have been developed as part of the agency’s cost accounting systems.
Before moving to the execution phase of the project, a promise of service and payment must be made between the parties involved. In most cases, the cost-recovery service is to be managed with another federal department or a provincial government department. In such cases, the promise of payment comes in the form of a “Letter of Agreement” between the two parties. A letter of agreement is a document that describes the service being provided. It has five sections:
• a cover sheet, with signature boxes;
• a description of work to be provided, including specifications of quality and timelines;
• the terms of payment;
29. BOWLBY G. 2015

Statistics Canada – Catalogue no. 11-634-X 65
Section 1 - Characteristics of an effective national statistical system Chapter 1.6 - Partnerships on a cost recovery basis
• the general terms and conditions;
• the information necessary to make the financial transfer.
As with any project, it is important to establish mechanisms for financial tracking, to ensure that funds are spent within the planned period and for the intended purpose.
A form of entrepreneurial risk-taking is also necessary. It is rarely possible, at the beginning of a fiscal year, to predict exactly the volume of cost-recovery work that will occur during the year. The agency must make an educated guess with respect to the capacity it wants to have in place to respond to new demands. Not having such a capacity could lead to having to refuse important work and to clients seeking other means to satisfy their needs in the future. Monitoring is performed throughout the fiscal year and actual results and forecasts are presented monthly to the Chief Financial Officer for review. The Executive Management Board, presided by the Chief Statistician, is also briefed monthly on results and projections.
3.4 Management of human resourcesThe management of human resources for cost-recovery projects may differ from that used for regular statistical operations, since certain skills may be emphasized. In addition to having in-depth statistical expertise, one must have strong client-relations skills. Because such projects require regular interaction with clients, diplomacy and tact are needed: to listen, to understand a client’s needs, and to explain how statistical concepts and possibilities are, or are not, relevant to a client’s needs.
In addition, it is important to determine the number and profile of the project staff, differentiating between temporary and permanent staff, as well as between internal staff and consultants. All these human-resources factors require flexibility in the approach for each project and with respect to work arrangements. Staff retention and effectiveness of training are key to the success of the project.
3.5 Client managementCost-recovery services are client-oriented. In that context, it is very important to understand the needs and requirements for the project and to be able to establish and maintain a strong relationship with the client. A good way of achieving this is to have the client clearly articulate the analytical or decision-making purpose that is at the source of the project. The statistical agency’s staff can then focus the discussion on the extent to which these needs can or cannot be adequately met, given the real-life opportunities and constraints of the statistical project envisaged.
3.6 Quality management The quality aspect of cost-recovery projects must be managed as rigorously as it is for the organization’s regular programs. Accountability and transparency must be of the highest order. Please refer to Chapter 1.5 – Managing quality for a full review of quality management requirements.
4. Marketing and outreach activities help promote cost-recovery projects
The agency aims to continually increase awareness of its various services to stakeholders and data users. The strategy involves using various communications and outreach tools to not only provide information, but also engage Canadians in wanting to see the Statistics Canada’s expertise used to its full potential. The following briefly explains the means through which the agency accomplishes this:
• Dedicated section of Statistics Canada’s website has been developed to provide relevant and exhaustive information to data users interested in partnering with Statistics Canada to carry out cost-recovery surveys. The website includes an overview of the services offered and clarification on what to expect with respect to custom surveys, as well as the core advantages of conducting a survey with Statistics Canada.
• Regular engagement activities take place by actively participating in data users’ consultations, conferences, and trade shows.

Statistics Canada – Catalogue no. 11-634-X66
Compendium of Management Practices for Statistical Organizations From Statistics Canada’s International Statistical Fellowship Program
• Conducting learning and innovation activities by organizing workshops and seminars is part of the mandate of Statistical Information Services (SIS). SIS is composed of consulting-analysts who are located in Statistics Canada’s three regional offices; they provide advice, make recommendations, and act as a direct link between the agency’s subject-matter specialists, researchers and technical experts. As an example, in 2014/2015, more than 50 workshops and 50 webinars were held, allowing data users to participate in training activities.
• An active presence in international activities and various successes in technical-assistance projects have contributed to the increased demand for Statistics Canada’s technical expertise internationally.
• Statistics Canada’s reputation for excellence built around quality data and services delivery, also helped to attract cost-recovery projects.
Key success factorsIn Statistics Canada’s experience, the success of a cost-recovery program relies heavily on the following:
1. the strength of the agency’s expertise and statistical infrastructure, as this is usually the comparative advantage of statistical offices over other data producers;
2. the delivery of client-oriented services, where listening and responding to clients’ needs should be seen as a strategic objective; and,
3. strong practices in human resources, and financial, project and quality management practices, which allow the organization to have the proper flexibility to respond to the demand for its services, while minimizing the associated risks.
Carrying out a cost-recovery program serves as an excellent training ground for the staff and managers of statistical organizations, and gives these organizations a “leading edge” in developing and applying new concepts and methodologies. The variety of subject matter, the client needs served, and the methodologies used, result in acquiring in-depth knowledge and expertise and in developing a high degree of staff capability.
Challenges and looking aheadThe attributes of high-quality outputs that a national statistical agency offers often come at relatively greater cost, and require longer timeframes than private-sector offerings which are often producing lower quality results. It behooves the agency, however, to continually strive to improve the speed at which it can deliver high-quality results, and to actively promote the advantages clients will obtain by making use of the agency’s services to address their information needs.
In Canada, there is another limiting factor regarding cost-recovery activities: an organization is not permitted to bid on projects for which the federal government or other potential clients request submissions from potential service providers. This is why marketing and outreach are key to increasing awareness and interest.
Finally, Statistics Canada must continually invest in staff capacity, its infrastructure and organizational flexibility to sustain its ability to adequately respond to demand for high-quality cost-recovery services benefitting the national statistical system.

Statistics Canada – Catalogue no. 11-634-X 67
Section 1 - Characteristics of an effective national statistical system Chapter 1.6 - Partnerships on a cost recovery basis
BibliographyBowlby, G. (2015). Professional Services at Statistics Canada; Best-practice guide to the Ugandan Bureau of Statistics. Ottawa.
Statistics Canada. Custom services at Statistics Canada. Consulted on the 11th of March 2016 and retrieved from http://www.statcan.gc.ca/eng/cs/index

Statistics Canada – Catalogue no. 11-634-X68
Compendium of Management Practices for Statistical Organizations From Statistics Canada’s International Statistical Fellowship Program

Statistics Canada – Catalogue no. 11-634-X 69
Section 2 - Core management practices Introduction
Section 2 – Core management practices
IntroductionAfter reviewing the characteristics, or fundamentals, of an effective national statistical system, it is worthwhile to now look at the core management practices that a statistical agency should implement and develop. These practices help to optimize its operations and use of its resources in a positive climate of integrity, transparency and appropriate use of organizational funds.
The core management functions discussed are organizational structure and matrix management; integrated strategic planning; financial management; project management; human resources planning and management; internal communications; information management; program evaluation; and, lastly, internal audit. Each of these functions is analyzed and enriched by examples of practices and strategies used by Statistics Canada.
Chapter 2.1, on organizational structure and matrix management, highlights the importance for a statistical agency to have a flexible, efficient organizational structure in order to optimally distribute programs and allocate resources. In this respect, Statistics Canada’s examples illustrate the possible program organization and matrix management strategies for a centralized statistical system.
Chapter 2.2 deals with integrated strategic planning and its importance in maintaining relevant, quality statistical data at a reasonable cost. Strategies and tools used by a statistical agency, such as the stages of the integrated planning process and governance, are presented and supported by examples from Statistics Canada.
Chapter 2.3 provides an overview of financial management, including the basic principles of such management for a statistical agency, the financial cycle and governance.
Chapter 2.4 describes the importance of the project management approach and the frameworks used by Statistics Canada for this purpose.
Chapter 2.5 focuses on the importance of good human resources planning and management in a statistical agency. It recaps the basic principles and strategies used by Statistics Canada for each human resources function, including planning, staffing, training and development, talent and career management, and maintaining a positive work environment.
Chapter 2.6, which deals with internal communications, addresses the importance of informing, consulting and engaging employees. Examples include mechanisms and tools that Statistics Canada uses.
Chapter 2.7 deals with information management and presents strategies for ensuring optimal and secure management of information at the lowest cost.
Finally, chapters 2.8 and 2.9 describe program evaluation and internal audit. They reinforce the necessity to implement independent and integrated functions in the interest of the statistical agency and in accordance with good management practices by establishing solid, reliable governance mechanisms and operational frameworks.

Statistics Canada – Catalogue no. 11-634-X70
Compendium of Management Practices for Statistical Organizations From Statistics Canada’s International Statistical Fellowship Program

Statistics Canada – Catalogue no. 11-634-X 71
Section 2 - Core management practices Chapter 2.1 - Organizational structure and matrix management
Chapter 2.1 – Organizational structure and matrix management
ContextIn order for a statistical agency to operate effectively, its various management functions must be organized in a coherent and interdependent way. According to the United Nations Handbook of Statistical Organization, Third Edition: The Operation and Organization of a Statistical Agency, “the notion of organization invokes the idea of hierarchy. In order to be effective over time, organizations must clearly and unambiguously assign responsibilities. Indeed, the very creation of an organization chart - with the limits that it imposes on each set of functions and responsibilities - suggests both interdependence and exclusivity.”1
As a result, staff in statistical agencies are usually organized by function, but also work in cross-functional teams in order to produce key information about the country’s economy, society, and environment. In practice, most statistical offices have been organized according to some combination of function and subject-matter structures.
At Statistics Canada, this is achieved through matrix management to optimize organizational effectiveness. Matrix management creates two parallel structures: a vertical functional structure and a horizontal program structure. This dual structure is appropriate when many interactions between functions are necessary. It facilitates the resource allocation process and helps to identify the risk of time delays or budgetary overruns.
In the Canadian context, the matrix structure also satisfies two important needs: the requirement to report to Parliament from a program perspective, and the necessity to monitor activities from both functional and program perspectives for operational reasons. The functional side depicts how the organization is set up physically, as described by the organizational structure, and by how resources are allocated. The program side depicts the products and services produced by Statistics Canada and provides the basis for how the agency justifies its total budget to central government agencies and to the Parliament of Canada.
This chapter describes the organizational structure of Statistics Canada, and explains how matrix management is used to maximize the resource capacity and enhance responsiveness to change.
Strategies and toolsThis section describes three important management strategies and tools used by Statistics Canada to ensure efficient organizational structure and matrix management:
• Program Alignment Architecture
• Functional organization chart
• Matrix management
1. Program Alignment Architecture
Although statistical agencies are usually structured according to a combination of subject-matter expertise and function, the delivery of strategic outcomes requires the creation of project teams (usually cross-functional). The Strategic Outcomes and the Program Alignment Architecture (PAA) depict Statistics Canada’s major programs and explain how these programs work together to achieve results for Canadians through strategic outcomes, programs, and sub-programs.
The strategic outcomes are the long-term and enduring benefits to Canadians linked to the mandate, vision and core functions of Statistics Canada. Statistics Canada has two strategic outcomes. First, Canadians have access to timely, relevant and high-quality statistical information on Canada’s changing economy and society for informed debate, research and decision making on social and economic issues. Secondly, specific client needs2 for high-quality and timely statistical services are met.
1. UNITED NATIONS. 20032. This activity produces high-quality cost-recovered statistical services that meet the needs of specific federal and provincial institutions and other clients. Projects are grouped by subject
matter: Economic and Environmental Statistics, Socio-economic Statistics, the Censuses, Statistical Infrastructure, and Internal Services.
Statistics Canada – Catalogue no. 11-634-X72
Compendium of Management Practices for Statistical Organizations From Statistics Canada’s International Statistical Fellowship Program
The PAA is a structured inventory of all Statistics Canada programs, where programs are arranged in a hierarchical manner to depict the logical relationship between each program and the strategic outcome to which it contributes. A program is a group of related resource inputs and activities that are managed for the purpose of meeting specific needs and achieving intended results, and that are treated as a budgetary unit. It is used for reporting to Parliament through the Departmental Performance Report and the Report on Plans and Priorities.
The PAA is also the initial document used to establish the Management, Resources and Results Structure (MRRS), a common government-wide approach to the identification of programs and to the collection, management, and reporting of financial and non-financial information relative to those programs. The establishment of a MRRS in each department is a key element of the Expenditure Management System because it provides a common framework within which financial and non-financial information is linked across government.
2. Functional organization chart
The statistical organization is led by a Chief Statistician, who in Canada, is appointed by the Governor in Council3 to be the deputy head of the organization. In Canada, the Minister of Innovation, Science and Economic Development is also the Minister responsible for Statistics Canada. The Chief Statistician has full exercise of delegated authority from the Minister based on an annual budget and a Report on Plans and Priorities approved by Parliament (see Chapter 2.3 – Financial management). The Chief Statistician is to advise on matters pertaining to the statistical program, supervise the administration of the Statistics Act, and control the operation and staff of the statistical office.
An up-to-date organization chart provides a clear picture of the relationship between organizational units of the agency. As per the organization chart (Figure 2.1.1), Statistics Canada is organized along the main functions of a statistical agency:
• Subject-matter expertise for:
− Economics Statistics that include Macroeconomic Accounts, Industry Statistics, Economy-wide Statistics (Consumer Price Index), and Agriculture, Energy, Environment and Transportation Statistics.
− Social Statistics include Social and Aboriginal, Demography, Health, Education, Labour, Income, Tourism and Justice.
• Collection and dissemination (Census, Operations and Communications)
• Statistical infrastructure (Analytical Studies, Methodology and Statistical Infrastructure)
• Internal functions (Corporate Services, Audit and Evaluation)
3. Governor-in-Council appointments are made by the Governor General, on the advice of the Queen’s Privy Council for Canada (i.e., the Cabinet).

Statistics Canada – Catalogue no. 11-634-X 73
Section 2 - Core management practices Chapter 2.1 - Organizational structure and matrix management
Figure 2.1.1Statistics Canada’s organization chart
As of August 2015, Statistics Canada had approximately 5,300 public service employees, most of them (88%) employed on a full-time full-year permanent basis. About four out of ten employees are subject-matter professionals and technicians (economics, sociology, business administration, geography, etc.), grouped in functional centres of expertise within the organization. Operational and administrative personnel make up the next-largest group of employees (35%). About 15% are computer scientists, dedicated mostly to the development and operation of statistical production systems—basic information technology infrastructure and services are provided by a government-wide agency (Shared Services Canada) that offers services to the entire federal government—and another 5.5% are methodologists (mathematical statisticians). The remainder of staff is comprised of accountants and human resources specialists (3%) and management (1.5%). Just slightly over half of all employees are women.
Statistics Canada is also a separate employer (Statistical Survey Operations) for some 1,800 employees dedicated to data collection operations. They work out of regional collection centres to conduct telephone interviews or from their homes as field interviewers (see Chapter 3.5 – Collection planning and management).
2.1 Subject-matter expertise (Economic Statistics and Social, Health, and Labour Statistics)Subject-matter expertise is shared by two fields: the Economic Statistics Field and the Social, Health and Labour Statistics Field. The mandate of the Economic Statistics Field is to create a trusted, relevant and comprehensive source of information on the entire spectrum of Canada’s economy to inform public debate on economic issues; support economic policy development, implementation and evaluation; and guide business decision making. This field is the primary source of information for developing the country’s fiscal and monetary policies, and for studying the economic evolution of Canadian industries and regions. The Social, Health and Labour Statistics Field provides integrated information and relevant analysis on the social and socioeconomic characteristics of individuals, families, and households, as well as on the major factors that affect their well-being. This information is used to inform public debate on socio-economic issues; support the development, implementation and evaluation of social policy, and; guide public and private decision making. It is the primary source for assessing the impact of changing economic circumstances on Canadians.

Statistics Canada – Catalogue no. 11-634-X74
Compendium of Management Practices for Statistical Organizations From Statistics Canada’s International Statistical Fellowship Program
Economic statistics are obtained through a series of business surveys and administrative sources, as well as, in the case of agriculture statistics, through the Census of Agriculture. Outputs include monthly and annual measures of Gross Domestic Product (GDP), the Consumer Price Index (CPI), current indicators of retail and wholesale trade, Canada’s merchandise export and import statistics, estimates of agricultural income and expenditures, transportation statistics, and statistics relevant to the analysis of relationships between human activity and the environment, in Canada.
Social statistics support statistical requirements specified by legislation or regulations in the areas of labour, immigration and employment equity. The program also provides information, analysis and measures relating to publicly funded facilities, agencies, and systems designed to meet the socio-economic and physical needs of Canadians; information on the characteristics of the individual Canadians and families they serve (population estimates, statistics on sub-populations (such as immigrants), statistics on official languages); and information on the outcomes of the services they provide, such as justice, health and education. This field also includes the Census Subject Matter Secretariat, which is responsible for the management of all subject-matter input into the Census Program.
2.2 Census, Operations and CommunicationsThe collection, communications and dissemination functions are managed within the Census, Operations and Communications Field. The Census of Population4 is Statistics Canada’s largest data collection, public communications and dissemination program. Significant economies of scale are realized by leveraging the same collection and dissemination infrastructure for census and survey-taking, in accordance with the agency’s Corporate Business Architecture (see Chapter 3.1 – Corporate Business Architecture5).
The Collection and Regional Services Branch and the Operations Branch provide a single contact point for access to data collection services for Statistics Canada’s statistical programs (business and household surveys and census collection). They provide support to data collection activities, including data capture, coding, editing, interviewer hiring and training, and providing advice to clients regarding statistical products. These branches plan overall survey collection and coordinate capacity and capabilities across the collection infrastructure; they also conduct survey collection research to continually improve quality and timeliness and reduce respondent burden and costs. Data collection operations are managed through a network of regional offices across three regions of Canada—Eastern, Central, and Western and Northern Territories. For details on collection management, refer to Chapter 3.5 – Collection planning and management.
The production of Statistics Canada’s catalogued publications, the management of the agency’s online databases, and the dissemination of Statistics Canada’s official release vehicle The Daily form part of statistical infrastructure managed within the Census, Operations and Communications Field through the Dissemination Division and the Communications Branch. The Communications Branch also ensures the effective communication and dissemination of Statistics Canada information to the Canadian public, provides strategic communications advice to senior management on evolving and/or potentially controversial issues, and ensures that an appropriate, trained spokesperson is designated. The Communications Branch also fosters a positive image of Statistics Canada as the country’s national statistical agency and plays a key role in maintaining relationships with data users and fostering effective internal communications across the agency. For more details on the communications function, refer to Chapter 4.2 – External communications and outreach.
2.3 Analytical Studies, Methodology and Statistical Infrastructure The Analytical Studies, Methodology and Statistical Infrastructure Field comprises activities and services administered to support a strong statistical agency. These include the development of sound statistical methodology; the development of, and adherence to, standardized concepts and classifications (including geographic concepts); the development and provision of information about the agency’s surveys and statistical programs; the development and maintenance of registers of enterprises and addresses for statistical purposes;
4. The Census provides statistical information, analyses, and services that measure changes in the Canadian population, in demographic characteristics, and in the agricultural sector.5. For the same reason, selected internal services, including procurement, contract and facilities services, are also managed by the Census, Operations and Communications Field.

Statistics Canada – Catalogue no. 11-634-X 75
Section 2 - Core management practices Chapter 2.1 - Organizational structure and matrix management
and the provision of advice with respect to the Statistics Act and data-sharing agreements. Research and development activities related to statistical methodology, data collection, and operational activities are also conducted.
Specifically, the Analysis Branch is responsible for the coordination of analytical activities, including in-depth analysis of economic, health and social issues integrating multiple sources of data. The Methodology Branch is charged with the development of business, social and household survey statistical methods. The Statistical Infrastructure Branch is charged with developing statistical classification and infrastructure to support statistical standards, corporate statistical metadata, and corporate information management; acquiring and pre-processing administrative data; and developing and maintaining a central business register, a geographic frame and an address register.
2.4 Internal functionsAt Statistics Canada, internal functions include the Office of the Chief Statistician, the Corporate Services Field, and Internal Audit and Evaluation.
The Office of the Chief Statistician manages communications between the agency and the government via the Office of the Minister responsible for Statistics Canada—the Minister of Innovation, Science and Economic Development—including coordination of parliamentary and cabinet affairs, and other reporting activities (e.g., Report on Plans and Priorities, Departmental Investment Plan, Corporate Business Plan).
The Corporate Services Field supports the needs of programs and other corporate obligations, including the management of finance, Human Resources (HR) and Informatics (IT) services. The Finance Branch provides leadership and support to ensure that Statistics Canada is well managed, and is accountable for the prudent stewardship of public funds, the safeguarding of public assets, and the effective, efficient and economical use of public resources. As well, the Finance Branch plays a leadership role in the Integrated Strategic Planning Process and the execution of the Departmental Project Management Framework. The Human Resources Branch is responsible for assisting management in recruiting, deploying, developing, and retaining the staff necessary to achieve the agency’s mandate and meet its organizational priorities. The Informatics Branch is responsible for developing and maintaining software applications and generalized systems in support of collection, statistical, administrative and dissemination programs, developing and recommending corporate standards and methods for application development, and providing enterprise desktop and specialized services, including hardware provisioning, licences management, hosting, and database administration. For more details about how these services function, refer to Chapter 2.3 – Financial management, Chapter 2.5 – Human resources planning and management, and Chapter 3.2 – Modernization of Information Technology and Informatics Services.
An independent Internal Audit and Evaluation function reports directly to the Chief Statistician as part of a results-based management culture. This function enhances the credibility of the statistical organization by systematically conducting objective audits and evaluations. The agency has developed a five-year evaluation plan, which includes the full evaluation coverage of its direct program spending over a five-year cycle. The Departmental Audit Committee, chaired by an appointed member, supports, oversees and monitors the audit and evaluation function as well as management accountabilities arising from evaluations and evaluation-related products. More details are provided in Chapter 2.8 – Program evaluation and Chapter 2.9 – Internal audit.
3. Matrix management
As evidenced by the preceding description of its organization chart, Statistics Canada is organized by functional centres of expertise (IT systems development, data collection and processing, methodology, subject-matter experts, etc.). The creation of cross-functional project/program teams as outlined in the PAA is achieved through matrix management. As stated in the introduction, this structure is appropriate when many interactions between functions are necessary or desirable, for the purpose of reducing or eliminating delays or budgetary overruns. The matrix organizational structure overlays both the PAA structure and the functional structure, and derives benefits from both designs.
Matrix management is the interface of an organization, both vertically and horizontally. Traditional organizations have a hierarchical management structure, where the structure of the functional units reflects the division of work. Under matrix management, the responsibilities for departmental routine work (vertically structured) and for new

Statistics Canada – Catalogue no. 11-634-X76
Compendium of Management Practices for Statistical Organizations From Statistics Canada’s International Statistical Fellowship Program
initiatives and product requirements (horizontally structured) are shared, and managed jointly, by the horizontal and vertical structures. The work required to be performed on a project/program that falls within the purview of a functional organizational department is under the influence of functional and program management. The balancing of horizontal and vertical structures creates a matrix or grid whereby resources can be allocated quickly from project to project in order to meet changing and competing work priorities. Thus, the organization tends to look like a series of vertical department columns crossed over by a series of horizontal project/program rows.
An example of a typical matrix management structure is shown in Figure 2.1.2.
Figure 2.1.2 Example of a Matrix Model Interface A Network of InterfacesThe matrix model is a network of interfaces between teams and the functional elements of an organization. In the following example, there are twelve interfaces.
Functional Manager
Functional Manager
Functional Manager
Project Manager
Project Manager
Project Manager
Project Manager
General Manager
1
4
7 98
5 6
32
10 11 12
Within a matrix operation, employees are assigned to specific project/program teams for a specified period of time. They also have a permanent functional unit, typically known as their “home” division, where they continue to reside during the project/program life cycle. Although the program areas are allocated the total budget for their program, they transfer budget to functional areas for these to carry out activities with respect to the project/program. Salaries are paid from the budget of the functional unit (see Chapter 2.3 – Financial management). As a result, employees often report to two or more supervisors: the project/program manager and the functional or line manager. The project/program manager is responsible for meeting the objectives and deliverables (see Chapter 2.4 – Project Management Framework). However, it is the functional or line manager who maintains supervisory authority and ensures that the standardized and rigorous expertise is being provided to support the project/programs.
Matrix management allows the organization to benefit from the synergy created by a community of employees with specialized knowledge while providing the flexibility to assign these experts according to the needs of a particular project/program and the priorities of Statistics Canada (refer to text box 2.1.3 – Advantages of matrix

Statistics Canada – Catalogue no. 11-634-X 77
Section 2 - Core management practices Chapter 2.1 - Organizational structure and matrix management
management). The central management of pools of experts leads to optimization of resource utilization. Teams can be formed quickly for a specified period of time, thereby creating flexibility and allowing the organization to take advantage of opportunities. Matrix management also provides opportunities for employee development through exposure to a variety of projects and programs. It is a dynamic management structure, which breaks down “silos” of functional expertise and fosters the sharing of knowledge and information in an interdisciplinary work environment. Matrix management also allows for true analytical accounting from a financial management perspective (see Chapter 2.3 – Financial Management).
Box 2.1.3 Advantages of matrix management
Matrix management provides the following advantages:
• reduces the number of organizational layers;
• achieves both a vertical (functional) focus and a horizontal (process, product, program) focus;
• facilitates a transparent and clear allocation of resources in the context of the departmental planning system;
• makes it easier to identify the financial implications, as well as the other resource implications, of adding, reducing or eliminating certain activities;
• makes more effective and efficient use of resources;
• eliminates unnecessary work, and strengthens value-added activities; and,
• improves accountability for, and reporting of, results internally and externally.
However, matrix management requires from the organization the ability to develop an appropriate governance structure that valued functional project management and a corporate culture that encourages and fosters teamwork and flexibility.
Key success factorsA statistical office organized around statistical functions and working within a matrix management framework is well-positioned to adapt to changes in a timely way. However, the corporate culture must be conducive to this approach. It is essential to foster a climate of collaboration, innovativeness and tolerance of risk and failure, managed as part of the organization’s Risk Management Process. Such a culture can never be taken for granted. It requires constant reinforcement by the agency’s top leadership and understanding and buy-in by all staff.
Key success factors include a strong central governance model. The leadership of Statistics Canada is provided by the Executive Management Board (EMB). The EMB is chaired by the Chief Statistician and composed of the Assistant Chief Statisticians of all functional areas and the Chief Statistician’s Chief of Staff, reflecting a matrix management model at the highest level of governance. This governance model is based on the objective that significant corporate issues be reviewed at the highest appropriate level. Final decisions are rendered by the Chief Statistician on the advice of EMB members. The EMB provides strategic direction for the organization and acts as the corporate decision-making body. Centralized decision-making ensures that all key decisions are optimal for the corporation. This includes ongoing discussions and decisions about organizational structure and the appointment of individuals to senior management positions.
The importance of governance also applies to the matrix management framework. Decisions about the composition of project/program teams and the allocation of expert resources are made in the best interest of the organization by the appropriate level of governance. Corporate interests must take precedence over locally optimal resource allocations, as provided in the agency’s Corporate Business Architecture (see Chapter 3.1 – Corporate Business Architecture).
Strategic planning must also be reflected in the human resources hiring strategy to ensure that the right people with the right skills are available at the right time (see Chapter 2.5 – Human resources planning and management). Matrix management encourages flexibility of employees and provides opportunities to develop new skills. This

Statistics Canada – Catalogue no. 11-634-X78
Compendium of Management Practices for Statistical Organizations From Statistics Canada’s International Statistical Fellowship Program
organizational culture also includes a system of internal rotations and special corporate assignments. A corporate assignment allows an employee to temporarily work in another functional unit by matching the employee’s career and learning objectives to available assignments.
The use of a Departmental Project Management Framework (see Chapter 2.4 – Project Management Framework) contributes to governance and management rigor by facilitating decision making, communication and coordination across all projects in a portfolio and thus results in a more efficient use of corporate resources in a matrix management framework.
Challenges and next stepsAs mentioned in the United Nations Handbook of Statistical Organization, Third Edition: The Operation and Organization of a Statistical Agency, the cost and benefits of major changes to organizational structure must be fully considered. This includes a thorough evaluation of the status quo and of the organization’s ability to achieve its strategic objectives. The timing of changes, the way changes are implemented, and the impact of the transition must be carefully planned. At Statistics Canada, the centralization of expertise (collection, methodology, IT, etc.) happened over time and as part of the strategic planning process (see Chapter 2.2 – Integrated Strategic Planning).
A key challenge facing statistical organizations is the imperative to remain relevant. The economy and the society that national statistical offices (NSOs) attempt to measure are changing at an unprecedented pace. NSOs must constantly monitor the operating environment and proactively make provisions for the development of new statistical programs and the decommissioning of others in order to respond to the highest-priority information needs. This is the main objective of the strategic planning process, which is informed by an environmental scan, including external and internal drivers and integrated risk management. The external environmental analysis touches on political, economic, technological and social-demographics analysis, and documents the needs of stakeholders.
The flexibility offered by matrix management framework allows NSOs to respond in a timely way to these and other challenges. However, challenges related to the use of a matrix management framework remain. These include the governance of work on both the functional and the program/project axes; and the development of a corporate culture that values teamwork and flexibility.

Statistics Canada – Catalogue no. 11-634-X 79
Section 2 - Core management practices Chapter 2.1 - Organizational structure and matrix management
BibliographyGovernment of Canada (2016). Shared Services Canada. Consulted on the 31st of March 2016 and retrieved from http://www.ssc-spc.gc.ca/index-eng.html
Government of Canada (2005). Statistics Act. L.R.C 1985, c. S-19. Amended by 1988, c. 65, s. 146; 1990, c. 45, s. 54; 1992, c. 1, ss. 130, 131; 2005, c. 31; 2005, c. 38. Consulted on 11th of March 2016 and retrieved from http://laws-lois.justice.gc.ca/eng/acts/S-19/FullText.html
Government of Canada (2015). Report on Plans and Priorities 2015-2016. Consulted on the 31st of March 2016 and retrieved from http://www.statcan.gc.ca/eng/about/rpp/2015-2016/index
Statistics Canada (2016). Departmental Performance Report 2014-2015. Consulted on the 31st of March 2016 and retrieved from http://www.statcan.gc.ca/eng/about/dpr/2014-2015/index
Statistics Canada (2015). Strategic outcomes and program alignment architecture. Consulted on the 31st of March 2016 and retrieved from http://www.statcan.gc.ca/eng/about/sopaa/index
United Nations (2005). Handbook of Statistical Organization, Third Edition. The Operation and Organization of a Statistical Agency. Studies in Methods, Series F, no. 88. New York. Consulted on 11th of March 2016 and retrieved from http://unstats.un.org/unsd/publication/SeriesF/SeriesF_88E.pdf

Statistics Canada – Catalogue no. 11-634-X80
Compendium of Management Practices for Statistical Organizations From Statistics Canada’s International Statistical Fellowship Program

Statistics Canada – Catalogue no. 11-634-X 81
Section 2 - Core management practices Chapter 2.2 - Integrated Strategic Planning
Chapter 2.2 – Integrated Strategic Planning
Context Strategic planning describes how an organization intends to operate in order to fulfill its mission6 and mandate, today, and into the future.
Planning strategically helps statistical organizations deliver on their core functions, which are to provide
• information that is relevant to the current, highest-priority information needs
• information that is of high quality
• information that is produced at the lowest possible cost.
The economy and society that statistical organizations aim to measure are changing at an unprecedented pace. Consequently, in order to remain relevant, the strategic planning process must make provisions for the development of new statistical programs and the decommissioning of others so that they are able to respond to the highest-priority information needs.
Before determining how to organize and implement a national statistical system or create a national statistical office (NSO), it is important to have a well-established strategy. In many countries, this takes the form of a national strategy for the development of statistics. Other countries have their own versions of a strategy. In Canada, the strategy is established on the basis of annual official reports to Parliament called Report on Plans and Priorities and the agency’s Corporate Business Plan. These official documents provide information about Statistics Canada’s strategic orientations and directions. In order for the agency to organize its operations in an efficient and consistent way, it has developed an Integrated Strategic Planning Process (ISPP).
The ISPP is a key mechanism used at Statistics Canada to maintain quality and relevance. In order for the agency’s planning to be effective, the horizons of the planning process cover a ten-year time period and include all factors that influence success. The agency must ensure that, in a steady state, sufficient funds are available annually for the routine maintenance and periodic redesign of all corporate processes, systems, applications and infrastructure, as well as for the implementation of new classifications and standards and for survey redesigns. This ensures the continuity and quality—and, to some degree, the relevance—of the current statistical program.
The philosophy that underlies Statistics Canada’s strategic planning7 is one of fostering innovation and making sound investments. Innovation and investments lead to improved operations and systems—and, consequently, increased efficiency. Being and remaining efficient is the best way for the agency to ensure its financial viability and to proactively implement a strategic plan for maintaining the quality of existing statistical programs, improving existing programs, and creating new programs—that is, for ensuring continuity and relevance (see Chapter 3.1 – Corporate Business Architecture).
Operating at the highest level of efficiency is critical to Statistics Canada’s ability to carry out its statistical program and maintain the necessary level of innovation, and should be a permanent priority. For this reason, the Corporate Business Architecture (CBA) is at the heart of the ISPP. CBA investment proposals have the highest priority
6. Statistics Canada’s mission is “Serving Canada with high-quality statistical information that matters.” Under the Statistics Act, Statistics Canada’s mandate is to collect, compile, analyze, abstract and publish statistical information relating to the commercial, industrial, financial, social, economic and general activities and condition of the people of Canada.
7. The base budget of Statistics Canada is fixed; it is allocated on an annual basis by Parliament. See the chapter on financial management.
A long-term strategic plan— A must-do for an organization
• A 10-year strategic plan records the decisions the organization has made with respect to its strategy for the future.
• It sets forth the organization’s mission, vision, values and objectives, and states how the organization will achieve them.
• It summarizes the environmental and resource assumptions underlying the strategic choices and identifies the risks associated with the choices.
• The strategic plan should contain the rationales, analyses and background information supporting those decisions.
• The strategic plan should help the organization to remain focused on long-term strategic priorities, in light of at times frequently changing shorter-term priorities.

Statistics Canada – Catalogue no. 11-634-X82
Compendium of Management Practices for Statistical Organizations From Statistics Canada’s International Statistical Fellowship Program
because they improve the efficiency of operations. This efficiency generates the funds to maintain the quality of programs, as outlined in the long-term strategic plan.8 Once the quality of existing programs has been assured, new initiatives for innovating and for exploring strategic opportunities can also be funded.
Strategies and tools This section provides an overview of the governance structure at Statistics Canada and of the agency’s ISPP. It describes the key elements of the six-step process and the key success factors associated with each step, and illustrates how these are supported by the governance structure.
Strategic planning is integral to Statistics Canada’s Corporate Management Framework (shown in Figure 2.2.1.). To produce relevant, high-quality and timely information, sound planning and priority-setting are essential. Integrated strategic planning allows the organization to achieve maximum efficiency, manage operational risks, and align programs with the evolving data needs of the country.
Figure 2.2.1 Statistics Canada’s Corporate Management Framework
1. Governance
The leadership of Statistics Canada’s overall governance and management system is provided by the Executive Management Board (EMB). The EMB is comprised of the Chief Statistician, who chairs the committee, as well as the Assistant Chief Statisticians (ACSs), who head the various functional areas of the agency. The EMB provides strategic direction for the organization and acts as the corporate decision-making body. Centralized decision making ensures that strategic planning investments are optimal for the corporation. This governance model is based on the objective that significant corporate issues be reviewed at the highest appropriate level; final decisions are rendered by the Chief Statistician, on the advice of the EMB.
The annual ISPP is governed by the Senior Management Review Board, composed of the EMB, the Chief Audit Executive, and all Directors General. Including all senior managers in strategic planning ensures that cross-cutting issues are considered when senior management makes final decisions about resource allocations.
8. At Statistics Canada, the long-term strategic plan is called the Continuity and Quality Maintenance Investment Plan (CQMIP).

Statistics Canada – Catalogue no. 11-634-X 83
Section 2 - Core management practices Chapter 2.2 - Integrated Strategic Planning
As shown in Figure 2.2.2, a bottom-up process that follows the strategic direction allows investment proposals developed by divisional program managers to be reviewed for possible consideration by the Field Planning Board (FPB)—a senior management committee chaired by the ACS for each field or functional area of the organization.
Figure 2.2.2 Governance of the Integrated Strategic Planning Process at Statistics Canada
INTEGRATED STRATEGIC PLANNING 5
BOX 2.2.2 – Governance of the Integrated Strategic Planning Process at Statistics Canada
Where significant interdependencies exist, FPBs work together to ensure all key decision factors have been
taken into consideration. Each FPB is also responsible for ensuring that business proposals are realistic in
terms of deliverables, timelines and costs, and that service areas have reviewed costs for their services.
Each FPB ensures that business proposals for its field are integrated and aligned with the corporate strategic
priorities, and recommends proposals to the Senior Management Review Board.
Business proposals to improve the efficiency, robustness or responsiveness of the agency's business
architecture are also vetted by the Corporate Business Architecture Management Committee. The proposals
pertain to aspects of the business architecture, which includes the following:
Senior Management Review Board
Field Planning Boards
Branch Management Teams
Executive Management Board
Corporate Planning Committee Corporate Management Committees
Divisional Program Managers
Corporate Business Architecture Management Committee
Where significant interdependencies exist, FPBs work together to ensure all key decision factors have been taken into consideration. Each FPB is also responsible for ensuring that business proposals are realistic in terms of deliverables, timelines and costs, and that service areas have reviewed costs for their services. Each FPB ensures that business proposals for its field are integrated and aligned with the corporate strategic priorities, and recommends proposals to the Senior Management Review Board.
Business proposals to improve the efficiency, robustness or responsiveness of the agency’s business architecture are also vetted by the Corporate Business Architecture Management Committee. The proposals pertain to aspects of the business architecture, which includes the following:
• business processes
• enabling computer systems and hardware
• business rules
• organizational structure

Statistics Canada – Catalogue no. 11-634-X84
Compendium of Management Practices for Statistical Organizations From Statistics Canada’s International Statistical Fellowship Program
The CBA places the emphasis on solutions that maximize the use of corporate tools and systems—an approach whose aim is to make the most of investments, reduce risks, and enable the agency to generate sufficient efficiencies to fund the punctual investments necessary for maintaining the quality of programs.
2. The six-step ISPP process
At Statistics Canada, the ISPP has been defined as an annual six-step process beginning with a review of the agency’s strategic planning priorities and culminating with resource allocation for approved projects to begin in the new fiscal year. This is followed by regular monitoring and reporting of progress against plans.
Three key decision-making points in this process are identified with an asterisk (*) below: deciding which areas require strategic investment; deciding which specific investment ideas warrant a formal business case; and deciding which business cases will receive investment funding.
1. Set the strategic planning direction.*
2. Update the 10-year Continuity and Quality Maintenance Investment Plan (CQMIP), and prepare business proposals for the next fiscal year.*
3. Develop business cases.
4. Decide which business cases will receive investment funding.*
5. Communicate plans and priorities.
6. Monitor performance.
Through the ISPP, the agency integrates sound management practices, such as risk management, investment planning and project management, into the planning process. The ISPP includes an environmental scan, financial, human, and information technology resource management, as well as tools for project management and performance monitoring. The integration of financial, human resources (HR) and information technology (IT) planning into a unified process helps ensure that investment decisions are realistic and are able to support ongoing statistical program needs, the punctual investments required for continuity and quality maintenance, and the development of new programs and initiatives. As well, under the ISPP, managers are equipped with a standard set of tools for project planning, implementation and reporting9 (see Chapter 2.4 – Project Management Framework). This process establishes a heightened level of accountability both within Statistics Canada and in response to requirements from central government agencies. It includes feeding results into the official annual planning and reporting documents: Reports on Plans and Priorities and Departmental Performance Reports.
2.1 Step 1: Set the strategic planning direction.One year before the beginning of the fiscal year,10 the EMB sets the strategic planning direction for the upcoming ISPP cycle. The EMB determines which areas require new initiatives, and requests proposals. This is the first key decision-making point.
BOX 2.2.1 – STEP 1The agency’s strategic planning direction is informed by an environmental scan—including a review of external and internal drivers, and an integrated risk management exercise. The external environmental analysis involves conducting political, economic, technological, and social demographics analysis and documenting the needs of stakeholders. See details in Box 2.2.1..
The agency’s corporate priorities are relatively stable over time. As the NSO for Canada, Statistics Canada is legislated by the Statistics Act to produce statistics that help Canadians better understand their country—its population, resources, economy, society and culture, and to serve this function for the whole of Canada.
Some corporate priorities (such as conducting the Census and the Labour Force Survey) are legislative obligations in Canada. Other priorities evolve over time to meet current information needs. At the annual Strategic Planning Direction Setting Session in April, corporate priorities are revisited on the basis of an environmental scan and an
9. At Statistics Canada, this is called the Departmental Project Management Framework (DPMF).10. Each fiscal year begins on April 1 and ends on March 31. Therefore, Step 1 begins one year before the beginning of the next fiscal year.
BOX 2.2.1 STEP 1
KEY ELEMENTS
− Review of corporate priorities with discussion organized around relevance, trust, access and stewardship
− Environmental scan— government, stakeholders
− Review of Corporate Risk Profile
OUTPUT
Strategic planning direction for the upcoming ISPP cycle, and strategic direction and priorities for the coming year as set by the Corporate Planning Committee.

Statistics Canada – Catalogue no. 11-634-X 85
Section 2 - Core management practices Chapter 2.2 - Integrated Strategic Planning
The CBA places the emphasis on solutions that maximize the use of corporate tools and systems—an approach whose aim is to make the most of investments, reduce risks, and enable the agency to generate sufficient efficiencies to fund the punctual investments necessary for maintaining the quality of programs.
2. The six-step ISPP process
At Statistics Canada, the ISPP has been defined as an annual six-step process beginning with a review of the agency’s strategic planning priorities and culminating with resource allocation for approved projects to begin in the new fiscal year. This is followed by regular monitoring and reporting of progress against plans.
Three key decision-making points in this process are identified with an asterisk (*) below: deciding which areas require strategic investment; deciding which specific investment ideas warrant a formal business case; and deciding which business cases will receive investment funding.
1. Set the strategic planning direction.*
2. Update the 10-year Continuity and Quality Maintenance Investment Plan (CQMIP), and prepare business proposals for the next fiscal year.*
3. Develop business cases.
4. Decide which business cases will receive investment funding.*
5. Communicate plans and priorities.
6. Monitor performance.
Through the ISPP, the agency integrates sound management practices, such as risk management, investment planning and project management, into the planning process. The ISPP includes an environmental scan, financial, human, and information technology resource management, as well as tools for project management and performance monitoring. The integration of financial, human resources (HR) and information technology (IT) planning into a unified process helps ensure that investment decisions are realistic and are able to support ongoing statistical program needs, the punctual investments required for continuity and quality maintenance, and the development of new programs and initiatives. As well, under the ISPP, managers are equipped with a standard set of tools for project planning, implementation and reporting9 (see Chapter 2.4 – Project Management Framework). This process establishes a heightened level of accountability both within Statistics Canada and in response to requirements from central government agencies. It includes feeding results into the official annual planning and reporting documents: Reports on Plans and Priorities and Departmental Performance Reports.
2.1 Step 1: Set the strategic planning direction.One year before the beginning of the fiscal year,10 the EMB sets the strategic planning direction for the upcoming ISPP cycle. The EMB determines which areas require new initiatives, and requests proposals. This is the first key decision-making point.
BOX 2.2.1 – STEP 1The agency’s strategic planning direction is informed by an environmental scan—including a review of external and internal drivers, and an integrated risk management exercise. The external environmental analysis involves conducting political, economic, technological, and social demographics analysis and documenting the needs of stakeholders. See details in Box 2.2.1..
The agency’s corporate priorities are relatively stable over time. As the NSO for Canada, Statistics Canada is legislated by the Statistics Act to produce statistics that help Canadians better understand their country—its population, resources, economy, society and culture, and to serve this function for the whole of Canada.
Some corporate priorities (such as conducting the Census and the Labour Force Survey) are legislative obligations in Canada. Other priorities evolve over time to meet current information needs. At the annual Strategic Planning Direction Setting Session in April, corporate priorities are revisited on the basis of an environmental scan and an
9. At Statistics Canada, this is called the Departmental Project Management Framework (DPMF).10. Each fiscal year begins on April 1 and ends on March 31. Therefore, Step 1 begins one year before the beginning of the next fiscal year.
BOX 2.2.1 STEP 1
KEY ELEMENTS
− Review of corporate priorities with discussion organized around relevance, trust, access and stewardship
− Environmental scan— government, stakeholders
− Review of Corporate Risk Profile
OUTPUT
Strategic planning direction for the upcoming ISPP cycle, and strategic direction and priorities for the coming year as set by the Corporate Planning Committee.
analysis of the Corporate Risk Profile, for the purpose of ensuring relevance to public policy development and maintaining the agency’s ability to meet the highest information needs of Canadians and Canadian institutions.
Although risk is actively managed throughout the year via the priorities being addressed by managers and corporate management committees, a coordinated effort to update the Risk Register is completed annually. This allows the organization to identify where strategic investment is required in order to mitigate risks to an acceptable level. Risks are categorized according to the four elements at the heart of the Corporate Management Framework: relevance, trust, access and stewardship. The result is an updated Corporate Risk Profile that focuses the ISPP discussions around mitigating important corporate risks.
In its capacity as an agency of the federal government, Statistics Canada regularly monitors the information needs and the priorities of federal departments. An extensive stakeholder network and participation in various national and international organizations help the agency keep informed of emerging issues and remain at the forefront of innovation in statistical measurement (see Chapter 1.4 – Understanding User’s Needs and Maintaining Relationships).
Engagement with stakeholders involves managers at all levels and provides information on evolving user needs, program weaknesses and information gaps. Combined with the results of client feedback surveys, internal program evaluations, and ad hoc external program reviews and audits, this input reflects the priority needs of Canadians and of their governing institutions, as well as those of businesses and other groups.
2.2 Step 2: Update the 10-year Continuity and Quality Maintenance Investment Plan, and prepare business proposals for the next fiscal year
From May to June, managers update their ten-year CQMIP and develop high-level investment business proposals, paying particular attention to proposals that would begin in the next fiscal year. Those proposals are reviewed and recommended by FPBs. See details in Box 2.2.2.
In June, the third month of the fiscal year, at the Strategic Planning Conference, the Senior Management Review Board decides which business proposals are supported for further consideration. This is the second key decision-making point.
BOX 2.2.2 – STEP 2 A key element in the ISPP process is having a reasonable forecast of all investments required to preserve the quality of information programs and ensure the continuity of operations over time. To this end, the CQMIP is an essential tool. This step includes projects that require punctual investment to produce and maintain quality and, to some degree, relevance.
Much of the agency’s work is cyclical in nature. Many of the investments necessary to ensure continuity and quality of programs are known in advance over a long planning horizon. For example, the Labour Force Survey redesign occurs approximately every ten years. Such instances of known investments constitute the CQMIP.
BOX 2.2.2STEP 2
KEY ELEMENTS
− Update the Continuity and Quality Maintenance Investment Plan
− Business proposals to identify and integrate the elements to be considered in the planning process
− Preliminary analysis of financial, human resources and information technology availabilities
− Prioritization of business proposals by field planning boards
OUTPUT
Business proposals are developed for further consideration.

Statistics Canada – Catalogue no. 11-634-X86
Compendium of Management Practices for Statistical Organizations From Statistics Canada’s International Statistical Fellowship Program
The ISPP is the mechanism by which program areas request additional funding from the agency to carry out new or cyclical projects that could not be covered by their regular base funding. Specifically, the CQMIP covers a ten-year planning horizon and identifies to the agency what draws will be made on the corporate financial availabilities.
The CQMIP is an effective tool to manage the timing of all strategic investments so that significant expenditures are planned well in advance, while total investment is relatively stable from year to year. This allows the agency to project long-term financial, IT and HR needs against planned financial availabilities. The ever greening of the CQMIP also represents a streamlining of the planning process. The strategic investments of the organization are understood long in advance and require only annual adjustments at the margin for new or emerging needs.
Ongoing program funding is treated separately from the punctual investment “project” funding required to maintain quality, ensure relevance, or generate efficiencies. However, both are integrated into a single ten-year view of the organization’s overall financial picture.
At this step in the planning process, all projects included in the CQMIP are at Stage 1 of the Departmental Project Management Framework (DPMF): idea generation. The idea or proposed initiative that addresses a business problem or opportunity is identified at this stage. This first attempt at describing the problem, need or opportunity, and at roughly estimating the project’s scope, duration and cost, is carried out at the highest appropriate level. This step provides the necessary information to determine the priority of the project in the context of the agency’s strategic direction.
Step 3: Develop business casesFrom July to October, business cases and detailed cost estimates are developed for the investment proposals for the next fiscal year that were supported for further consideration at the Strategic Planning Conference. See details in Box 2.2.3.
BOX 2.2.3 – STEP 3The development of business cases that integrate all the necessary information for planning decisions is essential to the success of this stage of the ISPP. At this step in the planning process, all projects that will start in the next fiscal year must produce a business case. This consists of a description of the project, the project’s contribution to corporate objectives, an options analysis, cost estimates and resource requirements, a risk assessment including mitigation strategies, clearly documented planning assumptions, and business benefits / outcomes. The business case includes all information necessary to describe the rationale for undertaking the project.
The FPB performs a challenge function to ensure that the costs and benefits of projects and the relationship of business cases to corporate and program priorities are fully examined. This also includes an assessment of interdependencies between projects and across fields with respect to project deliverables and human and IT resource allocation. It is essential that all service areas be consulted at this stage of the process and that required approvals be obtained for planned activities.
First priority is given to the CBA projects. These investment proposals have the highest priority because they improve the
efficiency of operations. This generates the corporate financial availabilities to maintain programs, as outlined in the CQMIP. Once the quality of existing programs has been assured, new initiatives to innovate and to explore strategic opportunities can also be funded. Thus, investment proposals are grouped into three broad categories to reflect different aspects of strategic planning: finding new and better ways to do business, maintaining the quality of existing programs, and enhancing and developing new programs.
BOX 2.2.3STEP 3
KEY ELEMENTS
− Refine the Continuity and Quality Maintenance Investment Plan
− Develop business cases with options
− Consult service areas (data collection, methodology, information technology, human resources)
− Assess interdependencies between investments and across the agency
− Prioritization and approval of business cases by Field Planning Boards (FPB)
OUTPUT
Recommended investments business cases.

Statistics Canada – Catalogue no. 11-634-X 87
Section 2 - Core management practices Chapter 2.2 - Integrated Strategic Planning
The key tool used to ensure rigour of project assessments is the Departmental Project Management Framework (DPMF) (see Chapter 2.4 – Project Management Framework). The process for developing new programs and for conducting substantial redesigns of existing programs must ensure that the project management of these initiatives is separated from responsibility for ongoing programs, that projects are properly resourced and funded, and that program design conforms to the approved business and systems architecture.
The goal is to collect information once at the beginning of the planning process and re-use it for many purposes. The DPMF templates gather information about funding sources, HR and IT needs, risks, etc., in a standardized manner. Information reported at the beginning of the planning cycle is used to manage projects and monitor performance.
Step 4: Decide which business cases will receive investment funding In November, the Senior Management Review Board determines which investments will be funded, as well as how the human resource and IT strategy will be implemented to ensure that necessary resources are available for delivery of the investment projects. This is the third key decision-making point.
This step begins with a high-level update on the strategic planning direction, including a final integrated analysis of financial, HR and IT availabilities. This incorporates all investment business cases and the impact if all investments were approved, as well as an analysis of options and recommendations. See details in Box 2.2.4.
BOX 2.2.4 – STEP 4The detailed analysis of HR and IT availabilities is only as robust as the underlying business cases (created during the previous step of the ISPP). These must be completed prior the Senior Management Review Conference and must consider the overall resource demand relative to supply at the agency level. This explicitly takes into account ongoing program requirements as well as new investment proposals.
Business cases are presented to the Senior Management Review Committee, chaired by the Chief Statistician, for peer review and challenge. This ensures that the overall context and the impacts on the agency are taken into consideration. It also includes an examination of the relative contribution to strategic objectives and the prioritization of investments in light of available resources.
The Senior Management Review Committee then makes decisions about the approval or rejection of all business cases, including investments included in the CQMIP. The integrated analysis of financial, HR and IT availabilities over a ten-year horizon ensures
that the approval of projects, many of which constitute multi-year investments, are made in context of future operational requirements.
Step 5: Communicate plans and prioritiesIn the three months before the beginning of the new fiscal year (December to March), managers finalize and initiate project plans, while budgets are allocated by the beginning of the upcoming fiscal year. Plans and priorities are communicated both externally, in annual reports required by Parliament, and internally, to the agency’s employees and managers. See details in Box 2.2.5.
BOX 2.2.4STEP 4
KEY ELEMENTS
− Final integrated analysis of financial, HR and IT availabilities
− Presentations of business cases
− Peer review and challenge function
− Prioritization versus available resources
OUTPUT
Final integrated strategic planning decisions.
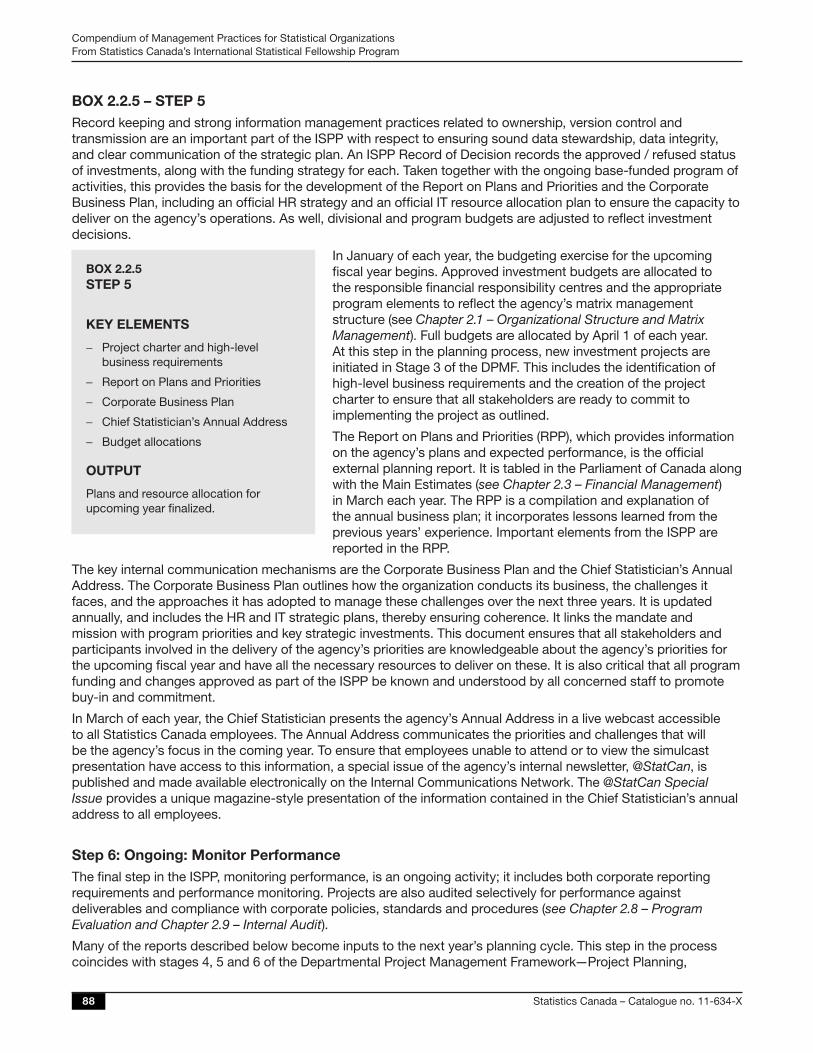
Statistics Canada – Catalogue no. 11-634-X88
Compendium of Management Practices for Statistical Organizations From Statistics Canada’s International Statistical Fellowship Program
BOX 2.2.5 – STEP 5Record keeping and strong information management practices related to ownership, version control and transmission are an important part of the ISPP with respect to ensuring sound data stewardship, data integrity, and clear communication of the strategic plan. An ISPP Record of Decision records the approved / refused status of investments, along with the funding strategy for each. Taken together with the ongoing base-funded program of activities, this provides the basis for the development of the Report on Plans and Priorities and the Corporate Business Plan, including an official HR strategy and an official IT resource allocation plan to ensure the capacity to deliver on the agency’s operations. As well, divisional and program budgets are adjusted to reflect investment decisions.
In January of each year, the budgeting exercise for the upcoming fiscal year begins. Approved investment budgets are allocated to the responsible financial responsibility centres and the appropriate program elements to reflect the agency’s matrix management structure (see Chapter 2.1 – Organizational Structure and Matrix Management). Full budgets are allocated by April 1 of each year. At this step in the planning process, new investment projects are initiated in Stage 3 of the DPMF. This includes the identification of high-level business requirements and the creation of the project charter to ensure that all stakeholders are ready to commit to implementing the project as outlined.
The Report on Plans and Priorities (RPP), which provides information on the agency’s plans and expected performance, is the official external planning report. It is tabled in the Parliament of Canada along with the Main Estimates (see Chapter 2.3 – Financial Management) in March each year. The RPP is a compilation and explanation of the annual business plan; it incorporates lessons learned from the previous years’ experience. Important elements from the ISPP are reported in the RPP.
The key internal communication mechanisms are the Corporate Business Plan and the Chief Statistician’s Annual Address. The Corporate Business Plan outlines how the organization conducts its business, the challenges it faces, and the approaches it has adopted to manage these challenges over the next three years. It is updated annually, and includes the HR and IT strategic plans, thereby ensuring coherence. It links the mandate and mission with program priorities and key strategic investments. This document ensures that all stakeholders and participants involved in the delivery of the agency’s priorities are knowledgeable about the agency’s priorities for the upcoming fiscal year and have all the necessary resources to deliver on these. It is also critical that all program funding and changes approved as part of the ISPP be known and understood by all concerned staff to promote buy-in and commitment.
In March of each year, the Chief Statistician presents the agency’s Annual Address in a live webcast accessible to all Statistics Canada employees. The Annual Address communicates the priorities and challenges that will be the agency’s focus in the coming year. To ensure that employees unable to attend or to view the simulcast presentation have access to this information, a special issue of the agency’s internal newsletter, @StatCan, is published and made available electronically on the Internal Communications Network. The @StatCan Special Issue provides a unique magazine-style presentation of the information contained in the Chief Statistician’s annual address to all employees.
Step 6: Ongoing: Monitor PerformanceThe final step in the ISPP, monitoring performance, is an ongoing activity; it includes both corporate reporting requirements and performance monitoring. Projects are also audited selectively for performance against deliverables and compliance with corporate policies, standards and procedures (see Chapter 2.8 – Program Evaluation and Chapter 2.9 – Internal Audit).
Many of the reports described below become inputs to the next year’s planning cycle. This step in the process coincides with stages 4, 5 and 6 of the Departmental Project Management Framework—Project Planning,
BOX 2.2.5STEP 5
KEY ELEMENTS
− Project charter and high-level business requirements
− Report on Plans and Priorities
− Corporate Business Plan
− Chief Statistician’s Annual Address
− Budget allocations
OUTPUT
Plans and resource allocation for upcoming year finalized.

Statistics Canada – Catalogue no. 11-634-X 89
Section 2 - Core management practices Chapter 2.2 - Integrated Strategic Planning
Execution and Close-Out. At this step, one must decide how the project will be structured and executed. This includes establishing the baselines of scope, schedule and cost; and, subsequently, executing, completing, tracking and measuring the project activities over the life of the project as defined at the planning stage. The project’s final close-out report summarizes accomplishments, and measures the project against criteria set out in the charter to determine its success. See details in Box 2.2.8.
Internal reportingMonthly financial reports are prepared and presented to managers, who use them to forecast the year-end position of their divisions, to assess the financial risks to their programs, and to review changes in operations and personnel. They are signed as an attestation of completeness and accuracy. Monthly financial reports also provide timely information to the Chief Statistician in his role as Accounting Officer. This information is aggregated at the field level and supports the production of a monthly report reviewed by the Chief Financial Officer (CFO). Corporate Finance consolidates the financial information, and highlights any changes from the previous month. All changes to the financial profile of programs and projects must be approved by the EMB.
BOX 2.2.6 – STEP 6Financial reporting is also a key element of the Executive Project Dashboard, which is the mandatory format for project status reporting as per the DPMF. Through its use, governance committees will be kept informed on the triple constraints of scope, schedule and cost, as well as provided with the status of changes, issues and risks related to strategic investment projects on a monthly basis. Selected larger projects are subject to Internal Audit and Evaluation upon completion to determine whether the planned outcomes were fully delivered and to assess compliance with corporate policies, directives, procedures and standards. All programs are also subject to formal evaluations on a cyclical basis.
Strategic priorities are also reflected in the performance agreements of executives and employees. Senior executives ensure that strategic priorities are reflected in their commitments and performance measures. These commitments are then cascaded down into the objectives of managers and employees. They form the basis for measuring the results achieved ((see Chapter 2.5 – Planning and Management of Human Resources).
Strategic priorities also drive the work of Corporate Management Committees. These committees are responsible for managing risks
related to one of the four corporate priorities (i.e., relevance, trust, access and stewardship). Each committee meets at least monthly to discusses the corporate strategic priorities and sets out plans that will address the corporate risks. Committee work plans are approved and monitored by the EMB.
External reportingThe Departmental Performance Report (DPR) is the official external performance report to the Parliament of Canada. The DPR provides an account of results achieved against planned performance expectations set out in the RPP and is submitted to the Minister responsible for Statistics Canada, generally in September. Statistics Canada’s DPR, along with those of other federal departments, is tabled in Parliament in the fall by the President of the Treasury Board11, on behalf of the ministers who preside over agencies and departments.
11. The Treasury Board is responsible for accountability and ethics, financial, personnel and administrative management, comptrollership, approving regulations and most Orders-in-Council.
BOX 2.2.6 STEP 6
KEY ELEMENTS
− Executive dashboards
− Performance management agreements
− Corporate management committees
− Financial reporting
− Departmental Performance Report
− Departmental Staffing Accountability Report
− Performance measurement strategies and evaluation reports
OUTPUT
Completed planning cycle

Statistics Canada – Catalogue no. 11-634-X90
Compendium of Management Practices for Statistical Organizations From Statistics Canada’s International Statistical Fellowship Program
As well, a rigorous external financial forecasting and reporting process is in place. It provides for monthly updates to the CFO and the EMB on the agency’s financial situation, including quarterly progress reports on significant projects and ISPP-approved investments. Quarterly Financial Reports are published externally on Statistics Canada’s website in accordance with Treasury Board policy.
At the end of each fiscal year, the organization prepares the Public Accounts Plates, which present the financial operations of the organization and its use of the Main Estimates provided to the organization. The Public Accounts Plates are used for consolidation into government-wide financial statements, which are audited by the Auditor General of Canada and tabled annually in the Parliament of Canada.
Other external performance reporting mechanisms include the Departmental Staffing Accountability Report, required under the Public Service Employment Act to ensure that the public service organizations meet accountability requirements and expectations with respect to hiring and is tabled with the Public Service Commission in February.
ConclusionIntegrated strategic planning is a key mechanism used to maintain quality and relevance in a statistical organization. Both relevance and quality tend to deteriorate over time in the absence of proactive intervention. The 10-year strategic plan records the decisions about how the organization will fulfill its mission and mandate into the future. The 10-year strategic plan should help the organization to remain focused on long-term strategic priorities, in light of at times frequently changing shorter-term priorities.
The key success factor is a corporate culture that fosters innovation and reinforces awareness of emerging issues and buy-in among managers and staff. Specific elements of this type of corporate culture include the following:
• Appropriate infrastructure and governance mechanisms are in place for effective planning
• Direction-setting by senior management based on an environmental scan of priorities and emerging issues
• An up-to-date long-term plan for continuity and quality maintenance
• Comprehensive business-case assessments
• Integrated analysis of financial, human-resource and IT availabilities over at least a three-year horizon
• Coherence of communications
• Measurement of performance against plans.
The agency must ensure that, in a steady state, sufficient funds are available annually for routine maintenance and periodic redesign of all corporate processes, systems, applications and infrastructure, as well as for implementation of new classifications and standards and survey redesigns. Through the ISPP, the agency integrates sound management practices, such as risk management, investment planning, project management, and evaluation into the planning process. Integrated strategic planning allows Statistics Canada to achieve maximum efficiency, manage operational risks, and align programs with the evolving data needs of Canadians.

Statistics Canada – Catalogue no. 11-634-X 91
Section 2 - Core management practices Chapter 2.2 - Integrated Strategic Planning
BibliographyGovernment of Canada (2005). Statistics Act. L.R.C 1985, c. S-19. Amended by 1988, c. 65, s. 146; 1990, c. 45, s. 54; 1992, c. 1, ss. 130, 131; 2005, c. 31; 2005, c. 38. Consulted on 11th of March 2016 and retrieved from http://laws-lois.justice.gc.ca/eng/acts/S-19/FullText.html
Government of Canada (2016). Office of the Auditor General of Canada. Consulted on the 31st of March 2016 and retrieved from http://www.oag-bvg.gc.ca/internet/English/admin_e_41.html
Government of Canada (2003). Public Service Employment Act. (S.C. 2003, c. 22, ss. 12, 13). Consulted on the 31st of March 2016 and retrieved from http://laws-lois.justice.gc.ca/eng/acts/P-33.01/index.html
Government of Canada (2016). Public Service Commission of Canada. Consulted on the 31st of March, 2016 and retrieved from http://jobs-emplois.gc.ca/index-eng.htm
Statistics Canada (2015). Report on Plans and Priorities 2015-2016. Consulted on the 31st of March 2016 and retrieved from http://www.statcan.gc.ca/eng/about/rpp/2015-2016/index
Statistics Canada (2016). Departmental Performance Report 2014-2015. Consulted on the 31st of March 2016 and retrieved from http://www.statcan.gc.ca/eng/about/dpr/2014-2015/index
Statistics Canada (2016). Corporate Business Plan - Statistics Canada 2015-16 to 2017-18. Consulted on the 31st of March and retrieved from http://www.statcan.gc.ca/eng/about/bp

Statistics Canada – Catalogue no. 11-634-X92
Compendium of Management Practices for Statistical Organizations From Statistics Canada’s International Statistical Fellowship Program

Statistics Canada – Catalogue no. 11-634-X 93
Section 2 - Core management practices Chapter 2.3 - Financial Management
Chapter 2.3 – Financial Management
ContextSound financial management contributes to the effective and efficient use of public resources and ensures that government organizations, including national statistical agencies, are accountable for the prudent stewardship of public funds and the safeguarding of public assets.
Effective financial management is usually grounded in a code of values and ethics that guides public servants in everything they do while carrying out their professional duties. In the Canadian context, these values include the following: respect for democracy, respect for people, integrity, stewardship and excellence.
In Canada, the Financial Administration Act (FAA) provides the cornerstone of the legal framework for financial management within the federal government. The FAA gives the Treasury Board Secretariat12 the authority over financial management matters and other matters relating to the prudent and effective use of public resources. This is done by approving financial management policies, allocating financial resources, and overseeing departmental performance.
The Government of Canada defines four fundamental principles of financial management: value for money, accountability, transparency and risk management. Value for money means that public funds13 are managed with prudence and probity, assets are safeguarded and resources are used effectively, efficiently and economically to achieve departmental and governmental objectives. Accountability requires that there be clear responsibilities for financial management that provide assurance to the government and citizens regarding the effective use of public funds and the results achieved. Transparency means that the public and the government are provided with pertinent, reliable and timely financial and related non-financial information and reports so that they can be well-informed of the use and management of public funds. Proper risk management requires effective and efficient systems of internal control, where controls are proportionate to the risks they aim to mitigate yet support innovation and results for citizens. The Government of Canada has published several policy instruments regarding financial management to ensure consistency and effective financial management across the public sector.
Public sector managers always have three budgets in play, reflecting the cyclical nature of financial management: current, future and past. They must manage the budget and deliverables for the current fiscal year while making plans for the future and accounting for how monies were spent in the previous year.
Strategies and toolsAll managers are, to some degree, financial managers. However, it is essential to have clear roles and responsibilities for financial management of the current, future and past budget allocations within the statistical agency.
This section describes the governance structure and the financial cycle that underlie strategic and efficient financial management.
1. Governance
In Statistics Canada, financial responsibilities reside with the senior management of the organization—the Chief Statistician, the Chief Financial Officer, executive managers, and senior audit and evaluation executives.
Deputy Head (Chief Statistician)As accounting officers, deputy heads are accountable to the government (Parliament) for their management responsibilities, including their financial management responsibilities. This includes accountability for allocating resources to deliver departmental programs in compliance with government laws (and the regulations, policies
12. The Treasury Board Secretariat is a central agency of the Government of Canada. It provides advice and makes recommendations to the Treasury Board committee of ministers on how the government spends money on programs and services, how it regulates and how it is managed.
13. Statistics Canada has two main sources of funding: annual parliamentary appropriations (historical annual average between $500 million and $800 million) and funding from external partners (historical annual average of $100 million).

Statistics Canada – Catalogue no. 11-634-X94
Compendium of Management Practices for Statistical Organizations From Statistics Canada’s International Statistical Fellowship Program
and procedures derived from them), for maintaining effective systems of internal controls, for signing accounts in a manner that accurately reflects the financial position of the department, and for exercising any other duties prescribed by law or regulations relating to the administration of their department or agency. In practice, accounting officers are also held responsible for the parliamentary appropriations received.
Chief Financial Officer (CFO) and other senior executives of the Finance BranchThe Chief Financial Officer (CFO) and the other senior executives of the Finance Branch directly support the deputy head, as the lead departmental executive for financial management, providing key objective strategic advice on the overall stewardship of the financial management culture and on the agency’s financial performance. The CFO is accountable to the Office of the Comptroller General14 as the most senior financial manager within the department or agency. The CFO must adhere to explicit requirements throughout the financial management function.
All executive-level managers (Directors, Directors General and Assistant Deputy Heads) of program and service areas Executive-level managers of program and service areas are responsible for ensuring effective financial management of all the activities falling within their areas of responsibility (including financial resources), and have final control with respect to organizing and staffing their own units. An instrument of financial delegation is used to define the various authorities that managers at various levels can exercise. In Canada, the Delegation of Financial Signing Authorities ensures that appropriate financial and management controls are applied to the decision-making process in spending public money and that they contribute to the effectiveness of program delivery and to the accountability of the authority process. The Delegation of Financial Signing Authorities is legally enforceable under the Financial Administration Act.
Senior audit and evaluation executivesSenior audit and evaluation executives provide objective assurance services for all areas of departmental responsibility (see Chapter 2.8 – Program evaluation and Chapter 2.9 – Internal audit). In addition, Statistics Canada established a Departmental Audit Committee (DAC) in 2009, in response to the federal government’s new Policy on Internal Audit. The DAC is an essential component of the governance structure, and a critical aspect of a strong and credible internal audit regime. The DAC, whose membership includes three independent members who are currently outside the federal public service, ensures that the Chief Statistician has independent, objective advice, guidance and assurance on the adequacy of the agency’s risk management, control and governance processes. The DAC does this by actively overseeing the internal audit program to ensure it properly and regularly assesses Statistics Canada’s key control and accountability measures in an integrated and systematic way.
2. Cyclical nature of financial management
Public sector managers are involved with three budgets that are constantly in play: current, future and past.
2.1 Current budget The current budget allocation is established before the fiscal year begins, along with the expected program deliverables. A manager’s first concern is to spend and manage these funds according to the rules, for their intended purpose, and in keeping with objectives.
Statistics Canada is organized by subject matter and service areas and by centralized centres of expertise in order to optimize resource utilization. Centres of expertise include IT systems development, data collection and processing, and methodology (see Chapter 2.1 – Organizational structure and matrix management). The various areas work together on specific deliverables within the agency’s matrix-management framework. Under this approach, resources and related budgets are allocated and controlled on two axes: a functional axis and a program axis. Matrix management requires that a strong analytical accounting capability be in place to support budgeting decisions and monitoring of outcomes.
14. The Comptroller General of Canada is responsible for providing functional direction and assurance for financial management, internal audit, investment planning, procurement, project management, and the management of real property and materiel across the federal government.

Statistics Canada – Catalogue no. 11-634-X 95
Section 2 - Core management practices Chapter 2.3 - Financial Management
Employees are assigned to a Financial Responsibility Centre (FRC), which corresponds to a specific organizational entity and function, and their salaries are paid from this FRC (cash accounting). Every employee codes his or her time to a particular program/project according to salary rates that were developed as part of the agency’s cost-accounting system. This allows an organization-wide analysis of all costs associated with a particular program/project. In smaller organizations, this can be achieved without introducing a complex cost-accounting system. A simpler system to allocate the actual hourly salary of each employee to the project, on which he or she works, could suffice.
Also, each expenditure is coded to correspond with specific characteristics or line objects that allow monitoring of expenditures and comparison with commitments (shows variances between what was initially planned and what was actually spent).
As indicated in Figure 2.3.1, all costs for any given program / project are recorded at the FRC level but are also ascribed to the program/project in our matrix cost accounting system. The matrix cost accounting system is illustrated by a chart showing the three programs that make up the operating budget of the Income Statistics Division: Pension Plans in Canada Survey, Survey of Household Expenditures, and Survey of Labour and Income Dynamics. Two types of FRCs can contribute to a program/project: sponsoring FRCs and supplying FRCs. The two axes may coincide, but this is very rare for statistical programs/projects, which generally require multi-disciplinary teams.
Figure 2.3.1 Illustration of matrix management
Illustration of matrix management
Matrix management: Resources are allocated and controlled on two axes. This is essential for true analytical accounting:
The two axes may coincide, but this is very rare for statistical programs, which generally require multi-disciplinary teams.
Example of matrix with the Income Statistics Division
Functional
Program budget
($)
Sponsor Supplier
85400Income
Statistics Division
65200System
Development Division
67500Household
Survey Methods Division
75030Survey
Operations Division
Prog
ram
0394 – Pension Plans in Canada Survey 710,000 40,000 750,000
2214 – Survey of Household Spending (SHS) 1,115,000 68,000 700,000 3,300,000 5,183,000
2215 – Survey of Labour and Income Dynamics (SLID) 1,000,000 48,000 400,000 1,090,000 2,538,000
Operating budget ($) 2,825,000 156,000 1,100,000 4,390,000 8,471,000
In this example, the total budget for all three programs is $ 8,471,000, but only one-third of the total program budget is sponsored by FRCs within the Income Statistics Division. The remainder is supplied by FRCs from other divisions, which provide services to support the various Income Statistics Division programs: Systems Development Division (IT services), Household Survey Methods Division (methodological services) and Survey Operations Division (survey operations).
For example, the manager of the Survey of Labour and Income Dynamics (SLID) is accountable for delivering this entire survey program, with a budget of $ 2,538,000, associated with the program element code 2215. The supplying FRCs are the functional units responsible for providing resources that contribute to the delivery of the SLID program; i.e., System Development Division (FRC 65200), Household Survey Methods Division (FRC 67500), and Survey Operations Division (FRC 75030). The FRCs that sponsor and supply resources for the SLID code their time to project element 2214 to manage the total budget for program element 2215.
Regular financial reviews are carried out on a functional basis (monthly) and on a program basis (quarterly) to provide robust oversight and control of funds, from both cash- and cost-accounting perspectives. The financially delegated managers, who sponsor and supply resources, sign off on these reviews because they are ultimately accountable for the financial management of these delegated resources and the related program outcomes.

Statistics Canada – Catalogue no. 11-634-X96
Compendium of Management Practices for Statistical Organizations From Statistics Canada’s International Statistical Fellowship Program
2.2 Future Budget As part of the Integrated Strategic Planning Process, managers must develop a financial plan to ensure that the statistical agency continues to fulfill its mission and mandate into the future. This process includes reviewing the base budget from government appropriations, proposing strategic investments, and confirming external funding for work carried out on a cost-recovery basis. For some strategic or cyclical investments (e.g., Census of Population and Census of Agriculture), it may also be necessary to develop a business case to request additional funding from the federal government (Parliament).
An integrated analysis of financial, human-resource and IT availabilities over a 10-year horizon provides a key tool for managers to ensure that all project approvals, many of which constitute multi-year investments, are made in the context of future operational requirements. This analysis also helps managers to project the availability of and demand for funding. The Report on Plans and Priorities, a compilation that explains the annual business plan is the official external planning report for federal departments and agencies in Canada (see Chapter 2.2 – Integrated Strategic Planning).
2.3 Past budget Given that a manager’s primary concern is to spend funds and manage a budget according to the rules, and for a program’s intended purpose, and in keeping with program objectives, the manager must report on this at the end of the fiscal year. The final functional review and program financial review carried out every year clearly demonstrates the surplus or deficit position of the program. The ability to successfully manage planned budgets with a small margin of variation is also part of the Performance Management Agreement of senior executives. Of course, some deviations from initial plans are virtually unavoidable across the vast range of programs usually found in a national statistical agency. That is why an accurate retrospective picture is important to assessing performance, to serving as a basis for funding adjustments and to assessing the financial implications of additions or subtractions to a program or service that may be contemplated as part of the strategic planning exercise.
At the end of each fiscal year, the organization prepares its Public Accounts, which present the financial operations of the agency and its use of the funding (Main Estimates) provided to the organization by Parliament. Those accounts are used for consolidation within government-wide financial statements, which the Auditor General of Canada audits and tables annually in the Parliament of Canada. The organization also produces the Departmental Performance Report (DPR), which is the official external performance report to the Parliament of Canada. The DPR provides an account of results achieved against planned performance expectations set out in the Report on Plans and Priorities (RPP).
Key success factorsThe following are the four key successful practices or guiding principles for efficient control and management of funds: (1) transparency and public disclosure, (2) segregation of duties and clear responsibilities, (3) oversight of higher-risk operations and quality assurance, and (4) independent audit and evaluation functions.
1. Transparency and public disclosure Transparency and public disclosure include three important components: timely reporting using standard templates and periodic forecasting (to fiscal year end) of program and functional expenditures; in-year adjustments to program funding and investments as per the evolution of the financial situation; and strong, dedicated financial professionals to support executives as strategic partners in providing advice and decision-making.
2. Segregation of duties and clear accountabilities means taking into account the Delegation of Financial Signing Authorities and separating the authorizing authority from the payment authority. This also means that accountability for the sponsoring and supplying FRC managers is clearly defined and, thus, will ensure the most effective delivery of programs within the matrix management framework.
3. Oversight of higher-risk operations and quality assurance include the following: Detailed regular reports (ideally monthly) and critical analysis of key performance indicators submitted to the Chief Financial Officer; a summary of financial highlights presented monthly to the Corporate Planning Committee (chaired

Statistics Canada – Catalogue no. 11-634-X 97
Section 2 - Core management practices Chapter 2.3 - Financial Management
by the Chief Statistician), and a multi-year perspective / projections to support the Integrated Strategic Planning Process.
4. Independent audit and evaluation functions include the following: a five-year evaluation plan, which includes the full evaluation coverage of the agency’s direct program spending over a five-year cycle, an evaluation committee, chaired by the Chief Statistician, which supports, oversees and monitors the evaluation function and management accountabilities arising from evaluations and evaluation-related products, and a Departmental Audit Committee, which actively oversees core areas of the agency’s control and accountability in an integrated and systematic way—a critical aspect of a strong and credible internal audit regime
It is important for a national statistical office to have full control over the allocation of its budget. This ensures that the organization can be politically independent and allocate funds to the most important programs.
Challenges and next stepsThe Canadian government is continuously improving and adapting its financial management function as the fiscal environment evolves. Any changes require organizations to remain current in terms of their financial procedures to ensure compliance. Recent challenges include allocating funds to the highest priorities in the context of fiscal restraint and providing effective and efficient monitoring of the financial environment to ensure that the agency has the capacity to react to new pressures or opportunities

Statistics Canada – Catalogue no. 11-634-X98
Compendium of Management Practices for Statistical Organizations From Statistics Canada’s International Statistical Fellowship Program
BibliographyGovernment of Canada (2016). Constitution Act, 1867. Consulted on the 31st of March 2016 and retrieved from http://laws.justice.gc.ca/eng/const/page-1.html.
Government of Canada (2016). Financial Administration Act (R.S.C., 1985, c. F-11). Consulted on the 31st of March 2016 and retrieved from http://laws-lois.justice.gc.ca/eng/acts/F-11/index.html
Government of Canada (2016). Treasury Board of Canada Secretariat. Consulted on the 31st of March 2016 and retrieved from https://www.canada.ca/en/treasury-board-secretariat/index.html
Government of Canada (2012). Policy on Internal Audit. Consulted on the 31st of March 2016 and retrieved from http://www.tbs-sct.gc.ca/pol/doc-eng.aspx?id=16484
Statistics Canada (2015). Report on Plans and Priorities 2015-2016. Consulted on the 31st of March 2016 and retrieved from http://www.statcan.gc.ca/eng/about/rpp/2015-2016/index
Statistics Canada (2016). Departmental Performance Report 2014-2015. Consulted on the 31st of March 2016 and retrieved from http://www.statcan.gc.ca/eng/about/dpr/2014-2015/index
Statistics Canada – Catalogue no. 11-634-X 99
Section 2 - Core management practices Chapter 2.4 - Project Management Framework
Chapter 2.4 – Project Management Framework
ContextProject management is the systematic planning, organizing and control of allocated resources to reach project objectives and outcomes. A project management framework is a set of standard project management processes, templates and tools that can be used to initiate, plan, execute, control and close a project. Having such a framework in place facilitates decision making, communication, and coordination across all projects in a portfolio and, in turn, contributes to governance and management rigour. Ultimately, this results in a more efficient use of corporate resources.
Whereas matrix management and a cross-cutting corporate perspective govern the vast majority of Statistics Canada’s activities (for instance, every single activity is assigned a project number15 under the matrix-based cost-accounting system), the full series of project management practices, outlined in this chapter, is normally reserved for focused, non-repetitive, time-limited activities with some degree of risk—endeavours beyond the usual program or operational activities. A one-time initiative that does not have regular, ongoing funding should be classified as a project.
There are certain criteria that define a project. A project is defined as an activity or series of activities with a defined beginning and end. A project must produce defined outputs, realize specific outcomes, and support a public policy objectives, all within a clear schedule and resource plan. A project should be managed within scope, time, cost and performance parameters. Box 2.4.1 explains the difference between programs and projects.
Box 2.4.1 Projects versus programs
A program is a group of related resource inputs and activities that are managed to address one or more specific needs to achieve certain expected results, and is treated as a budgetary unit. Programs should have discrete and dedicated annual departmental funding and be supported by a policy authority that could expire.
Unchanging, repeatable processes are not projects. Regular, ongoing surveys, for which specific funding is received in our base budget, are classified as programs, not projects. However, the creation or redesign of a program that includes multiple projects should be treated as a project. For example, the monthly Labour Force Survey would not be a project, as it is part of ongoing operations, and forms part of the Labour Statistics Program. However, a redesign of the Labour Force Survey would be considered a project.
Strategies and toolsThis section describes (1) the benefits of adopting a project management framework, (2) the project management process, (3) the measurement of the project performance and (4) the governance structure for efficient project management.
1. Adopting a common project management framework – benefits
The key benefits of implementing a project management framework are as follows:
• Streamlines and enhances project-management skills by being proactive and by ensuring that communication of the project’s status is completed with the corresponding project governance bodies
• Ensures the integration of financial, human resources and IT planning
• Ensures repeatable, consistent project management processes
15. In such cases, the activity is usually referred to as a “program element” to which a project code is associated for cost accounting purposes. See Chapter 2.3 – Financial management.

Statistics Canada – Catalogue no. 11-634-X100
Compendium of Management Practices for Statistical Organizations From Statistics Canada’s International Statistical Fellowship Program
• Encourages stronger project management skills for managers
• Ensures improved delivery of projects on time, as well as within budget and scope
When all projects in an organization are managed with a consistent set of project management processes and tools, several benefits are realized. For example, it is easier to compare, assess, and prioritize project proposals during the approval process. This facilitates decision-making in the agency’s Integrated Strategic Planning Process (see Chapter 2.2 – Integrated Strategic Planning).
Common processes also enhance opportunities for communication and coordination across all projects in a portfolio. Common tools make it easier to provide training and support to project managers, and facilitate the mobility of managers between projects, even during a project. This translates into a more efficient use of corporate resources. A common departmental project management framework also creates opportunities for good information-management practices, such as providing a central location for storing project documentation, and for ease of access to documents for various purposes; for example, auditing. Project management documentation must be managed effectively for corporate information needs and knowledge-sharing, decision making, process improvement, as well as internal and external audit. This also enhances opportunities for communication between stakeholders, project-management team members and project governance bodies. The Departmental Project Management Office (DPMO) is responsible for maintaining a corporate repository of the mandatory project-management deliverables.
Consequently, having a project management framework leads to stronger project management skills and practices. Common reporting and monitoring practices help managers run projects successfully, from idea generation to close-out. For example, the common processes and tools can be used to:
• provide justification for new business proposals and scope requirements
• develop a business case to evaluate options
• create a project charter so all parties agree on what the project is about and who is involved
• develop project plans that cover all areas: scope, time, cost, quality assurance, human resources
• monitor and control projects through all stages
• handle change requests
• provide a close-out report that summarizes lessons learned
• provide finalized documentation that can be kept as corporate history and used for learning and continuous improvement
• identify risks and implement proactive mitigation strategies
A project management framework ensures that the project manager has the tools to increase the probability of the project’s success. To achieve project success, the manager must know at all times exactly where the project stands and whether it is on track or not. If it is not, what could be the impact on scope, schedule and cost? Having this kind of information enables a project manager to respond early and precisely to possible problems. Thus, a departmental project management framework can improve the likelihood of projects being completed on time, on budget, and within scope. The rigour of the framework is based on tracking formal changes, issues and risks, which increases likelihood of project success. Mandatory monthly monitoring of project health, using executive project dashboards, also enhances project transparency and interdependencies.
2. The Project Management Process – various stages
The Departmental Project Management Framework (DPMF) employed at Statistics Canada is a six-step process (which is not to be confused with the six-step process for Integrated Strategic Planning Process – see Chapter 2.2) including a set of standard project management processes, templates and tools. It is used throughout a project’s life cycle to initiate, plan, execute, control and formally close the project. The DPMF includes standard project management processes and templates, governance for project approval, standard project status reporting, change management process for scope, schedule and cost, issues management process, risk management process and information management.

Statistics Canada – Catalogue no. 11-634-X 101
Section 2 - Core management practices Chapter 2.4 - Project Management Framework
The DPMF guides and governs the project life cycle. The project management stages provide a road map for moving a project from idea to completion. The stages are separated by management decision gates, which include a record of decisions from the appropriate governing body. A gate represents a go/no-go project decision point, where one obtains approval to move to the next stage. Cross-functional teams must complete a prescribed set of deliverables at each stage before they can obtain management approval to proceed to the next stage of the project. The DPMF is enforced through the use of gates at each stage.
This process gives project sponsors and project managers opportunities for regular reviews and approvals. It also ensures that projects remain within the predefined constraints, and that they still achieve their planned outcomes. The project manager acts on behalf of the executive sponsor, who provides the funding for a project, and the business sponsor, who provides the requirements. The project manager leads the project and ensures functional representation from all other parties involved in the project, such as the IT, collection, and methodology sections. The project manager reports on the project’s status to the project team and to governance committees.
There are six stages and gates in the process, plus one post-launch review. These stages ensure that potential projects are prioritized across the whole department.
Stage 1At this stage, it is necessary to identify an idea or a proposed initiative that addresses a business problem or opportunity. It is a high-level, first attempt at describing the problem, need, or opportunity, and for roughly estimating the project’s scope, duration and cost. The Business Proposal is the key project management deliverable.
Stage 2At this stage, a business case is produced that consists of an options analysis, cost estimates, risks, assumptions, and business benefits/outcomes. The Business Case, which includes the cost estimate, is the key project management deliverable.
Stage 3At this stage, high-level business requirements are identified to complete the project charter.
Stages 4 to 6: Project Management
Stage 4At this stage, decisions are made to determine how the project will be structured and executed. Project planning comprises the development of the project’s structure, activities, deliverables and resource requirements, as well as the work plan or timeline that will navigate the project management processes used throughout the project’s life cycle. The work plan also sets out the procedures that will be used for tracking and reporting progress within the project. At this stage, it is time to baseline (define) the scope, schedule and cost. For cost estimating purposes, “project start” commences at the beginning of this stage. The key project management deliverables are the detailed business requirements, the project plan, the baseline schedule, and the costs.
At Statistics Canada, projects also produce monthly project status reports, known as “executive project dashboards” once they enter Stage 4. This marks the end of Portfolio Management and the beginning of the Project Management stage of the project-management life cycle.
Stage 5This stage is comprised of the steps required to execute, complete, track and measure the project activities that were defined in the planning stage. During this stage, the success and contribution of these steps are evaluated. The project status and outstanding issues or problems are also reviewed against the Project Plan. Statistics Canada uses a common tool for risk and change management, called the Change Issues and Risk Management Tool (CIRMT). Information from CIRMT automatically populates the risk and issues sections of the monthly executive project dashboards.
At the end of this stage, a product is ready for production or a service is ready for deployment. If the outcome of the project is an event, such as the centralization of the collection process, the actual event occurs during Stage 5
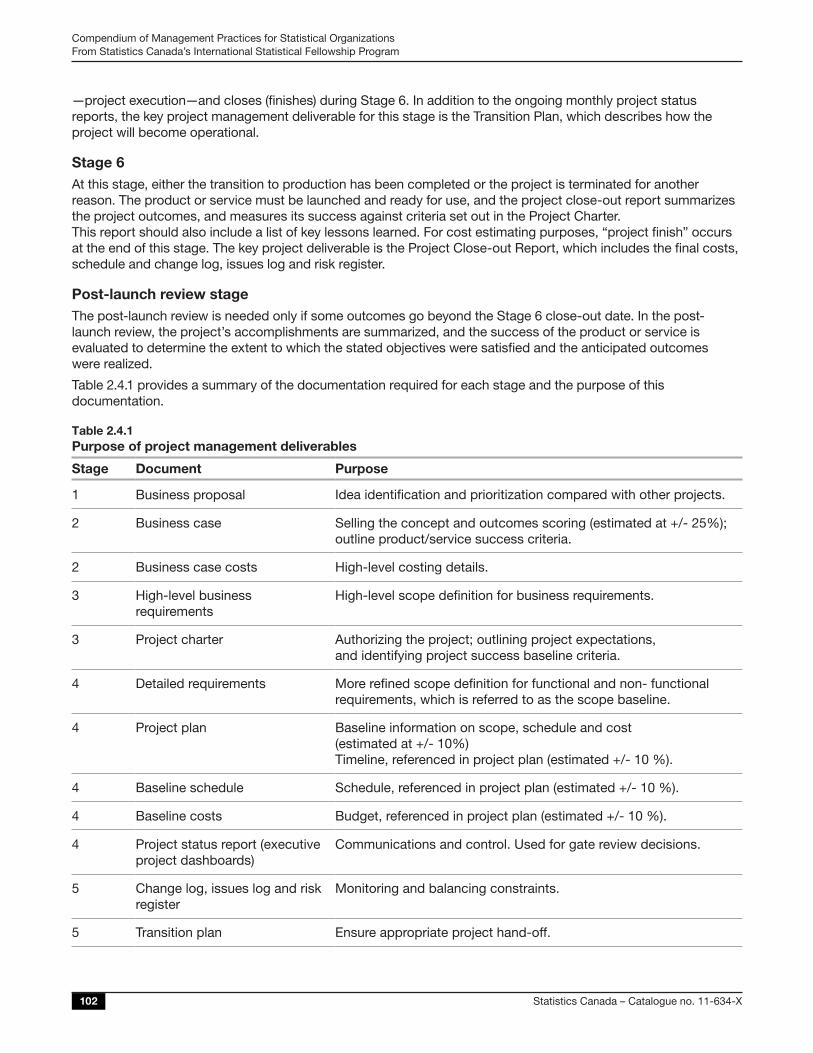
Statistics Canada – Catalogue no. 11-634-X102
Compendium of Management Practices for Statistical Organizations From Statistics Canada’s International Statistical Fellowship Program
—project execution—and closes (finishes) during Stage 6. In addition to the ongoing monthly project status reports, the key project management deliverable for this stage is the Transition Plan, which describes how the project will become operational.
Stage 6At this stage, either the transition to production has been completed or the project is terminated for another reason. The product or service must be launched and ready for use, and the project close-out report summarizes the project outcomes, and measures its success against criteria set out in the Project Charter. This report should also include a list of key lessons learned. For cost estimating purposes, “project finish” occurs at the end of this stage. The key project deliverable is the Project Close-out Report, which includes the final costs, schedule and change log, issues log and risk register.
Post-launch review stageThe post-launch review is needed only if some outcomes go beyond the Stage 6 close-out date. In the post-launch review, the project’s accomplishments are summarized, and the success of the product or service is evaluated to determine the extent to which the stated objectives were satisfied and the anticipated outcomes were realized.
Table 2.4.1 provides a summary of the documentation required for each stage and the purpose of this documentation.
Table 2.4.1 Purpose of project management deliverables
Stage Document Purpose
1 Business proposal Idea identification and prioritization compared with other projects.
2 Business case Selling the concept and outcomes scoring (estimated at +/- 25%); outline product/service success criteria.
2 Business case costs High-level costing details.
3 High-level business requirements
High-level scope definition for business requirements.
3 Project charter Authorizing the project; outlining project expectations, and identifying project success baseline criteria.
4 Detailed requirements More refined scope definition for functional and non- functional requirements, which is referred to as the scope baseline.
4 Project plan Baseline information on scope, schedule and cost (estimated at +/- 10%) Timeline, referenced in project plan (estimated +/- 10 %).
4 Baseline schedule Schedule, referenced in project plan (estimated +/- 10 %).
4 Baseline costs Budget, referenced in project plan (estimated +/- 10 %).
4 Project status report (executive project dashboards)
Communications and control. Used for gate review decisions.
5 Change log, issues log and risk register
Monitoring and balancing constraints.
5 Transition plan Ensure appropriate project hand-off.

Statistics Canada – Catalogue no. 11-634-X 103
Section 2 - Core management practices Chapter 2.4 - Project Management Framework
Stage Document Purpose
6 Project close-out report House in order; actuals-versus-baseline analysis; project success analysis; lessons learned for continuous improvement on projects.
6 Final costs Actual expenditures, referenced in the close-out report.
6 Final schedule Actual schedule, referenced in the close-out report.
6 Final change log, issues log and risk register
Opened and closed entries, referenced in the project close-out.
3. Measuring project performance
Overall, a project’s success is measured by its ability to achieve the desired outcomes within the parameters of scope, schedule and cost. Documenting the lessons learned is important. Moreover, if a culture of reasonable failure acceptance does not prevail in the organization, it will create an excessively risk-averse and innovation-stifling mentality.
In order to measure performance against the triple constraints of scope, time and cost, “baselining” is a useful practice. Baselines are points of reference against which scope, schedule and cost performance are measured. Baselines are created in Stage 4, Project planning.
Creating a new baseline, called “re-baselining”, can only result from the change management process.
3.1 Scope The scope baseline is specified by the high-level business requirements, as well as the detailed requirements. Once the scope is baselined, one of the project manager’s main responsibilities is to ensure that the project produces all the required work—and no more than the required work. Any deviation could trigger a change in scope, and must be handled using the change control process. Otherwise, adding features and functionality—called “scope creep”—can put the project at risk.
3.2 ScheduleThe schedule baseline consists of the project end date. Once the project end date is determined and the schedule is baselined, the project manager is responsible for reviewing and updating the schedule to reflect progress and to reforecast activity dates, if required. The examination of the start and finish dates forecast for activities and milestones against the most recent baseline start and finish dates is known as variance analysis. The project manager should monitor whether the project tasks are on schedule.
Tasks that are not part of the critical path are a lower priority than those on the critical path. The critical path is the sequence of activities that must be completed on schedule to ensure that the entire project will be completed on schedule. It is the longest duration path throughout the schedule that has no buffer. If an activity on the critical path is delayed by one day, the entire project will be also be delayed by one day, unless another activity on the critical path can be accelerated to compensate.
After the project manager integrates corrective adjustments into the schedule, based on the variance analysis, he or she can then obtain a forecast project end date. If it differs from the approved end date, then a change request must be initiated for review and approval. If the difference is outside the threshold of 10%, re-baselining is required.
3.3 Cost The cost baseline represents the project’s total cost. Once the project budget is determined, the project manager is responsible for ensuring that the project is completed within that budget. The budget must be reviewed and updated regularly, at least on a monthly basis.

Statistics Canada – Catalogue no. 11-634-X104
Compendium of Management Practices for Statistical Organizations From Statistics Canada’s International Statistical Fellowship Program
Once the project has been initiated, a project manager assigns a program-element number (code) for project-related expenses, both salary and non-salary. Employees will input codes for project-related activities into the agency’s corporate time- management system, which are reflected in the organization’s financial reporting system (FRS). Non-salary expenses are also charged against the project, and are reflected in the FRS.
The project manager is responsible for performing frequent variance analyses—examining the actual cost to date against the cost baseline. Any variance must be assessed to determine whether corrective action is needed.
Whenever any change to the forecast expenditures is integrated into the budget, a revised forecast total cost must be obtained. If the latter differs from the approved budget, a change request must be initiated. If the difference is outside the threshold of 10%, re-baselining is required.
3.4 Use of an executive project dashboard The key tool used to monitor the status of projects is a monthly executive project dashboard. An executive project dashboard, within the context of project management, is a business management tool used to visually represent the status (or health) of a project or a portfolio of projects using key project metrics. Executive project dashboards are designed to report on the following core project metrics that affect the project’s overall health and benefits—the constraints of scope, schedule, cost, as well as risks, issues, and project interdependencies. Dashboards employ graphic devices, such as green/yellow/red indicators, to communicate information clearly and succinctly.
The benefits of using an executive project dashboard include the following:
• better communication of the project’s health and status to project executives and stakeholders, in line with proven industry standards
• greater visibility of risks and issues that may impact the project’s success, thus providing early opportunities for course correction
• support for evidence-based governance decisions and executive accountability
Monthly status reporting to the steering committee for each project, and a combined status report for the portfolio of projects, are also quick indicators of the current situation at any given time (see Box 2.4.2 for more information on when projects are threatened). Another key element is project gating—ensuring that senior-level approval is received before projects move to the next project management stage. This gating process takes into account whether the project is on time, as well as within approved scope and cost. Issues, and risks are reviewed to ensure the project is on track, and a rigorous change-management process is followed.
Box 2.4.2 Monitoring what happens when projects are threatened?
• Monthly Executive Project Dashboards start showing yellow and red colors
• Issues are flagged at the Project Steering Committee to obtain senior management support
• Project management reporting on situation and redressing plans
• Documentation of issues, risks, decisions, changes and new deliverables (expert help could be provided)
• Closer monitoring and feedback and support to project manager to rectify situation
4. Governance structure
Governance is a management technique that regulates processes and systems and ensures that an empowered governing committee oversees the project throughout its life cycle. It includes appropriate decision points and off-ramps, escalation channels, and support committees to enhance the project’s chance of success. The governance structure provides stewardship of project resources, creates accountability for projects, and aligns projects with departmental strategic outcomes.

Statistics Canada – Catalogue no. 11-634-X 105
Section 2 - Core management practices Chapter 2.4 - Project Management Framework
At Statistics Canada, projects are overseen by governance committees. The level of governance depends on the project size, its scope and its complexity. The mandate of all governance committees is to make senior-level decisions on both projects and the project portfolio by providing support, escalation channels and go/no-go decisions, and by ensuring that investments are appropriate and strategically aligned.
Decisions about strategic projects that require corporate investment are made by the Senior Management Review Board, on the recommendation of Field Planning Boards and, in some cases, the Corporate Business Architecture Committee. (See Chapter 2.2 – Integrated Strategic Planning). The Senior Management Review Board acts as the gating committee for the first two project stages (idea generation and project assessment), while the Field Planning Board and/or the Corporate Business Architecture Committee act as the gate for Stage 3 (Project initiation). This completes the Portfolio Management part of the DPMF.
The Project Steering Committee (PSC) is responsible for the business issues associated with the project during the project management component of the DPMF. All projects should have a PSC; however, the membership is not pre-defined. For smaller projects, the PSC could consist of a business sponsor, director general and a director. When necessary, internal stakeholders may also be part of the PSC. The project steering committee acts as the gating committee for Stages 4 to 6 (planning, execution and close-out), and monitors inter-project dependencies, changes, issues and risks on a regular basis. The steering committee also reviews and monitors project progress and budget, at a high level, and reviews and approves recommendations for any baseline changes to any of the triple constraints—scope, schedule and cost.
Projects with a systems development (IT) component are also gated by the IT Architecture Committee (ITAC). ITAC ensures that IT systems are developed using sound architectural principles; a standard set of tools and methods, in a way that meets the business needs of the agency; and the IT security policies of both the agency and the federal government.
Key success factorsThe DPMF does not exist in a vacuum. Project management must be aligned and integrated with other departmental processes wherever possible. The stages of the DPMF have been mapped to other existing processes, which include the integrated security and risk framework, the corporate risk management framework, and the Integrated Strategic Planning Process16 (See Chapter 2.2 – Integrated Strategic Planning).
In addition, strong senior executive leadership is key to ensuring that the framework is respected at all stages of a project. Information-sharing at all levels in the organization is necessary, since all levels within the organization have different responsibilities for successful project management. Another success factor relates to ensuring that staff are supported with timely and proper training in preparation for project management.
A project management centre of expertise supports project leaders in the use of the DPMF. The objective of the Departmental Project Management Office is to support managers by providing leadership, training and support with respect to common project management processes and tools used by all projects17. These processes and tools focus on improving the timely delivery of projects within cost, within scope and ensuring adherence to quality standards. DPMO also releases an annual set of tools and templates. On each document template, the release year and version are shown on the document change-control page.
This centre also maintains the official repository of DPMF documentation and records of decisions from governance committees. Project management documentation must be managed effectively to maintain corporate information, as well as knowledge sharing, decision making, process improvement, and internal and external audit. This also enhances opportunities for communication between stakeholders, project management team members, and project governance bodies.
16. The project planning process can also be modified to meet changing needs of the organization. For example, the business proposal and CBA checklist have recently been merged into on e investment checklist and initial cost estimates are now required at Stage 1.
17. At Statistics Canada, projects that are valued equal to or more than $150,000 must use the Departmental Project Management Framework.

Statistics Canada – Catalogue no. 11-634-X106
Compendium of Management Practices for Statistical Organizations From Statistics Canada’s International Statistical Fellowship Program
Challenges and next stepsHaving a project management framework in place contributes to governance and management rigour by facilitating decision-making, communication and coordination across all projects in a portfolio, resulting in a more efficient use of corporate resources.
Implementing a Departmental Project Management Framework requires the creation of a standard project management culture across the organization. This constitutes an important shift in the way that managers work and the tools that they use. Some challenges and important next steps include the following:
• obtaining strong senior management commitment to the implementation of the project management framework, from the head of the Statistical Organization right down to the senior managers responsible for implementation
• clearly communicating the reasons behind the need for change and the anticipated benefits to employees and line managers
• involving employees and managers whose work will be impacted in the planning and implementation of the new project management framework
• providing training and on-going support to managers on the project management framework tools and processes and demonstrating the positive benefits in their daily work
Change creates stress both for employees who support change and those who are uncertain of change. Building an awareness for the need for change, and making the case for change convincingly through repeated communication about the vision, end state and guiding principles can facilitate the transition.

Statistics Canada – Catalogue no. 11-634-X 107
Section 2 - Core management practices Chapter 2.5 - Human resources planning and management
Chapter 2.5 – Human resources planning and management
ContextFor national statistical agencies to fulfill their mandate, they must recognize, first and foremost, that their staff are their most important asset. For Statistics Canada to fulfill its mission and meet its strategic objectives, an appropriate human resources (HR) strategy is imperative to have
• the right people in the right positions;
• employees with the necessary competencies and skills to do their job; and
• a competent workforce at all times.
An HR planning and management strategy is essential to maintain a competent and sufficient workforce in order to meet organizational needs. The principles of effective HR planning and management are based on the following elements:
• Integration of the HR dimension into the strategic planning process to ensure consistency between the strategic objectives and the available resources;
• Establishment of an HR management strategy and a plan that clearly outlines the necessary strategies, measures and mechanisms to meet the agency’s HR needs;
• Acknowledgement that HR management is a responsibility shared between the centralized HR function (as an internal service) and the agency’s managers;
• Adoption of an HR governance structure that is consistent with the notion of shared responsibility. This includes creating, among other things, different committees under the leadership of HR experts and supported by members of the agency’s various fields;
• An integrated career path approach: recruitment, training, professional development, engagement, career development and HR services organized according to this approach;
• Implementation of a positive, diverse and inclusive work environment that generates employee engagement.
However, it is important to remember that HR management in a statistical agency is also influenced by the legislation and regulations in force. For example, within the Canadian legislative context, Statistics Canada employees are hired under two important legislative frameworks: 1) the Public Service Employment Act, which targets public servants; and 2) the Statistics Act, which covers employees of Statistical Survey Operations and those working on census activities.
The Public Service Employment Act provides a more integrated approach to HR planning and aligning staffing with business needs and budgets. It also calls for managers to be responsible and accountable for their staffing.
The Statistics Act is the legislative framework that allows Statistics Canada to hire temporary employees for the Census of Population, Census of Agriculture and the National Household Survey. Approximately 35,000 people are hired temporarily during the census period.
Statistics Canada has 5,400 employees, 88% of whom are indeterminate (permanent) public servants, and the remainder term employees and students. The majority of employees are unionized public servants with solid academic and professional backgrounds in economics, statistics, sociology, mathematics, demography, information technology, administration or management.
There is one important exception: interviewers. Statistical Survey Operations (SSO) is the organization responsible for collecting survey data for the statistical programs. This organization is not governed by the Public Service Employment Act; therefore, it does its own recruitment. Roughly 1,800 employees work part-time for SSO. Their work volume depends on the demand for data collection and the deadlines requested. SSO is one group of employees made up of two tiers: interviewers and senior interviewers. There are also two types of interviewers: field interviewers, who travel outside Statistics Canada’s offices, and telephone interviewers, who conduct telephone interviews from a computer-assisted telephone interview (CATI) centre in the regional offices.

Statistics Canada – Catalogue no. 11-634-X108
Compendium of Management Practices for Statistical Organizations From Statistics Canada’s International Statistical Fellowship Program
Employee salaries are the greatest expense at Statistics Canada, accounting for roughly 80% of its total budget, hence the importance of managing this investment strategically, effectively and appropriately.
Strategies, mechanisms and tools This section provides an analysis of best HR planning and management strategies and practices in a statistical agency for two components, each illustrated with concrete examples from Statistics Canada:
• Talent development framework and strategy
• Human resources governance
1. Statistics Canada’s talent development framework and strategy
Statistics Canada developed an HR strategy with the following objectives:
• Recruit promising candidates for the agency;
• Deploy promising candidates appropriately within the agency based on needs and development opportunities;
• Develop employees so that they reach their full potential;
• Engage employees continuously;
• Determine the leadership potential of certain employees and develop talent management plans for them.
The objectives and expected results of the Statistics Canada talent development framework are as follows:
• Contribute to effective workforce planning;
• Position the agency as an employer of choice;
• Develop talent pools for the agency;
• Provide richer career development and career management programs;
• Support business continuity by ensuring that our workforce develops the necessary skills for the agency’s current and future success;
• Promote excellence in the public service;
• Support efforts to engage employees;
• Align employees’ work with corporate objectives;
• Enhance employee productivity and contributions;
• Strengthen employee retention.

Statistics Canada – Catalogue no. 11-634-X 109
Section 2 - Core management practices Chapter 2.5 - Human resources planning and management
Figure 2.5.1 Proposed Statistics Canada talent development framework
Talent Development Framework
Plan Talent Development Cycle
Recruit Engage DevelopDeployS
tatC
an’s
bus
ines
s pr
iorit
ies
Org
aniz
atio
nal a
nd w
orkf
orce
an
alys
is
Inte
grat
ed B
usin
ess
and
HR
Pla
n
Pre
ferre
d em
ploy
erP
ositi
ve b
iling
ual w
orkp
lace
Serving Canada with high-quality statistical information that matters.
Talent development
strategy
Competency-basedmanagement
Performance management
Recruitment andon-boarding
Learning anddevelopment
Awards andrecognition
Career development
Successionplanning
Off-boarding
Exit
As Figure 2.5.1 shows, three aspects of HR management are emphasized:
1. Planning (left side of figure).
2. The talent development life cycle is depicted by the employment continuum, i.e., recruit, deploy, engage, develop and “exit” (when the employee leaves the agency). In the centre of the figure are resources for the employee’s development, i.e., recruitment and integration, learning and development, performance management and talent segmentation, awards and recognition, career development, succession planning, competency-based management and exit from the agency.
3. Positive bilingual workplace.
1.1 PlanningThe objective of Statistics Canada’s HR planning is to acquire and maintain a competent, motivated and flexible workforce that can be reassigned to meet the agency’s changing needs. To this end, Statistics Canada has established a number of human resources practices and mechanisms that have evolved into an HR management strategy. This strategy comprises the following:
• Recruitment: hiring the most promising employees.
• Learning and development: implementing a culture of continuous learning and providing training to ensure that there are groups of flexible, versatile and mobile employees at every level who are ready to step in when required.
• Career path: providing employees with opportunities for long-term advancement through special assignments, among others.
• Positive work environment: fostering employee wellness by encouraging them to get involved and incorporating employment equity principles into day-to-day operations.
• Bilingualism: taking the necessary measures to fulfill Statistics Canada’s linguistic obligations to its employees and to Canadians.
• Professional advancement: implementing mechanisms that enable agency employees to move into higher-level positions and support them accordingly.
Statistics Canada – Catalogue no. 11-634-X110
Compendium of Management Practices for Statistical Organizations From Statistics Canada’s International Statistical Fellowship Program
Over time, the HR management strategy has fostered a sense of community that helps motivate employees, promotes productivity, supports bilingualism and encourages career advancement. This strategy has led to some key HR initiatives, including centralized recruitment of university and college graduates, mentoring programs, career counsellors, workplace wellness initiatives, and an on-site training institute that provides in-house training, including language training. This strategy has inspired great trust and a sense of belonging, encouraging employees to stay with the agency throughout their career.
Integrating business and human resources planning is essential for Statistics Canada to fulfill its mandate and responsibilities and to set priorities in an informed manner. The Integrated Business and Human Resources Plan – 2015/2016 to 2017/2018, prepared based on the agency’s business plan, outlines key priorities in internal and external staffing, workforce development and improvements to HR services at Statistics Canada over the next three years.
1.2 Talent development life cycle
1.2.1 Entry into the agency – Recruitment
The overall recruitment approach involves promoting an integrated recruitment, training development, and lateral and vertical mobility process. The agency’s selection processes are intended to be transparent, based on merit rather than seniority, and they use collective management of candidate pools optimally through generic selection processes. These candidate pools are generally valid for about one year.
Statistics Canada regularly conducts recruitment drives in the following occupational groups: EC (analysts), MA (mathematicians/statisticians), CS (information technology), PE (human resources management specialists) and FI (financial management specialists).
The postsecondary recruitment programs are the main source of entry-level hires in the agency. In addition, students who have already worked in the public sector (e.g., as part of the Cooperative Education Program or the Federal Student Work Experience Program) may be hired permanently or for a term through a simplified selection process.
To attract talented graduates, recruitment drives involve participating in college and university job fairs at major educational institutions to recruit strong entry-level candidates.
However, recruitment is not limited merely to hiring professionals. For each occupational group, the recruitment program includes a development program spanning a minimum period of two years that entails a series of compulsory courses, regular employee progress evaluations and, in many cases, two or three mandatory rotations in positions that give the employee a diverse work experience before he or she can obtain a permanent position.
One of the mandatory courses for analysts, mathematicians and statisticians is the Survey Skills Development Course. In this sixweek course, participants prepare and execute all steps of a survey about an actual socioeconomic issue. It allows recruits to acquire knowledge of the nature of survey activities within multidisciplinary teams, and it enables the agency to share its values, particularly teamwork and methodological soundness when conducting surveys.
1.2.2 Learning and development
The objective of learning and development management is to establish a culture of continuous learning and to provide training so that there are cohorts of flexible, versatile and mobile employees at every level of the agency. Furthermore, learning and development planning is an integral part of the annual evaluation process aimed at improving the employees’ competencies. This planning is done when the annual learning plan is prepared, along with the objectives and performance agreement (see 1.2.3 – Performance management and talent segmentation).
Employees have learning and development choices, depending on their field of work (occupational group) and the level of their position. They are encouraged to take a specific training path, but there is some latitude that allows them to determine their personal learning objectives.
Employees have access to formal and informal learning activities. Formal activities refer to classroom or online training and special assignments. There are different types of training: statistical training, subject-matter training,

Statistics Canada – Catalogue no. 11-634-X 111
Section 2 - Core management practices Chapter 2.5 - Human resources planning and management
language training (to improve skills in either official language), IT training, basic training (orientation, general and sometimes functional competencies), management or leadership training. There is also mandatory training for new recruits, in particular on complying with the agency’s security and confidentiality regulations.
Specialized training related to the agency’s mandate is also offered within Statistics Canada. However, training on general competencies, government practices, management or leadership, for example, is offered by the Canada School of Public Service, since these courses meet needs that are common to all federal public servants who would like to develop in these areas.
Informal training includes networking opportunities, national and international conferences, being a member of a working group or committee, and mentoring.
1.2.3 Performance management and talent segmentation
Like other federal departments and agencies, Statistics Canada has established a solid governance structure for performance management. The agency is determined to promote excellence in the workplace among its staff and teams by encouraging ongoing, open and honest communication about performance between employees and supervisors. Complying with and implementing these values are integral to the process for resolving unsatisfactory performance.
In 2013, Statistics Canada launched the Fostering Excellence in Employee Performance Project. This project, which aligns with the requirements of the new Government of Canada Directive on Performance Management, lays the groundwork to ensure that all employees are able to contribute fully to the agency’s objectives. This includes aligning processes, tools, guidelines, training and effective communications to ensure that new and improved approaches are adopted uniformly. To do this, the agency ensures that employees have the necessary knowledge and competencies to complete the tasks required of them.
At the start of each fiscal year, managers meet with their employees to inform them of the activities they will be responsible for during the year and to set the associated performance objectives. This meeting is also an opportunity to discuss the employee’s annual learning plan that will enable them to acquire or maintain—as the case may be—the competencies required for their position and to achieve their career objectives and aspirations. Managers should provide their employees with continual feedback on their performance, and the Fostering Excellence in Employee Performance Project sets out both an official midterm discussion to examine performance progress and a final performance evaluation of each employee at the end of the year based on the established objectives.
The purpose of these practices is to continuously improve the recognition of excellent employee performance, to motive personnel, and to ensure that performance problems are resolved quickly and effectively. More specifically, corrective actions are in place for employees whose performance is deemed unsatisfactory, and talent management plans are prepared for employees who significantly exceed expectations so that they can achieve their full potential within the agency.
1.2.4 Awards and recognition
Recognition is an integral part of the agency’s corporate culture, at its headquarters and regional offices alike. Whether through a formal or informal award, or a spontaneous expression of thanks, recognition encourages the pursuit of outstanding work in the Canadian public service.
The mandate of the Awards and Recognition Program is to highlight employees’ efforts and achievements in the workplace, be they team or individual achievements. The program also promotes both formal and informal activities. The core services of the Awards and Recognition Program are as follows:
• Long-service award
The Long Service Award rewards employees with 25 or 35 years of service in the public sector. These employees are recognized at an official presentation by the director general of human resources and the chief statistician during National Public Service Week, which takes place in June of each year. Employees with 15 years of service also receive a certificate of appreciation signed by the chief statistician.

Statistics Canada – Catalogue no. 11-634-X112
Compendium of Management Practices for Statistical Organizations From Statistics Canada’s International Statistical Fellowship Program
• Retirement certificate
Retirement certificates highlight the contribution of employees who have worked at least 10 years in the public service of Canada. The certificate, signed by the Prime Minister of Canada, is presented by the director at the employee’s retirement party or at an appropriate event.
• Appreciation awards
Appreciation awards recognize employees who have made a positive and beneficial contribution to a section, division, branch or to the agency as a whole. These may be monetary or non-monetary rewards accompanied by a letter of congratulations or a certificate of appreciation completed in the work unit and signed by the director or director general. The maximum value is $500 per person and $1,000 per team (including taxes and shipping).
• Awards of Excellence
Awards of excellence highlight exceptional work by employees, their outstanding performance or other invaluable contributions to the agency. There are eight categories: Agatha Chapman Innovation Award; Career Excellence Award; Merit Award; Youth Leadership Award; Official Languages Excellence Award; Employee Development and Management Award; Tom Symons Research Award; and the Workplace Wellness Award. All nominees receive a certificate of recognition or a trophy at the annual awards ceremony, and their name is added to the Wall of Fame in the lobby. Nominees and winners may also be the topic of an article in @StatCan, the monthly employee newsletter.
• External awards
Each year, Statistics Canada receives numerous letters from private and public sector organizations calling for nominations for awards they sponsor. Statistics Canada may also submit nominations throughout the year for different external awards. These awards are presented annually and are sponsored by the federal government, professional associations and private businesses. They reward achievements in such fields as communications, marketing, human resources, leadership and management, partnerships, and technological and statistical innovation. Over the years, Statistics Canada’s employees, and Statistics Canada as an agency, have been honoured with several such awards.
1.2.5 Career development
This refers to the agency offering a career path to employees that matches their field of work and classification. The career path may involve, among other things, temporary assignments to divisions other than their home division so that employees can broaden their skills, bolster networking and overcome other workplace challenges. This prepares employees for a higher-level position.
In the areas of internal staffing and mobility, in addition to the appointment processes open to personnel, Statistics Canada supports employee mobility based on talent management (for assistant director and higher positions), and learning plans developed jointly between the manager and employee. The goal is to familiarize the employee with the different fields of the agency. All employees have access to the Corporate Assignments Program, which offers them new career opportunities. This program facilitates staffing of temporary positions internally, since it offers the advantage of being quick and has no impact on the employee’s salary or classification, and their return to their home position is guaranteed. Roughly 10% of the agency’s total workforce is on special assignment at any given time.
1.2.6 Competency-based management
Management and upgrading of skills are crucial to the talent development framework. The Directive on Performance Management defines three categories of competencies: core competencies, functional competencies and technical competencies. All federal public service employees are evaluated according to four core competencies: 1) demonstrating integrity and respect, 2) thinking things through, 3) working effectively with others, 4) showing initiative and being action-oriented.

Statistics Canada – Catalogue no. 11-634-X 113
Section 2 - Core management practices Chapter 2.5 - Human resources planning and management
Demonstrating integrity and respect
− Behaving consistently with the Values and Ethics Code for the Public Sector.
− Discuss ethical concerns with their supervisor or colleagues and, when necessary, seeking out and using appropriate disclosure procedures.
− Working in a manner that reflects a commitment to client service excellence.
− Actively contributing to workplace wellbeing and a safe, healthy and respectful workplace.
− Supporting and valuing diversity and bilingualism.
− Acting with transparency and fairness.
− Demonstrating respect for government assets and resources, and using them responsibly, including by understanding and applying relevant government policies.
Thinking things through
− Planning and adjusting their work based on a thorough understanding of the unit’s business priorities and their own work objectives, and seeking clarification and direction when uncertain or confused.
− Considering multiple sources of information before formulating a view or opinion.
− Exercising sound judgment and obtaining relevant facts before making decisions.
− Analyzing setbacks and seeking feedback to learn from mistakes.
Working effectively with others
− Sharing information with work colleagues.
− Listening actively to the views of others, and respecting, considering and incorporating them.
− Recognizing the contributions and celebrating the successes of others.
− Working collaboratively and relating effectively to others, and embracing and valuing diversity.
− Demonstrating an understanding of the roles, responsibilities and workloads of colleagues, and being willing to balance personal needs with those of other team members.
− Eliciting trust, particularly by following through on commitments.
− Dealing proactively with interpersonal or personal matters that could affect their performance.
− Managing their own work–life balance, and respecting that of others.
Showing initiative and being action-oriented
− Staying up to date on team goals, work processes and performance objectives.
− Translating direction into concrete work activities, making the most of available time and resources.
− Maintaining a constructive attitude in the face of change, setbacks or stressful situations, and remaining open to new solutions or approaches.
− Communicating ideas, views and concerns effectively and respectfully, and actively participating in exchanges of ideas with others.
− Identifying early warning signs of potential problems, and alerting the manager/supervisor and others, as needed.
− Embracing change and actively looking for opportunities to learn and develop professionally and personally.
− Contributing to and participating in process improvements and new approaches.
− Pursuing operational efficiencies, demonstrating an appreciation of the importance of value for money, including by willingly adopting new and more efficient ways of working.

Statistics Canada – Catalogue no. 11-634-X114
Compendium of Management Practices for Statistical Organizations From Statistics Canada’s International Statistical Fellowship Program
1.2.7 Succession planning
Succession planning requires that key positions within the organization be identified and that knowledge be transferred appropriately and timely to ensure a smooth transition for planned and unplanned departures. Succession planning is facilitated by
• a thorough knowledge of the composition of the current workforce (breakdown of employees by occupation, classification, age group, language, expertise, employment status, employment equity group, etc.);
• a good forecast of workforce needs (analyses of retirements and retention rates, forecast model based on the workforce demographic dynamics, etc.); and
• a staffing and knowledge transfer strategy to quickly and effectively fill positions that become vacant (creation ahead of time of pools of talented candidates with strong potential where replacements can be found quickly; transition period between employee departure and official assumption of duties by replacement; etc.).
1.2.8 Exit from the agency
Employees who leave the agency are consulted and can express their opinion on the reasons for their departure by means of an “exit questionnaire.” The results of these questionnaires are analyzed and used as barometers to improve HR programs.
1.3 Positive bilingual workplace
1.3.1 Positive work environment
Workplace wellness is an integral part of a good employee retention strategy. At Statistics Canada, wellness is embedded in the organizational culture and is firmly supported by senior management and a multitude of volunteers who oversee many special activities, in addition to their work. Among other things, Statistics Canada supports the following principles and activities to create a positive work environment:
• open, transparent communication;
• respectful, inclusive workplace relations;
• support for work–life balance;
• employee opinion surveys and systematic follow-up with corrective measures jointly developed with employee groups;
• recognition of team and individual contributions: annual, individual, team or long-service award (see Section 1.2.4 – Awards and recognition); and
• social activities to build team spirit and a sense of belonging to the agency.
The aim of all of these activities is to ensure that employees feel good at work and that they feel valued and engaged (for more information about employee consultation and engagement mechanisms, see Chapter 2.6 – Internal communications).
There are also other mechanisms that help to enhance workplace wellness. The most important are the Workplace Wellness Committee, the Employee Assistance Program, and the Informal Conflict Management Services.
The Workplace Wellness Committee organizes helpful, relevant activities and events to promote good mental and physical health to employees. The Committee works to highlight employee contributions to Statistics Canada’s achievements through a variety of activities, such as Employee Appreciation Day and the annual picnic.
The Health Canada Employee Assistance Program provides consultation services for personal or work-related problems. Through this program, employees and their families have access to
• a 1-800 number available 24 hours a day, 7 days a week where they can seek help;
• short-term counselling and referrals to community resources;
• awareness and information sessions for managers;

Statistics Canada – Catalogue no. 11-634-X 115
Section 2 - Core management practices Chapter 2.5 - Human resources planning and management
• trauma management services; and
• e-counselling.
Health Canada’s Informal Conflict Management Services aim to foster a healthy and respectful workplace, and to build a culture that supports conflict resolution through the acquisition of informal conflict management skills and through interventions. The tools, techniques and services of Informal Conflict Management Services help to manage and quickly resolve conflicts in the workplace.
1.3.2 Values and ethics
Statistics Canada is committed to providing a highly ethical culture that fosters an atmosphere of respect and trust within the agency, where employees act responsibly and make value-based decisions daily that inspire public confidence.
The Values and Ethics Program is the responsibility of a senior manager who, as part of their role as champion, devotes themselves to promoting and improving the Values and Ethics Code for the Public Sector. The harassment prevention component plays a support role, offering activities that aim to provide a healthy workplace and to manage difficult situations with sensitivity, diligence and discretion. The agency’s solid leadership and legislative framework18 play a key role in achieving the objectives of this program. Statistics Canada devotes considerable effort to creating a working environment where employees are treated fairly, and it has a vast network of committed employees, managers and supervisors who strive to heighten awareness and promote an inclusive workplace.
1.3.3 Employment equity
Statistics Canada adopted a three-year action plan to ensure that its workforce is representative of the Canadian population and promotes a workplace that values diversity, recognizing its positive impact on achieving the business objectives of the organization. Employment equity is an important aspect in this regard and is taken into consideration at each stage of the recruitment process. Statistics Canada strives to fill gaps in representativeness of women, Aboriginal peoples, visible minority groups and people with disabilities at all hierarchical levels. Strategies have been developed to foster equity in staffing. These include targeted recruitment in certain postsecondary institutions, mandatory analysis of candidate pools at the senior management level (directors and directors general), measures to ensure the representation of employment equity (EE) groups on selection committees, as well as consultations with EE groups to find ways to improve future staffing processes. Discussion groups with the employment equity groups have also been created on several occasions to better understand the barriers that employees in the EE groups face in their career path. These discussion groups have led to concrete actions to bridge these gaps.
1.3.4 Promotion of bilingualism
Since Canada has two official languages, Statistics Canada is committed to providing all employees with a working environment where they can use the official language of their choice, while ensuring that the agency maintains its obligations related to bilingualism and encourages its employees to perfect and maintain their second-language skills. To this end, Statistics Canada raises the awareness of employees of the importance of using both official languages whenever possible when providing services. It also offers ongoing language training, encourages employees to add professional development and use of their second language to their annual learning plans, and offers its employees opportunities to maintain their language skills.
18. The legislative framework refers to the Public Servants Disclosure Protection Act, the Value and Ethics Code for the Public Sector, the Statistics Canada Code of Conduct and the Policy on Conflict of Interest and Post-Employment.

Statistics Canada – Catalogue no. 11-634-X116
Compendium of Management Practices for Statistical Organizations From Statistics Canada’s International Statistical Fellowship Program
2. Human resources governance
Statistics Canada has a governance structure that ensures an integrated approach to strategic priority setting, decisionmaking and accountability. HR management is driven by committees of line managers representing each major field of operation, supported by HR professionals. This structure, presented in Figure 2.5.2, promotes consistent HR management practices.
Figure 2.5.2 – Structure of Statistics Canada’s management committees
This structure contributes to the overall effective management of the agency and reinforces a culture of working as a team to achieve corporate objectives. Below is a brief description of the role of each human resources management stakeholder.
Chief statistician – The ability of Statistics Canada to meet new challenges depends not only on the diligence with which the chief statistician carries out his duties, but also on his leadership in creating a culture of excellence in management in the public service.

Statistics Canada – Catalogue no. 11-634-X 117
Section 2 - Core management practices Chapter 2.5 - Human resources planning and management
Executive Management Board – The agency’s most senior management committee. It oversees the governance system, establishes strategic orientations and makes all decisions related to organizational management.
Human Resources Committee – Provides direction on workforce and workplace measures regarding the recruitment, training, deployment, career development and retention of employees at Statistics Canada. It coordinates the activities of the human resources management subcommittees and is responsible for the strategic planning of their structure. It recommends proposals from the subcommittees to the Executive Management Board, Statistics Canada’s most senior executive committee. Final decisions are made by the chief statistician. The other HR committees are made up of assistant chief statisticians, directors general, directors and assistant directors, who are responsible for overseeing a major HR program. This network of committees reflects the agency’s matrix management structure. Members represent their field and are responsible for communicating issues from their field to the committees and decisions back to their colleagues.
Advisory Committee on Senior Appointments – Reviews and makes recommendations to the chief statistician for appointments at the assistant director level and above. This committee approves the launch of selection processes and results, determines whether it would be worthwhile to create a pool of candidates for senior management positions such as directors and directors general, and makes recommendations for appointments.
Senior Management Classification Review Committee – Defines the key strategic directions for the implementation of the outcomes of the senior management classification review. This ensures that position classifications are re-aligned with standard classification criteria and organizational changes.
Senior Personnel Review Committee – A corporate committee with a mandate to conduct reviews and make decisions on staffing and language training exemptions.
Corporate Staffing Committee – Oversees agency-wide staffing strategies and programs.
Learning and Development Committee – A corporate management committee mandated to provide central leadership for continuous learning and development initiatives for all employees.
Performance and Recognition Committee – Develops ways and means of optimizing the performance of all Statistics Canada employees and provides advice on the development and implementation of awards and recognition programs for the agency.
Diversity Committee – Advises on guidelines and implements programs to ensure fair representation and treatment of employees in the designated groups. The committee focuses on raising awareness of the equity programs, promoting a shift in attitudes, monitoring compliance with current equity programs and policies, recommending changes to current programs where necessary, and providing advice on future policy and program development. In addition, the committee advises on the implementation of initiatives that promote diversity and that strive to create an inclusive workplace. The Committee’s objective is to oversee implementation of the Employment Equity Multi-year Action Plan.
Official Languages Committee – Provides advice to various management committees, primarily the Human Resources Committee, on the direction and content of the official languages program in order to achieve government and agency objectives regarding service to the public, language of work, equitable employee participation and advancement of English and French in the workplace. The committee also provides guidance on the management of translation and terminology services as well as language training.
Workplace Wellness Committee – Continuously explores the wellness needs of Statistics Canada, promotes best practices throughout the organization and initiates and implements concrete improvements and practical programs to improve wellness.
Key factors for successHuman resources planning is an essential part of integrated strategic planning and ensures that the agency’s activities are proactive and effective. To this end, the development and implementation of the cohesive strategic HR plan, collectively established every three years and reviewed annually, pragmatically supports the spirit of the long-term strategic vision and access to short-term results.

Statistics Canada – Catalogue no. 11-634-X118
Compendium of Management Practices for Statistical Organizations From Statistics Canada’s International Statistical Fellowship Program
The fact that the integrated HR strategy is solidly supported by senior management has, over time, fostered a sense of community that helps motivate employees, promotes productivity, and encourages career advancement. This inspires great trust and a deep sense of belonging to the agency, reinforces employee engagement (for more on this topic, see Chapter 2.6 – Internal communications) and ensures a high rate of employee retention.
Lastly, HR management, which is built on solid and long-standing governance, reinforces efficiency and cohesion.
ChallengesRecruiting, training and retaining talented employees is a challenge for every organization, regardless of its business field. It requires that both public- and private-sector organizations constantly renew themselves, be proactive, carve out a place for themselves among top employers and continuously offer a positive work environment that is also motivating, open to innovation and competitive. Moreover, succession planning is also a major HR management challenge, since it is important to find the right candidates, and then develop, train and provide the necessary coaching so that they can take on a leadership role. This will then give them career opportunities and will give the agency employees who are able to provide exceptional performance to fulfill Statistics Canada’s mandate.
The futureAll statistical agencies must continue to cultivate a business culture that places employees at the heart of their concerns and priorities, recognizing that employees are their greatest financial investment as well as their main asset to effectively and strategically achieve their mandate.

Statistics Canada – Catalogue no. 11-634-X 119
Section 2 - Core management practices Chapter 2.5 - Human resources planning and management
BibliographyGovernment of Canada (2011). Values and Ethics Code for the Public Sector. Consulted on the 31st of March 2016 and retrieved from http://www.tbs-sct.gc.ca/pol/doc-eng.aspx?id=25049
Government of Canada (2016). Public Servants Disclosure Protection Act (S.C. 2005, c. 46). Consulted on the 31st of March 2016 and retrieved from http://laws-lois.justice.gc.ca/eng/acts/P-31.9/
Government of Canada (2005). Statistics Act. L.R.C 1985, c. S-19. Amended by 1988, c. 65, s. 146; 1990, c. 45, s. 54; 1992, c. 1, ss. 130, 131; 2005, c. 31; 2005, c. 38. Consulted on 11th of March 2016 and retrieved from http://laws-lois.justice.gc.ca/eng/acts/S-19/FullText.html
Government of Canada (2015). Public Service Employment Act (S.C. 2003, c. 22, ss. 12, 13). Consulted on the 31st of March 2016 and retrieved from http://lois-laws.justice.gc.ca/eng/acts/p-33.01/
Government of Canada (2014). Policy on Conflict of Interest and Post-Employment. Consulted on the 31st of March 2016 and retrieved from http://www.tbs-sct.gc.ca/pol/doc-eng.aspx?id=25178
Statistics Canada (2015). Code of Conduct – Statistics Canada. Internal document. Accessible on demand.
Statistics Canada (2016). Statistics Canada’s Integrated Business and Human Resources Plan – 2015/2016 to 2017/2018. Internal document. Accessible on demand.
Statistics Canada (2015). Multi-year Employment Equity and Diversity Action Plan 2015/2016 to 2017/2018. Internal document. Accessible on demand.

Statistics Canada – Catalogue no. 11-634-X120
Compendium of Management Practices for Statistical Organizations From Statistics Canada’s International Statistical Fellowship Program
Appendix: Acts, policies and directives governing HR management in the Canadian public servicePublic Service Employment Act (PSEA)
The aim of the PSEA is to assist in hiring qualified employees by ensuring flexibility in the process and respecting the values of equity, transparency and accessibility. The merit factor is used so that managers do not limit staffing by only taking into account the essential competencies, but also by taking into consideration the needs of their organization and of the public service. The Act gives managers the responsibility for their staffing and uses an integrated approach by aligning their staffing needs with their needs as an organization and their budget.
Public Service Labour Relations Act (PSLRA)
The PSLRA supports the development of workplace improvements to ensure sound workforce management and to conduct important negotiations of official agreements regarding essential services, labour relations management, and conflict management systems. The main values represented by the Act are respect and effective communications with employees and their representatives to maintain a healthy working environment; defence and service of the public interest; and impartiality, reliability and effectiveness in resolving conflicts such as harassment.
Official Languages Act (OLA) / Directive on Official Languages for People Management
The OLA stipulates that English and French are the languages of work and justifies the right of employees to use the official language of their choice. The directive supports the OLA by establishing the requirements regarding linguistic identification of positions, staffing of bilingual positions, as well as the equitable participation of English and French-speaking Canadians in the federal public service. To comply with this directive, managers are responsible for establishing the language profile of the position before beginning the staffing process and hence staffing bilingual positions with candidates who meet the requirements at the time of appointment.
Canadian Human Rights Act
The purpose of the Canadian Human Rights Act is to ensure equal opportunities for all individuals regarding access to employment, free of discrimination based on race, national or ethnic origin, colour, religion, age, sex, sexual orientation, marital status, family status, disability, or conviction for which a pardon has been granted or a record suspended.
Employment Equity Act
The aim of the Employment Equity Act is to achieve equality in the workplace to prevent individuals from being deprived of employment benefits or opportunities for reasons other than competency. As such, the objective is to put an end to employment situations that disadvantage women, Aboriginal people, people with disabilities and those who are visible minorities. Employers are responsible for enacting employment equity by recognizing and eliminating barriers to people who belong to the designated groups.
Financial Administration Act
The Financial Administration Act establishes requirements regarding human resources in the federal public service and ensures their effective management. The Act also provides directives on position classifications, guidelines on employee compensation for services rendered, hours of work and leave, as well as directives for the payment of business travel and other expenses incurred in the course of work.

Statistics Canada – Catalogue no. 11-634-X 121
Section 2 - Core management practices Chapter 2.6 - Internal communications
Chapter 2.6 – Internal communications
ContextPrioritizing internal communications is not merely informing employees and issuing directives. It involves putting communications at the heart of the organization’s interests and concerns.
An organization that attains its strategic objectives in an effective, sound and responsible manner does so foremost by means of informed employees who are adequately equipped and trained to do their job well, and who are also committed to a common vision and goals. This commitment is only possible if these employees feel the agency and its senior management listen to their concerns and suggestions. This is why it is important to have effective communications both top down and bottom up.
Internal communications therefore play two inseparable roles that represent good management and governance practices:
• An information role: This involves conveying useful and relevant information to employees using appropriate mechanisms. By conveying information, the agency not only informs, but also ensures that a consensus is achieved regarding its explicit and implicit rules.
• A consultation and engagement role: The agency makes sure to provide a range of mechanisms accessible at all levels for sharing ideas, seeking feedback, and proposing options or solutions to deal with new challenges. The agency engages employees by celebrating the community in order to create a sense of internal solidarity and build cohesion among teams.
Management of internal communications should be designed, planned and implemented on the principle of two-way discussions and sharing. This does not mean giving instructions and guidelines, and expecting employees to assimilate and follow them to the letter. Communications, as the name indicates, suggest an ongoing conversation, a dialogue that benefits everyone—the agency, senior management and employees.
Internal communications are also a responsibility shared between the agency’s official Communications function and its managers. The role of managers and supervisors is crucial due to their strategic position within the agency: they are the ambassadors of senior management and are in close contact with and in proximity to their teams. Therefore, they are in the best position to get information circulated and to consult with teams.
Statistics Canada, for example, recognizes the importance of internal communications as a support to programs and a management tool and has always closely followed these best practices and appropriate governance. This partly explains why the agency was named one of the top 100 employers in Canada for five consecutive years, from 2008 to 2012.
Strategies, mechanisms and tools This section deals with the strategies and mechanisms that Statistics Canada uses to inform, consult and engage employees of the agency.
1. Information strategies and mechanisms
Statistics Canada relies on various strategies and mechanisms to ensure that employees are aware of the relevant orientations, directions and decisions.
Regular communications, formulated in accordance with the governance structure, are the key to effective internal communications. As a result, Statistics Canada’s governance structure facilitates the transmission of information. The Executive Management Board, chaired by the chief statistician and made up of all of the assistant chief statisticians (ACS), meets weekly. The day after each of these weekly meetings, each ACS shares the decisions of the Executive Management Board with the management team in their field. This team is generally made up of directors general, directors, and in some cases, assistant directors. Lastly, the directors share the information in
Statistics Canada – Catalogue no. 11-634-X122
Compendium of Management Practices for Statistical Organizations From Statistics Canada’s International Statistical Fellowship Program
meetings with the section chiefs who, in turn, inform their employees. If the management team has questions or concerns about the decisions or discussions presented to them, the ACS can share these with their Executive Management Board colleagues, who may then wish to review certain matters.
The intranet site is the internal network for employees. It contains a myriad of information about the agency, its programs, policies, directives and guidelines, human and financial resources, administration, and major internal initiatives. For complete transparency and efficiency, the intranet site also includes the list of management committees, their mandate and members, and the minutes of all meetings. Modules such as the Chief Statistician’s Corner are very popular. This module houses presentations made by the chief statistician, as well as reports or documents he presents or discusses at institutional events or official meetings. The intranet site also provides employees with access to the Self-service Hub. This administrative procedure hub is organized into four sections: matters pertaining to employees (Time Management System, training, travel requests, etc.), project management (translation requests, service-provider contract management, IT service requests, travel authorization requests, etc.), employee supervision (performance management, supervisory tools and techniques, etc.) and, lastly, the workplace (office supplies, emergency services, repairs, cleaning, temperature, etc.).
Electronic information bulletins are transmitted regularly. An electronic bulletin entitled Weekly info is sent by Communications to all employees on Thursdays. It includes all information about initiatives, changes in policies or directives, training and seminars as well as news for the coming week. Distributing this kind of newsletter is considered a best practice since employees receive all the information in a single email. Other email messages may be sent directly by the chief statistician to all employees when very important changes are made or senior managers are appointed.
In addition, the agency publishes @StatCan, its monthly internal newsletter for employees. This publication is considered to be the in-house newspaper. Built around a variety of well-developed in-depth articles, it provides information on events, programs, new initiatives, employees with special talents or any other information deemed relevant to employees.
Fields and divisions are encouraged to organize presentations to groups of employees at appropriate times. These presentations and discussions are led by directors general or directors and deal with specific topics, such as statistical data analysis, or with new internal or external program or service initiatives.
Furthermore, collaborative tools such as the Wiki are very popular and enable employees to discuss and share information and work together online to carry out projects or initiatives. This online collaboration encourages everyone to participate and promotes information sharing. It also offers the advantage of being flexible and efficient and leads to many more interested, engaged individuals working together. It is therefore an important alternative to email exchanges or long work meetings.
Events, conferences and symposia on technical and specialized topics are organized throughout the year and are open to employees, external partners and data users. For example, the annual Methodology Symposium is a highly regarded event, bringing together international methodology experts to discuss the latest developments, techniques, best practices and challenges.
To help employees to get better acquainted with policies, procedures, and guidelines, training sessions are held to give them the opportunity to ask questions and interact with specialists in the field.
Lastly, various meetings take place throughout the year. These meetings may be formal, including multi-field planning meetings, or rather informal, such as meetings organized by social committees to celebrate important dates in the year or special events.
2. Employee consultation and engagement strategies
Statistics Canada makes a point of planning and implementing consultation and engagement strategies aimed at getting employees to participate in setting their work unit’s objectives, choosing the activities or methods for implementing the program or service, and the implementation schedule.
In March of each year, the chief statistician gives his annual speech to the agency’s managers. This speech covers the major accomplishments of the previous year, and the challenges, opportunities and priorities of the coming year. The speech is followed by a question period. The meeting is broadcast live by videoconference and is accessible to all agency employees through the intranet site.

Statistics Canada – Catalogue no. 11-634-X 123
Section 2 - Core management practices Chapter 2.6 - Internal communications
The chief statistician meets with groups of employees to discuss specific topics related to data analysis, identification of possible data gaps, or improvements or changes to programs or services inherent to Statistics Canada’s mandate.
In addition to meetings with all managers or employees, the chief statistician meets informally with groups of employees at coffee sessions with the chief statistician. These sessions enable the chief statistician to connect directly with employees in order to take the agency’s pulse and to gauge the degree of internal engagement. The sessions are also occasions for employees to discuss ideas, opportunities and concerns, and to bring them directly to the attention of the head of the agency. All matters discussed at these sessions are presented to the Executive Management Board for consideration, discussion and possible decisions.
Every two years, Statistics Canada also holds the agency’s Middle Management Conference and Senior Management Conference. These annual events are an opportunity to discuss emerging issues, set new priorities, and establish action plans for implementing them.
Discussion groups and exchange tools, including the online forum, are very popular with employees, especially the Innovation Channel. This is a portal accessible from the agency’s intranet site that encourages innovation. It all began in March 2013 with the organization of the Big Ideas Conference, an internal event open to all employees. Regardless of their level, home division, or occupational profile, all employees can submit an innovative project (that meets predetermined criteria) to a jury made up of agency managers. Projects selected by the jury are published in the intranet module, the Innovation Channel. Employees are then invited to ask the project managers questions, to vote for the projects they prefer, and to follow the development and implementation of the ideas. This component of internal communications is a prime example of the importance of making the agency’s work employee-centred, of consulting employees, and of getting them to participate in identifying improvements to the agency’s programs and services.
Decisions are made in accordance with the governance structure, which promotes listening, consultation and evaluation of options and includes all stakeholders. In fact, discussions and consultations with experts are held for all new policies, standards, initiatives and program changes so that the options and associated risks can be explored.
Follow-ups with teams are done regularly by managers who supervise employees. These managers are responsible for following up with their team; for ensuring that their employees are adequately equipped and trained, and understand their responsibilities; and for supporting their employees in completing their tasks. Managers must also make sure that they keep their supervisor apprised of how their own work and their team’s work is progressing. This component is explained in detail in the chapter on management of human resources programs and services, and employee performance evaluations.
3. Evaluation and readjustment
Statistics Canada has established mechanisms for measuring the success of its internal communications programs and services in order to examine the current situation and make any necessary adjustments.
The Public Service Employee Survey is the main tool. This survey has been carried out every three years since 1999 at the request of the Treasury Board Secretariat.
The results show a solid degree of engagement and a high degree of employee satisfaction with their job at Statistics Canada.
The results of these surveys are presented and published on the intranet site. The overall results are also shared by the chief statistician with the entire staff and by each divisional director with their team. The highlights of the past year are evaluated as a team, and the points for improvement are discussed constructively in order to identify and implement agency-wide or divisional corrective measures, as the case may be.
Other mechanisms are also used, such as level of participation, level of feedback about events, and degree of compliance with policies and procedures.

Statistics Canada – Catalogue no. 11-634-X124
Compendium of Management Practices for Statistical Organizations From Statistics Canada’s International Statistical Fellowship Program
Key factors for successStatistics Canada aims to continually improve the effectiveness of its internal communications by leveraging the following key success factors:
Employees’ level of knowledge must be adequate and appropriate to their information needs for fulfilling their responsibilities and completing their tasks. The crucial element of internal communications is to ensure that relevant information is circulated using the appropriate, accessible vehicles so that employees have the information they need to effectively assume their responsibilities.
One of the biggest successes at Statistics Canada is the recognition and support by senior management and all employees of the importance of two-way communication, from the top down and the bottom up. The agency recognizes this to be a necessity and a responsibility of senior management for sound and effective governance for the benefit of one and all: the agency, senior management and employees.
Effective and credible communications are a strategic means to achieve organizational objectives and priorities. They are the foundations of the agency’s values and culture, which are good management, informed governance, transparency, respect and compliance with established rules, transmission of decisions, and finally, achievement of objectives.
Employee engagement and support make it possible to deal with change in a positive way, whether these changes are decided upon internally or imposed from outside. Change management and the deployment of transformation initiatives in the agency are based on internal information and consultation mechanisms, and especially on the trust and credibility capital built over time between senior management and employees. The greater the amount of solid capital, the better and faster the transformations are understood, assimilated and implemented. There is less resistance to change, and that resistance is weaker.
One last success factor is mixing both traditional and innovative technology-based participation mechanisms to encourage employee involvement. Statistics Canada’s Innovation Channel is one example of this.
Challenges and the futureIn conclusion, the mandate of internal communications is to ensure that
• everyone understands the strategic vision and directions
• everyone shares the organizational values and engagement culture
• employees are consulted and mobilize to move programs forward
• the work is completed on time and according to the rules in force
• employees are satisfied with their job
The challenge in fulfilling this mandate thus lies in the balanced pursuit of relevance: determining who needs what information when, using which means and which resources.
Knowing that internal communication needs are always important and demanding, priorities must be set, and there must be differentiation between what is mandatory and necessary, and what is less important and secondary. Lastly, communications must always be open and ongoing. This requires a good sense of judgment and anticipation while taking care to manage issues proactively before they become actual problems.

Statistics Canada – Catalogue no. 11-634-X 125
Section 2 - Core management practices Chapter 2.6 - Internal communications
Box 2.6.1 How is the Agence Nationale de la Statistique et de la Démographie of Senegal rehabilitating its internal communication operation?by El Hadji Malick GUEYE, Chief of the Dissemination, Documentation and User Relations Division, Agence Nationale de la Statistique et de la Démographie (ANSD) of Senegal
Internal communication is a critical link in every organization. Internal communications are sources of recognition, integration and promotion of a sense of identity around an ideal, project, vision or mission. The way group members perceive communications can profoundly influence the achievement of objectives, depending how well they are deployed.
Situation identifiedA diagnosis and ANSD employee satisfaction survey revealed a lack of clarity of the Agency’s vision and missions, a lack of understanding of some management decisions, poor understanding of regulatory texts, departmental silos, the absence of formal communication tools, no graphic charter, etc. The ANSD therefore undertook a revitalization of its internal communications.
Corrective measures put in placeWhile waiting for a more formalized internal communication strategy to be implemented, senior management initiated priority measures to improve the operational framework and focus all energies on the Agency’s objectives. These measures included
• systematic transmissions to employees of reports from directorate coordination meetings and summaries of Governing Board deliberations;
• regular coordination meetings expanded to include all ANSD senior personnel;
• publication of an internal newsletter;
• organization of a discussion and information-sharing meeting with all staff, broadcast live on the Internet so travelling colleagues and those in the regions could participate;
• creation of a suggestion box.
Results and positive changes observedEstablishing priority actions made the following advances possible:
• Inclusive participation and effective involvement of all officers, regardless of their level of responsibility, in determining the Agency’s strategic directions and priority projects.
• Decompartmentalization of branches and improved flow of information. All information related to the Agency is now accessible to all staff, in particular through the newsletter.
• Establishment of a more conducive dialogue framework with social partners, such as representatives of the union, the Collège des délégués and the Amicale des agents de Direction de la statistique.
• The creation of more direct expression frameworks (through information meetings open to everyone and the suggestion box), enabling all officers to express themselves freely regarding the Agency’s operation and to share their suggestions on working conditions.
Main risk factorsBelow are a few risk factors that should be avoided for the process to succeed:
• Avoid succumbing to the illusion that communication is the key to solving every problem.
• Ensure that staff do not think that this new dynamic or change is being imposed on them from above. This process must be done with and for the staff.
• Despite the urgency of certain issues and priority measures, avoid setting a pace that the staff cannot keep up with. Doing so could reintroduce a climate of misunderstanding and distrust.
• Reassure senior management regarding any disruptions in the chain of command that might occur, particularly given that communication has become more horizontal than in the past.

Statistics Canada – Catalogue no. 11-634-X126
Compendium of Management Practices for Statistical Organizations From Statistics Canada’s International Statistical Fellowship Program

Statistics Canada – Catalogue no. 11-634-X 127
Section 2 - Core management practices Chapter 2.7 - Information Management
Chapter 2.7 – Information Management
ContextInformation Management (IM) is the process of directing and supporting the proper stewardship of information in an organization for the complete life cycle of the information. Following good IM practices is important for any type of organization, including statistical agencies.
The main benefits are the following:
• Identify, document and preserve corporate information assets
• Facilitate information retrieval, and increase work efficiencies
• Improve knowledge transfer and corporate memory
• Reduce the amount of information retained, and keep only what is of business value
• Reduce the risk of information loss (resulting from a lack of documentation, less-than-optimal practices, or changing technologies)
Historically, information management was decentralized at Statistics Canada. Individual programs managed and maintained their own information, according to various standards, in numerous locations across the agency. This meant that information resources were not being fully exploited and that the agency incurred unnecessary costs and inefficiencies. Consequently, it has become increasingly challenging to manage the volume of information that is created and shared. This phenomenon is not unique to statistical agencies: it affects most public institutions. That is why governments, in general, have launched major information management initiatives.
Statistics Canada’s IM function is moving towards operating according to internationally recognized information management principles and practices, Government of Canada legislation, and management guidance provided by central agencies (namely the Treasury Board Secretariat). Statistics Canada has been progressively centralizing its information management, and has developed a strategy and a road map in support of this approach.
The Treasury Board Policy on Information Management defines general information management requirements for all information in the federal government. The objective of this policy is to ensure the efficient and effective management of information throughout its lifecycle. In Statistics Canada, this meant elaborating a policy on information management that established requirements for statistical data, supporting documentation, and administrative information. The main requirements of this policy are the following:
For the agency:
• Document decisions and the decision-making process for the purpose of supporting operations and accountability;
• Integrate information management requirements into the agency’s activities;
• Share information throughout Statistics Canada while respecting security and privacy requirements; and
• Manage information to ensure its relevance, authenticity, quality and cost-effectiveness for as long as the information is required.
For IM specialists:
• Plan, develop, monitor and evaluate IM strategies, practices and procedures; and
• Provide guidance, training and awareness on IM.
For all employees:
• Follow IM procedures with respect to the management of their information; and
• Document activities and decisions of business value.

Statistics Canada – Catalogue no. 11-634-X128
Compendium of Management Practices for Statistical Organizations From Statistics Canada’s International Statistical Fellowship Program
More specific requirements for the management of statistical data are provided in the Directive on the Management of Statistical Microdata Files and the Directive on the Management of Aggregate Statistics. These directives define the following:
• the length of time during which statistical data must be retained
• the documentation required to identify and describe the data.
Further information about statistical data management is provided in Chapters 4.3, 4.4 and 4.6, dedicated to access to metadata, access to microdata, and privacy and confidentiality, respectively.
Strategies, mechanisms and toolsStatistics Canada’s vision and strategy for information management is to “manage all information it collects and holds in an efficient and secure manner, which supports continuing provision of and access to high quality statistical information relevant to Canadian needs, while respecting the confidentiality of its data providers.”19
In terms of governance, Statistics Canada has implemented the following mechanisms:
The naming of the Information Management Senior Official (IMSO), who is a senior executive responsible for ensuring proper information management practices within the organization. At Statistics Canada, this role is given to an assistant chief statistician.
The creation of the Information Management Committee, which coordinates the management of the agency’s information assets, including its confidential statistical data holdings. The IM Committee is made up of directors from program areas and is chaired by an assistant chief statistician.
The creation of an Information Management Division which supports the information management requirements of the organisation and supports the IM Committee. It provides advice on best practices and standards related to IM within the agency and coordinates the implementation of IM strategies and methods to better manage IM processes. For a few years, funding has been received to support an Information Management Secretariat (IMS). Its responsibilities include the development of information management (IM) strategies, policies and procedures.
The development of a network of IM delegates, which serves as the primary link between the IM Secretariat and the program areas.
Statistics Canada provides a number of services and tools to facilitate information management:
Statistics Canada Library
Over the years, the library has acted as an IM repository of all final publications (paper and electronic publications). The library provides a wide range of services and resources that support the information and analytical activities of program and service areas in Statistics Canada. These are offered through the library website and include the library catalogue, bibliographic acquisitions, interlibrary loans, research services and electronic resources. The library provides training to employees, researchers and analysts in the use of electronic databases and resources, and compiles customized literature reviews.
Document Management Centre
The Document Management Centre (DMC) provides information management services relating to unstructured information within Statistics Canada. Services include receipt, classification, storage and retrieval of paper documents and electronic files. The DMC also provides advice and research services related to recorded information in its custody. The DMC serves as liaison between Statistics Canada and Library and Archives Canada for the preservation of historical documentation. As information management requirements are increasing, a new solution is examined to meet a large set of requirements.
19. Statistics Canada’s Strategy for Information Management

Statistics Canada – Catalogue no. 11-634-X 129
Section 2 - Core management practices Chapter 2.7 - Information Management
E-mail Transformation Initiative
The Email Transformation Initiative (ETI) is a Government of Canada project to replace the email systems of 43 federal organizations with one common system. Government-wide, it will save money, increase email security, simplify the government employee directory and enhance service delivery to Canadians.
The ETI provides:
• a standardized personal email address that public service employees retain for their entire career with the federal government;
• a common email system that facilitates the coordination of meetings and communication between federal organizations;
• a secure and consistent email system that makes it easier for Canadians to contact government employees and access government programs and services; and,
• up-to-date technology that addresses and standardizes over 300 security requirements and provides greater privacy protection.
Awareness and training
Information management awareness among employees is all about identifying and managing Information Resources of Business Value (IRBV). IRBV means published and unpublished materials (including email messages and attachments) created or acquired because they enable and document decision-making in support of programs, services and ongoing operations, and support departmental reporting, performance and accountability requirements. IRBV applies to three types of information: Email, Data and Other material.
Email, including its attachments:
• provides background on, or an explanation for an issue
• raises an issue and provides the solution to it
• provides official feedback, and
• grants official approval.
Emails are part of Statistics Canada’s official records and employees are responsible for maintaining these official records.
Employees are expected to regularly clean their email box and keep only:
• Information still useful for project decision making, program operations or service delivery
• Final instructions or procedures
• Accounts of the Agency’s business activities
• Decisions involving financial and legal matters
• Records of how and why specific decisions were made
• Emails containing information that should be part of the corporate memory
• Emails required for an active Access to Information and Privacy request
Brochures and fact sheets including best practices are available in the Intranet website to help employees manage their email box. Specific training sessions are offered including Managing your Email at Statistics Canada or Recordkeeping for public servants. Finally, a restriction on email and mailbox sizes has forced some behavior changes and helped identify new information management best practices.
Data
Information about various services and mechanisms relating to information management of statistical data is provided in the following chapters of this compendium:
• Management of microdata access programs—Chapter 4.4

Statistics Canada – Catalogue no. 11-634-X130
Compendium of Management Practices for Statistical Organizations From Statistics Canada’s International Statistical Fellowship Program
• Management of metadata access—Chapter 4.3
• Management of the website—Chapter 4.1
• Management of other specific information access programs, including disclosure control and record linkage—Chapter 4.6
Other material
Other published and unpublished IRBV material include:
• document decisions (e.g., minutes of meetings, approved project documentation, etc.)
• support programs, services and ongoing operations (e.g., feasibility studies, stakeholder reports, methodological reports, questionnaires, user guides, analysis reports, contracts, policies, service level agreements, work plans, etc.)
• support departmental reporting, performance and accountability requirements (e.g., financial reports, performance reports, Departmental Performance Reports, internal audit reports, etc.).
Until the implementation of the Government of Canada’s official electronic document and records management system (GCDOCS), this material is expected to be saved in a corporate repository for electronic documents, such as the Document Management Centre, a shared drive or administrative and financial systems.
Key success factorsCommunication to ensure awareness of employees’ responsibilities is key to the development of a culture of managing information. Employees are continuously encouraged to understand and fulfil their IM responsibilities to support business outcomes.
Senior management’s support and engagement are also critical to sustain the IM strategy and enhance general awareness of its importance. While there are tools to support an efficient management strategy, these tools are only relevant if they are used. Information management strategy usually requires a culture change that is difficult to maintain without management support.
Design thinking in the implementation of the information management tools is also important to ensure that processes are intuitive and not too burdensome to reinforce good behaviours.
Challenges Information management, vital as it is to the long-term functioning of a statistical agency, can be easily downgraded as an activity, because it may seem not to be essential to the production of current statistical output. Funding may need to be allocated to develop tools and structures to have an efficient information management strategy. However, the benefits in terms of efficiency may be difficult to accurately measure or they may materialise much later (through later cost avoidance for example). As information management is important but often not urgent, the proper balance must be maintained in the allocation of resources between ongoing operations and measures to preserve the intellectual capital and data holdings of the agency. This is a critical long-term survival issue.
Looking aheadStatistics Canada is implementing an Electronic Document and Records Management System (EDRMS) to replace the current Document Management Centre applications and to improve records management capabilities. The EDRMS is a standard information management tool provided to organizations within the Government of Canada. It is also developing new tools to modernise its current approaches to information management and search in a digital world.

Statistics Canada – Catalogue no. 11-634-X 131
Section 2 - Core management practices Chapter 2.7 - Information Management
BibliographyStatistics Canada (2010). Strategy for information management. Internal document. Accessible on demand.
Statistics Canada (2015). Directive on the Management of Statistical Microdata Files. Internal document. Accessible on demand.
Statistics Canada (2015). Directive on the Management of Aggregate Statistics. Internal document. Accessible on demand.

Statistics Canada – Catalogue no. 11-634-X132
Compendium of Management Practices for Statistical Organizations From Statistics Canada’s International Statistical Fellowship Program

Statistics Canada – Catalogue no. 11-634-X 133
Section 2 - Core management practices Chapter 2.8 - Program Evaluation
Chapter 2.8 – Program Evaluation
ContextProgram evaluation is a function involving the systematic collection and analysis of evidence on program outcomes. This function is crucial for a national statistical agency. It is used to evaluate program relevance and performance, to facilitate decision-making and to confirm or consequently adjust resource priorities and allocation in a national and international context of budget pressures. The evaluation function is a management best practice since it helps to continually improve the programs and processes used.
Above all, program evaluation is part of a sound management cycle that provides managers with information so that they can validate or adjust the programs for which they are responsible.
In Canada, this function is mandatory for all government departments and agencies. They must all comply with the requirements of the Treasury Board Secretariat, the federal central agency that oversees the evaluation function throughout the Government of Canada.
Program evaluation provides Canadians, parliamentarians, ministers, central agencies and deputy heads with an evidence-based, neutral assessment of resource optimization, i.e., the relevance and performance of programs. Specifically, evaluation
• supports accountability to Parliament and taxpayers by helping the government to credibly report on the results achieved with the resources invested in programs;
• informs government decisions, as well as those of managers of the statistical agency, on resource allocation and reallocation;
• supports deputy heads in managing for results by informing them about whether their programs are producing the outcomes that they were designed to produce, at an affordable cost;
• supports policy and program improvements by helping to identify lessons learned and best practices.
In Canada, several laws, policies and directives govern the evaluation function. The most relevant of these are the following:
Policy on Evaluation: Implemented by the Government of Canada’s central agencies20 to provide a coherent legal framework for all federal departments and agencies, the purpose of the Policy on Evaluation is to create a comprehensive and reliable base of evaluation evidence that is used to support policy and program improvement, expenditure management, Cabinet decision-making, and public reporting. The Policy also stipulates that all direct program expenditures must be evaluated every five years. To do this, an ongoing five-year organizational evaluation plan is prepared by each federal department or agency to determine the evaluation projects or programs planned for a given year.
Directive on the Evaluation Function: Developed by the central agencies, this directive aims to clarify the roles and responsibilities of departmental staff involved in evaluation so that departmental evaluation functions work effectively to support the evaluation information needs of Canadians, Parliamentarians, Ministers, central agencies and deputy heads. At Statistics Canada, stakeholders include the chief evaluation executive and its team, program managers and the Departmental Evaluation Committee chaired by the chief statistician.
In the interests of transparency, all government departments and agencies are obligated to publicly disclose on their website the summary results of their program evaluation reports.
It is important to add that at Statistics Canada, the program evaluation function is an impartial function not tied to any of the agency’s programs or services. The chief evaluation executive reports directly to the chief statistician and to the Departmental Evaluation Committee chaired by the chief statistician.
20. The central agencies refer to the Government of Canada’s federal agencies responsible for developing policies and common tools.

Statistics Canada – Catalogue no. 11-634-X134
Compendium of Management Practices for Statistical Organizations From Statistics Canada’s International Statistical Fellowship Program
Strategies, mechanisms and tools The process to develop and implement program evaluation at Statistics Canada is as follows:
• Form a Departmental Evaluation Committee chaired by the chief statistician and made up of assistant chief statisticians;
• Develop a five-year evaluation plan to assess all direct expenditures of statistical programs;
• Develop performance measurement strategies for the agency and its statistical programs;
• Evaluate how relevance, such as the degree to which a program meets the needs of program users, aligns with government priorities and complies with legislation;
• Evaluate performance, such as the achievement of expected results and demonstrated savings and efficiency;
• The Departmental Evaluation Committee and Departmental Audit Committee approve the evaluation reports and performance measurement strategies;
• Publish evaluation reports on the Statistics Canada website to respect the principles of accountability in accordance with the Access to Information Act, the Privacy Act and the Policy on Government Security. Information about these reports as well as the date of publication is shared in advance with the Minister’s Office;
• Provide a formal follow-up on recommendations and on the progress of action plans and reports to the Departmental Evaluation Committee; and
• Develop an annual report on the state of program performance measurement that supports evaluations.
The most relevant tools used to achieve the evaluation function are as follows:
The evaluation plan must be done every five years, in compliance with the requirements of the Treasury Board Secretariat, the federal central agency that coordinates the evaluation function across the Government of Canada. This plan must
• align with and support the departmental management, resources and results structure;
• include all direct program spending, excluding grants with the exception of subsidies;
• include all ongoing grant and contribution programs for which their department is responsible;
• include the administrative aspect of all major statutory spending;
• include programs that are set to terminate automatically after a specified period of time, if requested by the Secretary of the Treasury Board following consultation with the affected deputy head;
• support the requirements of the Expenditure Management System, including strategic reviews;
• identify and recommend a risk-based approach to the Departmental Evaluation Committee. In practice, this means that the risks associated with programs are taken into consideration and a program evaluation hierarchy by risk level is established;
• submit the departmental evaluation plan, as approved by the deputy head, to the Treasury Board of Canada Secretariat at the beginning of each fiscal year.
Performance measurement is fundamental, since it satisfies not only the requirements to improve programs, but also the necessity to prepare reports and be accountable for the organization’s performance. At the program level, performance measurement helps program managers to
• make informed decisions to ensure that their program outcomes are on scope and within budget;
• adapt to changing priorities;
• improve their performance reporting (internal and external);
• support the evaluation of their programs by providing a line of evidence.
The performance measurement system includes the four phases shown in Figure 2.8.1.

Statistics Canada – Catalogue no. 11-634-X 135
Section 2 - Core management practices Chapter 2.8 - Program Evaluation
Figure 2.8.1Four Phases of the Statistics Canada Performance System
Phase 1 consists of developing integrated approaches to ensure application and coordination of mechanisms, in order to operationalize and streamline performance implementation at Statistics Canada.
Phase 2 aligns Statistics Canada’s strategic outcomes (e.g., access to statistical data, relevance) with the expected outcomes (e.g., use of data by the Canadian population). Alignment of the strategic outcomes is based on the Program Activity Architecture. This structure establishes relationships between all services or programs that are comparable from one period to another. Once the strategic outcomes have been determined, the performance measurement strategies must be defined.
The objective of Phase 3 is to implement indicator feasibility tests. Working groups prepare and test different versions of an indicator. Feasibility testing can take more than one year before a final version is determined.
Lastly, Phase 4 consists of implementing the system at the data collection, monitoring and report production levels, in particular, departmental Reports on Plans and Priorities (RPP) and the departmental performance reports (DPR).
At the governance level, the mandate of the Departmental Evaluation Committee is to advise the deputy head on the departmental evaluation plan, resource allocation, final evaluation reports, and all other final decisions on other departmental evaluation activities. The Committee is chaired by the chief statistician and includes all the assistant chief statisticians and the Chief Evaluation Executive.
Key factors for successThe engagement and leadership of senior management as well as the ongoing participation and engagement of program managers ensure that the evaluation function has constant support within the agency.
In this vein, the evaluation function has the necessary human or financial resources to carry out its responsibilities.
Furthermore, the development of this function externally makes it possible to consolidate networking and share best practices with the evaluator community through the Treasury Board Centre of Excellence for Evaluation.

Statistics Canada – Catalogue no. 11-634-X136
Compendium of Management Practices for Statistical Organizations From Statistics Canada’s International Statistical Fellowship Program
ChallengesThe program evaluation function requires a solid understanding of the programs and their inner workings. For this reason, recruiting qualified professional evaluators is a challenge, particularly given the shortage in this specialized profile, as well as the requirements of certification and the bilingual profile. All program evaluators are members of the Canadian Evaluation Society (CES), which is responsible for implementing a professional development framework for evaluators.
The other challenge pertains to the program evaluation cycle: calibrating rotating program evaluations over five years, given the Policy on Evaluation, is a constraint to be managed alongside the expectation of program managers with regard to outcomes.
The evaluation function consists of continually ensuring that programs are relevant and perform well.

Statistics Canada – Catalogue no. 11-634-X 137
Section 2 - Core management practices Chapter 2.8 - Program Evaluation
Program evaluation: Example
Brief overview of the evaluation of the Canadian Health Measures Survey (CHMS) 2007/2008 to 2012/2013
Context and scopeThe CHMS is Canada’s first nationally representative survey of direct health measures. It was launched in 2007 to address long-standing limitations in Canada’s health information system. The principal objective of the CHMS is to collect new and important data on Canadians’ health status.
MethodologyThe approach used to evaluate CHMS can be defined as theory-driven and based on a non-experimental design using post-collected information. Findings are collected from multiple lines of evidence: document and literature reviews, administrative and financial data reviews, a series of key informant interviews, and a survey of primary data users. The evaluation efforts ensure an appropriate balance between the level of effort and the context.
Key findings
Relevance
The CHMS represents a unique program in Canada, providing direct health measures data to support health research, policy, and decision-making. Evidence shows that the program is relevant to Canadians and health organizations, with a clear present and future need for the program. Although most feel that the CHMS responds to current and emerging content needs, there was no content plan ever developed for the CHMS.
Performance – Effectiveness
The CHMS outputs have been produced as expected and the expected immediate outcome is being achieved: reliable and usable data are available on the baseline health status of Canadians, and on the level of, and exposure to environmental contamination. Some issues exist concerning the accessibility of the data, which could impair the long-term outcomes if not addressed. More specifically, even though most researchers are aware of the data, many are unaware of how to access them. This view is corroborated by external interviewees, who believe that the lack of—or complexity of—accessibility is a barrier to the use of the data.
Performance – Economy and efficiency
The shift from predominantly cost recovery to core funding of CHMS, as a result of the 2008 Action Plan, helped stabilize the survey, which had a positive impact on CHMS. In particular, it allowed for better long-term planning and for seeking opportunities to increase operational efficiency. The evaluation results demonstrated sufficient human and financial resources to support the program.
The CHMS is the only nationally representative direct measures survey in Canada and complements other Canadian and international studies. Therefore, there is no evidence of duplication of efforts that might influence efficiency.
Once the findings are revealed, recommendations are made for each finding that requires a change or an improvement by those responsible for the evaluation. The program then develops an action plan that follows up on the recommendations.

Statistics Canada – Catalogue no. 11-634-X138
Compendium of Management Practices for Statistical Organizations From Statistics Canada’s International Statistical Fellowship Program
BibliographyGovernment of Canada (2012). Policy on Evaluation. Consulted on the 31st of March 2016 and retrieved from http://www.tbs-sct.gc.ca/pol/doc-eng.aspx?id=15024.
Government of Canada (2012). Directive on the Evaluation Function. Consulted on the 31st of March 2016 and retrieved from http://www.tbs-sct.gc.ca/pol/doc-eng.aspx?id=15681.

Statistics Canada – Catalogue no. 11-634-X 139
Section 2 - Core management practices Chapter 2.9 - Internal audit
Chapter 2.9 – Internal audit
ContextInternal audit is an independent and objective professional evaluation function that employs a rigorous evidence-based approach. Its purpose is to evaluate and improve the effectiveness of the risk management, control and governance processes.
The objective of internal audit is therefore to help improve public sector management by providing a solid, credible, effective and viable internal audit function within departments and in the government as a whole. The end goal is to ensure the probity and good governance of public expenditures.
Internal audit provides added value by evaluating the risk management, control and governance processes and contributing to their improvement. It also helps the agency to effectively meet its objectives and make enlightened, ethical and responsible decisions.
Internal audit, like program evaluation (see Chapter 2.8), is part of a sound management cycle, helping provide managers with information so that they can improve the programs for which they are responsible.
Internal audit at Statistics Canada enables the chief statistician, as deputy head of the agency, to receive independent assurance and advice from the Departmental Audit Committee about the effectiveness of the risk management process and of the internal control and governance systems in place. The committee is made up of people who do not work for the Canadian public service. This assurance is provided by gathering evidence and conducting systematic, objective and independent analysis of that evidence. The results are then reported to management.
Several, laws, policies and directives are used to support the development strategies of the internal audit function and government priorities, in particular:
Policy on Internal Audit
This policy, developed by the Treasury Board Secretariat, the federal central agency,21 defines the breadth and scope of internal audit within the Canadian government. It also provides the framework of roles and responsibilities of those participating in internal audits within central agencies and within each department.
Directive on Internal Auditing in the Government of Canada
This directive assists in the effective implementation and support of the Policy on Internal Audit by identifying the mandatory requirements and providing direction
• in establishing appropriate responsibilities and qualifications for departmental chief audit executives;
• in relation to departmental internal auditing and reporting;
• on the role and responsibilities of the members of the audit committee;
• in relation to the membership and operations of the audit committee.
Internal audit is an independent function. The chief audit executive therefore has full hierarchical independence and answers directly to the chief statistician.
Strategies, mechanisms and tools usedImplementation of the independent internal audit process at Statistics Canada follows the steps below:
• Implementation of the Departmental Audit Committee, whose members are outside the Government of Canada;
• Development and implementation of a three-year risk-based audit plan;
• Creation of work teams with sufficient knowledge and qualifications to achieve the internal audit objectives;
21. The Treasury Board Secretariat is the Government of Canada central agency in charge of developing policies and tools common to all federal departments.

Statistics Canada – Catalogue no. 11-634-X140
Compendium of Management Practices for Statistical Organizations From Statistics Canada’s International Statistical Fellowship Program
• Development of internal audit frameworks and calibration of their scope to satisfy client needs;
• Conduct of audits and preparation of report recommendations by the Departmental Audit Committee for approval by the chief statistician;
• Publication of internal audit reports on the Internet in compliance with the Access to Information Act and the Privacy Act;
• Preparation by the chief audit executive of the annual audit report on governance mechanisms, risk management and internal control systems;
• Follow-up on recommendations and on the progress of internal and external audit action plans and Departmental Audit Committee reports;
• Observance and compliance with standards and professional rigour in conducting internal audits.
With respect to governance, the chief statistician, as deputy head of Statistics Canada, is responsible for establishing and maintaining an independent Departmental Audit Committee. Most members of this committee were recruited from outside the federal public administration. The Departmental Audit Committee is an essential component of governance and the internal audit regime. The role of the Committee is to formulate objective recommendations and advice for the deputy head regarding the relevance and functioning of the department’s risk management, control and governance frameworks and processes. The committee’s activities include promoting and providing advice on the recruitment and development of human resources needed to conduct statistical analyses, and providing advice on the methodological, IT and communication aspects of analytical activities at Statistics Canada. The Committee is also a forum for communication and mutual enrichment and makes recommendations on general analysis and development priorities across the agency.
The Committee meets in person three to four times a year, and holds two to three meetings by teleconference, if needed.
Key factors for successThe hierarchical independence of the chief audit executive and the creation of a Departmental Audit Committee made up of members external to the government consolidate the credibility and trust in the internal audit function.
Furthermore, because this function has the engagement and support of senior management, it receives the resources needed to fulfill its role and the associated responsibilities.
Achieving important mandates in a timely manner, while taking into account the resources available and targeting the greatest risks facing the agency, reinforces the importance and relevance of the function within Statistics Canada.
Lastly, external activities such as the establishment of partnerships, maintenance of interpersonal relationships, outreach with the audit community and support of the Comptroller General strengthen the function within the government and make it possible to share best practices.
ChallengesGiven the risks and manager expectations, the scope of audit is somewhat delicate to implement. Some situations can create a dilemma or uneasiness, since key messages must be communicated within a complex environment and information on improvements to be made to existing risk management and control processes is published externally.
The last challenge pertains to the difficulty of recruiting internal auditors, given the shortage of this profile in the labour market and the certifications and language profile required for staffing.
Looking aheadAudit is an assurance function for the Audit Committee and the deputy head. It aims to ensure that the key controls of an organization are adequate and effective. The important thing therefore is to be proactive and target the major risks, which in turn brings added value to the organization.

Statistics Canada – Catalogue no. 11-634-X 141
Section 2 - Core management practices Chapter 2.9 - Internal audit
BibliographyGovernment of Canada (2013). Policy on Internal Audit. Consulted on the 31st of March 2016 and retrieved from http://www.tbs-sct.gc.ca/pol/doc-eng.aspx?id=16484.
Government of Canada (2012). Directive on Internal Auditing in the Government of Canada. Consulted on the 31st of March 2016 and retrieved from http://www.tbs-sct.gc.ca/pol/doc-eng.aspx?id=25610.

Statistics Canada – Catalogue no. 11-634-X142
Compendium of Management Practices for Statistical Organizations From Statistics Canada’s International Statistical Fellowship Program

Statistics Canada – Catalogue no. 11-634-X 143
Section 3 - Improving, modernizing and finding efficiencies Introduction
Section 3 – Improving, modernizing and finding efficiencies
IntroductionOne of the key ongoing challenges of any statistical organization is to continually improve and modernize systems, processes and programs in the most cost-efficient way—while producing relevant, high-quality statistical information.
Given a growing, educated population, the global information society, and increased demand for statistics to better understand more complex societies, national statistical offices (NSOs) face pressures that go beyond the historical requirements of providing timely and accurate information. These pressures may include shrinking budgets, and declining survey response rates. In this context, and in the face of these challenges, NSOs must make significant efforts to modernize and improve their operational and management practices.
This section elaborates on the most relevant strategies used by Statistics Canada to ensure that improving, modernizing and finding efficiencies remain core priorities for the agency. There are two main goals to this section: (1) to establish the importance, for statistical agencies, of creating a business architecture that fosters integration, consistency, modernization and efficiency; (2) to draw a direct link between this business architecture and the major infrastructure components of statistical organizations with respect to information technology, data collection, and survey frameworks and tools.
Chapter 3.1 focuses on analyzing the Statistics Canada Corporate Business Architecture (CBA) initiative. In its ongoing pursuit of efficiency, the organization has instituted a permanent review of its business architecture (organizational structure, business processes and computer systems). This chapter provides details on the goals of this initiative, as well as the various strategies and practices that support an efficient organizational structure, common principles, and effective tools.
Chapter 3.2 analyzes how information technology (IT) can become a strategic enabler with respect to modernization. This chapter provides details on the important components of an IT-driven modernization strategy for statistical organizations, which includes the effective organization of IT services and resources, the IT alignment resulting from the Enterprise Architecture approach, the development of IT common systems and tools, and the integration of the IT component into corporate strategic planning.
Chapter 3.3 focuses on how surveys can benefit from integrated and harmonized approaches and tools. It provides an overview of the strategies used by Statistics Canada to enhance the conduct of business and household surveys.
Chapter 3.4 describes how a statistical organization can, in the context of modernization, improve the planning and management of data collection. This chapter outlines good practices with respect to collection planning and management that allow statistical organizations to gain efficiencies while improving the quality of the data collected.
Chapter 3.5 emphasizes the importance of acquiring, using and managing administrative data to improve the quality, relevance and efficiency of statistical information. The chapter provides specific examples of the ways in which Statistics Canada is progressively moving towards a model where administrative data are the primary source for producing statistical information.
Chapter 3.6, on gender statistics, presents a specific example illustrating how NSOs could become better aligned with policy makers’ needs by improving the statistical production process and the availability of policy-informing statistics. This example demonstrates the importance of including the gender perspective in the statistical process, as well as the strategies and tools adopted by NSOs to keep data relevant for policy makers and the general public. Gender statistics are used to demonstrate the importance of data relevance to the evolving needs of societies and economies.

Statistics Canada – Catalogue no. 11-634-X144
Compendium of Management Practices for Statistical Organizations From Statistics Canada’s International Statistical Fellowship Program

Statistics Canada – Catalogue no. 11-634-X 145
Section 3 - Improving, modernizing and finding efficiencies Chapter 3.1 - Corporate Business Architecture
Chapter 3.1 – Corporate Business Architecture
ContextA key ongoing challenge of any statistical organization is to produce relevant high-quality statistical information and products in the most cost-efficient manner. An important consideration is the structure of the organization’s business architecture. The term “business architecture” refers to business processes and rules, computer systems, and internal organizational architecture used to carry out the main business of collecting, analyzing and publishing statistical information.
To avoid the proliferation of too many local business solutions and to ensure efficiency, national statistical offices (NSO) should aim to increase the use of consistent, standardized and centralized practices.
The main goal of a Corporate Business Architecture (CBA) initiative is to make corporate decisions that will result in greater organizational efficiency, increased robustness of systems and processes, and in accelerated execution of new projects and programs. Through an initiative of this kind, the statistical organization creates common project-management tools and practices to build a smoothly functioning system of governance and approval processes to respond rapidly to new requirements and tighter budgets. Box 3.1.1. presents the objectives of a CBA.
Box 3.1.1Objectives of a Corporate Business Architecture
The continuing objectives of a Corporate Business Architecture initiative is to advance three objectives:
1) Efficiency – savings in ongoing operating costs that can be reinvested to maintain the continuity and quality of statistical and analytical programs;
2) Robustness – quality assurance through implementation of a reduced, unduplicated set of properly maintained and documented systems and processes; and
3) Responsiveness – improved responsiveness in the delivery of new statistical programs through streamlining of core business processes.
The CBA is a long-term organization-wide review of the business architecture in place at Statistics Canada. By consolidating processes and standardizing systems where necessary, an organization can achieve cost savings and still maintain the highest standards of quality, relevance and timeliness in the delivery of its mission and mandate.
In 2009, Statistics Canada created the Corporate Business Architecture Task Force to consider what measures could be taken in the short term in order to advance the objectives of the Corporate Business Architecture initiative while generating efficiencies in the short to medium term. The Task Force assessed the feasibility of achieving a 5% efficiency on the Agency’s operating budget through an improved business architecture and identified measures that would significantly advance the objectives of the CBA initiative. These efficiencies fund corporate investments to maintain the quality and relevance of the statistical program, helping the Agency to deliver:
• information that is relevant to the current, highest priority information needs;
• information that is of a quality that is sufficient for the uses to which it will be put; and
• information that is produced at the lowest possible cost.
The CBA initiative introduced a number of internal projects designed to foster an environment of integration and efficiency. The projects have defined goals and objectives that advance the implementation of Statistics Canada’s CBA principles and generate financial efficiencies to create a pool of corporate investment funding As a result, sufficient funds are available annually for the routine maintenance and periodic redesign of all corporate processes, systems, applications and infrastructure, as well as for the implementation of new classifications and standards and for survey redesigns. This ensures the continuity and quality—and, to some degree, the relevance—of the current statistical program.

Statistics Canada – Catalogue no. 11-634-X146
Compendium of Management Practices for Statistical Organizations From Statistics Canada’s International Statistical Fellowship Program
Strategies and toolsThis section describes the strategies and the tools used by Statistics Canada in the implementation of the CBA initiative: (1) adoption of key corporate business architectural principles, (2) implementation through an integrated approach and strategic planning, (3) alignment of organizational structure to modernization goals, and (4) strong leadership and effective governance.
1. Adoption of key Corporate Business Architecture principles
CBA starts with a clearly articulated vision based on well-defined principles (see box 3.1.2).
Box 3.1.2Corporate Business Architecture Principles
− A shift in culture and governance to emphasize optimal decision making (corporately rather than locally)
− Creating metadata at the beginning of every process and using them throughout the project life cycle
− Optimizing the use of corporate services, such as informatics, methodology support and frame infrastructure, collection, data capture and imaging, statistical processing, public inquiries, and dissemination
− Utilizing the smallest-possible number of distinct business processes and computer systems
− Minimizing the number of software programs and tools used to support business processes, and creating more generalized systems
− Providing and encouraging widespread training on corporate business applications and tools
− Creating a strong statistical information management framework to manage statistical information holdings in a more systematic way
− Eliminating duplication of effort by examining and redefining business processes
− Focusing on Statistics Canada’s core business (developing, producing and disseminating statistical information and analysis)
− Teams responsible for the development, or for the substantial redesign, of statistical programs are separated from those responsible for ongoing operations
− Expanding the use of multimodal data collection and e-questionnaires, with a view to making electronic data reporting the initial mode of collection, as the first step of contact in a sequential multi-mode environment
− Realigning the organizational structure to promote efficient operations
2. Implementation through an integrated approach, project management and strategic planning
The Integrated Strategic Planning Process (ISPP) (see details in Chapter 2.2 – Integrated strategic planning) is used to decide which of the submitted transformational CBA projects should receive investment funding from the organization. Managers were asked to identify the multi-year funding requirements as well as specify exactly how and when the monetary savings (or any other efficiencies) would be generated. Once approved, the various areas throughout the organization responsible for the projects received the required investment funding, but were also accountable for providing the monetary savings back to the organization according to a specified timeline.
An important incentive for managers in bringing forward these types of projects has been that all of the efficiencies generated through this initiative are re-invested back into the organization to maintain and/or improve the continuity and quality of ongoing programs. The overall goal was to generate cumulative efficiencies representing 5% of the agency’s ongoing operating budget. Investments in CBA projects are financed as the first priority in the annual ISPP.
The ISPP ensures that all CBA projects, continuity and quality maintenance initiatives, and new initiatives undergo a review to ensure they are compliant with CBA principles and aligned with corporate priorities. To facilitate prioritization and decision making, Statistics Canada assesses projects in the context of its strategic framework of management pillars: relevance, trust (including quality, confidentiality and objectivity), access, and stewardship.

Statistics Canada – Catalogue no. 11-634-X 147
Section 3 - Improving, modernizing and finding efficiencies Chapter 3.1 - Corporate Business Architecture
This strategic framework, which is supported by governance, risk management and human resources, is critical to the ongoing success of the organization and is an important communication tool to engage the public and stakeholders.
At Statistics Canada, the Information Technology (IT) Enterprise Architecture served to support the CBA modernization initiative (see Chapter 3.2 – Information technology). Taking an “enterprise architecture” approach is most beneficial in creating an IT systems design overview for all business processes. In this way, the national statistical agency reuses proven solutions, promotes standards / technology trends, and maintains a clear understanding of how the IT systems link together. This architecture included the development of generalized systems to support processes in the Generic Statistical Business Process Model (see figure 3.1.1). The Generic Statistical Business Process Model (GSBPM), developed jointly by the United Nations Economic Commission for Europe, EUROSTAT, and the Organisation for Economic Co-operation and Development, was used to guide the implementation of the CBA initiative.
Figure 3.1.1Generic Statistical Business Process Model
3. Alignment of organizational structure with modernization goals
The organizational structure should be reviewed to ensure it is aligned to effectively and efficiently deliver on agreed-upon modernization goals. The emphasis must be based on corporately (rather than locally) optimal decision-making. Senior management should not be reluctant to change the organizational structure to deliver on its objectives. Business functions should be consolidated if necessary to promote efficient operations (e.g., centralized IT, methodology, collection, processing). The use of corporate services such as informatics, methodology support and frame infrastructure, collection services, data capture and imaging, statistical processing and dissemination should be optimized to create centres of expertise. Clear roles and responsibilities should be established and communicated.
The practice of having a chief IT and methodology architects to guide the modernization and governance of common tools / platforms is another key success factor. Statistics Canada has found that centralized informatics staff reporting to one overall branch manager reinforces the strategic direction, maximizes the potential for efficient IT development and operations, and enhances the ability to set and support modernization priorities (see Chapter 3.2 – Modernization of information technology and informatics services).
Statistical methods were also reviewed and approved by the methodology service, which also plays a leadership role in promoting common methodologies.

Statistics Canada – Catalogue no. 11-634-X148
Compendium of Management Practices for Statistical Organizations From Statistics Canada’s International Statistical Fellowship Program
4. Strong leadership and effective governance
A strong and visible senior-management governance model is essential to ensuring the success of modernization initiatives. Governance must centre on decision-making in support of corporate or horizontal (rather than local) modernization solutions / services. This approach supports efforts to align with the organization’s priorities, efficient resource allocation, and management. The creation of a CBA Steering Committee, whose membership comprises senior-level managers from across the organization, is strongly recommended to provide ongoing support and direction to modernization initiatives.
A key role of this committee is to make recommendations to the highest governing body regarding modernization priorities and investments. To be most effective, the CBA Steering Committee should provide strategic direction, prioritize organizational investments, challenge proposals (especially to confirm the level of efficiencies), monitor progress, be consulted for advice, and propose recommendations to the overall governing body for approval. In addition, such a committee should represent all program areas within the organization. CBA champions (to be appointed) chair the steering committee. These champions should be senior officials representing different business lines (e.g., one representing a subject-matter sector and another representing a service area). The Steering Committee should meet on a regular basis (e.g., every two weeks). Experience shows that an organizational unit (secretariat), with assigned staff, can have a useful role in supporting the CBA Steering Committee. All new projects should be prioritized and aligned with modernization goals and a modernization vision, and should be approved by a business-line senior-management committee before proceeding to the CBA Steering Committee.
Statistics Canada created a senior-management committee co- chaired by two Assistant Chief Statisticians, reporting to the Executive Management Board (chaired by the Chief Statistician), with a mandate to drive the initiative forward, develop the general plan, review and approve specific initiatives, monitor progress, and assess and capture efficiencies. Key to the success of this modernization committee (the CBA Management Committee) were the following: that its membership comprised managers from all sectors within the organization, that it was co-chaired by two assistant chief statisticians, and that it held regular (bi-weekly) meetings. Having direct access to the Chief Statistician and the Executive Management Board ensured that barriers impeding progress were quickly discussed and acted upon. The CBA Management Committee, working in collaboration with the Information Technology Architecture Committee, had the following responsibilities:
• explicitly identifies the processes and systems that constitute the corporate business architecture, of to reduce the number of processes and systems maintained by the agency
• recommends to the Executive Management Board that additional corporate systems be developed or that existing corporate systems be extended—this is to permit further reductions in the total number of systems
• oversees the development of business requirements for new corporate systems, challenges those requirements, and approves them—for the greatest possible standardization
• develops, and recommends to the Executive Management Board, an approach to change management with respect to corporate processes and systems that aims to better control development and maintenance costs
The ISPP governance model for new business proposals was introduced at Statistics Canada in 2009 (see Chapter 2.2 – Integrated strategic planning). The governance model included a high-level review of informatics, methodology, data collection and subject-matter requirements by appropriate internal committees, including field planning boards for each major sector of the organization. Recommendations were made to the CBA Management Committee, and the Senior Management Review Committee gave the final approval as part of the annual ISPP.
A small secretariat was also created to support the initiative and the ongoing work of the CBA Management Committee. The role of the Corporate Business Architecture Secretariat (CBAS) was to provide strategic analysis, coordination and secretariat functions to the Committee. In conjunction with the Information Technology Architecture Committee, the CBAS reviewed the development of business requirements for new corporate systems and challenged those requirements. The CBAS reviewed requests for new development projects and systems, and provided guidance to the CBA Management Committee regarding project review and decision making. The CBAS also provided training and support to help managers understand how the approved corporate business architecture pertained to their projects, and worked in partnership with all sectors of the organization. Another key role was to communicate CBA initiatives and best practices to managers and staff at all levels through

Statistics Canada – Catalogue no. 11-634-X 149
Section 3 - Improving, modernizing and finding efficiencies Chapter 3.1 - Corporate Business Architecture
presentations, the internal communications network, town hall meetings, emails to all staff, etc. In addition, the CBAS monitored the implementation of approved plans through project status reporting. It also identified risks to the overall initiative and risks with respect to achieving planned efficiency targets, and proposed mitigation strategies to the CBA Management Committee for resolution.
Key success factorsOverall, the CBA initiative drove change and modernization throughout the agency and provided incentives for innovation. The following recommendations are based on Statistics Canada’s experience in implementing the Corporate Business Architecture initiative. They reflect five important key success factors: (1) consultation and stakeholder input, (2) implementation approach, (3) project monitoring, and (4) human resources and training, and (5) communications.
1. Consultation and stakeholder input
There should be multiple mechanisms across the organization to generate / discuss innovation leading to modernization project ideas. The modernization steering committee should be a source of idea generation at the senior-management level. Management should create internal mechanisms to generate ideas for modernization projects. Opportunities to participate should be widely publicized so that employees can propose project opportunities and/or business process improvements. The creation of internal advisory committees should be considered, when appropriate; these committees could also be tasked with supporting modernization efforts and delivering modernization results. Depending on the nature of the modernization activities, it might also be important to create a forum for external stakeholder consultation and guidance.
2. Implementation approach
It is important to document the modernization vision in terms of change from the “as-is” (current) state to the proposed “to-be” (desired) state, and explain why it is important that change take place, so that this information can be clearly communicated to all interested persons. It is also imperative to develop a strategy for securing the necessary investments required to implement a modernization initiative. Converting the vision into a high-level plan that includes project / task descriptions, priorities, timelines, and resource requirements is critical. Responsibility must be assigned to project managers, so that they are accountable for the implementation of specific aspects of the vision.
Risks to the success of implementing modernization initiatives should be identified, and strategies to mitigate them should be assessed. The organization may want to consider introducing project risk registers and/or an organization-wide risk profile to document risks, mitigation strategies, and action plans, and to identify the managers responsible for implementing the mitigation strategies.
3. Project monitoring
It is recommended to develop a transition plan for migrating existing surveys into any new business process model or IT system. Spreading out the transition will distribute the workload and provide opportunities to learn from the transition of the first surveys or programs. Once all surveys and programs are migrated to common IT systems, planning the decommissioning of the old IT systems should also be part of IT plans. Decommissioning dates must be clearly communicated and agreed upon by the business-line owners. The decommissioning of systems will generate efficiencies that can be reinvested.
If an organization-wide project management framework is not already in place, guidelines and a project office are key tools for developing and implementing modernization projects successfully. As well, any project management framework should include a governance structure to approve projects as they move from stage to stage (idea generation, assessment, initiation, planning, execution, and implementation). The framework should also include processes to formally approve any changes to the initial baseline project parameters (scope, timeline, costs (including investments and efficiencies)—see Chapter 2.4, Project Management Framework).
Statistics Canada’s experience has shown that structured, standard and rigorous project management processes and templates are necessary to ensure greater efficiency in carrying out individual modernization projects. Cost,

Statistics Canada – Catalogue no. 11-634-X150
Compendium of Management Practices for Statistical Organizations From Statistics Canada’s International Statistical Fellowship Program
time and scope of each modernization project should be regularly monitored to validate the continued viability of the project. Project status reporting should be communicated on a regular basis through the senior-management governance structure. Baseline project parameters (scope, timeline, costs, issues, risks) should be established at the beginning of each project. This creates a reference for measuring progress and success.
The development and implementation of the Departmental Project Management Framework (DPMF) was a key tool for success (see Chapter 2.4 – Project Management Framework). At Statistics Canada, a departmental project management office was created to strengthen the project management skills of the agency’s managers and to provide technical advice and support to project leaders. Standard, structured and rigorous project management processes and tools were necessary to support successful completion of each individual modernization project and of the CBA initiative overall. Monthly status reporting to the CBA Management Committee for each project and the combined status of the portfolio of CBA projects was also a quick indicator of the current situation at any given time. Another key element is project gating —ensuring that senior-level approval is received before projects move to the next project management stage. This gating process takes into account whether the project is on time, within approved scope and cost. Changes, issues and risks are reviewed to ensure the project is on track. A change management process for individual CBA projects, and for all CBA projects as a whole, was implemented and aligned with the principles being followed and the tools provided by the project management office.
Risk analysis and risk management were also key success factors. Risks identified monthly by project managers were monitored through project dashboards and tracked through the use of a mandatory corporate-change, issues and risk-management tool. The CBA Secretariat conducted a risk analysis of CBA projects overall, and an overview of the risk analysis was presented to the CBA Management Committee quarterly. This information was also linked to Statistics Canada’s overall corporate risk profile.
4. Human resources and training
In the context of modernization, existing training programs should be reviewed. Training materials should be updated to reflect any new business processes, changes to the governance model, and other relevant information. Programs for training on new skills (for example: project management skills; common tools; and technical, methodological or IT expertise) should be developed if necessary (see Chapter 2.5 – Planning and Management of Human Resources).
Management should be aware that the organizational culture may need to be changed in order to realize modernization outcomes. To demonstrate the importance of specific initiatives, the organization could consider designating a senior manager as the modernization champion. The champion’s role would be to promote the modernization vision and goals and the benefits of modernization while communicating new developments or project achievements. Making senior managers accountable for the successful implementation of modernization projects can be reinforced through their performance agreements. This type of accountability results in the expectation that senior managers will demonstrate greater leadership in guiding their team throughout the execution of modernization.
5. Communications
A critical element in implementing this major change within Statistics Canada was to clearly articulate and state the vision, objectives, and key principles at the beginning of the CBA initiative. From the outset, the CBA initiative was clearly endorsed and supported by the Chief Statistician and Statistics Canada’s highest governing body, the Executive Management Board. The board conveyed a high level of commitment and determination to succeed, and strongly encouraged staff to embrace the initiative and work to move the agenda forward. One key to success was the provision of the five-year corporate vision to all staff from the beginning. Other important senior-management communication mechanisms included the Chief Statistician’s annual address to all staff, the Corporate Business Plan, regular updates to all managers, and presentations to stakeholders.
Communication to all employees about modernization goals, objectives and successes increases their awareness of the corporate direction and priorities. By being more aware of the long-term goals of the organization, employees will recognize the importance of their contribution to the achievement of these goals, and will feel a stronger sense of ownership in their daily work. It is particularly important to establish an ongoing communication strategy to share the impact and the progress of modernization activities.

Statistics Canada – Catalogue no. 11-634-X 151
Section 3 - Improving, modernizing and finding efficiencies Chapter 3.1 - Corporate Business Architecture
The content of the messages communicated to staff should be appropriate to the level of audience. For example, messages for senior managers may differ in content and in tone from those of grass-roots employees. Various communication mechanisms should be used to reach a larger audience. Modernization projects and objectives can be described in emails to all staff, mentioned in speeches by senior management, and presented by means of articles in an internal newsletter. It is important that all staff be aware that modernization will lead to improved statistical products and a more efficient work environment, even though the transition period may be difficult and stressful in some areas of the organization.
Key messages need to be developed and continuously communicated by senior managers. In some cases, messages may need to be repeated in order to ensure that they are clearly understood and to help sustain the momentum of the modernization. It is important to communicate and reward early successes during a modernization exercise. Doing so provides proof that modernization is feasible and may help convert those who are still reluctant to support the initiative. An award program could be considered to both reward and acknowledge employees who successfully complete modernizations initiatives.
Challenges and next stepsThe Corporate Business Architecture is an ongoing agency-wide review of Statistics Canada’s business architecture. By consolidating processes and standardizing systems where appropriate, Statistics Canada achieved cost savings while still maintaining the highest standards of quality and timeliness in the delivery of its mission and mandate.
The creation of an environment where the corporate interest prevails and touches all segments of the organization cannot be underestimated. At Statistics Canada, the most significant aspect was the initial culture shift from making decisions at a local level to accepting generalized solutions that are optimal at the corporate level. Communications about the reasons behind the change, how it may impact individuals or units, and how it can improve activities in the future must be continual.
Since most of the major projects were launched at the same time, with multi-year project plans, the use of common project management tools for the monthly monitoring and reporting of changes, issues and risks was key. It was also essential to review and approve these projects in the context of the ISPP and a ten-year view of the agency’s financial situation, since CBA projects generated the financial efficiencies required to maintain the continuity and quality of the statistical program. Major risk factors to the success of the initiative included interdependencies between the largest CBA projects, ensuring an adequate workforce with the appropriate skill sets for the modernization projects, and a heavier than usual workload during the modernization activities.
Implementing modernization of corporate business architecture successfully requires an organization-wide approach and senior management endorsement. Change creates stress for both employees who support change and employees who are uncertain of change. As described previously, building an awareness for the need for change, and making the case for change convincingly through repeated communication about the vision, end state and guiding principles helped smooth the way. It was also recognized that the implementation of change is a learning process—not everything proceeds as planned. Consequently, management must be willing to adapt and revise plans as circumstances change.
Significant change creates uncertainty as employees seek to come to terms with new processes and the learning of new skills. It was also vital to continually remind everyone to focus on the people element during the process of change. During this period of significant change, Statistics Canada relied on the flexibility and mobility of staff within the organization. It is very important throughout all stages of such a major transformation to encourage innovation in all aspects of the work, involve staff at all levels of the organization as much as possible, and listen to the concerns raised by staff.
That being said, culture change and the need to consult employees cannot be underestimated. People react differently to change: some naturally align while others passively resist. Change needs to be understood and managed in a way that allows people to cope effectively. Employees must come to understand the need for change, voice their concerns, be heard, and have a chance to be involved in the planning and implementation of change.

Statistics Canada – Catalogue no. 11-634-X152
Compendium of Management Practices for Statistical Organizations From Statistics Canada’s International Statistical Fellowship Program
Box 3.1.3High-Level Group for the Modernisation of Official Statistics
Statistical organizations worldwide are restructuring and modernizing the statistical production process in response to technological advances and the growth of digital information. These developments have significant implications for the structure and efficiency of statistical organizations, and play an important role in strategic decisions related to budget, human resources and corporate strategy.
In 2010, the Bureau of the Conference of European Statisticians (CES) established a high-level group to achieve strategic oversight and better coordination of developments among different groups and countries. Statistics Canada is a member of the High-Level Group for the Modernisation of Official Statistics (HLG-MOS), whose objectives are the following:
(1) to promote common standards, models, tools and methods to support the modernization of official statistics
(2) to drive new developments in the production and organization of official statistics and official-statistics products, while ensuring effective coordination and information sharing within official statistics and with relevant external bodies
(3) to advise the Bureau of the CES on the direction of strategic developments in the modernization of official statistics, and to ensure that there is maximum convergence and coordination within the statistical “industry”1
After developing the Generic Statistical Business Process Model (GSBPM), the Generic Statistical Information Model (GSIM) and the Common Statistical Production Architecture (CSPA)—for details on these generic models, refer to Chapter 1.3 – Following international standards and Chapter 3.2 – Modernization of information technology and informatics services—the HLG-MOS is currently focusing on the big-data trend.
In fact, the HLG-MOS has commissioned a number of activities to better understand the importance and impact of big data. A major international collaboration project, carried out in 2014, resulted in guidelines on privacy and partnership issues, a big-data quality framework, and the documented outcomes of a series of experiments to test big-data methods and tools. To support these experiments, a shared computing environment containing big-data sets and software tools—the “sandbox”—has been created in partnership with the Irish Central Statistics Office and the Irish Centre for High-End Computing.
1. UNITED NATIONS ECONOMIC COMMISSION FOR EUROPE

Statistics Canada – Catalogue no. 11-634-X 153
Section 3 - Improving, modernizing and finding efficiencies Chapter 3.1 - Corporate Business Architecture
BibliographyUnited Nations Economic Commission for Europe (UNECE). High-Level Group for the Modernisation of Official Statistics – wiki site. Consulted on the 11th of March 2016 and retrieved from http://www1.unece.org/stat/platform/display/hlgbas/High-Level+Group+for+the+Modernisation+of+Official+Statistics

Statistics Canada – Catalogue no. 11-634-X154
Compendium of Management Practices for Statistical Organizations From Statistics Canada’s International Statistical Fellowship Program

Statistics Canada – Catalogue no. 11-634-X 155
Section 3 - Improving, modernizing and finding efficiencies Chapter 3.2 - Modernization of Information Technology and Informatics services
Chapter 3.2 – Modernization of Information Technology and Informatics Services
Context Successful statistical organizations base their operations on a cost-effective, solution-focused infrastructure that comprises data and information services, processing and analysis capabilities, and the underlying network and computing structure. Information technology (IT) is a strategic enabler of all modernization activities, such as process automation, method innovation, and information- and data-management capabilities.
Desired IT transformation activities fall into two broad categories. First, the streamlining of investments and the focus of IT activities on a core set of technologies and applications will maximize operational effectiveness. Second, IT will promote innovative approaches to creating statistical value from data through powerful processing, analysis, and dissemination techniques.
IT modernization is a key component of the Corporate Business Architecture (CBA) transformation initiative carried out by Statistics Canada (for details, refer to Chapter 3.1 – Corporate Business Architecture). IT transformation involves platform standardization, data management, metadata-driven capabilities, and a centralized IT function.
This chapter describes the principles and the strategies behind Statistics Canada’s IT-driven modernization strategy, and illustrates how the agency was able to implement them in the transformation process.
Strategies, mechanisms and toolsAs Statistics Canada’s experience shows, a successful IT-driven modernization strategy consists of the following seven elements:
1. effective organization of IT functions and resources within the statistical office;
2. comprehensive enterprise architecture that provides the necessary framework to align IT infrastructure, technologies and services with the overall conduct of the statistical business;
3. use of common systems and tools;
4. effective management of IT security;
5. strong IT governance;
6. integration of IT planning into the overall strategic planning process; and,
7. comprehensive resource development strategy to ensure the availability of skilled IT resources over time.
1. Effective organization of IT functions and resources within the statistical office
In the context of modernization, a typical statistical organization will be required to perform some of the following IT functions internally:
• Client relationship management (CRM)—approach whereby client satisfaction is assured through effective service management and communication.
• Application development—delivery of new solutions and evolution of existing solutions, with a focus on quality, agility, and timely delivery.
• Operations (IT Ops)—Operation and support of integrated applications and infrastructure, including security, for production purposes.
• Infrastructure management—function typically merged with IT Ops, although the engineering and evolution (design / build) could be managed separately.
• Application portfolio management and project portfolio management—oversight (at a corporate IT level) of application portfolios and IT projects, including performance management.
• Platform and component services—development and evolution of “platform as a service” offerings, such as database hosting, application hosting, web hosting, data analytics and business intelligence services,

Statistics Canada – Catalogue no. 11-634-X156
Compendium of Management Practices for Statistical Organizations From Statistics Canada’s International Statistical Fellowship Program
and integration platform services; these services are responsible for the development and support of statistical components (at Statistics Canada, these are known as “generalized systems”).
• Enterprise Architecture—alignment of business and IT strategy and projects through the creation, development, and enforcement of principles, standards, and architectural frameworks in the areas of business, information, application, technology, and security.
The above IT functions are organized around one of two models (or a combination of the two). The choice of model will reflect the statistical office’s modernization strategy:
• Decentralized organization—under this model, the IT function is embedded in business units so that it can develop and support local solutions. This approach provides localized and customized solutions to the business units, but may lead to redundant solutions and inflexibility to meet enterprise priorities.
• Centralized organization—under this model, the IT function is centralized as an enterprise-wide service; it develops and supports solutions for all lines of business. Typical benefits include economies of scale, flexibility, and focus on enterprise, as well as line-of-business priorities.
• Mixed model—it is possible to have a combination of both models that includes embedded IT units creating lightweight temporary or exploratory solutions and a centralized group providing foundational platforms. This model is sometimes known as “bi-modal IT.”
As part of its CBA transformation, Statistics Canada created a centralized IT function serving the entire organization. Under this model, IT resources and software are considered corporate assets, and managed according to business priorities at the organization level. This was a shift from past practices, which involved a mix of core functions and extensively distributed IT functions embedded in the business.
Adopting this model provides economies of scale through the sharing of tools, IT practices, and capabilities across all business units; the organization thus avoids having local IT resources “locked” into specific business groups. IT specialists are deployed, in a flexible way, on priority projects funded through the Integrated Strategic Planning Process (for details refer to the Chapter 2.2 – Integrated Strategic Planning). This results in flexibility and in a more effective use of resources.
A potential risk of this approach is that the IT teams would no longer be closely connected to their business clients. In order to mitigate that risk, the IT function has created a clear line of IT business managers dedicated to each line of business (Field within Statistics Canada). Statistics Canada’s IT organization structure is shown in the below, in figure 3.2.1.

Statistics Canada – Catalogue no. 11-634-X 157
Section 3 - Improving, modernizing and finding efficiencies Chapter 3.2 - Modernization of Information Technology and Informatics services
Figure 3.2.1Statistics Canada’s centralized IT organization
As figure 3.2.1 shows, the client relationship management function and the application development function have been aligned with different business portfolios—Collection, Economic and Social, Corporate (Administrative) and Dissemination, IT Operations, and System Engineering. Key roles within these areas include the following:
• Line-of-business (field) IT manager—responsible for client relationship management and for management of application development and support
• IT Operations—responsible for desktop and infrastructure management (including partner management) and operations related to shared technologies (e.g., databases)
• Generalized Systems—responsible for shared statistical functions
• Integration Technology Centre—responsible for the integration platform and the service integration approach
• Enterprise Architecture—responsible for ensuring the alignment of business and IT strategies and projects through the creation, development, and enforcement of principles, standards, and architectural frameworks in the areas of business, information, application, technology, and security
• IT Project Office—responsible for IT project management, application portfolio management, and reporting activities
Each Field IT manager in Informatics works closely with his or her assigned line of business (Field) to manage the field’s application portfolio and to oversee IT project-execution and delivery. Field IT managers perform this function by maintaining close contact with their business clients through participation in the Field Planning Board of each business area. These planning boards serve as the fora in which members review and prioritize investment, project, and operational elements. Participation in these boards ensures responsive delivery of IT solutions, as well as their maintenance, to the business.
Using the matrix management approach and structure followed at Statistics Canada (see Chapter 2.1 – Organizational structure and matrix management), IT project delivery and operations are carried out by

Statistics Canada – Catalogue no. 11-634-X158
Compendium of Management Practices for Statistical Organizations From Statistics Canada’s International Statistical Fellowship Program
multidisciplinary work teams of IT specialists (with participation of business specialists and methodologists, as required). Each Field IT manager oversees a team of application development and support staff, with additional skills provided by cross-cutting IT functions, such as database hosting, system engineering, various technology centres (e.g., Microsoft, SAS, integration technologies), and generalized systems teams. The assignment of staff to project teams is a dynamic process based on project need and priority. A regular assignment-review process within Informatics, which involves Field IT-manager participation, helps make staffing decisions. Holding both weekly Field IT-manager meetings and special sessions addresses planning, technology, and operational needs, and to ensure ongoing alignment and integration.
2. Business–IT alignment—an enterprise architecture approach
In order to realize the benefits of the transformed IT organization, it is important that IT be aligned with the business and that it creates as much as possible, common solutions for common business activities across the range of business units (e.g., social statistics, economic statistics, national accounts, and census).
2.1 Generic modelsAn analysis model or framework sets out the relationship between the organization’s business activities and its IT function. The international national statistical office (NSO) community (through the High-Level Group for the Modernisation of Official Statistics) has created various frameworks and tools to assist statistical organizations in adopting an overarching enterprise architecture. An enterprise architecture will enable organizations to streamline their business, their information resources, processes and capabilities, and their application, technology and security architecture, and to better understand the interaction between these functions.
2.1.1 Generic Activity Model for a Statistical Organization (GAMSO)
The first model is the Generic Activity Model for a Statistical Organization (GAMSO). This useful framework can assist statistical organizations with analyzing their overall operations by factoring out common business activities and identifying solution opportunities.
Figure 3.2.2Generic Activity Model for a Statistical Organization
Source: United Nations Economic Comission for Europe, 2015b.

Statistics Canada – Catalogue no. 11-634-X 159
Section 3 - Improving, modernizing and finding efficiencies Chapter 3.2 - Modernization of Information Technology and Informatics services
The model shows the main business activities of the senior management of statistical organizations:
• Strategy and Leadership—the business activities related to how strategy is defined, how leadership and governance are performed, and how the various strategic relationships within, and external to, an organization are managed
• Capability Management—the business activities related to how continuous improvement and new opportunities or discontinuities (e.g., new systems development, research on big data) are identified, assessed, planned and implemented
• Corporate Support—the business activities relating to the operation of the organization as a business or enterprise, including management of Human Resources, Finance, IT, Information, and Quality
• Production—the business activities related to the continuous production of statistical products for stakeholders and clients.
2.1.2 Generic Statistical Business Process Model (GSBPM)
The Production activity area of the GAMSO has been elaborated as a reference process model, known as the Generic Statistical Business Process Model (GSBPM) (see figure 3.2.3). The GSBPM is a flexible tool for describing and defining the set of business processes and sub-processes needed to produce official statistics.
Figure 3.2.3Generic Statistical Business Process Model (GSBPM)
Source: UNECE, 2013a
2.1.3 Generic Statistical Information Model (GSIM)
Another useful tool is the Generic Statistical Information Model (GSIM). This model provides a standardized way to express (at a conceptual level) the information objects and their relationships in use within statistical production (see figure 3.2.4). This comprehensive model covers a number of domains within an agency. Perhaps the most familiar is the “Concepts” area, with its Variable, Concept, Unit and Population elements. Similarly, the “Structures”

Statistics Canada – Catalogue no. 11-634-X160
Compendium of Management Practices for Statistical Organizations From Statistics Canada’s International Statistical Fellowship Program
area relates to the structure of the data itself as it flows through production solutions and processes. The “Business” area addresses information objects representing elements of the program itself, such as Production Activity and Statistical Program. Finally, the “Production” area represents elements of the statistical production processes themselves, such as Process Step and Method.
The GSIM provides business and information architecture functions; it includes standardized “language elements” with which to describe the information structure at a conceptual level.
Figure 3.2.4Generic Statistical Information Model (GSIM)
Source: United Nations Economic Comission for Europe, 2013b
2.1.4 Common Statistical Production Architecture (CSPA)
Finally, the Common Statistical Production Architecture (CSPA) brings together these existing frameworks and introduces the new frameworks related to Statistical Services. The CSPA allows for developing a harmonized top-level description of the “system” of producing statistics aligned with the modernization initiative. In addition, the CSPA gives users an understanding of the different statistical production elements (i.e., processes, information, applications, services) that make up a statistical organization and of how those elements relate to each other. It also emphasizes commonality by providing a common vocabulary with which to discuss implementations. This approach enables the vision and strategy of the statistical industry, by providing a clear, cohesive and achievable picture of what is required to get there.2
2.1.5 Ideal Enterprise Architecture
The integration of these four models provides a vision of an ideal enterprise architecture for the process, evolution and transformation of statistical production and corporate operations (see figure 3.2.5).
2 UNECE, 2015a, p. 8–9.

Statistics Canada – Catalogue no. 11-634-X 161
Section 3 - Improving, modernizing and finding efficiencies Chapter 3.2 - Modernization of Information Technology and Informatics services
Figure 3.2.5Vision of the future
The top of the diagram shows the key process steps included in the GSBPM. Notionally, survey production proceeds along these steps. These steps can be grouped into the phases commonly found in software development lifecycles: a “design” phase (shown in yellow), a “build” phase (shown in green), and a “run” phase (shown in purple).
Within the “Design” phase, the goal is to have survey design activities use standard metadata and reusable process building blocks in design activities. Designers should have access to past metadata, reusable data assets, and design elements (documents, artifacts) in creating or modifying their survey. Surveys should use standard information services, such as registers, administrative data sources, and statistical attributes from other surveys, common questionnaires, and classifications. Standardized approaches to various methodological functions would include items frequently found in Statistics Canada’s Generalized Systems, including edit and imputation, and sampling.
Within the “build” phase, business and subject matter construction addresses the creation of collection instruments and other items using a common set of tools. Reusable technology building blocks, linked by means of an agency integration platform (the service-oriented architecture strategy), allow for creating new solutions or improving existing ones.
The actual production (operation) occurs in the final phase, the “run” phase, where solution components composed of platforms (e.g., collection) and information or task services operate together in an integrated fashion for delivering high-quality statistics efficiently and effectively.
One can apply this enterprise architecture vision to myriad components of the enterprise: the management of metadata, the use of digital workspaces, collaboration, the need for component-based approaches to assembling solutions, and the use of solution components from other statistical agencies. What is central to the enterprise architecture vision is that the business, subject-matter, methodology, operations, corporate, and IT functions all be connected in ways that reduce the silos in which they individually operate, and, in so doing, enable the delivery of more effective solutions.

Statistics Canada – Catalogue no. 11-634-X162
Compendium of Management Practices for Statistical Organizations From Statistics Canada’s International Statistical Fellowship Program
2.2 Statistics Canada’s Enterprise Architecture approachThe modernization process at Statistics Canada reflects the enterprise architecture approach. Statistics Canada’s enterprise architecture follows the CBA principles. As shown in Figure 3.1.1, the CBA transformation strategy includes the IT organization (see figure 3.1.1) as part of “Generic Services” and “Enabling Informatics Systems and Infrastructure.”
Statistics Canada also uses the GSBPM in the core of its CBA vision (the core set of process steps in the middle of the diagram). Governance and standardization efforts employ the GSBPM model as an analysis framework to identify possibly redundant applications that may be suitable for elimination. This model also serves to assess the degree to which survey productions areas have migrated to the standard applications, gaps, and plans needed to complete the migration (as directed by CBA).
The “Generic Services” component of the CBA, as illustrated above, focuses on common business activities associated with the Collect, Process, Analyze, and Disseminate elements of the GSBPM. By creating common business units to perform these activities on behalf of all survey areas, this model enables IT to create common solution platforms.
Statistics Canada also uses the GSBPM in its application portfolio management work to ensure that survey areas are using common platforms (with exceptions if warranted) and to plan future investment roadmaps. The CBA principles are applied as a basis for governance activities (as described in the governance section of this chapter).
2.3 Statistics Canada’s Enterprise Anchor ModelAs previously mentioned, the CBA transformation strategy focusses on standardizing and consolidating applications and operations in the IT area. Statistics Canada is using a common reference framework to categorize the applications and technologies in use. Statistics Canada’s Enterprise Anchor Model (figure 3.2.6) describes the structure and integration of services and components. It serves as a framework for the analysis, design, implementation, and management of these elements.
Figure 3.2.6Statistics Canada’s Anchor Model
The model consists of a series of layers:• An Infrastructure Layer—core infrastructure services related to storage, informatics, and infrastructure
security. In the Government of Canada, a government organization responsible for government-wide infrastructure (Shared Services Canada) provides these services. Email is included in this layer in the model, as a mail service hosted by Shared Services Canada.

Statistics Canada – Catalogue no. 11-634-X 163
Section 3 - Improving, modernizing and finding efficiencies Chapter 3.2 - Modernization of Information Technology and Informatics services
• A Core Technology Platforms layer—the various platforms that are part of the Technology Architecture
• A Core Information Services layer—the statistical and corporate information services used across the organization (e.g., registers, metadata and data management, information management, classifications management)
• A Core Statistical Services layer—common, shared statistical functions such as those found in Statistics Canada’s Generalized Systems (e.g., Banff E&I, G-SAM, G-Export, etc.). Creating reusable services can be a strong contributor to organization success.
• A Core Production Segments layer—platforms for the different solution segments supporting statistical production, including the collection platform, dissemination, business statistics processing, social statistics processing (common tools), and census. It also includes corporate services platforms used in running the business.
Statistics Canada uses this model to support its standardization activities and to maintain dialogue in the conduct of its statistical business. As illustrated in the organizational view (figure 3.2.1), there is a strong connection between the organization’s structure and responsibilities and the platform components (production segments) at the top of the model.
2.4 Integrating solutions and components—CBA service approachAs part of its CBA transformation activities related to IT, Statistics Canada embarked on a new integration approach that uses a common integration platform and a series of “plug and play” components, known as the CBA service approach.
This approach (known in the industry as a service oriented architecture or SOA approach) allows solution developers to create reusable components (such as the Generalized Systems) and assemble them into new solutions for business clients in flexible and powerful ways. The integration platform shields the solution developers from the details of integration and underlying infrastructure, and reduces the complexity of communications between these components. Statistics Canada has an Integration Technology Centre, which provides a single point of expertise and platform support.
3. Use of IT common systems and tools
3.1 Principles for designing generalized systemsStatistics Canada has developed a comprehensive set of generalized systems components over many years, as shown in the table 3.2.1. This suite of tools provides a rich library of statistical functions for use in all survey areas for different surveys and methodologies. The agency’s experience indicates that, when one embarks on the creation of reusable components, it is best to start building a library of tools that can meet the basic, most common functions of the national statistical office. The GSBPM should be used to determine which statistical production sub-processes can be automated. The next step is to determine the requirements from the data producer community. To meet these requirements, off-the-shelf software should be affordable, reputable, easy-to-use, documented and supported, and should have the built-in functions that the work requires, including mathematical and statistical functions, as well as data management and metadata management capacity.
It may be necessary to develop common systems for more complex statistical functions, such as the following:
• Data manipulation tools—moving data from one step to the next, manipulating files;
• Mathematical and statistical functions—stratifying, determining sample size, selecting a sample, editing, imputation, weighting, parameter estimation, variance estimation, disclosure control, data analysis, mathematical modelling;
• Automation of survey steps—data collection, coding; and
• Dissemination, archiving and retrieval.
Once the organization’s business requirements are clear, building a prototype will serve to determine how these requirements can be generalized to different situations and different applications. Lessons learned also illustrate

Statistics Canada – Catalogue no. 11-634-X164
Compendium of Management Practices for Statistical Organizations From Statistics Canada’s International Statistical Fellowship Program
how the “production” version of the software should be developed according to a set of standard programming protocols. This work should use shared utility functions, document the code applied, and follow a common naming convention for variables and modules. This encourages the development of single function re-usable modules rather than one large software program.
3.2 Sharing generalized systems across the organizationAligning generalized systems with processes or sub-processes of the GSBPM has not only facilitated their design and their integration into the data production process, but has also contributed to technology exchange worldwide. For example, various organizations have been using Statistics Canada’s generalized systems through a licensing system. Users include the U.K. Office for National Statistics, Italy’s National Institute of Statistics (Istat), the Australian Bureau of Statistics, the New Zealand Bureau of Statistics, the Croatian Bureau of Statistics, Lockheed Martin (United States), the U.S. Bureau of Labor Statistics, and the U.S. Bureau of the Census.
Table 3.2.1Generalized systems used in Statistics Canada
Name of Generalized System Description/Main functionalities Scope (social or/and business surveys)
G-Link Record linkage Social
G-Sam Stratification, allocation, sampling Business
G-Code Coding Social
Banff Edit and imputation Mainly business; has been used for social
CANCEIS Edit and imputation Social
G-Est Estimation and variance due to imputation
Business
G-Series Times series adjustment Social
G-Confid Disclosure control (confidentiality) Business
G-Tab Disclosure control and tabulation Social
G-Export (corporate tool) CANSIM table production Both social and Business
Component sourcing decisions should be made by considering “buy”, “borrow” and “build” options. If components are available for sharing with other agencies, this may provide a cost-effective way to build up a library of components. For example, Statistics Canada uses the Blaise platform (originally created in the Netherlands) for certain parts of its collection activities.
3.3 Technology standardizationTo manage its technology and application standardization, Statistics Canada has adopted a strategy based on the technology brick approach from Gartner, an information and communications technology research and analysis company. Under this approach, the organization expresses its standard for a given technology and develops a set of evolutionary roadmaps in a concise format. Each Technology Brick has two key pages: the strategy page and the roadmap page. Figure 3.2.7 shows an example of each.
The first row in the strategy page provides a technology baseline view—what is in use currently - and a forecast of what will be in use in two years and in five years.
The “technology lifecycle current state” view consists of a series of “states”:
• “Emerging” identifies technology that is new to the organization and is under evaluation.

Statistics Canada – Catalogue no. 11-634-X 165
Section 3 - Improving, modernizing and finding efficiencies Chapter 3.2 - Modernization of Information Technology and Informatics services
• “Mainstream” includes technology that reflects the current recommended or mandated approach.
• “Containment” indicates technology whose deployment is limited to specific uses only, either because it is a “boutique” or niche technology used in special cases or because it is on its way to retirement.
• “Retirement” indicates technology that is in the process of being decommissioned.
There is a natural flow through these technology lifecycle states—typically, a new technology shows up in “emerging” and is brought into Statistics Canada for evaluation. If it has important business value, it transitions to the “mainstream” state for use by all; if it is a special-purpose controlled-use technology, it moves to “contained.” As the technology or version ages, it moves from “mainstream” to “contained”; this will freeze the ongoing deployment of the technology in preparation for its move to “retirement,” where the technology is removed from service. It is important that these transitions be clearly communicated to business and IT participants, so that solutions dependent on these technologies are able to move to new versions or technologies in a planned manner.
Figure 3.2.7Technology Brick—Strategy page
The second page in the brick shows the plan for technology evolution for the specific brick in a roadmap format (see figure 3.2.8). The horizontal axis shows time in quarterly increments while the vertical axis shows technology names and versions. The letters in the cells indicate the lifecycle state of the technology at a particular point in time. In the example, one can see that a technology starts in “Emerging” with an “E” and then transitions through the states discussed in figure 3.2.8. The legend is shown at the top of the page. There will be one or more roadmap pages for a given brick according to the complexity of the brick.

Statistics Canada – Catalogue no. 11-634-X166
Compendium of Management Practices for Statistical Organizations From Statistics Canada’s International Statistical Fellowship Program
Figure 3.2.8Technology Brick—Roadmap page
Statistics Canada’s Enterprise Application Registry also manages this information, which records tombstone data for all applications and technologies in use, including dependencies. This information is used as the common reference point for the various parts of the governance process, linking together IT operations, application development, application and technology portfolio management, and enterprise architecture.
4. Effective management of IT security
As a statistical agency, it is critical to protect data provided in confidence, and in accordance with high standards. To ensure impartiality, it is also important that statistical indicators be protected until they are ready for general release to all. To ensure that critical survey and indicator results are provided in a reliable and continuous manner, it is important to protect the IT infrastructure from damage.
The following three elements are essential to effectively managing IT security:
1. ensuring confidentiality of the information
2. maintaining integrity of information at rest (e.g., in a database), as well as in transit (e.g., moving between different applications over the network)—Consider whether data can be intentionally or unintentionally modified without permission.
3. finding solutions to meet business needs (e.g., Consider whether IT management is running effectively).

Statistics Canada – Catalogue no. 11-634-X 167
Section 3 - Improving, modernizing and finding efficiencies Chapter 3.2 - Modernization of Information Technology and Informatics services
Effective IT security management requires a close partnership with the business. The business is responsible for determining the confidentiality of the information in compliance with agency and government standards. The business is also responsible for identifying business needs with respect to integrity and availability, e.g., the minimum tolerable solution outage in the event something goes wrong.
IT is responsible for providing user authentication and data protection functions in its software, hardware, and networks to meet those requirements. Key deliverables include user authentication (e.g., login controls), access control (e.g., ensuring that a user is authorized to access the data, typically through permissions), and reporting and logging (to identify intruders, report on incidents, and ensure overall operability of solutions). In the availability area, IT is responsible for ensuring that a robust infrastructure, with strong security protection features, is in place with sufficient performance and capacity to meet business needs.
An effective IT security solution depends on trained and skilled personnel, standard operating processes, clear identification of the sensitivity of data and information, a secure source of login and access permissions, and systems that integrate with these controls. For more information about IT security and other security measures taken by Statistics Canada, refer to Chapter 4.6 – Ensuring privacy and protecting confidentiality.
5. Adequate IT governance
The governance function is a critical success factor in realizing IT business outcomes with the organization and IT strategy. It consists of two components:
1. a set of principles, standards, guidelines, reference architectures, and frameworks consistent with the goals and elements of the strategy, and effective communication with and education for all stakeholders
2. an assurance function that ensures alignment with these standards through review of projects, activities, and designs; this must include approvals, exceptions, and performance management of the function itself.
An important consideration for effective IT governance concerns the guiding principles used for decision-making:
• Responsibility – the individuals and teams responsible for performing the IT business activities
• Accountability – the individual(s) and teams accountable for the results of the activities
• Authority – the individual(s) authorized to direct or modify activities, including initiation, acceptance, or cancellation.
These elements are aligned to maximize the benefit of the governance activity. They are interrelated, and work in harmony with each other to ensure that the organization can meet its goals. Ambiguity frequently arises, particularly in the aftermath of a centralization activity in which IT resources merge when the organization moves from a distributed model to a centralized core IT function. In some instances, clients may feel (or act as though) they have retained functional authority over certain IT activities, whereas this may actually be the case.
The success of the governance function also depends heavily on clarity about intended business outcomes, terms of reference, decision rights, as well as a clearly defined scope and the efficient flow of information. Statistics Canada strongly recommends an evidence-based approach. Relevant documents (e.g., design, specification, assessment) demonstrating compliance and alignment must be provided. This becomes especially important when one is dealing with external service providers (either within government or externally) and the challenges associated with different business mandates, multiple locations, and communications.
Ideally, the governance function is dynamic and accompanied by a high degree of transparency and organizational engagement. Success stories of “risks averted” or “solutions enabled” clearly show the value of the function. Compliance, itself, as a goal is rarely successful; compliance must be viewed as a means to a successful end, as examined in the IT and organization strategies.
Statistics Canada’s IT governance approach rests on a core set of considerations:
• Is there an overarching business transformation strategy to be followed (e.g., at Statistics Canada, this consists of the CBA and the CBA Service Approach)?
• Are there overarching concerns regarding the IT strategy within Statistics Canada or in the broader government context (such as mandated technologies)?
• Have appropriate trade-offs been made in deciding on technology diversity vs. additional cost?

Statistics Canada – Catalogue no. 11-634-X168
Compendium of Management Practices for Statistical Organizations From Statistics Canada’s International Statistical Fellowship Program
• Are there inherent risks with existing or proposed technologies?
• Is Statistics Canada ready to adopt these technologies, or will it be ready at a future date? Do these technologies help position the organization to be ready for changes (e.g., Big Data, increased use of administrative data, use of mobile technology for interviewers and consumers)?
Effective governance should have strategic performance measures that show its effectiveness in helping the organization attain its corporate business goals.
The IT governance forum at Statistics Canada is the Information Technology Architecture Committee (ITAC). The Director General of the Informatics Branch and the Chief Informatics Officer co-chair this committee. Its overall mandate is to ensure that IT systems are developed using sound architectural principles and a standard set of tools and methods, so they will meet the business needs of the organization and respect the IT security policies of both the organization and of the Government of Canada. ITAC carries out the following activities:
• serves as a forum on IT enterprise architecture, ensuring the strategic alignment of technologies, applications and processes to support Statistics Canada’s programs and priorities
• reviews, promotes and prescribes the framework of IT enterprise architecture, using technology bricks and systems roadmaps to maximize the re-use of generalized systems, common solutions, reusable components, and best practices;
• reviews and authorizes the transition plans for decommissioning redundant or obsolete solutions and technologies, taking into account system dependencies
• ensures that new IT systems being developed are compliant with standards by conducting technical and security reviews and by managing exceptions
• monitors key indicators for IT services (i.e., incidents and availability) from both the Informatics Branch and Shared Services Canada
• develops recommendations for referral to the Executive Management Board
Figure 3.2.9Statistics Canada’s governance structure
Figure 3.2.11 shows some of the management committees at Statistics Canada and the relative position of ITAC. Detailed technical and security reviews occur at subcommittees that report to ITAC and in the case of security, to the Security Coordination Committee. ITAC will review from an architectural and IT operations perspective the projects and solutions that have been approved by the CBA Management Committee (investment, project oversight) and other committees as required. Together, this ensures that Statistics Canada runs on a standardized set of platforms, technologies, and common statistical and information services, in support of CBA goals. As with all Government of Canada IT functions, Statistics Canada IT services also receive direction and guidance in the

Statistics Canada – Catalogue no. 11-634-X 169
Section 3 - Improving, modernizing and finding efficiencies Chapter 3.2 - Modernization of Information Technology and Informatics services
form of functional directives, action notices, and management accountability reporting requirements from the relevant central agency (Treasury Board Secretariat) and the organization in charge of providing government-wide IT infrastructure services (Shared Services Canada).
6. Integration of IT planning into Integrated Strategic Planning
Experience at Statistics Canada has shown that an annual planning process involving senior managers from across the organization (director-general level and above) is valuable in terms of reassessing the feasibility of, and the resources required for, both short- and long-term priorities. Every year, organizations should take account of information technology, and discuss and prioritize any adjustments to plans or resource requirements (see Chapter 2.2 – Integrated Strategic Planning).
An annual review process like this serves to ensure that current projects are adequately resourced and that the organization has the capacity to support priority projects, including the necessary IT resources. It is important to review priorities with senior managers across the organization with the aim of ensuring that human, financial and IT resources are aligned to support priorities and to discuss any reallocation of resources between areas. A multi-year plan with targets and outcomes should be established and monitored to reflect this alignment. Data on the effort in person-days or person-years required to conduct different processes is useful information for such planning.
Organizations should develop a long-term investment plan that takes into account the regular renewal of IT systems and redesigns for all major surveys. This will help maintain quality standards, as described in the technology bricks that make up the IT Roadmap. Given the cyclical nature of statistical work, and the need to refresh IT technologies over time, it is important to create and document plans for IT systems maintenance and enhancements over a 3 to 5 years period. IT development should be managed separately from ongoing operations (see Chapter 2.4 – Project Management Framework). Of particular importance, is a clear articulation of the future financial consequences of all IT activities. The expected duration and operating costs over the life cycle of a new technology must be well understood and documented before its introduction. In addition, one should consider the likely points in time when refurbishing or replacement is likely to be required and the estimated cost for this.
7. IT resourcing strategy
Given the IT-driven nature of statistical agencies, it is very important to have IT specialists who have knowledge of specialized technologies and are experienced in providing solutions to mitigate the different challenges of statistical production and innovation. This requires tight coupling between the technology and solution standardization efforts, noted above, and the development of specialist skills in the relevant areas.
Central to an effective IT workforce is a strong set of core values at the individual and team levels. The IT function needs to ask the following: “What are the guiding values or principles under which the work is performed and the mandate fulfilled?”
The essential values of an effective IT function include the following:
• Client focus – Ensure clients (partners) are effective in their work by providing reliable, high-quality, flexible, and timely solutions.
• Continuous learning – At both a personal level and an organization level, continuously improve, using research, market roadmaps, organization roadmaps, and learning sources in a multidimensional way.
• Teamwork – Recognize that the success or failure of solutions depends on multiple teams and spans analysis, design, construction, assembly and production.
• Cost-effectiveness – Ensure an optimum use of the resources to deliver solutions, avoiding waste through redundancy, low quality, and misalignment.
• Innovation – Ensure that you have a creative and curious team that looks for new ways and new opportunities and shares and encourages the expression, exploration and adoption of ideas of business value.

Statistics Canada – Catalogue no. 11-634-X170
Compendium of Management Practices for Statistical Organizations From Statistics Canada’s International Statistical Fellowship Program
In addition, the IT function needs to make effective use of permanent, full-time resources and contractors in order to meet business needs, such as agility, flexibility, and capacity. This capacity needs to be assessed on an ongoing basis to establish a balanced approach to developing, delivering, and supporting services.
A large full-time permanent workforce offers the benefits of continuity, control, and domain expertise, at the expense of headcount-related costs, which typically make up the majority of an IT budget. Most organizations contract external services as part of their operations, either to meet peak capacity demand (e.g., to conduct a census) or to address skills gaps in the organization. Contracts to address skills gaps should provide for a knowledge transfer component, if these skills are part of the long-term strategy. As a rule, the resourcing approach should focus on differentiating core business activities from internal resources; i.e., statistical production as opposed to corporate operations, unless the operations are key enablers for the business. The same discussion also applies to software as a service and to infrastructure as a service (public / private clouds).
A country’s national statistical office may also want to create a plan outlining human resources needs for the next five years, and link it strategically to the business plan. This plan should cover skills requirements, the need to recruit specialized staff, training, career advancement opportunities, and ways to maintain a positive workplace. Increasingly complex IT environments and security risks result in new staff training, development, and retention requirements.
Before implementing major changes, it will be important to carry out human resources capacity planning: How many and what kinds of staff are required, for each work location, to undertake large projects that have a fixed time period and to continue ongoing work? This involves carrying out a workforce analysis and creating targets for recruitment of new personnel, timing of retirements, and other potential departures (see Chapter 2.5 – Human resources planning and management). Widespread training on corporate tools and IT systems should be encouraged.
Key success factorsFrom the perspective of a national statistical office, an IT modernization initiative relies on two important success factors: (1) the creation of common processes, systems and tools, and (2) IT management practices that focus on corporate strategic planning and lifecycle management.
1. Creation of common processes, systems and tools
A key success factor in efficient IT management is the development of corporate generalized systems (for collection, processing, analysis, and dissemination). To this end, it is important to ensure that standard working procedures be developed for each business process and, if possible, that these be aligned with the GSBPM. Subsequently, common IT systems and tools should be created for multiple surveys. This maximizes re-use, and reduces the diversity of computer systems and applications that the national statistical office is required to support.
In allocating IT resources, modernization projects should have a high priority. The development of a transition plan for moving existing surveys into the new business process model is essential, and monitoring of this plan is required. Spreading out the transition over time will distribute the workload and provide opportunities to learn from the transition of the first surveys.
2. IT management practices focussing on IT lifecycle management
Statistics Canada has effective IT management practices in place to manage risks associated with aging applications and technologies. These practices are built on three pillars:
• a long-term investment plan, as part of its integrated strategic plan to support the changes required to maintain the continuity and quality of statistical programs, including refreshing IT technologies (software, hardware) before they become aging IT risks
• an ongoing process for application portfolio management that evaluates each application’s use, function, age, and technology risk. Inventorying and assessing the organization’s application portfolio provide an effective means of evaluating the business and technical value of applications and of making

Statistics Canada – Catalogue no. 11-634-X 171
Section 3 - Improving, modernizing and finding efficiencies Chapter 3.2 - Modernization of Information Technology and Informatics services
informed decisions about investments in the areas of risk and of greatest opportunity for both IT and business. Application portfolio management helps mitigate the risks associated with aging IT. It identifies which applications to keep, de-commission, or modernize. The continual updating of an application portfolio management system is essential to rationalizing the number of applications in use in the organization, and to informing decisions regarding the organization’s application de–commissioning plan. The application portfolio management supports both the organization’s enterprise architecture framework and the CBA principles.
• application retirement plan (known as System Roadmap) with target decommissioning dates for obsolete IT technologies that vendors no longer support or expect to no longer support in the future and for applications that become redundant once all surveys have migrated to the common solutions set out in the CBA. The lifecycle of each technology is documented as a technology brick.
Challenges and next stepsIT is always changing and evolving. This underscores the need to keep abreast of emerging technologies, methods and innovation. Pursuit of innovation in IT should be an essential part of a national statistical office’s strategy to respond with greater agility to emerging data needs of statistical programs. The issues faced by IT management in a national statistical office include the following:
• difficulty in managing competing priorities of clients
• uneven uptake of advances in technology
• no standardization of commonly-used survey functions
• proliferation of similar systems in a wide variety of technologies
Taking a CBA service approach addresses many of these challenges. However, implementation of such an approach is not without its own challenges. Here are some of the lessons learned from Statistics Canada.
1. Transition planning / decommissioning of legacy systems
Statistics Canada recommends a transition plan for migrating existing surveys to any new business process model or IT system. Spreading out the transition will distribute the workload more equitably and provide opportunities to learn from the transition of the first surveys. Planning the decommissioning of old IT systems, once all surveys are migrated to new IT systems, should also be part of the IT plans.
IT can lead, but senior management of the subject-matter divisions must commit to and support plans for the decommissioning. The vision in terms of the current “as-is” state and the proposed “to-be” state, along with the rationale for the change, should be documented, so that this information can be clearly communicated to all interested persons.
Decommission dates must be clearly communicated to, and agreed upon by, the business-line owners. The decommissioning of systems should generate efficiencies that the organization can reinvest to support, maintain and enhance new corporate IT systems. IT management should be proactive in developing and communicating a decommissioning plan for old systems, while new systems are being implemented.
Subject-matter business-line owners should play a key role in planning the decommissioning of disparate legacy systems as common solutions. The Informatics Branch should know and understand the following:
• Who are the owners? (both business-line and system owners)
• Who are all of the users of each system component?
• What data need to be kept or migrated? What data are to be archived or deleted?
• Where are the systems and data located? (mapping to servers)

Statistics Canada – Catalogue no. 11-634-X172
Compendium of Management Practices for Statistical Organizations From Statistics Canada’s International Statistical Fellowship Program
2. Balancing the need for standardization and innovation
Standardization and innovation are often viewed as natural “enemies”, and some feel that a strong focus on standardization stifles innovation—or that innovation can lead to ad hoc and chaotic approaches. To avoid this pitfall, it is very important to identify how innovation and standardization complement one other. Standardization is an important tool for creating cost-effective organizations, which, in turn, can free up more resources for innovation. Innovation can evolve to become future standards, as organizations experiment with new ways and new technologies to determine their use. Innovation should focus on new ideas with good business-value potential—ad hoc approaches to basic technology and practices should not be confused with high-value innovation. Organizations can provide a stable, standardized platform for exploring and evaluating innovative ideas, which can lead to projects that will implement a new approach.

Statistics Canada – Catalogue no. 11-634-X 173
Section 3 - Improving, modernizing and finding efficiencies Chapter 3.2 - Modernization of Information Technology and Informatics services
BibliographyGartner (2006). Enterprise Technology Architecture PowerPoint Templates. Gartner document no. G00144188. Consulted on the 11th of March 2016 and retrieved from https://www.gartner.com/doc/498997/toolkit-enterprise-technology-architecture-powerpoint
United Nations Economic Commission for Europe (2013a). Generic Statistical Business Process Model v.5.0. Prepared by the High-Level Group for the Modernisation of Official Statistics. Consulted on the 11th of March 2016 and retrieved from http://www1.unece.org/stat/platform/display/GSBPM/Generic+Statistical+Business+Process+Model
United Nations Economic Commission for Europe (2013b). Generic Statistical Information Model Version 1.1. Prepared by the High-Level Group for the Modernisation of Official Statistics. Consulted on the 11th of March 2016 and retrieved from http://www1.unece.org/stat/platform/display/gsim/Generic+Statistical+Information+Model
United Nations Economic Commission for Europe (2015a). Common Statistical Production Architecture v1.5. Prepared by the High-Level Group for the Modernisation of Official Statistics. Consulted on the 11th of March 2016 and retrieved from http://www1.unece.org/stat/platform/display/CSPA/CSPA+v1.5
United Nations Economic Commission for Europe (2015b). Generic Activity Model for Statistical Organizations Version 1.0. Prepared by the High-Level Group for the Modernisation of Official Statistics. Consulted on the 11th of March 2016 and retrieved from http://www1.unece.org/stat/platform/display/GAMSO/GAMSO+Home

Statistics Canada – Catalogue no. 11-634-X174
Compendium of Management Practices for Statistical Organizations From Statistics Canada’s International Statistical Fellowship Program

Statistics Canada – Catalogue no. 11-634-X 175
Section 3 - Improving, modernizing and finding efficiencies Chapter 3.3 - Enhancing how surveys are conducted
Chapter 3.3 – Enhancing how surveys are conducted
ContextThe mandate of a National Statistical Office (NSO) is to provide quality statistical information on, and analysis of the country’s economy and society. While the use of administrative data is widely recognized as a cost-effective option to obtain quality information while minimizing response burden when appropriate (see Chapter 3.5 – Acquisition, use and management of administrative data), NSOs still need to conduct an important number of surveys to provide information not available through administrative records.
In the last decades, NSOs have been facing considerable challenges, such as budget pressures, declining response rate, increased collection costs and evolving technology: factors that a statistical agency must consider to continually improve and modernize the way surveys are conducted.
In the context of improving and modernizing the corporate business architecture (see Chapter 3.1 – Corporate Business Architecture) or Information Technology (see Chapter 3.2 – Modernization of Information Technology and Informatics Services), NSOs also have to consider strategies and tools, and must implement those that will help enhance the way surveys are conducted.
As reflected in its organizational structure, Statistics Canada conducts surveys providing two types of outcomes:
1. Economic statistics, which are the results of business surveys, for which respondents are businesses. The majority of these surveys are mandatory – see Chapter 4.5 – Respondent Relations.
2. Social statistics result from social surveys, which are, for the most part, not mandatory and intended for households. Currently, only the Census and the Labour Force Survey are mandatory survey.
It is crucial to mention that while considering enhancing the way surveys are conducted, NSOs need to adopt a visionary approach to that challenge. That means improving and enhancing the entire statistical infrastructure: NSOs need to avoid being “reactive” to specific data needs and thus allocate funds to conduct surveys only to respond to those needs with a short-term approach; but rather NSOs should use each new survey initiative to continually invest and build on their statistical infrastructure to make it more responsive to all data needs. By doing so, they would be able to conduct any economic or social survey with efficiency and quality.
While business and social surveys share the same objectives of producing quality data while keeping to a minimum response burden, using common tools, ensuring integration and harmonization in each step of the statistical process, different requirements in terms of frames, collection, processing, estimation and dissemination lead to the development of different sets of tools, responding to needs typically associated with social vs business surveys.
This chapter aims to provide insights on the strategies and tools for modernization that were used to enhance how surveys are conducted— both for businesses and for households.
Strategies, Mechanisms and Tools
1. Business survey strategies and tools
Over the last few decades, NSOs have faced growing demand for better and more detailed business statistics, together with the need to make production more efficient, to improve existing statistics and to develop new statistics.
To gain in efficiency and responsiveness, several NSOs have opted to create Statistical Business Registers (SBR) as the backbone for the production of business statistics. This offers the potential benefit of integrating the SBR with other statistics, by combining it with information from other administrative or statistical registers. Using an SBR as a unique survey frame for all business surveys also means offering an opportunity to streamline the statistical production process.3
3. UNITED NATIONS ECONOMIC COMMISSION FOR EUROPE, 2015.

Statistics Canada – Catalogue no. 11-634-X176
Compendium of Management Practices for Statistical Organizations From Statistics Canada’s International Statistical Fellowship Program
Indeed, some organizations have also moved towards an integrated business statistics program, allowing them to be more efficient and consistent in the way they collect and process business statistics. This section will focus on Statistics Canada’s experience in moving its economic statistics surveys into an integrated business survey program.
1.1 Overall Business Surveys Strategy – Integrated Business Survey Program (IBSP)In 2010, Statistics Canada launched the Corporate Business Architecture (CBA) initiative. For more information, refer to Chapter 3.1 – Corporate Business Architecture.
This work resulted in numerous recommendations, including the development and mandatory use of shared and generic corporate services for collecting, processing, storing and disseminating statistical information, including a major transformation project for its economic statistics surveys, the Integrated Business Statistics Program (IBSP).
The IBSP provides a standardized framework for the majority of the economic surveys conducted at Statistics Canada. IBSP surveys use Statistics Canada’s Business Register as a common frame. Questionnaires are based on harmonized concepts and content, and surveys share common sampling, collection and processing methodologies that are driven by metadata (the metadata-driven model is explained in section 1.1.3 of this chapter). In addition, common tools are in place to collect, edit, correct, and analyze data.
Although the IBSP was an ambitious undertaking, this new program was developed through a continuation of efforts to build a harmonized business surveying approach, which began in the late 1990s with the Unified Enterprise Statistics (UES) program. The UES program originally covered seven pilot surveys, and gradually expanded to include sixty annual business surveys in the agriculture, manufacturing, trade and services sectors. Nevertheless, over time, substantial resources were required for systems maintenance, and the UES model could not easily adapt to changing requirements. As a result, the UES systems infrastructure became antiquated. This provided an opportune time to redesign the model and implement CBA principles.
Under IBSP, the business surveying infrastructure has been completely redeveloped, and innovative methodologies and processes have been introduced to improve upon the UES model. Many of these innovations resolve longstanding shortcomings of the UES, including implementing a system that has flexibility to adapt to new requirements. By 2019, the majority of Statistics Canada’s economic surveys will be incorporated into the IBSP model.4
1.1.1 Objectives
In designing the IBSP model, six core objectives were identified:
• improving data quality by applying standardized methods and processes, implementing harmonized content, and facilitating coherence analysis;
• reducing response burden;
• modernizing data processing infrastructure with the creation of common IT systems and tools (refer to Chapter 3.2 – Modernization of Information Technology and Informatics Services);
• integrating the majority of economic surveys into the new model;
• simplifying and standardizing processes to shorten learning curves and improve timeliness; and
• reducing ongoing costs associated with operational aspects of surveys to realize efficiencies.
1.1.2 Guiding Principles
Common features of IBSP surveys that promote operational efficiency in each step of the survey process include the following:
• A full use of the Business Register;
• The use of electronic questionnaires as the principal mode of collection;
4. STATISTICS CANADA, 2015a.

Statistics Canada – Catalogue no. 11-634-X 177
Section 3 - Improving, modernizing and finding efficiencies Chapter 3.3 - Enhancing how surveys are conducted
• A metadata-driven approach to questionnaire development, sampling, edit and imputation, allocation and estimation processes;
• The implementation of rolling estimates and an active collection management based on quality indicators and;
• An increased use of administrative data to reduce response burden.
IBSP surveys share these common features, but there are many variants to accommodate survey-specific requirements. For example, the model is designed with flexibility to process surveys with different frequencies, including monthly, quarterly and annual surveys; and, with different coverage, such as economy-wide surveys, industry-based surveys and activity-based surveys.
1.1.3 Strategies and tools for business surveys
1.1.3.1 Full use of the Business Register
Statistics Canada uses its Business Register (BR) as the common frame for all business surveys. The BR is a database that is updated through a number of sources, which include administrative data files, feedback on Statistics Canada business surveys, and profiling activities that involve direct contact with companies to obtain information about their operations and Internet research findings. Using the BR ensures quality, while providing an integrated tool that can measure overlap and minimize response burden to the greatest extent possible. The development of the BR underwent a series of improvements over the years.
More than twenty-five years ago, the BR included only businesses with employees and, thus, covered only a subset of the Canadian economy. At that time, the employer’s account data was the only administrative data source available that was reliable for identifying and maintaining businesses on the register. In the late 1980’s, it was supplemented with Tax Records but with no integration between the two sources. In the late 1990’s, Canada Revenue Agency (CRA) introduced the Business Number (BN) to help administer its various programs, and this greatly increased the potential use of administrative data.
The BN allowed Statistics Canada to link between multiple administrative data sources, which significantly enriched information on the BR frame for the economic survey program. During the past ten years, administrative data has become a key component of the Canadian BR.
The role of the BR is to provide statisticians, who produce and analyze economic statistics, with the highest quality frame in terms of coverage and data elements. In addition to having updates from administrative files, the BR is connected to the collection tools, and as such, the BR is updated daily with information coming from interviewers in the field.
The BR encompasses some of the fundamental concepts of the System of National Accounts, and provides the infrastructure to store, browse, maintain, and retrieve frame information. It also has the capacity for storage of the contact name, address and telephone number and the survey questionnaire identifiers. The Register can also generate an accurate list of contacts, which is required for the survey-data collection process. It monitors the level of response burden imposed on individual businesses by Statistics Canada, and provides relevant information to effectively manage response issues. Finally, it provides statistical information regarding the composition of the population of businesses in Canada in terms of organizational structure, industrial activity, size and geography.
In Canada, the BR contains approximately 6 million active businesses, 99% of which are single-unit businesses. There are about 35,000 businesses that have more than one operating entity (complex businesses), and they account for more than 45% of the Canadian economy. Different types of organizations are defined as a business such as: a corporation, a self-employed individual, a government entity, a non-profit organization, a partnership, or a financial fund.
In addition to being used as a frame for survey sampling, the BR also serves to
• browse the business structures;
• analyse the population of business structures;
• update the business and operational information;
• manage, monitor and control respondent burden;

Statistics Canada – Catalogue no. 11-634-X178
Compendium of Management Practices for Statistical Organizations From Statistics Canada’s International Statistical Fellowship Program
• contact the businesses (support data collection);
• run longitudinal studies; and
• disseminate data from Canadian Business Counts.
In terms of maintenance, for simple business structures, the Business Number (BN) Registration file provides administrative data (tax data) to the BR, which updates automatically. For complex businesses, face-to-face or telephone interviews and coherence analysis are used to complete a full profile maintenance. The integrated nature of the IBSP also allows automated updates of the BR using a harmonized survey feedback process that applies to all business surveys.
In terms of response burden, a control module for excessive response burden was implemented on the Business Register system in December 2014. The objectives of this module are to reduce the excessive response burden for small and medium enterprises, as well as calculate the potential accumulated response burden for all active enterprises in the Business Register system. This is calculated over a three-year period. Depending on the class size of the enterprise and the total number of hours spent completing questionnaires, Statistics Canada determines if an enterprise has exceeded its response-burden limit. If an enterprise is overburdened for its class size, it will be excluded from all surveys for a duration of one calendar year.
1.1.3.2 The use of electronic questionnaires as the principal mode of collection
To gain on efficiency, but also to respond to businesses’ desire to interact electronically with the Government of Canada, the use of electronic questionnaire (EQ) is now the preferred option for business survey data collection. In 2015, 46% of the business surveys converted to EQ with some form of follow-up, by either mail, fax or computer-assisted telephone interviews.
In addition, Statistics Canada has begun to develop and implement an Integrated Collection and Operation Systems Initiative (ICOS) and within it a Business Collection Portal to support business survey programs. The objective is to develop an integrated collection systems environment to achieve the targeted level of flexibility between modes and sites, and to fully exploit the use of the Internet for e-questionnaires. For more information about ICOS, refer to Chapter 3.4 – Data Collection Planning and Management.
1.1.3.3 A metadata-driven approach to questionnaire development, sampling, edit and imputation, allocation and estimation processes
Statistics Canada has a long history of developing corporate metadata repositories for managing publications, services, and statistical holdings. However, relatively few survey programs have well developed metadata repositories for managing survey operations. The UES program did implement a metadata system that housed processing edits, along with variable cell numbers and cell descriptions. For IBSP, this metadata framework has been expanded to cover all aspects of survey processing. This approach increases efficiency, robustness, and responsiveness in delivering processing services for IBSP programs.
In the IBSP model, metadata are stored in easily modifiable tables that are used to drive systems programs. This has been a shift from the UES model where metadata were often hard-coded into programs. IBSP systems programs simply access information from metadata tables to direct their execution.
A key advantage of the IBSP metadata-driven system is that changes are required as program needs evolve, and can be accommodated by modifying metadata, rather than by rewriting system code. This provides more control for the processing team and more flexibility for users.
According to metadata management guidelines, metadata should be active, created for a purpose, and used in “downstream” processes. While the “no data without metadata” principle is often applied to final data output, in the form of descriptive metadata, this is also true for processing, especially in the IBSP. When a variable is created, it is tagged with descriptive elements, such as a name and an origin. However, metadata will also indicate how validation, editing and imputation must be done, and will track the variable’s passage through the various processing steps.
Users have a single point of entry into the IBSP, since metadata will be integrated into every processing step, and managing metadata, along with the processes they direct, will naturally form components of the same seamless

Statistics Canada – Catalogue no. 11-634-X 179
Section 3 - Improving, modernizing and finding efficiencies Chapter 3.3 - Enhancing how surveys are conducted
portal. This integration enables the system to instantly check whether run conditions are being met. For example, if a user chooses to execute a process, the interface can prompt the user to input the necessary metadata and to ensure that other prerequisites are in place. Inputs can then be validated automatically, and, as a result, the system would either stop to give a warning or allow the user to proceed with subsequent steps. The metadata interface approach does not require the user to deal with multiple applications, and does not require knowledge about the order of the various steps necessary to run processing.
While the efficiency goal of a metadata-driven system is to minimize rework and facilitate re-use, improving quality and coherence is an equally important outcome. The integration of metadata in processing operations facilitates automatic coherence checks. Data integrity rules are enforced through the system’s database to ensure the quality of inputs. Metadata also generates invaluable management information to aid in monitoring progress, thereby improving the overall quality of survey processing.
Building an integrated metadata-driven infrastructure also facilitates the implementation of harmonized conceptual framework. For IBSP, this began with the mainstreaming of statistical units, populations, concepts, variables, classifications and sets of questions. All IBSP surveys are now required to apply statistical standards, including
• the North American Industry Classification System (NAICS) to classify the target population by industry
• the North American Product Classification System (NAPCS) to categorize and collect business input and output data
• the Chart of Accounts (COA) as the reference taxonomy for organizing business financial information. (e.g., revenue, expenses, assets and liabilities).
There are a number of financial variables that are common across many economic surveys. By harmonizing the definitions of these variables, and systematically applying standards, common content has been developed and implemented across programs.
The IBSP content model is based on a series of generic modules that cover common variables, and are applied to surveys without modifications from one survey to the next. This approach plays a critical role in creating coherence across programs and in minimizing the effort required to build, test and implement survey content.
In essence, the standardized modules are a series of business survey questions used to collect information to meet stakeholder requirements. There are standardized modules for income-statement data (revenues and expenses), sales data by type of client, sales data by client location, and by purchased service inputs.
The objective of using tax information to its full potential guided the development of questionnaire content. Specifically, IBSP revenue and expense variables have been mapped directly with information available from tax files. This direct link eliminates the need for collecting financial information from small and medium enterprises, since data for these can be easily accessed from administrative sources.
One key issue that had to be resolved in developing financial data content was how to ensure that the conceptual needs of the Canadian System of National Accounts would be met through the use of administrative data. The COA bridges the two sets of concepts. As part of developing the IBSP content model, the COA was reviewed and revised to ensure that COA variables, which are directly linked to tax concepts, meet the information requirements of national accountants.
To add flexibility and meet specific survey requirements, subject-matter experts can customize certain modules that appear on their IBSP questionnaires. For example, products appearing on manufacturing questionnaires will be different from those appearing on service-industry questionnaires. And some of the standardized modules might not be required because they are not relevant for the industry. In constructing IBSP survey questionnaires, staff need to simply select relevant standardized content modules, and then focus efforts on developing industry-specific content, where required. This greatly reduces the time needed to develop, implement and test new questionnaires, while improving the quality and coherence of the data collected.

Statistics Canada – Catalogue no. 11-634-X180
Compendium of Management Practices for Statistical Organizations From Statistics Canada’s International Statistical Fellowship Program
1.1.3.4 The implementation of rolling estimates and active collection-management based on quality indicators
Another feature added to IBSP is its capacity to use historical and partially collected data to produce key estimates (called rolling estimates) and quality indicators, while collection is still underway. These quality indicators are then compared to previously set quality targets to determine if more effort is required or if active collection can be terminated. If collection needs to continue, item scores are calculated in order to gauge a unit’s impact on the quality indicator of each key estimate. These scores are then aggregated within each unit to create a global unit score. These scores enable decisions regarding follow-up activities to be made5.
1.1.3.5 An increased use of administrative data to reduce response burden
Statistics Canada’s rich history of using administrative data for business statistics has helped to reduce response burden. In fact, under the UES business survey model, tax data have already been used as a direct substitute for a sub-sample of sampled units and for imputation of non-response records.
Over time, tax data imputation methods have improved through the use of administrative data, and the quality of information from surveys has improved. This has led to an even greater reliance on tax data as a primary information source. In the transition to the IBSP model, methods were adapted to take full advantage of tax data availability, and, in turn, will reduce additional response burden across survey programs.
Statistics Canada aims to reduce the time businesses spend responding to surveys—either by reducing the number of surveys and survey questions, by limiting the time that a business can be part of a sample, or by using more efficient data collection methods. The agency is also working to improve relations with respondents through its choice of communications tools. For more details about initiatives undertaken by the agency to better manage respondent burden, including the creation of an Ombudsman for businesses, refer to Chapter 4.5 – Respondent Relations.
2. Household Surveys
Statistics Canada used to have two distinct infrastructures: for social surveys and for the census. Following the CBA principles, emphasis has been put in developing infrastructures that can be used by both sets of environment. This has started, particularly around infrastructures used for the creation of frames or for collection. As per the CBA principles, synergies continue to be explored for the other components of the Generic Statistical Business Process Model (GSBPM).
Over the years, while the Census of population has been conducted every five years (refer to Text box 3.3.1 - Benefiting from the Census Program as a locomotive for innovation), Statistics Canada has developed a number of social surveys to allow the measurement of characteristics of all or some of the members of the household. These characteristics typically include a subset of variables, such as health, education, income, expenditure, employment status, and use of various types of services. Since these variables became common in the 1940s, a number of major trends in household surveys have become evident. Many of these trends are closely linked to technological advances, both in statistical agencies and in society, and have accelerated since the spread of personal computers in the early 1980s.6
Over the past few decades, household surveys have faced a challenging environment: declining response rate, more specifically with respect to household surveys that are not mandatory; considerable increased use of smart phones, which makes it difficult to contact respondents; increased collection costs; and, the use of evolving technologies (e.g. Telephone call screening devices).
2.1 Household Surveys Strategy – Guiding PrinciplesIn Canada, the pillars of the modernization process for household surveys are
• the full use of a Household Survey frame service;
• the introduction of e-questionnaires and the use of a multi-modal collection system (ICOS)
5. TURMELLE AND AL., 2014.6. GAMBINO AND NASCIMENTO, 2009.

Statistics Canada – Catalogue no. 11-634-X 181
Section 3 - Improving, modernizing and finding efficiencies Chapter 3.3 - Enhancing how surveys are conducted
• active collection management based on paradata;
• the development, use and maintenance of common tools for harmonizing the business processes used across social statistics;
• the increased use of administrative data to reduce response burden.
2.2 Strategies and tools
2.2.1 The full use of a Household Survey Frame Service
Ideally, statistical organizations would have access to an up-to-date, person-based database containing geographic localization, contact information and basic socio-demographic information to produce social statistics and conduct household surveys. Unfortunately, for most countries, this is unrealistic, and statistical agencies use an area frame as the sampling base for their household surveys that target the entire population.
In Canada, the size of the country and the need to reduce travel costs associated with personal interviews have driven the need for a reliable area frame to take advantage of multi-stage sampling. The increasing use of cell phones and the fact that cell phone numbers were excluded from the Canadian random-digit dialing methodologies, made it clear that a telephone survey would only be efficient if more complete telephone registers were available. In parallel, an Address Register (AR) has been created in 1986, initially as a post listing coverage check for the 1991 Census operations. Over the years, many administrative files were added to the AR and its use and coverage improved dramatically.
To rationalize the investments dedicated to developing and maintaining different household survey frames, Statistics Canada has decided, based on corporate business architecture principles, to create a Household Survey frame service responsible for
• maintaining a series of three files that can be used by the Census and the social statistics programs for various survey processes (sampling frames, contact information, imputation methods)
• providing support to household survey and population census managers with respect to using these files for their operations.
The first component maintained by the HSFS is the Dwelling Universe File (DUF). It links together the AR (a database of residential addresses across Canada) and the National Geographic Database, which provides geo-coded information as specific as the block level. Since the AR is updated quarterly using information from dozens of administrative files, the DUF is a reliable survey frame for the geographic and address-based household surveys and collection operations that involve mail-out activities, such as the Census of Population.
The second component is the Residential Telephone Files (RTF). It includes a list of telephone numbers and some related information (contact name, address). It is built from multiple sources (InfoDirect, telephone companies’ billing files, tax files, census information), and is updated quarterly. The RTF can generate a list of up to 5 telephone numbers per dwelling. It can be used as a frame for telephone surveys. Since 88% of the RTF can be linked to the DUF, it can also provide a source of contact information for address-based surveys.
The last component supported by the HSFS is the Socioeconomic Indicators Files (SEF). It contains auxiliary socio-demographic information at both the household and the person levels. At the dwelling-level, it provides information of household composition and income level. At the person-level, it includes characteristics of each person in the household (age, sex, language, income).
Once the SEF is built, it is maintained annually using the quinquennial population census and annual T1 family files from the Canada Revenue Agency. The SEF can be used at the design stage for clustering, stratification, sample allocation or simulation; at the collection stage for responsive design; and at the estimation stage to facilitate non-response adjustment and imputation.
Creating the HSFS is a first step to developing integrated household survey frames. Although many challenges need to be overcome to allow for a perfect linkage of the three components, creating the HSFS will facilitate research in this area. Statistics Canada also plans to use the HSFS to better coordinate household survey samples and, in turn, to reduce response burden.

Statistics Canada – Catalogue no. 11-634-X182
Compendium of Management Practices for Statistical Organizations From Statistics Canada’s International Statistical Fellowship Program
2.2.2 The introduction of e-questionnaires and the use of a multi-modal collection system (ICOS)
In terms of data collection, Statistics Canada’s household survey enhancement strategy relies on two objectives. The first is to streamline of all collection activities under a unique multi-modal integrated collection and operations System (ICOS). This system would replace the eight collection platforms currently supported by the organization for the various modes of collection used for the Census and the household surveys. For more information about ICOS, refer to Chapter 3.4 – Data Collection Planning and Management.
The second objective is to offer all household survey respondents the option of providing their information first via a self-response electronic questionnaire (EQ). If a response was not obtained through EQ, follow-up would then be done using more expensive collection modes, such as telephone interviewing and/or personal interviewing. Indeed, under the multi-modal ICOS initiative, it is expected that all surveys would use the same application for the self-response electronic questionnaire and for interviewers doing telephone or personal interviews. Allowing respondents to provide their information through the Internet, and without the assistance of an interviewer, could significantly reduce collection costs, but does not come without risks to quality. To achieve this objective, Statistics Canada is carrying out significant research to assess, and to find ways of overcoming, the impact on data quality—e.g., understanding concepts without the help of an interviewer, potential selection bias, mode effect, impact of response rates and costs—of introducing e-questionnaires and multi-modal data collection.
2.2.3 Active collection management based on paradata
Data collection for the Census and for household surveys has improved through the use of paradata to inform data-collection management decisions and strategies. For more information about active collection management, refer to the Chapter 3.4 – Data Collection Planning and Management.
2.2.4 The development, use and maintenance of common tools for harmonizing the business processes used across social statistics
In the context of social statistics, Statistics Canada’s initiative, known as the Common Tools Project, serves as its effort to rationalize business processes. The objective of this CBA sub-project is to develop, use and maintain generalized tools and systems to harmonize the business processes used across all social surveys (starting with programs under the social, health and labour statistics field) and eventually some administrative data files. The main components of this tool are the Social Survey Metadata Environment (SSME) and the Social Survey Processing Environment (SSPE).
The SSME provides an environment for creating, managing, developing and disseminating information that describes the data collected by surveys. In this environment, all metadata are saved in a central location, which enables each tool to access all common metadata throughout the life cycle of a survey. The SSME also includes three common tools:
• A Questionnaire Development Tool (QDT) that allows subject-matter staff to develop and disseminate questionnaires in a timely fashion, and using a standard approach. Also, since QDT acts as the entry point to the Metadata Repository, it can generate collection specifications required for program collection application and can upload questionnaires in the Integrated Metadata base (IMDB)
• A Processing and Specifications Tool (PST) that facilitates the creation and management of metadata related to variables within the Social Survey Metadata Environment (SSME).
• A Data Dictionary Tool (DDT) that enables subject-matter staff to document variables for dissemination.
The SSPE consists of a set of generalized processes for the activities related to a survey life cycle. The principle behind the SSPE is that, even if each survey requires different processing steps and utilities, because of its unique processing requirements, it is still possible to create a processing template using a general flow of steps when setting up processing for any survey. A common processing environment for all household surveys will facilitate the development and use of a core set of generalized systems and, in turn, reduce their maintenance costs.

Statistics Canada – Catalogue no. 11-634-X 183
Section 3 - Improving, modernizing and finding efficiencies Chapter 3.3 - Enhancing how surveys are conducted
2.2.5 The increased use of administrative data to reduce response burden
In Canada, the use of administrative data files, which were not created for statistical purposes, has contributed to and increased the production of social statistics. Administrative data are now used to improve household survey frames, as a source of extra information for an existing frame, as a substitute for survey content to reduce response burden, and to improve the quality of statistical products. They are used by themselves or in combination with survey files or other administrative data files. For example, the Canada Revenue Agency maintains the Canadian Child Tax Benefit (CCTB) file, which is used by surveys focussing on sampling children (in fact, their parents). Sets of income questions are gradually being replaced by personal tax information received from the Canada Revenue Agency for the Canadian Census of Population and for several household surveys. An Immigration Database has been created linking information from various sources to better measure outcomes of immigrants to Canada.
The foundation of the household survey enhancement strategy is built on continuously seeking opportunities to increase the use of administrative or alternate data for improving the quality of social statistics products (e.g., reducing sampling or non-sampling errors), improving their relevance (e.g., producing more detailed or more frequent estimates), filling data gaps, reducing the costs of statistical production, and reducing response burden (see Chapter 3.5 – Acquisition, use and management of administrative and alternative data). Strategies are currently being built to facilitate record linkage between various sources.
Key success factorsA key success factor in enhancing business and household surveys is to consolidate all frame services under the Statistical Registers and Geography Division. This Division is responsible for collecting, compiling, maintaining and disseminating the frames of businesses, dwellings and geographies required for Statistics Canada’s surveys, censuses and data-integration activities. The role of these frames is to support the use of the business register under the IBSP and to provide the Household Survey frame service.
Investing in the accuracy and relevance of a business register and in the household survey frames, as well as in the efficiency of their maintenance process, can also be rewarding. Statistics Canada’s experience shows that securing reliable administrative data (e.g., tax data), automating the updates as much as possible, standardizing the procedures and concepts, and using accepted standards (geographic, classification.) can greatly improve the quality of business and household survey frames and, consequently, the statistical products.
The management of a large-scale transformation strategy needed to enhance business and household surveys, such as the IBSP, ICOS, HFSF and the Common Tools project, really benefit from the Corporate Business Architecture Governance (see Chapter 3.1 – Corporate Business Architecture) and Project Management framework (see Chapter 2.4). A combination of strong governance, transparency in decision making, and the involvement of partners in developing common solutions, has been a successful approach. Frequent communication among all levels, and through many different channels, has kept stakeholders informed and engaged in projects. The adoption of a metadata-driven approach also greatly contributes to realizing efficiencies, while improving the coherence of economic statistics.
Finally, modernizing the production of economic and social statistics must be supported by rigorous research to ensure the efficiency and scientific soundness of new methods. Innovating and conducting experiments to test ideas and improve practices is essential. Research should therefore be an identified and supported function in the organization.
At Statistics Canada, annual investments in methodology research are secured to develop, promote, monitor and guide the adoption of new and innovative techniques in statistical methodology to support Statistics Canada’s statistical programs. The International Cooperation and Corporate Statistical Methods Division (ICCSMD) is responsible for methodology research and provides technical leadership, advice and guidance to employees elsewhere in the Methodology Branch. ICCSMD staff are also jointly involved with members of the other methodology divisions through research projects on specific topics, e.g. estimation methods, imputation methods, small area estimation methods, record linkage techniques, use of administrative data, measurement of non-sampling errors, which are sponsored by the Methodology Research and Development Committee.

Statistics Canada – Catalogue no. 11-634-X184
Compendium of Management Practices for Statistical Organizations From Statistics Canada’s International Statistical Fellowship Program
The Advisory Committee on Statistical Methods also advises the Chief Statistician on matters related to the use of efficient statistical methods in the agency’s program, as well as its research and development program in statistical methods. The committee’s activities include the following:
• Review and comment on Statistics Canada’s priorities in methods research;
• Review and comment on methods used in particular programs (e.g., survey design; census under coverage measurement; gross flow estimation; small area estimation techniques);
• Review and comment on generic methods used widely in the agency’s programs (e.g. seasonal adjustment methods, edit and imputation methods, quality control methods);
• Suggest functions or programs within the agency that could benefit from the innovative application of statistical methods;
• Comment on the agency’s allocation of resources to provide methodological support to its programs, and to research methods;
• Suggest means by which Statistics Canada can ensure its continuing leadership role in the development of statistical methods; and, finally,
• Advice on the agency’s quality assurance program and the actions that stem from it.
This research capacity and its governing body ensures that the statistical organization remain at the leading edge of the profession.
ChallengesTo successfully achieve integration across many programs and processes, Statistics Canada’s experience shows that the following considerations might reduce the risk of its potential pitfalls:
• Continuous engagement with the administrative data suppliers for the purpose of maintaining the accuracy and relevancy of the statistical survey frames needs to be ensured;
• Large-scale projects with significant impact on the organization should receive continual support and buy-in from senior managers and should benefit from strong and efficient governance;
• Subject-matter areas should have the ability to negotiate and adapt. Generic solutions have limitations, and concerns should be addressed according to corporate priorities; and
• Staff should be trained to use new tools early in the process.
Adopting a modular approach (i.e., building the integrated survey program in phases) is also strongly recommended to make a project more manageable.
The important challenge is the balance between actually delivering on common tools and infrastructures for surveys while at the same time planning and finding ways to enhance the use of administrative data in the future.
Looking aheadFor efficiency purposes, national statistical organizations will need to consider, more and more strategically, the use of administrative data. It should be systematic to, first, see whether any administrative data exist, or can be combined with existing data collection. If this is not the case, then one can consider a new survey project. For more information about strategies with regard to acquisition, use and management of administrative data, refer to Chapter 3.5.

Statistics Canada – Catalogue no. 11-634-X 185
Section 3 - Improving, modernizing and finding efficiencies Chapter 3.3 - Enhancing how surveys are conducted
Text Box 3.3.1Benefiting from the Census Program as a locomotive for innovation
The foundation for the many of the transformations that need to be operated on household surveys will originate from the models used on the Census of Population Program. Statistics Canada has been using a multi-mode collection approach for the Census since 2006 when internet as a response option was first introduced. The collection methods were then adapted for the 2011 Census with the introduction of a wave approach to boost response by internet while minimizing the risks of non-response. The wave approach favors a more costs efficient set of initial contacts and reminders using letters inviting respondents to participate primarily by internet. Telephone and in person follow-ups are introduced in later stages of collection and targeted to non-respondents from the first waves. The approach used for the 2011 Census generated a high level of internet response (54%) and self-response (85%). A similar approach could be adapted to most household surveys as they move to corporate sampling and collection tools.
The Census Program has also been innovative in the development and use of automated processes. It developed the Address Register as its frame and has been leading in the use of administrative sources to maintain that frame as opposed to direct address listing. The focus for the program going forward is shifting to reducing under and over coverage of addresses in the frame.
Different tools were also developed first for the Census Program to support its multi-mode collection approach and support field personnel in the management of their workload. These include a Master Control System to keep track of the status of every dwelling in the frame in quasi-real-time and the Field Management System in 2011 which has now been converted into the Collection Management Portal under ICOS for 2016. The functionalities within these systems will form the basis of what is needed to convert household surveys to the new collection approaches.
The Census Program is so expanding the use of administrative data to reduce both burden and cost as well as improve quality. In 2016, the questions related to income have been replaced by administrative data provided by the Canada Revenue Agency. Going forward, the Census Program is conducting work on the creation of the virtual population register further expanding the use of administrative data sources to ultimately replace the enumerated head count. In addition, this register will be used directly as a frame for some household surveys or to supplement the current Household Survey Frame. Work is also being conducted on how frame information can be used in adaptive collection methodologies.
The process of innovation on the Census Program is aiming at making the program more efficient and reducing burden on respondent while maintaining a high level of data quality.
Statistics Canada – Catalogue no. 11-634-X186
Compendium of Management Practices for Statistical Organizations From Statistics Canada’s International Statistical Fellowship Program
BibliographyBosa, K, Godbout, S., Mills, F and Turmelle, C. (2014). A Quality Driven Approach to Managing Collection and Analysis. Consulted on the 11th of March 2016 and retrieved from http://www.q2014.at/fileadmin/user_upload/Q2014_Paper_QIMI_final.pdf
G. Gambino, Jack and Luis do Nascimento Silva, Pedro (2009). Sample Surveys: Design, Methods and Applications, Vol. 29a. Consulted on the 11th of March 2016 and retrieved from http://www.sciencedirect.com/science/handbooks/01697161/29/part/PA
Government of Canada (2003). Survey Methods and Practices, Statistics Canada. Consulted on 11th of March 2016. Retrieved from http://www5.statcan.gc.ca/olc-cel/olc.action?ObjId=12-587-X&ObjType=2&lang=en&limit=0
Statistics Canada (2015a). Integrated Business Statistics Program Overview, Statistic Canada. Consulted on 11th
of March 2016. Retrieved from http://www.statcan.gc.ca/pub/68-515-x/68-515-x2015001-eng.htm
Statistics Canada (2015b). Response Burden Reduction Efforts, Statistic Canada. Consulted on 11th of March 2016 and retrieved from http://www.statcan.gc.ca/eng/about/rbre
St-Louis, Gaetan (2008). The Evolution of Administrative Data Use for the Canadian Business Register (BR), Statistics Canada.
United Nations Economic Commission for Europe (2015). Guidelines on Statistical Business Registers, Task Force on Guidelines on Statistical Business Registers, Consulted on the 11th of March 2016 and retrieved from http://www.unece.org:8080/index.php?id=40574&L=0

Statistics Canada – Catalogue no. 11-634-X 187
Section 3 - Improving, modernizing and finding efficiencies Chapter 3.4 - Data collection planning and management
Chapter 3.4 – Data collection planning and management
ContextData collection is typically the greatest expense of any statistical program. To optimize the use of resources, collection operations should be organized, planned and conducted as efficiently as possible. Burden should also be minimized for both respondents and the organization. Interviewing practices should be consistent across statistical programs and should reflect the highest quality standards; and, timeliness should always be seen as an underlying objective of data collection enhancement initiatives.
In the context of modernization, increased demand for statistics, and declining response rates, national statistical offices (NSOs) must also find innovative ways to improve how they manage their data collection. They must take full advantage of new technologies to gain in efficiency while improving the quality of the data collected. These realities do not come without challenges. Investments and changes in data collection management practices, tools and infrastructures usually have a significant impact on the data production process as a whole. For example, the introduction of computer-assisted technology will modify traditional questionnaire design and data processing practices.
This chapter focuses on strategies, mechanisms and tools that could be implemented to improve efficiency in collection activities and to modernize data collection operations. Please note that questions related to respondents’ relations are presented in Chapter 4.5 – Respondent relations.
Strategies, mechanisms and tools
This section describes the four major components of data collection that, when efficiently managed, allow statistical offices to modernize their organizations and improve efficiencies:
• Collection governance
• Collection planning
• Collection practices and tools
• Collection monitoring
1. Collection governance
There are many governance approaches to organizing collection operations. The ultimate indicator for the adequacy of the chosen governance structure and mechanisms, however, is how well they satisfy the following strategic goals:
• Effective planning and coordination of capacity and capabilities across the collection infrastructure;
• Continuous improvement of efficiency, quality and timeliness;
• Effective reduction of response burden and costs; and
• Modernization of collection tools and processes with minimal or acceptable levels of risk.
The most appropriate governance structure is probably one that provides an optimal balance of centralization and decentralization in the statistical system context. Decentralized collection activities at the regional level or by statistical domain can sometimes lead to better quality and, to some extent, reduced costs because local knowledge can be used to improve respondent relations and increase efficiency by reducing the cost of follow-up of incomplete questionnaires, refusals, other non-response, etc. On the other hand, a centralized structure tends to facilitate planning and coordination while reducing duplication of effort. . It also facilitates the implementation of consistent and standard concepts and procedures across regions and survey programs, which has an ultimate impact on data quality.
At Statistics Canada, all collection activities have been centralized under the Collection and Regional Services Branch (CRSB). Creating this centre of expertise for collection planning, development, and research, and for collection management was one of the first priorities of the Corporate Business Architecture (see Chapter 3.1

Statistics Canada – Catalogue no. 11-634-X188
Compendium of Management Practices for Statistical Organizations From Statistics Canada’s International Statistical Fellowship Program
– Corporate Business Architecture). Under this modernization initiative, all collection activities that were being conducted in various subject-matter areas were integrated under the CRSB, allowing Statistics Canada to find improvements and savings in its collection process, strengthen the links between all collection partners, enhance respondent relations and facilitate the modernization of collection processes and systems regardless of mode.
The CRSB includes the following units:
• The Collection Planning and Research Division (CPRD—at head office), is the centre of expertise for survey planning, survey development, and survey-collection research. CPRD’s responsibilities include (1) the planning of capacity and capabilities across the collection infrastructure; (2) the delivery of coordinated collection services for household and business surveys (initial consultations, feasibility assessments, and cost estimates); (3) the development of collection strategies for all collection methods, including electronic questionnaires (EQ), computer-assisted telephone interviewing (CATI); computer-assisted personal interviewing (CAPI); paper and pencil interviewing (PAPI); and multi-mode collection; (4) the testing and support of survey-collection applications and IT-related infrastructures, and; (5) survey-collection research to improve the quality, timeliness and cost of survey collection as well as identifying ways to reduce respondent burden.
• Regional offices coordinate all modes of survey collection activities, in accordance with negotiated budgets and survey requirements. Regional offices are responsible for day-to-day management of collection operations, respondent relations, and the identification and resolution of problems related to collection as they arise.
• Statistical Survey Operations (SSO) is a separate employer managed by the staff of the Regional Offices. This organization collects information from survey respondents on their business, household or institution on behalf of Statistics Canada. SSO interviewers play a crucial role in explaining the importance of Statistics Canada surveys and engaging respondents to participate in them. Approximately 2,000 employees work for SSO and their workload depends on the survey collection volume and schedule. SSO has one employee classification group, which consists of two levels: interviewers and senior interviewers. There are also two types of interviewers: (1) field interviewers who carry out survey activities, in person, outside Statistics Canada offices, known as CAPI, and (2) interviewers who conduct interviews by telephone, known as CATI, and who work primarily from Statistics Canada regional offices.
The CRSB includes the following units:
In terms of coordination within the overall organizational governance, the CRSB seeks advice and guidance from the Agency’s Collection Planning Committee. The mandate of this committee is to review and recommend strategies for generating efficiencies in collection, respondent relations, and operations in terms of cost, quality and timeliness. The primary objectives are to
• review and recommend approaches to optimize Statistics Canada’s collection services in terms of methods, operations, cost-effectiveness, and minimizing of response burden;
• review and recommend actions or best practices to optimize response rates, data quality, and respondent outreach in support of data collection activities;
• review demand and priorities for collection services and to recommend necessary capacity adjustments, and
• review and recommend internal rates for collection services to Executive Management Board.
The committee also develops an annual work program and reports progress directly to the Executive Management Board, with a view to ensuring coherence between all management strategies and practices within the organization.

Statistics Canada – Catalogue no. 11-634-X 189
Section 3 - Improving, modernizing and finding efficiencies Chapter 3.4 - Data collection planning and management
2. Collection planning
A good collection planning system should allow NSOs to effectively prioritize collection activities, coordinate capacity and capabilities across the collection infrastructure, and establish roles and responsibilities regarding all aspects linked to collection, including execution, assessment, monitoring, contingency planning and security, as well as the related communications strategy. The requirements of the subject-matter divisions—and the means by which, and the extent to which, these requirements are expected to be met—are examined and agreed on. It is during this phase that the resources, the funding requirements, and the schedule of activities are developed. The quality of the planning phase is crucial to the quality of the entire project. Good planning requires good management skills and knowledgeable and experienced people.
The following are key considerations in planning survey collection activities:
• Survey objectives (information needs, primary uses and users of the data, concepts, survey content, quality requirements by domains of interest and analysis plan);
• Survey frame (target population, area vs. list frames, use of existing frame vs. cost to build new one and quality of frame, including contact information);
• Sample design (statistical units, sample size, sample distribution);
• Questionnaire design (i.e., questionnaire content, types of questions (closed vs. open answers), question sensitivity, order of questions, average length of questionnaire);
• Collection method (i.e., self-enumerated vs. interview-assisted, face-to-face vs. telephone interviews, paper-and-pencil, computer-assisted or electronic questionnaires, use of electronic digital assistance devices.). Choosing the appropriate collection method is crucial and should take into account the participation rate, respondent burden, and budgetary and operational constraints. Refer to box 3.6.1 (at the end of this chapter), which identifies the collection methods used by statistical organizations and their advantages and disadvantages with regard to the entire data collection and production process;
• General consideration related to collection management (staff availability; labour market; remoteness of the target population; respondent cooperation;; transportation expense costs; average costs related to the printing or design of collection tools; language of respondents and translation costs, etc.).
Once the key planning decisions are taken, the project schedule must be created. The creation of the project schedule consists in preparing the list of activities and tasks along with timelines, key milestones, and the name(s) of the person(s) responsible for completing them. Steps include integrating lessons from the last collection exercise through a review of the post-mortem document and a peer review of the new survey procedures by collection committee. Steps also include an analysis of the interviewer capacity to determine the following: where the work will be allocated; which Management Information System reports should be used to monitor collection, and determine the parameters, conditions, and key performance indicators for identifying critical collection milestones. Finally a Collection and Operations Service Agreement is drafted and signed off by all service areas involved in all stages of the process, from survey development to collection.
At Statistics Canada, planning has been greatly improved by the creation of a single organizational point of entry for all subject-matter divisions requiring collection services—the Collection Front Door. This service is responsible for the initial collection feasibility assessment stage, during which survey specifications are reviewed, data-collection process flows are identified, required capacity is assessed, and preliminary cost estimates are prepared. Having collection experts assisting survey managers in the design of their surveys and the establishment of collection-related costs improve quality and efficiency with regard to the general planning and the conduct of surveys.
3. Collection management practices and tools
Within the collection structure, interview-based collection activities are usually performed through a direct hierarchy involving collection project managers, supervisors and interviewers. Project managers play a liaison role with the survey programs and ensure that collection requirements, such as quality standards and response rates, are met. Collection schedules, timetables for data collection, details of survey milestones, targeted response rates, and reporting periods can facilitate their work.

Statistics Canada – Catalogue no. 11-634-X190
Compendium of Management Practices for Statistical Organizations From Statistics Canada’s International Statistical Fellowship Program
Supervisors are usually responsible for hiring, training and monitoring interviewers; distributing the workload among the available resources; and addressing day-to-day management problems. Supervisors’ manuals assist them in performing their duties. These useful tools typically include guidelines on the following: hiring and training interviewers; creating interviewer assignments; occupational health and safety; quality and performance controls; logistics, security and privacy protection; conversion of refusals to respondents; and methods for dealing with disabled persons, language problems, or special considerations applicable to respondents.
Interviewers can be responsible for several of the following functions: listing, interviewing and tracing respondents; following-up with non-respondents; editing and coding. Although this type of work does not require advanced education, interviewers’ strategic role in data production requires minimum abilities and personal qualities. Criteria to consider when hiring interviewers include interpersonal skills, fluency in local languages, organizational skills, computer literacy, trustworthiness, subject-matter knowledge, and knowledge of the area where the survey is being conducted. Interviewers’ training should focus on (1) the development of soft skills, such as empathy, active listening, refusal conversion; (2) the understanding of survey concepts, content and particularities; and (3) the collection process, including the use of listing, collection and coding tools. Cognitive studies show that classroom training combined with home study, mock interviews, and early feedback on performance tend to produce better results. Regular refreshers and interviewers’ manuals can also facilitate the retention of the information provided during training.
Self-administrated surveys do not require the same hierarchy but may nevertheless require listing, coding, editing, and non-response follow-up, which can be centrally managed or not. Proper training, supporting documentation, and monitoring are therefore necessary.
Recent improvements in conducting survey collection were implemented further to the analysis of collection process data. Paradata research has been focused on improving the understanding of data collection processes and response patterns leading to the identification of strategic improvement opportunities. For example, at Statistics Canada, research findings on paradata produced from CATI surveys have indicated that the same data collection approach does not work effectively throughout an entire data collection cycle. There is therefore a need to develop a more flexible, responsive and efficient data collection strategy.
One strategy is to offer a multi-modal collection option to all respondents. Under this approach, a survey collection could start in one mode and be pursued using any other combination of modes, with a view to achieving the best possible quality in the most efficient way. For example, the approach used in the Canadian census is one that starts collection with the least expensive mode (electronic questionnaire) and ends with the more expensive mode that typically yields higher response rates (personal interview). To enable this, the statistical organization needs to be able to securely and easily move cases between its electronic questionnaire platforms, its multiple call centres, and its workforce of personal interviewers. Calls must be made at times when they are most likely to generate a response. As well, information about individual cases must be available in real time, so that the organization can detect issues related to interviewer or questionnaire performance. All of this work must be accomplished with the smallest possible number of systems and processes to achieve economies of scale.
Statistics Canada has started to implement this vision in 2011, through the Integrated Collection and Operation Systems (ICOS) project. This initiative’s objective is to develop an integrated collection systems environment to achieve the targeted level of flexibility between modes and sites, fully exploiting use of the Internet for electronic questionnaires. In 2014, through Phase 1 of the ICOS Business Collection Portal (ICOS-BCP), data collection started to make use of a single electronic questionnaire for both respondents and interviewers to collect data for the annual surveys of the Integrated Business Survey Program. Over the next few years, the migration of business surveys to the ICOS-BCP will continue as they align with the adoption of common data processing tools and the implementation of the use of a single electronic questionnaire to support both self-response and interviewer-administered response.
The integrated collection system environment also relies on the use of the ICOS Collection Management Portal (ICOS-CMP) to meet the needs of the census programs, social surveys, and some business surveys requiring a CAPI component. The 2016 Census of Population and Census of Agriculture will be conducted through this portal, which will also support the recruitment of Statistics Act census employees. In parallel, work will continue on addressing the business requirements of other survey programs relying on the ICOS-CMP for their data collection. In particular during this period, a prototype of an off-line solution will be implemented to allow data collection

Statistics Canada – Catalogue no. 11-634-X 191
Section 3 - Improving, modernizing and finding efficiencies Chapter 3.4 - Data collection planning and management
for the consumer price index program and personal interviewing for social surveys. This work will position the organization for the introduction of live data collection for surveys by means of the ICOS-CMP, beginning in 2017/2018.
4. Collection monitoring
Collection monitoring should be considered as a strategic tool to improve data quality and efficiency in collection operations. The adoption of computer-based collection technologies helps ensure (1) that the questionnaire is being used properly, (2) that the interviewing techniques are effective and consistent across interviewers, and (3) that respondents’ answers adequately reflect what is intended to be measured. For example, CATI technologies often allow supervisors to listen in on live interviews. Some CAPI systems can now record parts of interviews for quality assurance purposes. Electronic questionnaires can also be programmed to prompt additional verification questions through built-in edits. Finally, personal digital assistants (PDAs) or tablets equipped with a global positioning system have also been used to verify that interviewers actually collected their information from the expected location. This technology is not yet available at Statistics Canada; however, the agency is actually exploring its possible use and feasibility for the Consumer Price Index.
More recently, the relationship between the quality, cost, productivity, and responding potential of outstanding cases over the course of collection has been investigated. Additional tools have been developed to better assess and monitor progress, quality and performance during collection and to allow the development and implementation of a Responsive Collection Design (RCD) strategy for CATI surveys. RCD strategy is an approach to survey data collection that uses both information available before and paradata accumulated during collection (e.g., the sequence of calls) to identify when changes to collection approaches are needed in response to the progress of collection. The main idea is to constantly assess the data collection process on the basis of the most recent information available with a view to making the most efficient use of available resources remaining (adaptive collection).
In practice, the RCD approach monitors and analyzes collection progress against a pre-determined set of indicators for two purposes: to identify critical data collection milestones that require significant changes to the collection approach and to adjust collection strategies to make the most efficient use of remaining available resources. This type of monitoring is central to the Integrated Business Survey Program’s approach adopted by Statistics Canada (see Chapter 3.3 – Enhancing how surveys are conducted).
Key success factorsThe planning and management of collection operations are crucial to a survey’s success. Without clear and effective collection tools, an established and consistent governance structure, and an engaging respondent relations program, there are no consistent and efficient ways to understand what is to be achieved and how it is to be achieved.
In improving the planning and management of collection, Statistics Canada aims to enhance and consolidate the following key elements.
First, the collection planning and management governance structure supported by the close relationship and collaboration between CPRD (as planning and coordinating authority) and regional offices (responsible for survey collection operations). Because they were part of the same branch in Statistics Canada, the collection exercise was more defined, better structured, and more efficient.
Secondly, focusing efforts and synergy on building and enhancing an integrated common collection tool is an effective way to ensure consistency and generate savings while improving client relations.
Finally, continually investing in research and development and communications strategies that will improve efficiencies and respondent relations is key to improving timeliness, response rates and, consequently, the quality of surveys. For details about respondent relations, refer to Chapter 4.5.

Statistics Canada – Catalogue no. 11-634-X192
Compendium of Management Practices for Statistical Organizations From Statistics Canada’s International Statistical Fellowship Program
ChallengesWhile the modernization of collection tools represents an opportunity to improve collection practices, quality and efficiency, it still represents a cost for any NSO interested in adopting them. The acquisition of the technology, the development of skills to use this technology, and the impact and dependency on the rest of the statistical production process must be factored in when one is building an investment business case. Adopting a one-type-fits-all collection tool, such as ICOS, is one solution to optimize the cost-efficiency of a new tool. Another innovative solution to reduce associated costs and risks is to adopt a coordinated approach to the acquisition and implementation of a new technology. In this regard, the experience of Cape Verde in adopting PDAs in its 2010 General Population and Housing Census and the south-south co-operation between Brazil, Cape Verde, Côte d’Ivoire and Senegal described in box 3.4.2 is certainly worth mentioning.
Looking aheadThe general way forward of a statistical organization is to continue seeking and seizing the opportunities offered by new technologies to improve the efficiency of collection operations as well as the timeliness and quality of the data collected.
For Statistics Canada, this will be achieved by the integration of all surveys into one multi-mode collection platform and ongoing researches on emerging collection modes, such as electronic questionnaires and mobile applications. Where possible administrative data will also be used in order to reduce respondent burden and the costs associated with collection activities.
Box 3.4.1Collection methods
The method of data collection should be chosen for the purpose of achieving a high participation rate and collecting data that are as complete and accurate as possible while minimizing the burden to the respondent, taking account of privacy considerations, and satisfying the client’s budget and operational constraints.
There are two types of collection methods for NSOs to use:
• Self-response, which means that respondents complete only the questionnaire by themselves and can return it electronically, by mail, fax, or pick-up;
• Interview-assisted, where interviewers assist respondents in completing the questionnaire either in person or by telephone.
In terms of collection modes and the way data are collected, several options exist:
• Internet collection through an electronic questionnaire, either self-completed or interviewer-assisted;
• CAPI, CATI, or computer-assisted self-interview (CASI); and
• Paper collection, which is known PAPI.

Statistics Canada – Catalogue no. 11-634-X 193
Section 3 - Improving, modernizing and finding efficiencies Chapter 3.4 - Data collection planning and management
Here are the most common collection methods used at Statistics Canada.
Characteristics of the collection methods and mode
Advantages Disadvantages
1. Self-response requires well-structured, easy-to-follow questionnaire with clear instructions for respondents
-Relatively easy to administer
-Useful for detailed surveys where respondents can consult personal records
-Reduced burden since survey can be completed at any time of the day
-More privacy—no interviewer involvement
-May require respondent to be more knowledgeable
-Response rates may be lower
-Longer collection periods
-Often requires follow-up to correct errors
-Non-response bias
2. Interview-assisted are particularly useful for survey concepts or questionnaires that are complex, or in any instance where self-enumeration could be difficult
-Better response rates
-Extensive interviewer training provide higher data quality
-Edits and inconsistencies can be immediately addressed by the interviewer
-Higher costs related to interviewer salaries, training, travel costs, office space, and telephone
-Complex survey management
-Potential reluctance of respondents to answer sensitive questions
2.1 Personal interviews are conducted face-to-face with respondents, usually at their residence or place of work
-Best response rate
-Can make direct observations
-Better refusal conversion
-Instills more confidence and trust
-Most expensive
-Difficult to find respondents
-Difficult to shift workloads
-Difficult to implement quality control measures
2.2 Telephone interviews are conducted over the phone from centralized call centres
-Better response rates
-Costs less than personal interviews
-No travel time and safer work conditions
-Allows live quality control measures (monitoring)
-Difficulty to get good phone frame
-Large call centre infrastructure to maintain
-First contact more difficult to get

Statistics Canada – Catalogue no. 11-634-X194
Compendium of Management Practices for Statistical Organizations From Statistics Canada’s International Statistical Fellowship Program
Other forms of data collection include (1) direct observations (Canadian Health Measures Survey or consumer price index), (2) Electronic Data Reporting, used for business surveys, (3) administrative data, (4) supplementary surveys, where questions are added to existing surveys, and (5) omnibus surveys, where several surveys are combined together into one questionnaire.
The graphic below shows the percentage of the use of each collection mode for all surveys (household and business) in 2015 at Statistics Canada.
Source: Statistics Canada, Collection and Regional Branch Services, 2015.
As shown in the graphic, CATI is by far the most used collection mode (54% of the total), followed by multi-mode (15%), CAPI (13%), handheld (7%), and electronic questionnaires (4%). Please note that, although the percentage for electronic questionnaires may seem low, 46% of business surveys have converted to electronic questionnaires with some form of follow-up, by mail, fax or CATI.

Statistics Canada – Catalogue no. 11-634-X 195
Section 3 - Improving, modernizing and finding efficiencies Chapter 3.4 - Data collection planning and management
Box 3.4.2Challenges in optimizing data collection by the National Institute of Statistics of Cape Verde (INE-CV)
The impact of the introduction of mobile devices in the data collection processThe National Institute of Statistics (INE) of Cape Verde used mobile devices in the collection of data for the General Population and Housing Census in 2010. This fact was a turning point for the institution, and also for the African continent as a whole, since it was the first digital census for both the INE and the continent. The investment in innovation resulted from the need to show that it is possible to conduct a census in a different way on our continent, innovating in all its phases, bringing higher quality to data collection and greater possibilities for analysis, thanks to the combination of alphanumeric and geographic components. Moreover, it was imperative to reduce existing costs and to shorten the time for finalizing the collection and publication of results.
The introduction of mobile devices, in general, requires the restructuring of all collection operation phases, specifically: cartography, survey design, awareness, pilot census, collection, processing, and dissemination. Therefore, members of INE must be prepared and open to change.
During the cartography phase, numbering all locations and delimiting census districts according to the latitude–longitude coordinate system were necessary. In order to increase efficiency, the majority of houses were georeferenced at headquarters, with the validation, description and collection of new attributes taking place in the field.
During the survey design phase, consistency edits and controls were considered since they would be implemented in the installed application in the mobile device, so that this part of the data verification could be done at the time of collection. However, the possibility to enter more information in the mobile devices does not mean, necessarily, an improvement in quality. For example, it would be possible to enter occupation and economic activity directly into the system as the enumerator would have only to choose the appropriate code or description. However, the set of questions for future coding remained a more precise methodology since those classifications were not in the application. In the following operations, questions and classifications were used, and both worked as a better consistency control.
During the awareness or public-relations phase, introducing the collection devices was important considering that smartphones were not common in 2010. An explanation of their purpose and importance to future respondents was necessary.
The pilot census, on the other hand, required constant presence of the IT unit because this operational phase constituted an important testing period for the application, regarding both its specific functionalities and the methodology functionalities (consistency controls and auto-skip). The collection also required IT presence to guarantee the normal operation of the application, such as to ensure collected information was saved, considering that the continuous transmission of data allowed also a stricter control of the operation progress through constant follow-up of the collection both by headquarters and the population of Cape Verde. This was possible via a website built for this purpose.
The data processing was easier since part of its verification was done in the field. This reduced the time spent on this phase. It is worth mentioning that the data entry phase was eliminated completely (except for 102 interviews with homeless people done on paper).
Lastly, during the dissemination phase, a considerable amount of time was gained in publishing the data, considering that the collection of georeferenced data allowed geostatistical analysis (for example, a study on a location with a cluster of children and existing kindergarten facilities, which allowed local officers to identify the needs for building / establishing education facilities according to the number of children). It is appropriate to highlight that, in a digital census, it is important to invest extensively in training field representatives and to test the application and methodology.
Strategic partnershipsIn order to successfully complete all phases of Census 2010, INE received support from the Brazilian Institute of Geography and Statistics (IBGE) in the form of technical expertise and supply of equipment used for data collection, as provided in the collaboration agreement signed by INE and IBGE.
The continuous support from IBGE was essential for the success of the operation. However, the greatest benefit came afterwards: the collaboration model allowed knowledge transfer for the purpose of enabling the technical independence of the institution in the programming domain and use of mobile devices. At the end of 2011, the first application was in the field for a scheduled survey and involved only in-house know-how. As a result, there has been constant improvement. In addition, INE has worked with partners to share acquired knowledge and explore new areas.

Statistics Canada – Catalogue no. 11-634-X196
Compendium of Management Practices for Statistical Organizations From Statistics Canada’s International Statistical Fellowship Program
In this context, INE has invested in experience sharing, especially in terms of the south-south co-operation. In 2013, INE supported the National Statistics and Demographic Agency of Senegal to perform its General Census of Population, Agriculture and Cattle. The technical collaboration was provided essentially by INE, and the supply of mobile devices was made by IBGE. These devices were further used by INE in Côte d’Ivoire. This shows once again the need for the African continent to have this type of equipment, common in other countries, in the 2020 Census round, given its proven benefits.
There is a need for a great number of mobile devices during census rounds; however, after these rounds, the use of these devices is uncertain. Although a portion of them are retained by the institution for survey purposes, because surveys are carried out on a smaller scale in Cape Verde, the result is a surplus of mobile devices which could be managed by the excellence centre to benefit the continent. Furthermore, the centre would develop technical expertise to be available to countries that needed it. This is a statement that INE of Cape Verde has been supporting since the Fifth Africa Symposium on Statistical Development, held in Senegal in 2009.
In the last few years, INE received study visits from the institutes of countries such as Tunisia, Ethiopia, Togo, Burkina Faso, Madagascar, Mauritania, and Niger. The establishment of a formal structure focused on supporting counterparts would allow for a more effective and closer follow-up.
Note that the introduction of new technologies is a challenge in any country, and African countries are no exception. Cost reduction as well as advocacy and constant training are necessary—this applies to all countries. Investment in the statistical needs of NSOs is one that yields high returns.
BibliographyLaflamme, François and Milana Karaganis (2010). Development and Implementation of responsive collection design for CATI surveys at Statistics Canada, European Quality Conference, Helsinki, Finland.
Statistics Canada (2014). Responsive Collection Design – Users Guide (version 1.4). Document prepared by the Collection Planning and Research Division. Internal document, accessible on demand.
Statistics Canada (2015). Survey planning and management governance – User Guide (version 4.0). Document prepared by the Collection and Regional Services Branch. Internal document, accessible on demand.

Statistics Canada – Catalogue no. 11-634-X 197
Section 3 - Improving, modernizing and finding efficiencies Chapter 3.5 - Acquisition, use and management of administrative data and alternative data
Chapter 3.5 – Acquisition, use and management of administrative data and alternative data
ContextAdministrative data are information collected by other organizations and departments, not by a national statistical office (NSO), for their own (usually non-statistical) purposes.
Using administrative data allows NSOs to:
• improve the quality of statistical products (e.g., reduce sampling or non-sampling errors);
• improve the relevance of statistical products (e.g., produce more detailed or more frequent estimates);
• fill data gaps;
• reduce the costs of statistical products; and
• reduce response burden.
NSOs have been using administrative data for a long time, for example, in the compilation of National Accounts and for the recording of vital statistics such as births and deaths. In the context of modernization, some NSOs have begun increasing their use of administrative data for the production of statistical information.
In Canada, the Statistics Act of 1918 created a central statistical system, and paved the way for consolidation of the production of official statistics. A significant achievement in the area of vital statistics was noted in 1926: all provinces of Canada at the time were submitting their returns to the Dominion Bureau of Statistics. In the 1980s, Statistics Canada built the Business Register using Canada Revenue Agency income tax records and payroll deduction accounts data. In the 1990s, the agency started building an Address Register, which was first used as a coverage improvement tool for the 1991, 1996 and 2001census programs. Since 2006, the Address Register has been served increasingly as a frame for the census and household surveys, allowing, for example, questionnaires for the 2011 Census to be mailed out to 80% of private dwellings.
Statistics Canada has a long history of using administrative data in its statistical programs, when doing so leads to a better balance between relevance, quality, costs and respondent burden. In its long term vision, however, Statistics Canada plans to move to a model where administrative data become a foundational source of information for producing statistical information, using it whenever it is possible to replace questions asked to Canadians.
Statistics Canada defines administrative data broadly to include data from traditional sources; for example, data sets received from the Canada Revenue Agency, as well as data from alternative sources, such as data generated by electronic devices (e.g., satellites, sensors, scanners, mobile phones).
The Statistics Act7 authorizes Statistics Canada to access all administrative data records that pertain to Canadian society or the Canadian economy held by organizations and departments, under
• Section 13—Access to records held by federal, provincial or territorial departments; municipal offices; corporations, businesses and organizations; and
• Articles 24 to 29—Specific access to income- and excise-tax records and to import, export and justice records.
However, although the agency can rely on legal authorities, the strategic approach of persuasion and a “win–win partnership” is the favoured one. This approach involves trying to find mutually beneficial arrangements to facilitate the exchange of information (e.g., value-added transformation of data) and the exchange of expertise. Each NSO must, therefore, serve as an influencer and play a proactive role in fostering changes that benefit both the statistical agency and suppliers of administrative data.
7. GOVERNMENT OF CANADA, 2005.

Statistics Canada – Catalogue no. 11-634-X198
Compendium of Management Practices for Statistical Organizations From Statistics Canada’s International Statistical Fellowship Program
Strategies, mechanisms and tools This section includes four important components that will help NSOs take greater advantage of administrative data in their information production process: (1) the definition of a corporate vision and strategic goals (2) the acquisition of administrative data (3) the use of administrative data, and (4) the management of administrative data.
1. Definition of a corporate vision and strategic goals
NSOs would benefit from identifying a corporate vision and strategic goals for the acquisition, use and the management of administrative data. To do so, each NSO must understand its own environment and emerging issues.
In Canada, as mentioned earlier, Statistics Canada has a long tradition of using administrative data in its statistical programs. The 2009 paper, A Long-Term Vision for Statistics Canada8, stated that “in the context of the kind of data we collect, we need to keep making progress on using administrative data as a substitute for survey data, where possible.” To further develop this vision, a senior management working group, led by an assistant chief statistician, investigated the role of administrative data. In this context, the Committee identified and explored a wide range of statistical and strategic considerations regarding the use of administrative data, including the quality of administrative data, potential changes to legislation and government policy, privacy and public perception concerns, cost issues, and the implications on other government programs.
Following that work, a number of activities took place in Statistics Canada to further increase its use including the development of a policy governing the use of administrative data, creating an inventory of administrative data, building a research program, and establishing a clear governance structure were crucial steps to implementing a formal framework for the use of administrative data.
The need to enhance the use of administrative data has also been dictated by external factors. Among the most important was the creation of the Red Tape Reduction Commission by the Prime Minister of Canada, in 2011. The Commission was asked to identify irritants to businesses and to find ways to reduce business burden. Statistics Canada’s 2012–2013 Report on Plans and Priorities stated that a key priority was the continued expansion of the use of administrative data to reduce response burden. Other factors, such as increasing demand for new data, fiscal constraints, and the need to find better ways to exploit existing data holdings, all contributed to the creation of the Administrative Data Secretariat (ADS), in September 2012, to develop and implement a corporate approach to increasing the use of administrative data. This mandate was passed to the Administrative Data Division further to the merging of ADS and the Tax Data Division, in April 2014.
To establish that corporate approach, the ADS carried out a review of international frameworks for the statistical use of administrative data. Drawing from an official publication of the United Nations Economic Commission for Europe,9 the review compared Canada’s legal, policy and organizational framework and statistical use of administrative data to those of five other countries (Ireland, United Kingdom, New Zealand, Australia and the United States). The study report included 25 recommendations for Statistics Canada to consider in developing its governance framework for the statistical use of administrative data. These recommendations were articulated around the following aspects: the legal and organizational framework, partnerships with data custodians, corporate tools, improved methods and processes, and communications tools. These recommendations served as the basis for a corporate strategy and corporate tools for Statistics Canada. The main elements of this strategy are presented in the following sections.
8. SHEIK, M.A., 2009.9. UNITED NATIONS ECONOMIC COMMISSION FOR EUROPE, 2011.

Statistics Canada – Catalogue no. 11-634-X 199
Section 3 - Improving, modernizing and finding efficiencies Chapter 3.5 - Acquisition, use and management of administrative data and alternative data
2. Acquisition of administrative data
2.1 Establishing and consolidating a governance framework• Legislation, policies and directives
As an initial step, each NSO has to analyze its specific legislation with respect to provisions that ensure the right to access, influence and use administrative data for statistical purposes. Policies, guidelines and procedures provide additional support. Legislation should reinforce the fact that the NSO should have access to and use administrative data, when possible.
In the case of Statistics Canada, these legal provisions include the Statistics Act, the Privacy Act, the Access to Information Act, and other acts that recognize the authority of the Statistics Act, such as provincial or federal legislation. These legal frameworks provide the opportunity to strengthen the agency’s ability to access, influence and use administrative data.
• Organizational and governance structure
The NSO should consider creating a centralized function for the acquisition of administrative data, at least those datasets broadly used in the NSO or complex to acquire. The responsibilities of this function and of other separate, but centralized, functions can include the following components:
• Legal support service and information management;
• Administrative data coordination for the management of corporate strategies, processes and tools; oversight of administrative data operations (capture, formatting/standardization, coding and validation of all incoming administrative data files); and
• Creation and maintenance of base statistical registers (population, business and real estate), including the unique statistical identification of register units.
Whether the acquisition of administrative data is fully or partially centralized, the NSO must also identify and put in place the concept of a central administrative data custodian, i.e., the person / unit responsible for the following functions:
• Liaising with the rest of the organization to understand the needs for the administrative data held by a given data provider;
• Negotiating access to data provider’s administrative data, holding delegated authority to sign and/or administer the agreement (including the respect of terms and conditions), and obtaining metadata associated with the administrative data;
• Allowing others in the NSO access to the administrative data in accordance with the need-to-know principle; and
• Receiving and handling questions from the data provider and other stakeholders as required.
In terms of governance structure, as the place of administrative data grows, the NSO should consider creating an Administrative Data Management Committee consisting of representatives from key areas of the NSO. This committee could be responsible for the following:
• Overseeing the development and implementation of, and compliance with, corporate strategies relating to administrative data;
• Determining the custodian of broadly used or complex-to-acquire administrative data files;
• Making decisions regarding whether to pursue acquisitions of administrative data files that impose significant restrictions or costs on the NSO;
• Reviewing administrative-data initiatives, and recommending changes to foster coherence and efficiency across the agency; and
• Referring key decisions to the most senior management committee in the organization.

Statistics Canada – Catalogue no. 11-634-X200
Compendium of Management Practices for Statistical Organizations From Statistics Canada’s International Statistical Fellowship Program
The operational arm of the Administrative Data Management Committee, including secretarial support, will normally be the centralized function described earlier.
2.2 Designing data acquisition agreementsAs a best practice, NSOs should systematically document the terms and conditions related to the acquisition, management, use and disposal of administrative data.
This official documentation can take the form of the following:
• Formal data acquisition agreements, including memoranda of understanding (same level of government) and agreements (different levels of government or private sector at no cost);
• Contracts (with private sector when costs are involved);
• Informal written communications (where permitted by legislation).
It is important to ensure that the document contain at least the following information:
• The NSO’s legal authority to obtain administrative data;
• The NSO’s intention to use the administrative data;
• The NSO’s legal obligation to protect the administrative data.
Documentation of agreements should be stored in a central repository.
2.3 Developing corporate toolsOne of the objectives of NSOs is to develop corporate and common tools aligned with existing policies and directives. For Statistics Canada, this aligns as well with the Corporate Business Architecture; for more information, refer to Chapter 3.1 – Corporate Business Architecture.
The following are the most important corporate tools for NSOs to develop and implement:
• Administrative data inventory to register all incoming administrative data. The objective is to provide a central repository of information on administrative data holdings that can be viewed and used by employees through the organisation. For consistency and efficiency, maintenance and monitoring should reside with the administrative data centralized function.
• Consultations to collect information on potential uses of administrative data files before an agreement is negotiated. The purpose is to ensure that consultations using a pre-defined template be conducted by the administrative data centralized function with support from program areas. This will ensure that NSO’s needs for the data are well understood and that their use is maximized. This also provides an opportunity to avoid costly duplication of efforts on both the NSO side and the data provider side, which result from unclear needs.
• Quality assessment tools to assist acquisition decisions. The administrative data custodian must conduct the assessment and store the results within the administrative data centralized function. This involves a two-step approach: first, using metadata and the information available from the organization to determine whether the administrative data can fulfill the needs of the NSO; and, second, providing a decision point as to the potential need to investigate further and to acquire administrative data or, at least, a sample or test version of the data. The process for assessing quality has to take into account the institutional environment of the data provider; that is, the organizational or institutional factors that may affect the data provider’s capacity to supply quality administrative data over time from a legislative or reliability perspective. These assessments are to be consistently aligned with the various quality dimensions (relevance, accuracy, timeliness, accessibility, interpretability, coherence). Statistics Canada relies on its quality management framework. For more details, refer to Chapter 4.3 – Management and access to metadata.

Statistics Canada – Catalogue no. 11-634-X 201
Section 3 - Improving, modernizing and finding efficiencies Chapter 3.5 - Acquisition, use and management of administrative data and alternative data
2.4 Managing strategic collaboration and partnershipsManaging strategic collaboration is key to the statistical use of administrative data. This approach can lead to better data and better methods and processes regarding use of the data.
The following actions can result in increased access to better administrative data:
• Developing win–win partnerships with data providers, whereby access to the data by the NSO can result in
− sharing non-confidential results on the quality of the administrative data with the data provider;
− proposing to the data provider ways to improve the collection and processing of administrative data and the related documentation, which, in turn, serve the statistical use of the administrative data later on; and
− returning the administrative data to the data provider once cleaned (with no confidential data added);
• Working with other departments on government-wide policy changes that would facilitate access to federal administrative data;
• Establishing bilateral committees with important data providers (at different levels) to ensure that there is no interruption in delivery and no unplanned changes to the data; and
• Developing rules of engagement with private-sector organizations to secure stable access to their data sources by
− promoting the benefits for them and their clients of reusing existing information rather than conducting surveys; and
− considering tokens of appreciation, such as sharing with them non-confidential aggregates derived from their administrative data.
Finally, developing collaboration nationally or internationally with other NSOs, statistical organizations, the academic community, and the private industry can lead to better methods and processes for using administrative data—in particular, Big Data, which offer new, specific challenges.
Managing collaboration (internally and externally) and maintaining partnerships require effective two-way communications. This can be achieved by developing relevant and effective communications strategies and tools to explain the rationale behind the statistical use of administrative data. Communications channels may include website modules, internal committees, and consultation mechanisms that help inform and engage data providers and stakeholders.
3. Use of administrative data
Administrative data are collected by other organizations for their own purposes, which often are non-statistical purposes. Consequently, the usability of the administrative data will very much depend on the ability to align administrative concepts with statistical ones. This alignment may involve shaping the administrative data at the source, making compromises regarding statistical needs, or seeking innovative solutions.
The use of administrative data can be divided into two categories: direct use and indirect use.
• Direct use refers to the immediate link between the administrative data and the statistical output. Examples of direct use include the direct computation of totals, means and percentiles as a stand-alone use of administrative data; substitution and supplementation for direct survey collection (with respect to certain variables, for all or part of sample units); and the production of analytical outputs.
• Indirect use refers to instances where administrative data play only a supporting role in the creation of the statistical output. Examples of indirect use include the creation and maintenance of survey frames; the construction of sampling designs (stratification, sample allocation, sample selection); editing and imputation; estimation; and data validation or confrontation.
Whatever the use made of the administrative data, the NSO will have to document the statistical output and report on its quality (refer to Chapter 1.5 – Managing quality).

Statistics Canada – Catalogue no. 11-634-X202
Compendium of Management Practices for Statistical Organizations From Statistics Canada’s International Statistical Fellowship Program
4. Management of administrative data
NSOs must manage administrative data, while ensuring the following management practices are systematically and consistently considered and implemented:
• Ensuring confidentiality and security – Agreements, legislation, policies and directives are fully respected. Re-using existing information (i.e., administrative data) is privacy-intrusive. This is why there are additional safeguards when it comes to linking administrative data, or disclosing to third parties, for example. For more details, refer to Chapter 4.6 – Respecting privacy and protecting confidentiality.
• Accessing and preserving data holdings – Limiting access to administrative data holdings to individuals in the NSO who have a demonstrated need-to-know is key. In addition, preserving the proper stewardship of information through the entire information life cycle requires effective information management strategies.
• Disclosing information to a third party under strict conditions – Permitting access under strict conditions only, while underscoring the increased risk of residual disclosure. For more details, refer to Chapter 4.6 – Respecting privacy and protecting confidentiality.
• Communicating with the public and stakeholders—Informing, and engaging with, the public and stakeholders in a transparent and effective way, with a view to building a relationship of trust with data providers, privacy stakeholders and, ultimately, data users.
Key success factorsIn addition to appropriate legislation supporting the access and the use of administrative data, collaborating and engaging with data-provider organizations and seeking win–win strategies are crucial to increasing the acquisition of administrative data and to expanding the use of administrative data. This partnership approach should be built and consolidated through inter- or pan-governmental policies and governance (by ensuring that all partners have input into setting priorities, and identifying and resolving issues). This is particularly useful when one is dealing with multiple partners (multi-jurisdictional).
Finally, because using administrative data is a priority for NSOs, clear directions must come from the top, and enablers—such as the ones described in this chapter—must be put in place.
ChallengesSome NSOs still struggle with developing their own governing legislation for the acquisition and use of administrative data. Establishing an enabling legal framework and building the appropriate organizational capacity are the first challenges facing NSOs.
In addition, managing relationships and partnerships requires continual focus, negotiation capacity, influence, and perseverance, since data providers do not have the same priorities as the NSO. Moreover, the data acquisition processes and agreements could be long and challenging endeavours.
Finally, infrastructure, expertise, resources, and dedicated funds must be in place to support the administrative data function and the corporate tools and processes available to programs areas—with a view to ensuring consistency and efficiency.
Looking aheadFor Statistics Canada, the way forward consists in supporting ,through a dedicated strategy, a key role for administrative data in the way NSOs produce statistics in the future,. In adhering to this approach, the agency aims to promote a whole-of-government approach to collecting information once, and to using it multiple times.

Statistics Canada – Catalogue no. 11-634-X 203
Section 3 - Improving, modernizing and finding efficiencies Chapter 3.5 - Acquisition, use and management of administrative data and alternative data
BibliographyGovernment of Canada (2005). Statistics Act. L.R.C 1985, c. S-19. Amended by 1988, c. 65, s.146; 1990, c. 45, s. 54; 1992, c. 1, ss. 130, 131; 2005, c. 31; 2005, c. 38. Consulted on the 11th of March 2016 and retrieved from http://laws-lois.justice.gc.ca/eng/acts/S-19/FullText.html
Sheikh, M.A (2009). A Long-Term Vision for Statistics Canada. Statistics Canada internal document. March.
United Nations Economic Commission for Europe (2011). Using Administrative and Secondary Sources for Official Statistics: A Handbook of Principles and Practices. United Nations: New York and Geneva. Consulted on the 11th of March 2016 and retrieved from https://www.unece.org/fileadmin/DAM/stats/publications/Using_Administrative_Sources_Final_for_web.pdf

Statistics Canada – Catalogue no. 11-634-X204
Compendium of Management Practices for Statistical Organizations From Statistics Canada’s International Statistical Fellowship Program

Statistics Canada – Catalogue no. 11-634-X 205
Section 3 - Improving, modernizing and finding efficiencies Chapter 3.6 - Gender Statistics
Chapter 3.6 – Gender Statistics
ContextWhile improving and modernizing how statistics are produced leads to gains in efficiency, quality and timeliness, the relevance of statistical organizations is still ultimately a function of their capacity to measure adequately economic and social phenomena for the purpose of informing policy makers and the general public.
To improve the availability of policy-informing statistics, statistical organizations typically must
• understand users’ needs and translate these needs into measurable statistical concepts
• consult and engage with data providers, policy makers and stakeholders
• develop the subject-matter knowledge and capacity to produce statistical outputs consistent with users’ needs
• assess the adequacy of data available to study the phenomena, and identify the data gaps
• establish the right methodology to collect the missing information and put in place the right governance to support this methodology
• make data and analytical outputs accessible to users.
This chapter uses the example of gender statistics programs to illustrate how national statistical offices (NSOs) can use this approach to better meet policy makers’ needs.
Strategies, mechanisms and tools
1. Understanding users’ needs and translating them into measurable statistical concepts
When the need for new or improved statistics has been identified, statistical organizations should typically engage users to identify their detailed statistics requirements, propose high-level solution options, and prepare business cases to meet these needs. In this phase, the organization
• identifies the need for the statistics in question
• confirms, in more detail, the statistics needs of stakeholders
• establishes the high-level objectives of the statistical outputs
• identifies the relevant concepts and variables for which data are required.
The need for gender statistics is driven by major policy issues. In Canada, gender equality is a guaranteed right under the Canadian Charter of Rights and Freedoms and the Canadian Human Rights Act. In addition, since 1995, all federal departments and agencies have been required to implement gender-based analysis (GBA), including GBA frameworks, and to include GBA in all Treasury Board submissions and Memoranda to Cabinet. Finally, in 2010, the federal government developed the Departmental Action Plan on Gender-based Analysis, which provides the structure for federal departments and agencies to create a gender-based analysis framework and to apply gender-based practice in their service delivery.
Topics of interest to understand and address gender inequalities include the following:
• Labour force participation, workplace decision-making, and entrepreneurial opportunities
• Income, unpaid work, and paid work/family balance
• Access to assets, education, and health services
• Gender-based attitudes and violence
• Social exclusion and treatment of minority groups

Statistics Canada – Catalogue no. 11-634-X206
Compendium of Management Practices for Statistical Organizations From Statistics Canada’s International Statistical Fellowship Program
There must be differentiation between the concept of gender and the simple measure of phenomena by sex. The starting point in such an analysis is to make the distinction between two terms: “sex” and “gender.” “Sex” is a reference to the relatively fixed biological and physiological characteristics that define men and women. “Gender” is a reference to the socially constructed roles, behaviours, activities, and attributes that a given society considers appropriate for men and women, respectively.
Sex-disaggregated data are needed to show the differences between women and men in a given society. Data must be disaggregated by sex to allow for analysis of gender issues. However, this alone is not sufficient for gender analysis. In this sense, gender statistics are much more than the simple disaggregation of data by sex: they also require policy-oriented approaches that will help identify the information required to inform and understand the problems.10 Gender-based analysis can help tailor policies, programs, initiatives and services for the purpose of responding to the differing realities of women and men, and can help advance the evaluation of existing legislation and initiatives.
Gender statistics is not a discrete or isolated field. This field relates to all fields of statistics, cutting across traditional fields to identify, produce and disseminate statistics that reflect the realities of the lives of women and men. It is crucial to recognize that gender intersects with other identity factors, such as age, education, language, geography, culture and income. For full gender sensitivity, statistics must respect all the key gender issues in the country, and cover issues, such as maternal mortality or prostate disorders, which might affect only one sex.
2. Consulting and engaging data providers, policy makers and stakeholders
Engagement and consultations with data providers, policy makers and other stakeholders will increase the availability, relevance and quality of the information being produced. For example, in the context of gender statistics, data producers should interact more closely with data providers and users to allow improvements in the following areas:
• Identification of known and possible gender issues in society and the resulting need for greater knowledge and understanding
• Production of gender statistics with emphasis on determinants of outcomes
• Marketing and dissemination of gender statistics.
• Gender and policy analysis
• Use of gender analysis for policy actions
• Identification of data gaps and of instruments (concepts, questions, etc.) to help fill those gaps.
The experience of Statistics Canada’s first Violence Against Women Survey (VAWS) (see box 3.6.1) also taught the organization that projects in this area require developing or enhancing customized and innovative solutions and that heretofore unmet or new data needs should be supported by experts—to rapidly develop the subject-matter knowledge and adopt the right strategies for responding to critics.
3. Developing the subject-matter knowledge and capacity to produce statistical outputs relevant to users’ needs
Strategies to develop and enhance specific subject-matter knowledge and statistical capacity within an NSO include targeted recruitment, informal and formal training, in-depth literature review, consultations with external experts, and participation in working groups.
Because gender statistics is a cross-cutting theme, experience has shown that it is important to focus on awareness, sensitivity and training. Gender-based analysis training throughout the organization can be more effective than establishing bureaucratic checkpoints or vetting offices.
Awareness and sensitivity campaigns need to put emphasis on departmental and individual responsibilities and accountabilities with respect to gender. Such campaigns foster understanding of, and support for, gender-based analysis, and are therefore very valuable.
10. UNITED NATIONS ECONOMIC COMMISSION FOR EUROPE, 2010.

Statistics Canada – Catalogue no. 11-634-X 207
Section 3 - Improving, modernizing and finding efficiencies Chapter 3.6 - Gender Statistics
Training areas could be related to specific functions (i.e., for policy development, research, evaluation, communications, consultations, program delivery); other training deemed important through a needs assessment could also be provided. Networking and sharing knowledge can also be seen as important informal training opportunities. At the international level, for example, Statistics Canada participates in international working groups and conferences, including the Interagency Expert Group on Gender Statistics, to share information and network.
In Canada, the federal government has developed an online gender-based analysis and training tool available to all federal public servants, as well as those outside the federal service.11 As part of the training tools provided by the government, the Gender-based Analysis Plus (GBA+) is an analytical tool that the federal government uses to advance gender equality in Canada. The “plus” in the name highlights that gender-based analysis goes beyond gender, and includes the examination of a range of other intersecting identity factors (such as age, education, Aboriginal person, member of a visible minority, language, geography, culture and income). This tool is used to assess the potential effects of policies, programs or initiatives on diverse groups of women and men, girls and boys, taking into account gender and other identity factors. GBA+ helps recognize and respond to the different situations and needs of the Canadian population.
4. Assessing the adequacy of data available to study the phenomena and identify the data gaps
Once users’ needs are defined and statistical organizations understand what should be measured, the next step is to check the extent to which current data sources can meet these needs and, if necessary, to prepare the business case (i.e., to produce the statistics) for approvals. This requires not only an assessment of the data included in several sources, but also the condition under which they were produced, to ensure that they comply with minimum standards of quality.
Data in support of gender-based analysis come from several sources, including, but not limited to, census, administrative data and surveys. Different types of data have different strengths and weaknesses. The main challenge of using administrative data for gender-based analysis relates to the reliability of existing databases—data are often pulled from existing administrative databases, which may or may not capture information on sex. If they do, the data are not contextualized in a manner that permits analysis of outcome determinants from a gender perspective. For example, in Canada, for justice statistics, the sex of the offender is collected while the sex of the victim is not. This information gap limits the gender-based analysis on victimization.
On the other hand, survey or population-based data often exclude certain population groups in Canada as a result of
• language barriers experienced by immigrants, especially new immigrants, when surveys are conducted in English or French; and;
• the exclusion of institutionalized populations – homeless persons, persons in shelters, persons in prisons, and persons in long-term care facilities.
Integrating different data sources through record linkage can strengthen gender-based analysis and address information gaps; however, doing so requires some advanced technical capacity and reliable matching variables.
Addressing the data gaps through the introduction of a new survey or the redesign of an existing one does not come without a cost. However, in some cases, this is the only option for analyzing phenomena that are otherwise not measured, as the experience of Statistics Canada’s VAWS showed (see box 3.1).
5. Establishing the right methodology to collect the missing information and the right governance to support this methodology
When NSOs are trying to measure new social or economic phenomena, a literature review of the available statistical frameworks recognized internationally should be one of the first steps to consider, in order to determine
11. For more information about the federal gender-based analysis framework, visit the Status of Women Canada website, http://www.swc-cfc.gc.ca/gba-acs/intro-en.html.

Statistics Canada – Catalogue no. 11-634-X208
Compendium of Management Practices for Statistical Organizations From Statistics Canada’s International Statistical Fellowship Program
the right methodology to conceptualize, collect and analyze the information. These frameworks not only usually provide a certain assurance of international comparability but also can greatly contribute to improving the quality of the data being produced (see Chapter 1.3 – Following international standards).
The process of producing gender statistics is similar to that for other fields of statistics. This process typically involves a number of key steps included in the Generic Statistical Business Process Model that integrate a gender perspective.12 The following steps are specific activities that help improve the overall availability and quality of gender statistics:
• Selection of topics that need to be investigated, and identification of the data needed to understand gender differentials and women’s and men’s roles and contributions in various spheres of life;
• Evaluation of existing concepts, definitions, and methods for producing unbiased gender-relevant information;
• Methodology and production techniques that take into account stereotypes and social and cultural factors that might produce gender-based biases;
• Choice of appropriate unit of enumeration about which to collect information and appropriate survey design, such as the definition of a sampling plan and sample size. That is best achieved by first having a clear idea of the types of analysis that the data must support. In that sense, establishing in advance a broad analytical framework that will combine sex-disaggregated with qualitative policy-relevant questions is recommended;
• Development of the appropriate data collection instruments, approaches and mechanisms, given the sensitivity of the subject matter (e.g., sensitivity training, sex of interviewers), that will also ensure a standard approach in data collection and avoid sources of gender bias;
• Processing of data using practices that will deliver reliable results; and
• Regular analysis and presentation of sex-disaggregated statistics in easy-to-use formats; dissemination of gender-sensitive statistical products to a wide range of users, including policy makers and planners; development of analyses and presentation of data that can reach policy makers and the largest audience possible.
The governance structure overseeing the development, production and dissemination of new or improved statistical outputs or programs must also be conducive to favorable change. For example, given the cross-cutting nature of gender statistics, there are different options for an NSO to consider when establishing its governance structure.
The creation of a gender focal point or centre of expertise within an organization is ideal to champion the integration of gender statistics in every subject-matter division. This gender focal point may be located within a specific organizational unit (e.g., a division), or this may involve reporting directly to the Chief Statistician. The organizational positioning within the NSO, however, is less important than the real ability to influence the entire organization.
Statistics Canada aims to incorporate consideration of gender issues into the operations of each subject-matter division by developing gender-sensitivity awareness and expertise. In the overall organization, there is no formal unit specifically dedicated to gender statistics, but there is a focal point included under the Social and Aboriginal Statistics Division. This focal point is responsible for producing gender-based analytical reports and for compiling the Women in Canada compendium publication, a collection of gender-based analysis articles published every five years. This collection requires subject-matter contributions from all across the organization to highlight the improvements in the area of, and the challenges to, gender equality.13
6. Make data and analytical outputs accessible to users
As shown in section 4 of this chapter, there are various ways to make statistical outputs available to users (e.g., official dissemination, use of various communication channels, and use of microdata access facilities). NSOs must ensure that users are acquainted with the type of information available to them and know how to access this
12. UNITED NATIONS ECONOMIC COMMISSION FOR EUROPE, 2010.13. STATISTICS CANADA, 2012.

Statistics Canada – Catalogue no. 11-634-X 209
Section 3 - Improving, modernizing and finding efficiencies Chapter 3.6 - Gender Statistics
information. The participation of NSOs in various networks, including networks of experts, academics and policy makers, can help further disseminate what is available, and can contribute to NSOs taking full advantage of the data holdings.
Statistics Canada’s gender statistics program, for example, includes a broad range of sex-disaggregated tabulations, regular gender-based reports and analytical papers, and a vast collection of microdata files available to the public. Over time, the organization has participated in various task forces and working groups to share knowledge, experience and information. From time to time, Statistics Canada’s work with some of these groups has led to a publication; e.g., Finding data on women: a Guide to major sources at Statistics Canada.14 This document, produced by Statistics Canada for Status of Women Canada, gives policy analysts, women’s groups, organizations, researchers and other data users a comprehensive overview of the scope and diversity of data available on Canadian women and men, as well as an indication of the ways in which these data can be used. It has certainly contributed to increasing the use of Statistics Canada’s data in gender-based policy research.
Key success factorsKey success factors to improving statistical programs, in general, are usually program-specific. First, to enhance gender-statistics programs, it is important to use the appropriate tools and mechanisms throughout the entire statistical process and to consider the gender perspective for each aspect of the statistical process. Second, continuous engagement with stakeholders and potential critics, throughout this process, is crucial to ensuring the utility and relevance of the data being produced and the subsequent buy-in. Third, awareness and training of employees with respect to the gender perspective is key to ensuring strategic implementation.
Finally, at Statistics Canada, the most efficient way is to address gender statistics from a systemic and integrated perspective. A gender focal point, wherever located in the structure, ensures organization-wide consideration of gender issues, and could include the following elements:
• acquisition or development of gender-focused expertise and capacity
• ongoing training and strong lines of communication
• engagement, on specific gender issues, with policy makers, academic researchers, data-providers, and other stakeholders.
Challenges and looking aheadIn their quest to continuously improve their statistical programs, NSOs faced various challenges (limited resources and statistical capacities, political buy-in, competing priorities, etc.). For gender statistics in particular, it can be difficult to ensure the following:
• Attract, retain and maintain expertise in the domain;
• Secure funds for ongoing gender statistics training and gender-sensitive programming; training should be considered agency-wide;
• Design gender-sensitive surveys and programs;
• Commit to gender equity from decision-makers;
• Receive support from government, civil society and donors.
NSOs must develop strategies to overcome these challenges. For gender statistics, the time for advocacy might be at the time of the release of the new sustainable development goals (SDG), in particular the SDG#5, which is to achieve gender equality and empower all women and girls.15
14. STATISTICS CANADA, 2007.15. UNITED NATIONS, 2015.

Statistics Canada – Catalogue no. 11-634-X210
Compendium of Management Practices for Statistical Organizations From Statistics Canada’s International Statistical Fellowship Program
Box 3.6.1Conducting the first survey on violence against women – The Canadian experience, 1993
Violence against women is a persistent and ongoing problem in Canada and around the world. It affects women’s social and economic equality, physical and mental health, well-being, and economic security. Unfortunately, although acts of violence are subject to legal prosecutions, they are often under-reported and, therefore, cannot be properly measured and analyzed by means of police and justice administrative records.
As decision-makers require a clear understanding of the nature and severity of social problems to develop effective responses, Health Canada gave Statistics Canada the mandate to conduct its first Violence Against Women Survey (VAWS), in 1993.
Challenges in conducting a VAWS for the first time and strategies employed to overcome themConducting a VAWS for the first time brought a series of challenges. At that time, subject-matter experts did not have comprehensive information on the types of crimes to which women were particularly vulnerable. To collect this information, the experts had to choose from various definitions of the concept of violence and establish, in advance, an analytical framework that would produce policy-relevant “information,” not just numbers. To achieve this, Statistics Canada established early on a transparent consultations process with stakeholders, gender academic experts, and potential critics to ensure the utility and relevance of the data. In particular, these consultations highlighted the importance of using recognized definitions for measuring the violence phenomena, such as the ones included in the Criminal Code of Canada.
In addition, given the nature of the survey, special considerations had to be taken into account (1) to gain respondents’ trust in order to avoid response bias, (2) to ensure the protection of respondents’ safety, and (3) to deal with potential respondents’ emotional trauma. In this regard, Statistics Canada adopted collection approaches and mechanisms that were appropriate to the sensitivity of the subject matter. For example, the survey took place by phone, and only female interviewers conducted the interviews. Interviewers were sensitized to understanding and recognizing the signs of emotional distress or risk to respondents’ safety. They were provided with various tools to probe respondents on the potential security risks of conducting an interview over the phone, (their conversation might be overheard), and on the need to find an alternative way of collecting personal information. Interviewers were also provided with a list of shelters and services for abused women to assist respondents who asked for help. Interviewers also received support from a psychologist during the data collection period to cope with some difficult situations.
Another challenge when dealing with a sensitive subject is to anticipate the reactions to, and criticism of, the survey results. To avoid being accused of sensationalism or exaggeration, the prevalence of a phenomenon must be supported by a strong communication strategy. Statistics Canada learned from this survey that establishing a steering committee early on in the process—to advise the organization on ways to respond to the critics in innovative statistical fields—was very valuable, since it could be too much for survey managers to handle.
VAWS results and lessons learnedIn total, 12,300 women were interviewed during the VAWS. Survey results showed that
• 50% of Canadian women had experienced at one incidence of physical or sexual violence since the age of 16
• 29% of women had been in a relationship where they had experienced violence from their intimate partner
• 3% of women were victims of spousal violence annually.
More importantly, one of the main findings of the survey was that 25% of the respondents, who declared that they had been a victim of violence, used the survey to report this for the first time, an outcome that highlighted the prevalence of unreported violence when using administrative records only.
These results considerably enhanced public awareness of this social problem. Detailed data on prevalence, correlation with risk markers, impacts, reporting to police, and use of social services were produced and shared with practitioners, service providers, researchers, and lawmakers.

Statistics Canada – Catalogue no. 11-634-X 211
Section 3 - Improving, modernizing and finding efficiencies Chapter 3.6 - Gender Statistics
The VAWS experience however highlighted the need for the following:• Permanent expertise in and advocacy for gender equity within the NSO; that is, NSOs must find ways to attract,
recruit and retain expertise.
• Gender statistics training and gender-sensitive programming, incorporating gender analysis and gender-sensitive survey and program design.
• A more complete picture of the difference between the violence experienced by men and women, as well as by subpopulation groups such as youth, Aboriginal people, members of a visible minority, and people with disabilities.
To address the latter, a module on victimization was added to the Statistics Canada’s general social survey, which is carried out every five years, and targets both women and men over 15 years of age. This more inclusive approach allows analysts to better understand the difference between the nature and the impact of violence experienced by women and by men, as well as population subgroups.16
footnote 16
16. STATISTICS CANADA, 2013

Statistics Canada – Catalogue no. 11-634-X212
Compendium of Management Practices for Statistical Organizations From Statistics Canada’s International Statistical Fellowship Program
BibliographyStatistics Canada (2007). Finding Data on Women: A Guide to Major Sources at Statistics Canada. Consulted on the 11th of March 2016 and retrieved from http://publications.gc.ca/collections/Collection/SW21-22-2007E.pdf
Statistics Canada (2012). Women in Canada: A Gender-based Statistical Report. Consulted on the 11th of March 2016 and retrieved from http://www5.statcan.gc.ca/olc-cel/olc.action?ObjId=89-503-X&ObjType=2&lang=en&limit=0
Statistics Canada (2013). Juristat – Measuring violence against women: Statistical trends. Consulted on the 11th of March 2016 and retrieved from http://www5.statcan.gc.ca/olc-cel/olc.action?lang=en&ObjId=85-002-X201300111766&ObjType=47
United Nations (2015). Transforming Our World – The 2030 Agenda for Sustainable Development. Consulted on the 11th of March 2016 and retrieved from https://sustainabledevelopment.un.org/?menu=1300
United Nations Economic Commission for Europe (UNECE) (2010). Developing Gender Statistics: A practical tool. Reference manual prepared by the UNECE Task Force on Gender Statistics Training. Geneva. Consulted on the 11th of March 2016 and retrieved from http://www.unece.org/fileadmin/DAM/stats/publications/Developing_Gender_Statistics.pdf
World Health Organization (2015). Gender, equity and human rights. Consulted on the 11th of March 2016 and retrieved from http://www.who.int/gender/whatisgender/en/index.html

Statistics Canada – Catalogue no. 11-634-X 213
Section 4 - Communicating with key stakeholders Introduction
Section 4 – Communicating with key stakeholders
Introduction
The first chapters of this compendium examined (1) the key characteristics of an effective statistical system, (2) the fundamental management practices that a statistical agency should consider and implement, and (3) the continuous modernization and improvement of projects to maintain data quality and relevance. The final section will concentrate on strategies relating to survey respondents and data users: How do you inform them, communicate with them, engage them, and offer them diverse ways to access to data? How do you establish effective strategies that meet their needs and, at the same time, comply with privacy and confidentiality rules?
Before elaborating further on these strategies, it is important to remember that any statistical agency must make relations with survey respondents and data users a central priority. Without the contribution of survey respondents, there would be no viable results, and therefore, the mandate would not be fulfilled. Without the data user community, there would be neither purpose nor relevance to the statistical agency’s mission.
Chapter 4.1 examines why a statistical agency should consider its website as the key to providing effective, relevant and timely access to its data. Drawn from Statistics Canada’s experience, this chapter focuses on strategies that have been adopted to collect user feedback and guide website development toward a dissemination model based on free data, user-friendly navigation, and adoption of open-data principles.
Chapter 4.2 focuses on the foundations of effective external communication strategies to develop for the various data user communities. This chapter gives examples of how Statistics Canada informs the public of program results, conveys a positive image and continues to bolster its reputation for excellence. Finally, the chapter presents initiatives carried out by the agency—using Web 2.0 tools—to help generate interest and encourage individuals and businesses to participate in surveys.
Chapter 4.3 explains access to metadata and their significance in developing a common understanding and consistent management of terminology and key concepts for surveys and official statistics.
Chapter 4.4 is devoted to improving access to microdata by offering a continuum of varied services to a more specialized audience that is “savvy” in using and understanding data. Savvy audiences refer to researchers and policymakers in federal departments.
Chapter 4.5 highlights the importance for a statistical agency to continuously improve its relations with survey respondents, be they households or businesses. This chapter looks at a number of strategies developed by Statistics Canada to generate interest and encourage respondents to take part in surveys, particularly in social surveys.
Lastly, chapter 4.6 reiterates the importance for a statistical agency to consider privacy and confidentiality as fundamental to its activities. Unless the statistical agency thoroughly respects confidentiality, it will build neither credibility nor trust in the eyes of respondents and the public; consequently, it could easily tarnish its image and reputation. The chapter cites various strategies and mechanisms used by Statistics Canada to ensure confidentiality and privacy.

Statistics Canada – Catalogue no. 11-634-X214
Compendium of Management Practices for Statistical Organizations From Statistics Canada’s International Statistical Fellowship Program

Statistics Canada – Catalogue no. 11-634-X 215
Section 4 - Communicating with key stakeholders Chapter 4.1 - Disseminating data through the website
Chapter 4.1 – Disseminating data through the website
ContextFor national statistical offices, a website is much more than an information tool: it is a powerful communication medium. Because websites must evolve in lockstep with new technologies, they require constant and ongoing updating and improvement in order to remain accessible and relevant to their various users’ needs.
The Statistics Canada website is a model for statistical data dissemination nationally and internationally. The website is Statistics Canada’s most important dissemination tool—it provides access to timely, relevant, and high-quality statistical information on the country’s economy and society that meets the needs of Canadians.
Nationally, Statistics Canada was among the first federal departments to venture onto the Internet. The Statistics Canada website was launched in 1996 with The Daily as its only content. Over time, content was added to the website as Internet use increased.
With over 25 million visits per year over the last number of years, Statistics Canada is among the most visited Canadian government websites. The agency publishes statistical information that includes studies, reports, research papers, statistical tables, methodology documents, and other information on a diverse set of subjects to give Canadians an in-depth view of the country’s economy and society.
The website includes the following:
• The official release bulletin: The Daily
• two large output databases (Canadian Socioeconomic Information Management System (CANSIM), imports and exports)
• thousands of data tables;
• census modules, including community profiles, highlight tables, topic-based tabulations, and data visualization tools
• major modules for browsing information: “Statistics by subject”; “Information for analysts and researchers”; “Information for survey participants”; “Stay connected” (including blogs, chat sessions with experts, and a video centre).
The website serves very diverse user needs in terms of breadth and depth of statistical expertise. Journalists, economists, researchers, policy makers, high school students, businesses, nongovernmental organizations, and the general public access the website on a daily basis. The agency must ensure that information is presented in a way that suits their needs and levels of expertise.
The widespread use of the Internet confirmed that, while traditional models of dissemination are effective for some audiences, information publishers have moved from more traditional publication formats to data-driven approaches. In the wake of other national initiatives (United Kingdom, United States of America and Australia) to give free access to data in a reusable format, the Government of Canada launched its Open Data Portal in March 2011. Statistics Canada fully supports the Open Data initiative, and the portal includes datasets from Statistics Canada that represent an important portion of the overall data published by the agency. In fact, Statistics Canada developed this version of the open data portal and operates it on behalf of the Treasury Board Secretariat.1 The Open Data initiative requires the publication of data in machine-readable and reusable formats, non-restrictive licenses, and open standards. Statistics Canada is aligning its dissemination objectives with the principles of open data (see details in section 3 of this chapter, on the New Dissemination Model).
Today all Statistics Canada’s aggregate data can be found not only on the agency’s website, but also on the Government of Canada Open Data Portal.
1. The Treasury Board of Canada is a government central agency.

Statistics Canada – Catalogue no. 11-634-X216
Compendium of Management Practices for Statistical Organizations From Statistics Canada’s International Statistical Fellowship Program
Strategies, mechanisms and toolsGiven the importance of this dissemination and communication outreach channel, statistical organizations should apply the following strategies when reviewing, monitoring and improving their websites’ content and usability and their management practices and operations regarding the dissemination of data:
• Seek feedback from users through consultations and other means.
• Move towards free data and easier access to data.
• Continually modernize the way statistical information is disseminated.
1. Consultations, feedback, and metrics tools
To ensure the relevance and efficiency of their websites, statistical organizations need to continually be aware of, and understand, the needs of their various audiences. To this end, they can conduct consultations and seek their users’ feedback through a variety of channels. Statistics Canada relies on four complementary sources of information to understand its Web presence and gather evidence on visitors, expectations, and patterns used to navigate through the website.
• Consultations with users – Statistics Canada systematically applies a robust program of user consultations. This program focuses on usability testing for major Web developments, including Web module redesign, the “Search” function, new Web content, and navigation improvement and simplification.
• Website Evaluation Survey (WES) – Online surveys have been conducted periodically since 1997 to measure users’ satisfaction with the website; identify successes and opportunities; and obtain feedback on recent improvements. As well, since 2010, the WES has been measuring the task completion rate for its respondents. It is important to note that the WES is conducted with a self-selected sample of site visitors. Through the WES, Statistics Canada receives feedback from 10,000 website visitors annually.
• Internet Visitor Pattern Analysis (VPA) – Statistics Canada has conducted several VPAs to gain insight into the behaviour of visitors to the website. VPAs use quantitative data (log files over a period of 6 months in 2009 and 12 months in 2010) to derive relevant information about visitors’ profiles, visit duration, top navigation, content preferences, brand recognition, etc.
• Web metrics – Quantitative information has been gathered daily since 1997 from log files of web servers. The information is organized by means of the Web Trends Interactive tool to produce summary reports on visits, downloads, and overall use of the website.
2. Moving towards free data and easier access to data
The Web enables statistical agencies to provide greater access to statistics and metadata and to do so at a lower cost. The detail made available is no longer limited by the size of the publication as it was for print publications. Disseminating statistical products through a website enables statistical organizations to move towards more versatile, interactive, impartial, timely and cost-effective access to information.
In Canada, a significant step towards freeing more data was taken in February 2012, when the CANSIM database and self-standard products became free of charge. License restrictions have been removed as well. This major Statistics Canada initiative is in line with the open-data approach maintained by the Government of Canada, which has been also successfully adopted by many other countries.
Providing this vast repository of information free of charge has increased its use by one of the site’s main audiences: the general public. To meet another long-standing user need (making it easier for users to access data) and improve task completion for new visitors to the site, a new user interface for CANSIM was developed and launched, also in February 2012. The interface drew upon best practices in online data publishing to provide site visitors with an initial view of the data in fewer than three clicks. From that initial view, they have the opportunity to customize their tables (layout and information) to their specific needs. Decisions regarding the new interface have been based on user consultations and usability testing results.

Statistics Canada – Catalogue no. 11-634-X 217
Section 4 - Communicating with key stakeholders Chapter 4.1 - Disseminating data through the website
To increase access to statistical information by Canadians, Statistics Canada conducted a comprehensive review of its standard products to set new criteria and business rules for identifying products that should be disseminated on the website. The criteria reflected users’ needs, product availability for Web dissemination, and the level of effort required to move to the online channel.
3. Continually modernizing the way statistical information is disseminated: adopting the New Dissemination Model from Statistics Canada
The advent of information and communication technologies has opened up more and more possibilities for providers and users of statistics. To ensure relevance and to take advantage of the new technologies, statistical organizations must make sure that their dissemination services and tools also evolve over time. In some cases, this may require significant redesign of their current tools.
In Canada, this redesign is being carried out through a modernization initiative called the New Dissemination Model. The objective of this project is to develop methods and a framework for better dissemination of data to the public, with a main focus on aggregate statistics. This major project has been approved and managed as a Corporate Business Architecture project and is being overseen by multidisciplinary governance committees, including an external advisory panel that is user driven.
3.1 There are five key drivers for this new model:• the need to consider a more data-driven approach, which focuses less on traditional publication formats
• the need to address the lack of coherence in how aggregate data are organized for dissemination and how data are presented
• the need to respond to the pressure to move towards open data, that is, to make more data available free of charge, free of licensing restrictions, and in machine-readable formats that increase data use
• the need for a single catalogue or registry of Statistics Canada products, which will permit better navigation through the agency’s information holdings
• the need for greater efficiency through streamlining core systems, technologies and standards.
3.2 Advantages of the New Dissemination Model The advantages of Statistics Canada’s dissemination model are the following:
• A new, single, mandatory output database to present and disseminate data to the public that provides a common and consistent interface for all data products.
• A radical simplification of the product line (standardized containers and processes adopted uniformly throughout the organization) in terms of the way data are organized. This simplification integrates the following features:
− Consistent look and feel, functionality, and interconnectivity (crosswalks) across the website;
− Main entry point: either “Search by subject” or “Search by geographic area” using a mapping application;
− Key single-number indicators (unemployment rate, consumer price index, gross domestic product, for example);
− High-level / day-of-release summary table and analysis.
• Easier access and improved organization and navigation.
• An output metadata framework.

Statistics Canada – Catalogue no. 11-634-X218
Compendium of Management Practices for Statistical Organizations From Statistics Canada’s International Statistical Fellowship Program
3.3 Project scopeThe first year (2012/2013) focused on the preparation of a detailed blueprint for the new model, which is based on corporate experience, existing metrics and user feedback, as well as wide consultations with Statistics Canada’s user community (internal and external).
Subsequent years (2013/2014 and 2014/2015) of the project are focused on development, testing and implementation of the New Dissemination Model, as outlined in the blueprint. Years 4 and 5 are dedicated to full deployment and implementation (2015/2016 to 2016/2017).
3.4 The pyramid concept: offering different levels of materials to a large range of usersThe pyramid approach (see figure 4.1) consists in offering different levels of materials to a large range of data users: from simple indicators to more complex data; from users who just want a single number, to those looking for a simple reference table or a more detailed view.
Figure 4.1 Statistics Canada’s pyramid approach to its dissemination model

Statistics Canada – Catalogue no. 11-634-X 219
Section 4 - Communicating with key stakeholders Chapter 4.1 - Disseminating data through the website
3.5 Consultation activities and user feedbackTo ensure the adoption of a dissemination v responsive to users’ needs, consultations were conducted in the form of
• in-person group consultations based on a discussion guide containing specific points for discussion with users
• online consultations with diverse user groups
• usability-testing activities to get feedback on users’ experience (search and navigation).
Business intelligence analysis and other research, in the form of analysis of Web metrics and research of best practices in other national statistical organizations, were also conducted.
3.6 Governance structure Undertaking the complete redesign of a statistical organization’s main dissemination media requires strong governance for the organization to exercise proper control over the project, while ensuring that its implementation and final outcomes are coherent with its practices and policies. At Statistics Canada, as explained in the Departmental Project Management Framework Guidelines, the governance of CBA projects, including the New Dissemination Model, is assured by several governance committees:
• The Executive Management Board is the organization’s senior governance body (composed of the Chief Statistician and Statistics Canada’s five assistance chief statisticians);
• The Project Steering Committee is responsible for the business issues associated with projects;
• The Field Planning Board monitors project execution and produces a quarterly report;
• The Corporate Business Architecture Management Committee monitors application of CBA pre-approved plans;
• The Systems Architecture Review Board focuses on projects that include an information technology (IT) component. This board ensures that IT systems are developed following sound architectural principles, using a set of tools and methods, and in a way that meets the business needs of the agency and the IT security policies of both Statistics Canada and the Government of Canada.
An external expert advisory panel was also established to enlist the input and expert advice from a variety of key user groups, as well as experts from the information and statistical industries.
Key success factors Statistics Canada’s experience shows that planning and implementing targeted, relevant and timely communications activities has been key to the success of the planning and implementation of the New Dissemination Model. Based on effective teamwork by the Dissemination and Communications teams, efforts, coordination and synergy have helped ensure that consultations and communications regarding scope, important milestones, and timelines are taking place. Also the teams ensure that relevant information is communicated, both internally with employees, and externally with stakeholders and users.
In addition, the use of Web 2.0 collaboration tools (such as blogs and online chat sessions with experts) and social media (platforms on YouTube and Twitter) have been very effective in increasing interactions with users and traffic to the website.
Finally, the dissemination of all Statistics Canada’s aggregate data on the Government of Canada Open Data Portal was facilitated in two ways:
• by adopting early the principles of open data, and by complying with new government directives while disseminating information through the website;
• by playing a behind-the-scenes role as the operating organization in charge of maintaining the Government of Canada Open Data Portal.

Statistics Canada – Catalogue no. 11-634-X220
Compendium of Management Practices for Statistical Organizations From Statistics Canada’s International Statistical Fellowship Program
Challenges Websites can become both voluminous and complex. To keep the Statistics Canada website relevant to its wide variety of users, who have different needs and make different uses of the data, its content needs to be constantly reviewed and managed. The website must make available not only static information but also more dynamic content, involving interactive tools (such as data visualization tools, interactive maps and infographics).
In addition, given the rapid evolution of electronic devices, the website must be made accessible by means of various types of electronic devices so that it can be aligned with users’ preferences in terms of access to, and use of, the agency’s data.
Finally, statistical organizations’ websites often have to comply with government rules and regulations. This might require adopting a consistent look and feel, introducing accessibility requirements (e.g., for visually impaired persons), and composing with interconnectivity constraints across the website, to name a few. Strong governance is again essential to maintaining knowledge of, and compliance with, these rules and regulations.
Looking ahead Statistical organizations must continue to seek opportunities for meeting the evolving needs of their data users. They must do this by adopting new data formats, government standards on accessibility, and data visualization tools, while ensuring the security and flexibility of their respective dissemination infrastructures. It is important to mention that, given the massive evolving need and appetite for the Internet and its various uses, the challenge will be to strategically prioritize in this regard and to determine what must be done as regards the organization’s core function to allow free and easier access to data—while encouraging others to take the lead in reusing and redistributing the data thorough their own channels.

Statistics Canada – Catalogue no. 11-634-X 221
Section 4 - Communicating with key stakeholders Chapter 4.1 - Disseminating data through the website
Bibliography Beaudoin, G. (2009). Beyond Web Archiving, Sustainable Content Management, Presentation to the International Marketing and Output Database Conference, Statistics Canada.
Government of Canada. Open Data Portal. Consulted on the 11th of March 2016 and retrieved from http://open.canada.ca/data/en/dataset
Statistics Canada. Strategic Plan for the Statistics Canada Website (Fiscal years 2013/14 to 2015/16), Dissemination Division. Internal document. Accessible on demand.
Statistics Canada. Statistics Canada’s website. Consulted on the 11th of March 2016 and retrieved from www.statcan.gc.ca

Statistics Canada – Catalogue no. 11-634-X222
Compendium of Management Practices for Statistical Organizations From Statistics Canada’s International Statistical Fellowship Program

Statistics Canada – Catalogue no. 11-634-X 223
Section 4 - Communicating with key stakeholders Chapter 4.2 - External communications and outreach
Chapter 4.2 – External communications and outreach
ContextAll organizations, whether in the public or private sectors, must advertise and promote their programs and services to their target groups. These are the basic pillars of external communication and outreach. Given the context in which they operate, organizations target and implement the strategies and activities that will help them achieve their objectives and have a positive impact on their audiences.
For Statistics Canada, external communications are crucial to ensuring that Canadians have access to current, relevant and quality information on Canada’s changing economy and society. This information is used to support debate, research and decision-making on social and economic issues.
Like all Government of Canada departments and agencies, Statistics Canada must comply with the Communications Policy of the Government of Canada when distributing communications. According to this policy, all federal departments and agencies must ensure that they use a variety of communication means and mechanisms to provide timely information on the products and services offered to Canadians, regardless of their information needs and preferences.
Given the scope of data collected and published by Statistics Canada, or any other statistical agency, the agency must deal with a wide range of data users and partners. These groups include all levels of government (federal, provincial, territorial and municipal), the private sector, the academic sector, the media, non-profit organizations, the general public and international partners.
Strategies, mechanisms and toolsA good external communication strategy involves adopting a targeted approach that is rooted in new information technology and web development, using a variety of mechanisms and tools, and combining conventional communication practices with innovation. In this way, the agency ensures that it meets the following objectives:
• Efficiently update the public on program results, official statistics and analyses on society and the state of the economy.
• Project a positive image of the agency to cement its reputation of excellence.
• Generate interest and encourage individuals and businesses to take part in the agency’s surveys.
The next section presents the mechanisms and tools that have enabled Statistics Canada to implement this strategy.
1. The Statistics Canada website – the centralized dissemination tool
The Statistics Canada website is the main tool in Canada for disseminating data. On average, it receives over 25 million hits and over 150 million page views annually. Given its major role in disseminating statistical data, this medium is thoroughly discussed in Chapter 4.1: Disseminating data on the website. This chapter describes the evolution of the Statistics Canada website and the strategies used for optimal data dissemination.
2. The Daily – the official release bulletin
The Daily is Statistics Canada’s official release bulletin, the agency’s front line of communication with the media and the public.
It supports the agency’s mandate to publish statistical information on Canada’s economy and society. Published since 1932, it has appeared on the Statistics Canada’s website since 1995.
The only bulletin of its kind to be published by a statistical agency, The Daily provides Canadians with equal, free access to all of Statistics Canada’s new data sets, analytical products and information products. Seasoned users visit the website daily, since it is published at 8:30 a.m. (EST) every business day.

Statistics Canada – Catalogue no. 11-634-X224
Compendium of Management Practices for Statistical Organizations From Statistics Canada’s International Statistical Fellowship Program
Statistics Canada has implemented stringent official mechanisms and processes to ensure the constant, effective protection of confidential data prior to dissemination. Pursuant to the Statistics Act, the Policy on Official Release governs these requirements for the official release of The Daily.
In addition, training on writing news releases is regularly provided to subject-matter analysts who submit articles for dissemination in The Daily. This training reinforces the editorial line of The Daily through standardized, consistent writing.
Statistics Canada has also established an official process for correcting information and following up on corrections before and after the dissemination of official releases. The Directive on Corrections to Daily Releases and Statistical Products outlines the necessary provisions for a standardized and consistent approach to identifying, communicating, approving and publishing post-release corrections.
The calendar of release dates for economic indicators (e.g., GDP, CPI, unemployment rates) is published in The Daily one year in advance, allowing all users to be informed ahead of time. Furthermore, a release schedule for upcoming releases is published each week. In this way, Statistics Canada takes a proactive stance on informing Canadians of the release of survey results, indicators and products. This practice also complies with the requirements of the Special Data Dissemination Standards set by the International Monetary Fund, which are applied by many national statistical agencies.
3. Media relations
Communicating with the media should be a major commitment for any statistical organization, given that media coverage of releases will ensure that available data has greater outreach. Media relations not only contribute to the widespread dissemination of agency data and analyses, but also promote openness and transparency by participating in interviews with the media, facilitating access to data and analyses and, finally, maintaining the agency’s good public image.
In Canada, media relations activities are managed in accordance with Statistics Canada’s Directive on Media Relations. A heavy emphasis is placed on the accessibility of material that Statistics Canada provides to the media for use and redistribution. Occasionally, the agency recruits journalists to train its employees on the best way to present information to the media so that the media can better transmit that information. Journalists are also offered workshops on analyzing and interpreting the data produced by Statistics Canada.
The Media Hotline continues to be the first point of contact for journalists searching for information. This hotline is available Monday through Friday, from 8:30 a.m. to 5:00 p.m. (EST) and serves 2,000 to 2,500 media requests annually. An after-hours service is also available for urgent media requests.
Some journalist inquiries involve requests for custom data, meaning data that are not directly available on the website and need to be prepared by subject-matter experts. This preparation is free for requests requiring fewer than three hours of work. Requests that take longer to prepare are processed on a cost-recovery basis (i.e., the user must pay to gain access).
For the dissemination of key economic indicators, Statistics Canada also offers lock-up sessions to accredited journalists from 7:30 a.m. to 8:30 a.m. (EST), 12 to 15 times monthly. In addition, during census data release periods, media lock-ups are held from midnight to 8:30 a.m. for each release (the schedule of the Census Program lock-ups may vary from one cycle to the next). These lock-ups are held under controlled conditions, since journalists have access to new data and analyses prior to their dissemination. Journalists must come to the Statistics Canada offices, where they are brought to a secured room where Internet communication lines are cut for the duration of the lock-up, and must turn in their telephones and any other electronic devices. Journalists participating in the lock-up have access to documents and a computer. They write articles and ask spokespersons for clarification on the data and concepts. They cannot publish or broadcast their reports until after the official Statistics Canada release, meaning after 8:30 a.m. (EST).
Upon media request, one-on-one interviews with journalists can also be arranged, either live or for broadcast on television, radio or other media.
Agency spokespersons for lock-ups and media interviews are generally subject-matter experts designated by the agency, not communication specialists. Statistics Canada thereby ensures that the media have access to

Statistics Canada – Catalogue no. 11-634-X 225
Section 4 - Communicating with key stakeholders Chapter 4.2 - External communications and outreach
the people best qualified to answer their questions. However, the spokespersons first receive mandatory media training from communication specialists so that they are able to respond strategically and effectively to questions from journalists, whether in lock-ups or during interviews.
The Daily web module is also a key tool for disseminating information to the media. It contains a calendar with all upcoming releases, a list of spokespersons by subject and media advisories. Furthermore, the “By the numbers” module represents a source of information for the media looking for available information and data on a variety of subjects and special occasions, such as the Lunar New Year, Valentine’s Day, spring, Mother’s Day, Father’s Day, National Aboriginal Day.
To proactively manage potential issues in the media, Statistics Canada monitors media reports and the accuracy of media coverage. The goal is to ensure timely detection and appropriate responses to media-related issues. One person on the media relations team is assigned to media monitoring. This function consists of monitoring and analyzing what is said about the agency in the best-known newspapers, as well as on the Web (including social media and well-known blogs). Tools or applications specific to media monitoring filter through the Web or in traditional media based on transcriptions (using key words such as statistics, Statistics Canada, official dissemination of statistics, unemployment rates, price index). The idea behind media monitoring is not to control everything that is said about the agency, but rather to ensure that the information disseminated is accurate and interpreted correctly.
If an error or misinterpretation of information provided by Statistics Canada is detected, an official correction request is sent to the media concerned to correct the accuracy of the information.
In the event of a media issue, the decision to have the Director General, Communications or other senior managers intervene depends on the nature of the issue and its potential impact on the agency’s operations and reputation. This analysis is done under the direction of the Communications Division on a case-by-case basis after consultation with the program experts in question.
4. Statistical Information Service
The Statistical Information Service is the entry point for current and potential Statistics Canada users looking for statistical information about the country.
The Centre is open Monday through Friday, from 8:30 a.m. to 4:30 p.m. (in all Canadian time zones). Information officers answer questions from the public over the telephone (toll-free line) and by email.
In addition to supporting unbiased access to Statistics Canada information, this service was created to provide an organized, streamlined response process for information requests. Staff are trained to respond directly to basic questions that can be answered using existing publications and analytical tables, as well as to screen more complex requests for referral to more specialized services. This ensures equal treatment of requests and helps to reduce the workload of specialized programs.
5. Outreach activities
The goal of Outreach activities is to generate interest and add value to Statistics Canada products and services. By publicizing official statistics, outreach helps us not only to increase public awareness, understanding and use of Statistics Canada data, but also to generate interest and encourage greater numbers of businesses and individuals to answer the agency’s surveys.
Statistics Canada offers Canadians the opportunity to receive custom release announcement emails through My StatCan. Individuals can register on the My StatCan portal at no charge, then select the releases, publications or other products for which they would like to receive announcements. This service makes it possible to customize information according to the choices and needs of Canadians. The My StatCan release announcement is issued each morning.
Statistics Canada also offers activities for more specialized target audiences, such as the Community and Business Outreach Program. This program includes the following:

Statistics Canada – Catalogue no. 11-634-X226
Compendium of Management Practices for Statistical Organizations From Statistics Canada’s International Statistical Fellowship Program
Monthly newsletters on the most recently published data are sent to municipalities, the private sector (specifically, small and medium-sized businesses) and ethnocultural groups across Canada. These newsletters help these data user groups keep abreast of published information that has an impact on their activities—all the more since these groups are considered to have high statistical information needs.
• Information sessions are also offered to these groups to help them understand in practical terms how to access and use the data available on the Statistics Canada website. These sessions use WebEx technology and allow participants across Canada to participate in exchanges on predetermined subjects.
• External magazine and blog articles: Since 2011, partnerships have been forged for publishing articles for specialized magazines and blogs. The strategic role of outreach is to plug into the communication mechanisms and tools already used by user groups in order to answer their questions and concerns directly. Statistics Canada continually seeks to develop targeted partnerships to continue to maximize the scope of its data and encourage optimal use of it.
Lastly, since 2013, Statistics Canada has regularly organized half-day public events throughout Canada. This discussion series, Talking Stats, offers Statistics Canada the opportunity to meet and discuss with data users and other stakeholders to better understand their evolving data needs and to receive their feedback. These discussions cover various topics. First, the Chief Statistician, host of the event, presents statistical information, an analysis and trends of the topic at hand. This is followed by a discussion among expert members of the panel. Finally, the event concludes with a question period to respond to questions from the public.
6. New media
Statistics Canada is known for strategically adapting its programs and services to meet the rapidly changing expectations of Canadians over the years, particularly with the evolution of the Internet and expansion of new media.
Since 2007, Statistics Canada has been exploring Web 2.0 as a way to connect, interact and exchange with the public. The agency’s first experience with collaboration tools was the development of an online discussion forum about the 2006 Census data. But it was not until 2011 that it developed a real strategy for having an active presence across social media platforms.
In preparation, Statistics Canada launched its first social media account on Twitter in 2010 to gauge public interest. In less than 12 months, the agency had over 1,000 followers without publishing a single tweet. Buoyed by this show of interest, Statistics Canada began releasing snippets from The Daily and information on surveys, without engaging much with the public. Bolstered by its experience on Twitter, Statistics Canada launched official Facebook and YouTube accounts, and engaged the public by responding to user questions or comments. From that point onward, the agency’s social media presence became active and engaging. The Statistics Canada Twitter account ranks among the most popular official accounts in the Canadian Public Service in terms of number of followers. Facebook postings focus on statistical highlights of Canadian society in general. The YouTube account is updated continually with videos developed by Statistics Canada.
Over the last decade, videos have become a popular means of sharing information. Noting this growing appetite, Statistics Canada began producing and broadcasting videos and tutorials in 2009. These are intended to complement the detailed and more complex data available on the website.
Statistics Canada produces and broadcasts four types of videos, each with distinct objectives:
• demystifying the role of the agency and/or certain programs
• increasing awareness and encouraging survey respondents to participate
• presenting the highlights of the most recent releases
• facilitating access and navigation for website users; given their low production costs, these tutorial videos are an accessible, practical and visual way to guide people through data use.
In addition to videos, the Statistics Canada website offers online collaboration tools. In February 2012, Statistics Canada held its first live chat session with the public, discussing the 2011 Census data on population and dwellings. The demographer who was the spokesperson for the release answered the live feed of questions from the public directly online. This format was repeated for other census releases, and for five major releases from

Statistics Canada – Catalogue no. 11-634-X 227
Section 4 - Communicating with key stakeholders Chapter 4.2 - External communications and outreach
the agency per year starting in 2014. Participants register for the session and agree to follow certain ethical rules of engagement, and dialogue directly with the expert in the field in real time. This activity helps to support the Statistics Canada strategic orientation to further engage the public on the understanding and use of data through Web 2.0 tools.
Finally, Statistics Canada’s blogs (StatCan Blog and Researcher’s Blog) are additional ways for the agency to reach a savvier public, providing them with a medium to find information about current and future agency initiatives, and to make relevant comments about the direction and content of these programs.
Key success factorsDeveloping communications activities that are relevant and add value to data users and Statistics Canada partners is the measure of success for external communications. The goal is to gain a better understanding of the needs of the agency’s key audiences and to provide a strategic and targeted response through appropriate communication mechanisms. To achieve these objectives, statistical organizations rely on and consolidate a number of key success factors.
The first factor is to always monitor and measure client satisfaction. For example, Statistics Canada has implemented consultation mechanisms to improve its products and services. Consultation activities are published online on the website’s consultation portal. They handle website evaluation, new communication products and tools, services of the Statistical Information Service, usability testing and more. Feedback from these consultation mechanisms helps the agency to better understand the needs and expectations of Canadians and to improve or modify its programs and services as needed.
The success of communications activities also depends on close and ongoing collaboration between communication specialists and program experts. The relevant subject-matter programs are integrated into each communication project at the start of the process, and work is done as a team on behalf of the organization.
Furthermore, major communication projects must systematically undergo appropriate governance. In Canada, the Communications and Dissemination Committee, chaired by an assistant chief statistician and several senior managers, ultimately assumes this responsibility. The committee’s mandate is to review and approve new or existing communications initiatives. This centralizes decision-making and ensures, over time, that external communications adhere to rules, processes and objectives that are consistent, strategic and compliance-oriented.
Lastly, compliance with clear and appropriate rules is also valuable for external users and partners. Because Statistics Canada has actively invested in the use of new media, such as daily online engagement with the public, the agency has armed itself with clear rules of engagement. These rules are adapted to each online platform to ensure that interactions with the public are conducted according to certain ethical and professional standards.
ChallengesGiven the constant evolution of technologies and the proliferation of new media platforms, the public is becoming hungrier for instant information. Users crave fast access to information that directly satisfies their needs. To meet these demands, statistical agencies must prioritize communications activities and remain flexible to the expectations of Canadians.
Moving forwardEvery statistical agency faces the constant challenge of always optimizing the statistical information it publishes for understanding and use. The organization must continue to be agile and flexible in adopting new technologies that complement conventional modes of communication in order to offer services that are relevant and useful to data users.

Statistics Canada – Catalogue no. 11-634-X228
Compendium of Management Practices for Statistical Organizations From Statistics Canada’s International Statistical Fellowship Program
Box 4.2.1 Social Networks: From Information to Communication – The Ecuadorian Experience
From the National Institute of Statistics and Census (INEC)There is no question that the existence and use of new technologies have changed how Ecuador and the world communicate and interact, resulting in new users of information—demanding, analytical and participative users who need not just information, but information that is fast, continuous and precise.
To reach these users and promote the use of information, the National Institute of Statistics and Census (INEC) turned its attention to new technological tools, in particular, social networks. The INEC therefore moved from being a mere generator and source of information to becoming a system of data journalism, a shift, which helped it to develop a direct relationship with users.
INEC in the world of networksToday’s user decides how, where, when and what to consume. This new form of communication has moved the agency away from disseminating data with a communications strategy toward disseminating data with a marketing strategy.
To implement this new strategy, the INEC began by analyzing its environment, users, channels and products. The agency realized that a large number of its users (academics, researchers, media and students, aged 18 to 45) were very active on social networks and the Internet, and that its channels were becoming obsolete.
Figure: 4.2.1Overview of INEC’s environment, users, channels and products
Against this backdrop, the agency had to evolve towards social networks and strengthen certain channels, such as the Web, by creating applications to facilitate data access.
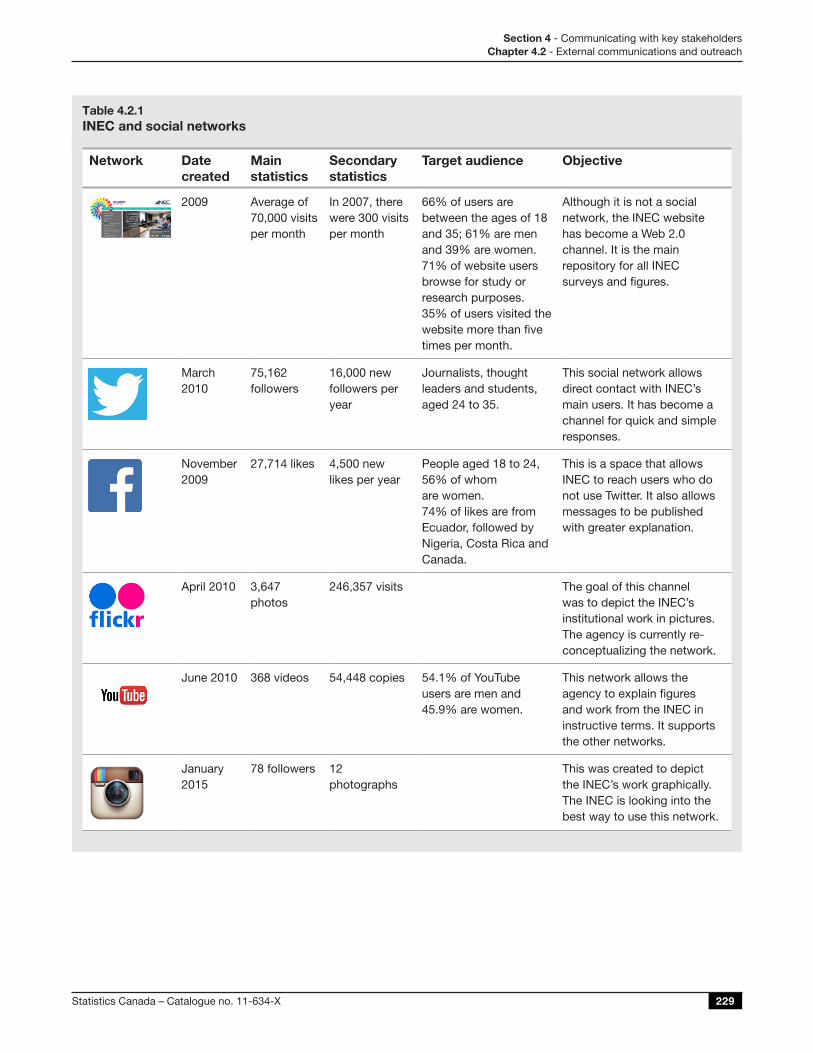
Statistics Canada – Catalogue no. 11-634-X 229
Section 4 - Communicating with key stakeholders Chapter 4.2 - External communications and outreach
Table 4.2.1INEC and social networks
Network Date created
Main statistics
Secondary statistics
Target audience Objective
2009 Average of 70,000 visits per month
In 2007, there were 300 visits per month
66% of users are between the ages of 18 and 35; 61% are men and 39% are women. 71% of website users browse for study or research purposes. 35% of users visited the website more than five times per month.
Although it is not a social network, the INEC website has become a Web 2.0 channel. It is the main repository for all INEC surveys and figures.
March 2010
75,162 followers
16,000 new followers per year
Journalists, thought leaders and students, aged 24 to 35.
This social network allows direct contact with INEC’s main users. It has become a channel for quick and simple responses.
November 2009
27,714 likes 4,500 new likes per year
People aged 18 to 24, 56% of whom are women. 74% of likes are from Ecuador, followed by Nigeria, Costa Rica and Canada.
This is a space that allows INEC to reach users who do not use Twitter. It also allows messages to be published with greater explanation.
April 2010 3,647 photos
246,357 visits The goal of this channel was to depict the INEC’s institutional work in pictures. The agency is currently re-conceptualizing the network.
June 2010 368 videos 54,448 copies 54.1% of YouTube users are men and 45.9% are women.
This network allows the agency to explain figures and work from the INEC in instructive terms. It supports the other networks.
January 2015
78 followers 12 photographs
This was created to depict the INEC’s work graphically. The INEC is looking into the best way to use this network.

Statistics Canada – Catalogue no. 11-634-X230
Compendium of Management Practices for Statistical Organizations From Statistics Canada’s International Statistical Fellowship Program
Network Date created
Main statistics
Secondary statistics
Target audience Objective
January 2015
26 members Journalists This network allows the INEC to quickly and directly contact journalists in emergency situations.
April 2014 18 posts This was created as a means of positioning INEC networks in search engines and having a greater presence on the Internet. The blog is designed to publish different statistical information.
Starting up: attracting usersThe INEC
• identified its best clients that were best suited to be ambassadors for its brand and services
• created a profile of followers so as to segment and use them appropriately for various campaigns and the dissemination of data or information
• sought out thought leaders and influencers, people who have great influence among their audiences, and encouraged collaboration with them through ongoing conversations with direct messaging
• monitored the topics that had the most impact in each of the networks and how data and figures contributed, placing special emphasis on the leaders in those areas
• established a policy on network management as a user guide.
PositioningThe INEC
• introduced graphs, photographs, infographics and videos. At the outset, there was not much graphical connection and photographs were simply posted with related phrases
• used linkage to position messages. Messages were published on dates corresponding to the independence of a province or the founding of a district
• used special days to provide information on topics of interest, such as Health Day, Pets’ Day, Men’s Day and Children’s Day
• created initiatives on historical data and promoted the data of districts in the country, chiefly on Facebook and Instagram. The idea was to emulate Google, which constantly changes its logo for special occasions
• disseminated technical terms through graphics and videos, and explained the methodology and figures.
Loyalty• Networks are not only a means of dissemination, but also an instrument for measuring public opinion on specific
topics. For this purpose, the INEC has a continually monitored list of influential tweeters who lead the discussion on networks.
• Over the years, the INEC has acquired defenders among its followers who can respond to any attack on its network accounts.
• The INEC aims to maintain a service account that provides statistical information in a user-friendly manner, with simple wording and posts that contribute to the discussions.
• Gradually, the INEC introduced new ways to deliver infographics, moving from simple images to more marketable concepts. It also began to combine graphics with photographs.

Statistics Canada – Catalogue no. 11-634-X 231
Section 4 - Communicating with key stakeholders Chapter 4.2 - External communications and outreach
• Now, the products for each INEC event are well thought out, and the agency prepares a set of micro-infographics as part of a broader group of graphics. The goal is to use graphics and the sequence of data dissemination spaces to introduce a topic before other accounts.
Results
Entering the world of social networks has created new challenges and opened up new ways of communicating for the INEC, and has established the agency as a generator of data journalism. This position has been on the rise since 2007, when information was liberated by creating and empowering various channels, as well as segmenting users and creating products that facilitate the use of information.
This transition allows the INEC to claim that it
1. has reduced the misinterpretation and incorrect reading of data
2. has expedited the information delivery time
3. is a direct source of information
4. is the country’s leader in statistics.
This communication strategy has caused the agency’s media impact to grow by 481%, growing from an average of 74 monthly impacts in 2007 to 430 in 2015 at present.
There has also been a significant increase in traffic to the website, increasing from an average of 300 monthly visits in 2007 to 70,000 per month at present. Finally, the INEC has positioned its networks as statistics generators.

Statistics Canada – Catalogue no. 11-634-X232
Compendium of Management Practices for Statistical Organizations From Statistics Canada’s International Statistical Fellowship Program
BibliographyGovernment of Canada (2012). Communications Policy of the Government of Canada. Consulted on the 11th of March 2016. Retrieved from http://www.tbs-sct.gc.ca/pol/doc-eng.aspx?id=12316
Statistics Canada (2016). Stay connected, Statistics Canada. Consulted on the 11th of March 2016. Retrieved from http://www.statcan.gc.ca/eng/sc/index?MM.
International Monetary Fund. Special Data Dissemination Standards. Consulted on the 11th of March 2016. Retrieved from http://dsbb.imf.org/pages/sdds/home.aspx

Statistics Canada – Catalogue no. 11-634-X 233
Section 4 - Communicating with key stakeholders Chapter 4.3 - Management of, and access to, metadata
Chapter 4.3 – Management of, and access to, metadata
Context National statistical organizations (NSOs) are responsible for providing information to users about the nature and characteristics of published data; and for assisting users in assessing the quality of the data and the suitability of the data for their own purposes. That information—commonly called metadata—is provided to ensure an understanding of the components of the data, including concepts, variables and classifications, underlying statistical methods, and key aspects of data quality.
By proactively providing access to metadata, NSOs ensure that their users understand all the attributes of statistics (interpretability), including data limitations, so they are able to make informed decisions. Providing access to accurate, up-to-date metadata is also a way to ensure that NSOs maintain the trust and confidence of the public with regard to data quality, thus building on the credibility and the reputation of their organization.
In the recent years, metadata management and data access have been guided by two important principles:
• Metadata are critical throughout the entire survey process: They are a driver in the survey process, starting at the data collection phase, ensuring that information about data is consistently reused throughout the entire data collection, processing, analysis and dissemination cycle (for additional details refer to Chapter 3.1 – The Corporate Business Architecture and Chapter 3.3 – Enhancing how surveys are conducted; and
• Interoperability: Common models and tools are used to manage metadata throughout the survey cycle, ensuring that metadata can be accessed, used and imported as content at each stage in the survey process.
Strategies and toolsAs Statistics Canada’s experience has shown, two important mechanisms can greatly facilitate users’ accessibility to metadata: (1) the creation of an integrated metadatabase to store and centralize all public metadata; and (2) an adequate governance structure. The next section will describe how this was achieved in Canada.
1. The Integrated Metadatabase: a repository of information about surveys and programs
The process of creating a metadata repository is not an instinctive one; it is often seen as an additional step to the data production process. In Canada, this process started in 2000. Statistics Canada’s Integrated Metadatabase is a critical tool for data users: it provides them with the ability to access the central corporate repository of statistical metadata for accurate information on survey methodology, variables and data quality. Statistics Canada has developed the information included in the database in accordance with international standards, such as those set by the Statistical Data and Metadata eXchange (SDMX), the International Organization for Standardization (ISO) and the Data Documentation Initiative (DDI).
Public metadata for all surveys and statistical programs are accessible on the Statistics Canada website through a module called Definitions, Data Sources and Methods. Within that module, data users can easily find the following information:
• a description of each of Statistics Canada’s surveys and statistical programs, including information on data sources and methodology
• questionnaires used to collect data for each survey or statistical program
• definitions of standards concepts, variables and classifications (also called structured metadata)
• data quality considerations and indicators.

Statistics Canada – Catalogue no. 11-634-X234
Compendium of Management Practices for Statistical Organizations From Statistics Canada’s International Statistical Fellowship Program
At Statistics Canada, metadata are managed by a specific program area (the Standards Division). However, experts from each survey and statistical program area are responsible for supplying the metadata for their surveys or statistical programs and for following a template and guidelines developed by the individual standards programs.
Metadata for surveys and statistical programs are now being integrated into the survey prescription process for data collection, with the result that basic survey and program metadata are now accessible on the Statistics Canada website at the start of data collection as well as at the time of data release. This has the benefit of informing survey respondents about the collection activity in which they are participating, thus encouraging higher levels of participation. This initiative highlights the importance of publishing metadata throughout the survey cycle, not only during the dissemination phase.
The maintenance of a statistical metadatabase is part of Statistics Canada’s Corporate Business Architecture program, which includes, among its principles, the creation and maintenance of metadata-driven processes that can produce and use metadata information throughout the survey cycle (for more details refer to Chapter 3.1 – Corporate Business Architecture).
2. Governance structure
It is important for NSOs to identify a specific program that will be in charge of centralized metadata. As mentioned earlier, this program area should be responsible for the development and maintenance of a central metadata repository where standards and approved deviations are to be documented. To the maximum extent possible, the use of internationally recognized standard classifications, concepts, variables and definitions is adopted. Deviations are acceptable only if they are essential to the proper description and measurement of the country’s specific realities.
Statistics Canada has a mature and effective governance and management structure that ensures proper management of metadata. Responsibilities are shared among three entities: the Standards Division, the Methods and Standards Committee, and the program areas.
The mandate of the Standards Division is to develop, maintain and communicate statistical standards, to promote and monitor their implementation under the terms of the Policy on Standards, and to provide guidance on their interpretation. The Standards Division also has a mandate to develop, maintain and disseminate statistical metadata for surveys and statistical programs, under the terms of the Policy on Informing Users of Data Quality and Methodology.
The Policy on Standards mandates the use of standard names and definitions for populations, statistical units, concepts, variables and classifications in statistical programs, and provides a framework for reviewing, documenting, authorizing, and monitoring these in Statistics Canada’s programs. This policy dictates that, where departmental standards have been issued, program areas must follow those standards unless a specific exemption has been obtained under the provisions of the policy. The policy outlines separate processes and roles and responsibilities related to the following:
• Creating and defining standard names and definitions;
• Obtaining approval for creating and registering new departmental standards; and
• Obtaining an exemption where, in exceptional circumstances, an existing standard cannot be adopted.
The Policy on Informing Users of Data Quality and Methodology identifies the type of information to be made available to data users as part of the agency’s disseminated data products. This policy governs all statistical data and analytical results disseminated by Statistics Canada. It also provides guidelines on the type of information to be published, and gives examples, and identifies the integrated metadatabase as the corporate metadata repository.
Standards Division is guided mainly by the Methods and Standards Committee. This committee, comprised of directors from across the agency, is chaired by an assistant chief statistician. The role of this committee is to
• manage corporate metadata
• assist and advise on the development and application of statistical standards and metadata within the agency’s programs

Statistics Canada – Catalogue no. 11-634-X 235
Section 4 - Communicating with key stakeholders Chapter 4.3 - Management of, and access to, metadata
• approve the adoption of statistical concepts, variables and classifications as departmental standards while ensuring comparability and compliance with international standards
• approve exemptions to the departmental standards where appropriate
• initiate periodic reports on the state of compliance with the Policy on Standards, and initiate a review of the policy and accompanying standards when deemed necessary
• advise on the development and use of sound statistical methods
• provide guidance on priorities for statistical research and innovation
• act as the focal point for the review and monitoring of corporate data quality practices and issues
The Methods and Standards Committee reports directly to the Executive Management Board, which is chaired by the Chief Statistician of Canada.
Finally, the program areas are responsible for documenting the metadata according to the requirements prescribed in the Policy on Informing Users of Data Quality and Methodology.
Key success factorsMetadata management and access at Statistics Canada are successful for a number of reasons.
Firstly, the creation, storage, management and dissemination of metadata are governed by clear mandatory requirements explicitly stated in Statistics Canada policies, and overseen by the Methods and Standards Committee. Clear policy requirements and support from senior executives from across the agency provide a framework for ensuring quality in the development, documentation and dissemination of Statistics Canada’s metadata. They also ensure that employees are engaged and aware of the importance of maintaining and disseminating current, accurate, relevant and interpretable metadata.
Secondly, the use of a corporate central metadata repository, the Integrated Metadatabase, means that there is a primary source for disseminated metadata at Statistics Canada. This ensures that compliance with policies and guidelines, including international guidelines, can be carefully monitored and that, when changes are required, they can be implemented across all program areas, in an efficient and coordinated way.
Thirdly, because metadata are integrated in the survey prescription process, whereby metadata on survey programs are published on Statistics Canada’s website prior to the actual start of data collection, metadata have become a standardized part of the survey process, not only at the dissemination stage but from the start to the finish of the survey cycle.
With current metadata increasingly available to the public via the agency’s website, Statistics Canada has been able to ensure the quality of the information it publishes and to respond to the needs of its clients in an effective way. In turn, clients have come to expect high-quality metadata, which they use on a regular basis to interpret and contextualize their data and analyses.
Challenges and looking aheadThe creation and dissemination of comprehensive metadata is not without challenges.
Resource requirements are an issue, both in terms of creating metadata within program areas and of maintaining and disseminating metadata via Statistics Canada’s Integrated Metadatabase. The number of concepts, variables and classifications used across Statistics Canada’s surveys and statistical programs is in the thousands. Furthermore, it can sometimes be difficult to find consensus on their nomenclature across different program areas, which may use similar, but not identical, versions of the same variable.
It is important, therefore, to constantly reinforce, to all staff, the positive impact that good metadata have on the efficiency and coherence of statistical production and on users’ ability to properly understand and use the data. Fostering interoperability, maintaining compliance with international standards, and developing and implementing a consistent metadata approach can only enhance the relevance and effectiveness of official statistics.

Statistics Canada – Catalogue no. 11-634-X236
Compendium of Management Practices for Statistical Organizations From Statistics Canada’s International Statistical Fellowship Program
BibliographyStatistics Canada (2004). Policy on Standards, Ottawa. Internal document. Accessible on demand.
Statistics Canada (2000). Policy on Informing Users of Data Quality and Methodology, Ottawa. Internal document. Accessible on demand.
Statistics Canada. Statistics Canada’s website. Consulted on the 11th of March 2016 and retrieved from http://www.statcan.gc.ca/eng/concepts/index?MM=
Statistics Canada. Statistical Data and Metadata Exchange, Ottawa. Internal document. Accessible on demand.

Statistics Canada – Catalogue no. 11-634-X 237
Section 4 - Communicating with key stakeholders Chapter 4.4 - Access to microdata
Chapter 4.4 – Access to microdata
Context Both data users and NSOs agree on the importance of maximum access to statistical information. From a data user’s perspective, statistical information provided by national statistical offices (NSOs) should be easily accessible so that it can be used to its fullest possible. From an NSO’s perspective, data should be made available to the public in order to maximize their utility and, therefore, their relevance. NSOs should provide a continuum of options or services allowing different levels of access for different needs, while ensuring appropriate protection of confidentiality.
• At Statistics Canada, survey data can be accessed in three ways, as shown in the figure 4.4.1:
• Overall statistical products intended for dissemination to the public at large are accessible through the agency’s corporate data repository, which contains most publicly available current and time-series data produced. In addition, the agency’s website has analytical articles, other aggregate data tables, and other metadata that are disseminated and accessible for public consumption. For more details about the dissemination of data through the website, refer to Chapter 4.1 – Disseminating data through the website.
• Custom requests, including data tabulations, are available through Statistical Information Services and from a few subject-matter and service divisions. For more details about these services, consult Chapter 4.2 – External communications and outreach.
• Microdata programs and services are the focus of this chapter.
Figure 4.4.1Data access mechanisms at Statistics Canada
This diagram shows the three ways of accessing data at Statistics Canada. The three lines at the bottom illustrate that statistical products are usually aggregate data openly available through the website (except custom requests), while access to microdata programs and is restricted to protect confidentiality.

Statistics Canada – Catalogue no. 11-634-X238
Compendium of Management Practices for Statistical Organizations From Statistics Canada’s International Statistical Fellowship Program
Increasingly, strong evidenced-based policy research requires access not only to aggregate statistics but also to anonymized data at the level of the individual business, household or person.
While providing a continuum of access to data, Statistics Canada is also ensuring that the following principles are applied:
• The privacy and confidentiality of respondents1 must be protected in all agreements for microdata access.
• Multiple-access options are made available as part of a continuum.
• Access to microdata is provided for research purposes, for the public good.
• Access costs will be covered by the researcher or the research community.
Figure 4.4.2 illustrates the interplay between ease of access and the level of detail or level of confidentiality of the data being accessed.
Figure 4.4.2Access continuum and confidentiality challenge
At Statistics Canada, the delivery of microdata access services is centralized within the area (Microdata Access Division) that serves as the focal point for external requests to access microdata on a cost-recovery basis. This also provides opportunities for cost-efficiencies through harmonization, resource sharing, and minimization of duplication.
Strategies and toolsIn order to meet the distinct needs of researchers, Statistics Canada has implemented a diverse program of microdata access offering different options. These options can be grouped into three types of services:
• Access to public use microdata files (PUMFs) (access to the Public Use Microdata File Collection (PUMFs Collection) and the Data Liberation Initiative (DLI))
• Direct access to detailed microdata in a secure physical environment (research data centres (RDCs), Federal Research Data Centre (FRDC), and Canadian Centre for Data Development and Economic Research (CDER))
• Real Time Remote Access (RTRA).

Statistics Canada – Catalogue no. 11-634-X 239
Section 4 - Communicating with key stakeholders Chapter 4.4 - Access to microdata
1. Access to public use microdata files (PUMFs)
Two types of services allow the public use of microdata files: access to PUMFs and access to the DLI.
1.1 Access to the Public Use Microdata File (PUMF) CollectionPublic use microdata files contain anonymized microdata. Individual access to PUMFs is free to the public. Individuals wishing to access a PUMF need only contact Statistics Canada and sign a license agreement to receive the file (to be used for statistical purposes).
The PUMF Collection is a subscription-based service that offers institutional access to the collection of available public microdata files. For an annual fee, designated contacts at subscribing institutions can have unlimited access to all microdata and documentation available in the PUMF Collection.
1.2 Access to the Data Liberation Initiative (DLI)The DLI is a partnership between postsecondary institutions and Statistics Canada for improving access to Canadian data resources by academic researchers, teachers and students. The DLI provides a wide range of data and metadata to participating postsecondary educational institutions, allowing their faculty and students unlimited access to numerous PUMFs, databases and geographic files. Academic institutions pay a service fee for DLI support.
The public use of microdata files (both the PUMF Collection and the DLI) is guided by the same legal rules, including the following:
• The Policy on Microdata Release governs access to Statistics Canada microdata by providing a framework for authorizing the release of Statistics Canada microdata files for statistical purposes, while ensuring that the confidentiality of the information is protected. The policy details the governance structures, mechanisms and resources in place to ensure the continuous and effective management of Statistics Canada’s microdata holdings.
• All PUMFs require a license agreement in place for a user to obtain a file. This agreement stipulates that the agency grants the user a worldwide, royalty-free, non-exclusive license to use, reproduce, publish, freely distribute, or sell that information. Meanwhile, usage should conform to certain rules, including the requirement to reproduce the information accurately and the obligation not to merge, or otherwise use, this information concurrently with information in other database(s) for the purpose of attempting to identify an individual person, business or organization.
2. Direct access to detailed microdata in a secure physical environment
2.1 The Research Data Centres (RDC) ProgramRDCs provide researchers with direct access to a wide range of population and household surveys, as well as administrative microdata files, in a secure facility managed and staffed by Statistics Canada but located in a university setting. RDCs are staffed by Statistics Canada analysts and are accessible only to researchers with approved projects who have been sworn in under the Statistics Act as “deemed employees.” Being sworn in under the act ensures not only the confidentiality requirements but also the legal sanctions outlined in the act. Researchers must submit research proposals and the associated microdata access requirements. Proposals are vetted by Statistics Canada for compliance with the public-good criteria that underlie the RDC Program.
RDCs are located throughout the country so that researchers do not have to travel to Ottawa to access Statistics Canada microdata. The RDC network is a cost-recovery program funded by the universities and academic funding agencies. In some situations, access fees may be charged to researchers not affiliated with a university in the network.
2.2 The Federal Research Data Centre (FRDC) ProgramThe FRDC Program is similar to the RDC Program in that this access service is streamlined for the research needs of federal government departments. The FRDC provides a secure site where federal employees can conduct

Statistics Canada – Catalogue no. 11-634-X240
Compendium of Management Practices for Statistical Organizations From Statistics Canada’s International Statistical Fellowship Program
complex statistical analysis. Like RDCs, the FRDC provides researchers with access to a wide range of population and household surveys, as well as administrative microdata files, in a secure setting. The FRDC Program has two locations in the National Capital Region; both are staffed by Statistics Canada employees and are accessible only to researchers with approved projects who have been sworn in under the Statistics Act as “deemed employees.” The FRDC operates on a cost-recovery basis.
2.3 The Canadian Centre for Data Development and Economic Research (CDER)The Canadian Centre for Data Development and Economic Research provides researchers with direct access to a wide range of business and economic microdata files for analytical research. The Centre is located at Statistics Canada’s head office (in the National Capital Region). It operates entirely on a cost-recovery basis. The microdata files used for approved projects are accessible to only researchers with approved projects who have been sworn in under the Statistics Act as “deemed employees.”
The RDC Program, the FRDC Program, and CDER are guided by the following policy frameworks:
• The Directive on the Use of Deemed Employees outlines the Statistics Act requirements that allow researchers access to confidential microdata in RDCs, the FRDC, and CDER. This directive distinguishes between researchers accessing microdata for analysis and those accessing data for other purposes, such as quality control validation.
• The Policy on Microdata Access provides a framework to help achieve efficient and effective access to Statistics Canada microdata for statistical purposes, while ensuring that the confidentiality of the information is protected.
3. The Real Time Remote Access (RTRA) system
The RTRA system is an online remote-access service allowing users to run statistical software used for tabulation (SAS), in real-time against microdata files located in a central and secure location. Researchers using the RTRA system do not gain direct access to the microdata and cannot view the contents of the microdata file. Instead, users submit SAS programs to extract results in the form of frequency tables. As RTRA researchers cannot view the microdata, becoming a deemed employees of Statistics Canada is not necessary. There is a subscription fee to obtain access to the RTRA service, and there is no requirement to submit proposals.
To obtain an account on the RTRA, each user must be associated with an organization; each user must also acknowledge in writing the terms and conditions of use for the RTRA system. Access to microdata through the RTRA system allows researchers to submit a program and receive output that has been automatically vetted for confidentiality. All aggregate or statistical outputs from the RTRA are covered by the open-data license, and can be shared freely.
4. Governance of Microdata Access Services
The Microdata Management Access Committee plays an important role in the governance of access to microdata. It has a mandate to provide advice, guidance and direction on access to microdata and matters pertaining to access to information, privacy and confidentiality obligations under the Statistics Act and other federal legislation and policies, by
• reviewing all requests for changes to policies and processes pertaining to access to microdata and providing strategic direction to the Microdata Access Division on matters related to data access, as per the Policy on Microdata Access;
• overseeing the review and approval of submissions for advance release (including work-in-progress for data validation purposes and collaborative programs);
• approving all research proposals initiated or sponsored by Statistics Canada, and using the services of researchers as deemed employees;
• supporting evidence-based research in Canada by working to increase the data available in RDCs, the FRDC, and the CDER, and by working to expand secure access modes to data by developing new technologies.

Statistics Canada – Catalogue no. 11-634-X 241
Section 4 - Communicating with key stakeholders Chapter 4.4 - Access to microdata
Key success factorsThe growing use of these programs and services by universities, government, institutions, and the private sector is a key success factor for microdata access. This increase in use is also continuous, which is evident not only by the number of universities and federal departments accessing the files, but also by the number of microdata files available in Canadian universities, RDCs and other institutions.
It is important to acknowledge that these access services have been built and enhanced as a result of partnerships with data providers and researchers from government, non-governmental institutions, academia, and the private sector.
More specifically, the DLI and the RDC program models are considered success stories; the successful partnerships implemented with the researcher and academic communities have become internationally recognized “brands.” Other national statistical agencies and the international research community have expressed interest in adopting a model similar to the DLI, which would make their own data accessible to researchers around the world.
Although the DLI and the RDC Program are distinct access programs, they have developed synergies over the years through enhanced information-sharing, efficiencies, best practices, and close teamwork between the two programs.
The CDER, while a newer model, is another success story which has opened the door to more research using micro-data files from business surveys. The CDER is also modelling a lot of its practices from those used in the RDC to ensure consistency in approaches.
In parallel, the RTRA system is the most recent access program to be offered to the research community, and is seeing early success. The success of the RTRA can be attributed to the speed at which researchers can access a large volume of data files for tabulations. Since the RTRA does not require a rigorous review process or limit access to the particular files specified in a proposal, researchers can create tables from multiple microdata files very quickly. The service fills a gap between RDCs, where researchers can use many methods to analyze detailed microdata, but are restricted to a single purpose, and the PUMFs, which provide broader use of the microdata, but have more limited content.
Challenges The DLI faces mostly technical barriers, relating to users accessing, downloading or manipulating data. Statistics Canada is currently investing in the update of the technical infrastructure and the enhancement of the search platform.
With regard to RDCs and CDER, challenges relate to the availability of resources. The scope of the program has grown more quickly than its funding; main stakeholders have expressed the need to access an increasing number and variety of data types. Additional resources are required to support the expected growth: from improving the information technology infrastructure to protecting confidentiality and better meeting researchers’ needs.
The challenges facing the RTRA are centred on the statistics that the system can output, which are currently limited to descriptive statistics. Research is currently underway to determine whether more analytical statistics, such as regression analysis, could be included as part of the RTRA system.
Looking aheadIn the coming years, Statistics Canada’s microdata access programs will work towards increasing the number and types of available data files and facilitating access to data, by enhancing metadata, building tools, and improving their technological infrastructure.
Access programs will continue to expand their collections by making new and existing Statistics Canada survey and administrative data available through the DLI, the PUMF Collection, the RTRA, RDCs, and CDER. The RDC and CDER Programs will increase their data holdings through efforts in data development, pilot and linkage projects, and acquisitions of administrative data from external organizations.
Going forward, CDER will continue to improve its data documentation and databases that consider longitudinality. In addition, CDER will continue to examine how it can implement broader access while, at the same time, maintain the required control conditions.

Statistics Canada – Catalogue no. 11-634-X242
Compendium of Management Practices for Statistical Organizations From Statistics Canada’s International Statistical Fellowship Program
BibliographyStatistics Canada. Corporate Business Plan, 2014-15 to 2015-2016, Ottawa. Internal document. Accessible on demand.
Statistics Canada (1985). Statistics Act (R.S.C., 1985, c. S-19). Consulted on the 11th of March 2016 and retrieved from http://laws-lois.justice.gc.ca/eng/acts/S-19/FullText.html
Statistics Canada (1987). Policy on Microdata Release, Ottawa. Internal document. Accessible on demand.
Statistics Canada (2012). Policy on Microdata Access, Ottawa. Internal document. Accessible on demand.
Statistics Canada (2013). Directive on the Use of Deemed Employees, Ottawa. Internal document. Accessible on demand.
Statistics Canada – Catalogue no. 11-634-X 243
Section 4 - Communicating with key stakeholders Chapter 4.5 - Relations with survey participants
Chapter 4.5 – Relations with survey participants
ContextAlthough there is no doubt that collecting data is in the public interest, it is still both a burden on respondents and an intrusion into their private lives. With this in mind, national statistical agencies have a moral, ethical and professional obligation to act respectfully and sympathetically toward respondents while protecting the confidentiality of the information collected.
Data collection must be carried out in an effective, exemplary and timely manner. It should target optimal respondent participation (quantity and quality) to get the most comprehensive survey results. Data collection activities must employ user-friendly survey tools, as well as concepts and terminology that respondents understand well. These tools must be tested in advance on a representative sample of respondents (individuals, households or businesses) to ensure that these criteria are respected.
As part of its respondent relations management program, Statistics Canada has established the Directive on Informing Survey Respondents. This document clearly defines the roles and responsibilities of divisions that collect information directly from respondents with respect to the management of data collection and relations with respondents.
Participation is voluntary for all social surveys, except for the Census of Population, the Labour Force Survey and the Canadian National Health Survey, given their major role for Canadians and the scope of their results. Consequently, it is important that respondents be encouraged to participate. Analyses are currently under way to determine whether participation in other social surveys should also be mandatory.
In the case of surveys of businesses and agricultural operations, including the Census of Agriculture, participation is generally mandatory (only certain special business surveys are voluntary). This is because most business and agriculture surveys are necessary to establish the national accounts, or because they are directly or indirectly related to legislated programs.
In its respondent relations management program, Statistics Canada emphasizes the following strategic pillars:
• Promoting the agency’s positive image and credibility – These elements are trademark of Statistics Canada, which help it to conduct successful surveys.
• Protecting the confidentiality of respondent information – This requirement is extremely important to Statistics Canada. The Statistics Act guarantees Statistics Canada’s commitment to protect the confidentiality of information obtained from Canadians. This policy is anchored in the agency’s organizational culture (Chapter 4.6 of this report deals exclusively with privacy and confidentiality).
• Working continuously to reduce the response burden as much as possible – This is done by rigorously and systematically managing the response burden, employing user-friendly collection tools and an increasingly integrated survey method, and ensuring that personnel responsible for data collection are properly trained, in terms of both technical aspects and awareness of the organizational culture.
• Encouraging respondents to participate in surveys – This is done by showing respondents how important and useful survey results are to individuals and communities.
• Paying special attention to respondents’ agreement to participate in surveys. This helps to maintain acceptable response rates, particularly with voluntary surveys.
Strategies, mechanisms and toolsStrategies, mechanisms and tools used to interact with respondents can be divided into three categories:
• strategies and tools common to households and businesses
• strategies and tools specific to households
• strategies and tools specific to businesses

Statistics Canada – Catalogue no. 11-634-X244
Compendium of Management Practices for Statistical Organizations From Statistics Canada’s International Statistical Fellowship Program
1. Strategies and tools common to households and businesses
Statistics Canada has developed a Strategic Communications Plan for all respondents, with the aim of creating and using communication products that help to promote the importance of its surveys and encourage respondent participation.
Not all Statistics Canada surveys face the same issues with respect to collecting respondent data. To target communication needs effectively, Statistics Canada has developed a strategic approach: the pyramid of communication requirements with survey respondents (Figure 4.5.1). This approach makes it possible to divide surveys into two groups: response burden and risk of non-response. The pyramid below depicts the three levels of communication:
Figure 4.5.1 Statistics Canada’s pyramid of communication requirements with survey respondents
3
Relations with survey respondents
divide surveys into two groups: response burden and risk of non-response. The pyramid below depicts the
three levels of communication:
FIGURE 4.5.1 Statistics Canada’s pyramid of communication requirements with survey respondents
Level I represents the basic level of communication needs. It includes communication activities and
products that are systematically offered with all surveys:
• Standard letters or emails – This refers to correspondence such as letters or emails of invitation,
reminder or refusal. Design and content templates are revised regularly to make them as user-friendly
and motivating as possible. Their content highlights the utility of the data, the importance of
confidentiality and information about collection.
The Editorial Board of the Communications Division writes, revises and approves all letters and
emails that are addressed to survey respondents. In this way, the board applies the elements of the
Directive on Informing Survey Respondents, uses the most recent templates and procedures, and
maintains uniform language quality.
The content of invitation letters is regularly subject to qualitative testing and testing of written-
communication persuasion techniques to determine factors that could influence survey participants to
respond more often.
• Information for Survey Participants (ISP) web module – This module is accessible through the
Statistics Canada website, and provides information about its data collection and surveys, particularly
regarding collection periods, collection methods, voluntary or mandatory participation,
confidentiality, sharing and linkage agreements, and frequently asked questions.
Level III: Significant risk
Level II: Heightened risk
Level I: Basic level
Level I represents the basic level of communication needs. It includes communication activities and products that are systematically offered with all surveys:
• Standard letters or emails – This refers to correspondence such as letters or emails of invitation, reminder or refusal. Design and content templates are revised regularly to make them as user-friendly and motivating as possible. Their content highlights the utility of the data, the importance of confidentiality and information about collection.
• The Editorial Board of the Communications Division writes, revises and approves all letters and emails that are addressed to survey respondents. In this way, the board applies the elements of the Directive on Informing Survey Respondents, uses the most recent templates and procedures, and maintains uniform language quality.
• The content of invitation letters is regularly subject to qualitative testing and testing of written-communication persuasion techniques to determine factors that could influence survey participants to respond more often.
• Information for Survey Participants (ISP) web module – This module is accessible through the Statistics Canada website, and provides information about its data collection and surveys, particularly regarding collection periods, collection methods, voluntary or mandatory participation, confidentiality, sharing and linkage agreements, and frequently asked questions.
• Interviewer training and reference material – This training enables interviewers to use data collection methods that are consistent, efficient and of high quality. The training is designed by and offered by Collection and Regional Services Branch staff (for more information, see Chapter 3.4: Planning and managing data collection). Training includes a national module that applies to all surveys, as well as a

Statistics Canada – Catalogue no. 11-634-X 245
Section 4 - Communicating with key stakeholders Chapter 4.5 - Relations with survey participants
module on sharing best practices. The Branch also offers training specific to certain surveys, which includes detailed information about collection methods and concepts specific to these surveys.
Level II of the pyramid applies to surveys that have a heightened risk of response burden (e.g. length of interview, number of questionnaires, number of respondents in household) or a heightened risk of non-response related to particular situations (e.g. importance of the survey in the national statistical system, survey topic, age group). Consequently, these surveys require additional effort in terms of communicating with respondents. Level II communication activities that may be offered along with Level I communication activities include the following:
• Newsletters, brochures and infographics sent with letters of invitation – These communication products have audience appeal and provide relevant information about the surveys, including objectives, examples of how the data is used, information about confidentiality and data sharing (if applicable), and a link to the Information for Survey Participants module on the Statistics Canada website (primarily for household surveys).
• Social media campaigns and messages on Twitter and Facebook–Did you know? Bulletins offer the highlights of recently published survey results.
• A series of media articles – In general, these articles are aimed at groups of small or medium-sized businesses and focus on data that are of interest to these groups.
• Blog posts – These blogs, managed by federal departments or business associations, publish information to generate respondent interest and promote the benefits of taking part in Statistics Canada surveys.
Level III pertains to surveys deemed to be at high-risk because of their high visibility or sensitive nature. In addition to Level I and II communication activities, Level III may also include the following:
• A communication strategy that provides a deeper analysis of the communication needs of the survey. It will contain, among other things, an examination of the public environment, measurable communication objectives, a communication approach adapted to the audience, and targeted communication activities to increase the response rate. The Respondent Communications Team conducts the activities and follow-up in collaboration with the partners involved.
• Videos published on the Statistics Canada website and on the Statistics Canada YouTube channel – These videos aim to demystify certain surveys or to address topics of interest to respondents. Some examples include
− We Are Statistics Canada
− Statistics Canada Surveys—Your Participation is Important
− Statistics Canada Business Surveys
− An Overview of Canada’s Consumer Price Index (CPI)
− What is Gross Domestic Product (GDP)?
− Talking Business—Manufacturing
− Canadian Health Measures Survey
− Talking Business—Getting to know your market and industry
− Fundamental Principles of Official Statistics
These videos and many others can be viewed on the Statistics Canada YouTube channel or on the Statistics Canada video page, available on the agency website.
• Articles in regional and local media – Statistics Canada can identify cities in regions where data collection is a challenge and publish articles in regional and local media describing the surveys underway in the area. This helps to share relevant information about the survey with a larger audience. Media coverage heightens the visibility of surveys, which leads to higher household survey participation.
• Collaboration with external partners – Statistics Canada sends letters and relevant information (e.g., brochures, infographics, tweets) about a survey to municipal governments, targeted associations and, in some cities, police departments. The agency asks them to use their communication networks to promote
Statistics Canada – Catalogue no. 11-634-X246
Compendium of Management Practices for Statistical Organizations From Statistics Canada’s International Statistical Fellowship Program
the survey to their members and communities. The information provided also enables these groups and organizations to answer questions from the public and to confirm the validity of Statistics Canada surveys.
In terms of collection tools, the Integrated Collection and Operation System (ICOS) enables more intensive use of dynamic data-collection management, an approach through which response rates by geographic area or respondent profile are monitored in real time. This tool makes it possible to target collection efforts and resources continuously, obtaining response rates that optimize the quality of estimates (for more information, see Chapter 3.4: Planning and managing data collection).
2. Strategies and tools specific to households
Since household surveys are primarily voluntary, the collection method must be more accommodating to respondents. Interviewers must be patient and persuasive, demonstrating interpersonal skills, both in person and over the phone. Numerous follow-ups must be carried out with diplomacy. The most sensitive or difficult cases should be handled by specialized or senior employees.
To encourage respondents to participate in surveys, it is important to thank them for giving up their time. When possible, Statistics Canada provides participants with the survey results or other information that they can use for personal planning or comparing their situation with the general population.
3. Strategies and tools specific to businesses
Statistics Canada has developed a number of tools to facilitate data collection from businesses and to reduce their response burden.
The collection strategy is supported by the agency-wide governance of the survey portfolio. On the one hand, this refers to managing the sample selection process in order to prevent small businesses from participating in more than two surveys. On the other hand, it refers to implementing a “survey collision” examination process to avoid collecting the same information, often simultaneously, with different questionnaires. The Business Register (use of which is mandatory) and the integrated approach for business surveys are elements that contribute to the success of this strategy (for more information, see Chapter 3.5: Collection management and planning).
To reduce the response burden, Statistics Canada offers business survey participants the services of an ombudsman. The role of the ombudsman is to examine complaints from participants who feel they have too high a response burden or who have misgivings about their interactions with Statistics Canada staff. The services of the ombudsman are impartial and free of charge.
The Enterprise Portfolio Management Program is responsible for overseeing relations with respondents from Canadian large businesses, maintaining business structures in the Business Register and managing business survey responses. These activities are carried out by business portfolio managers with the help of specialized research analysts in the relevant sectors.
Electronic data collection is the mode favoured by Statistics Canada for the majority of business surveys because it makes it easier for respondents to participate in surveys. This is an important component of ICOS.
As part of its engagement with businesses and business associations, Statistics Canada takes additional steps to better understand the concerns of businesses and to highlight that they are also data users. This is particularly true for large businesses, where data users and survey respondents are rarely the same people. Users work in planning and marketing, while respondents tend to work in accounting or administration. One should not assume that users discuss the importance of good statistical data with respondents. Instead, one must take the necessary measures to encourage this type of communication within businesses.
Since 2007, Statistics Canada has actively contributed to the Government Paperwork Burden Reduction Initiative for Canadian small businesses. This initiative develops strategies for eliminating excessive regulation, overlap, duplication and redundancy, as well as simplifying regulatory compliance. Statistics Canada has a concrete objective to reduce the time businesses devote to participating in surveys, whether by reducing the number of surveys or questions in the surveys, limiting the period during which businesses are included in the sample, using more user-friendly data collection methods, or by replacing surveys, in whole or in part, by using more administrative data.

Statistics Canada – Catalogue no. 11-634-X 247
Section 4 - Communicating with key stakeholders Chapter 4.5 - Relations with survey participants
Key success factorsStatistics Canada strategically invests in research initiatives, be they in qualitative testing to improve the content of invitation letters, or in a more complex analysis of suitable criteria for persuasion, based on a respondent profile. These initiatives support the principles of behavioural economics2, by which people in general, or respondents in our particular context, do not base their decisions solely on rational arguments or principles, but, instead, also react to emotional or behavioural elements. The goal of these initiatives is to pinpoint the criteria that influence participants to answer and, in particular, the specific point in the survey process when they make the decision to participate. The challenge with these research initiatives is to determine to what extent these strategies, also known as nudging,3 enable the agency to influence a person to take part in a survey, and thereby maintain or improve response rates.
Statistics Canada uses many new media as communication tools to complement more conventional tools. The purpose of using these new communication tools is to foster more interactive exchange with the public; these tools use clear and accessible language both to explain the significant role statistics play in shaping people’s lives, and to provide relevant, strategic and timely information to respondents.
Statistics Canada is aware that it is vital for interviewers to receive effective training and materials. This material might include infographics or visual aids that enable interviewers to better explain Statistics Canada’s mandate. The training and materials also show how important it is to participate in surveys and explain how the data collected may be used.
Challenges and looking aheadMaintaining acceptable response rates for all surveys, particularly social surveys, is a major challenge for all statistical agencies in light of the following constraints:
• greater difficulty reaching respondents as a result of the increasing use of smartphones and avoidance strategies (call display, number blocking, etc.)
• increasing respondent concern with privacy
• decreased willingness to participate in surveys because they lack time or interest, or because they are increasingly solicited by private telemarketing firms
With the ultimate goal of maintaining or improving response rates, and thereby preserving the quality of its survey results, Statistics Canada has committed to continue investing in
• better reminder and refusal strategies;
• more online questionnaires for data collection, when appropriate for the survey;
• optimal respondent cooperation by using persuasive, relevant and interactive communication strategies;
• tests, techniques and research initiatives that better identify levers of persuasion and more specific criteria for persuading respondents to participate in surveys; and
• more systematic and strategic use of administrative data to support the survey process and reduce the response burden.
2. KAHNEMAN, 20133. THALER and SUNSTEIN, 2009

Statistics Canada – Catalogue no. 11-634-X248
Compendium of Management Practices for Statistical Organizations From Statistics Canada’s International Statistical Fellowship Program
BibliographyGovernment of Canada (2005). Statistics Act, R.S.C. 1985, c. S-19 amended by 1988, c. 65, s. 146 1990, c. 45, s. 54 1992, c. 1, ss. 130, 131. 2005, c. 31, 2005, c. 38. Retrieved from http://laws-lois.justice.gc.ca/eng/acts/S-19/FullText.html
Kahneman, Daniel (2013). Thinking Fast and Slow, Presentation on Slideshare. Consulted on the 11 of March 2016 and retrieved from http://www.slideshare.net/steddyss/writing-to-persuade-3604130
Sunstein, Cass R.; Thaler, Richard E (2009). Improving Decisions About Health, Wealth, And Happiness, BWD Creative (Australia). Consulted on the 11 of March 2016 and retrieved from http://bwdcreative.com.au/thoughts/nudge-people-act-using-behavioural-economics/
Statistics Canada (2011). Directive on Informing Survey Respondents, Ottawa. Internal document. Accessible on demand.

Statistics Canada – Catalogue no. 11-634-X 249
Section 4 - Communicating with key stakeholders Chapter 4.6 - Respecting privacy and protecting confidentiality
Chapter 4.6 – Respecting privacy and protecting confidentiality
ContextAll statistical surveys represent a degree of privacy invasion—privacy defined as the right for respondents to be left alone, to be free from interference, surveillance and intrusions.
Accurate and reliable data rely on the goodwill and cooperation of the public—whether their participation is optional or based on mandatory legal requirements. In order to maintain the trust of respondents, it is crucial for statistical organizations to secure the privacy of household and business data by assuring that data published cannot be related to an identifiable person or business.4
It is expected that confidentiality be implemented at each level and step of the statistical process—from the preparation of the survey to the dissemination of statistical products.
At Statistics Canada, sensitive statistical information is defined according to the Directive on the Security of Sensitive Statistical Information, which consists of the following:
• Information provided in confidence, such as
− data obtained, under the authority of the Statistics Act, either directly from respondents or from a third party (i.e., statistical administrative information) in identifiable mode;
− data holdings stripped of identifiers, but held in a geographical structure or format that could permit the establishment of a direct relationship among such data holdings and identifiable units.
• Information related to a statistical data collection or production process that is linked to an identifiable person, business or organization (called paradata). Aggregate statistical information in the pre-release stage (including work in progress provided to external organizations for data validation).
Statistical organizations are required by law to protect the confidentiality of respondents’ information, and it is essential that clear legal provisions are laid down in statistical law to ensure that statistical confidentiality is protected. In Canada, the legal framework relies on the following two important pieces of legislation:
• Canada’s Statistics Act provides Statistics Canada with access to all records held by governments, businesses and organizations, and, specifically identifies all taxation and customs records, as well as court records. The Statistics Act contains strong legal provisions that indicate the degree of importance that the Parliament of Canada accords to good statistical information. Information obtained by Statistics Canada under these provisions is subject to the same guarantee of confidentiality that applies to data collected directly by the agency. Strong measures are in place to foster an organizational culture whereby all employees feel personally responsible to uphold that confidentiality guarantee. They are also subject to penalties under the Statistics Act should they willfully disclose confidential information.
• Canada’s Privacy Act, which is a very detailed piece of legislation, that applies only to persons, and that obliges the agency and its employees to keep confidential all individual information obtained under the Privacy Act Exceptions to this restriction are few and carefully circumscribed. The Privacy Act guarantees confidentiality during the legal and organizational aspects in the context of producing a statistical survey. A number of internal policies regarding the collection, use and disclosure of statistical information are in place within the agency.
The preceding pieces of legislation guarantee four guiding principles:
• the privacy of data providers (households, businesses, or other respondents) and the confidentiality of the information they provide
• the security of information received from data providers
• the use of the data for statistical purposes
• penalties and sanctions in case of infraction.
4. UNITED NATIONS, 2014

Statistics Canada – Catalogue no. 11-634-X250
Compendium of Management Practices for Statistical Organizations From Statistics Canada’s International Statistical Fellowship Program
Mechanisms and measures for respecting privacy and protecting confidentiality
A number of mechanisms and measures are in place to ensure that privacy is respected and confidentiality is protected, including the following:
• mandatory obligations for employees
• training
• strong culture of respect for the need for privacy and confidentiality
• physical security
• information technology (IT) security
• disclosure control
• record-linkage control
• privacy impact assessments
• measures to protect confidentiality while granting access to confidential information for statistical and/or research purposes (covered in detail in Chapter 4.4 – Access to microdata).
1. Mandatory obligations of employees
Employees at Statistics Canada are asked to swear an oath of secrecy to make each employee fully aware and liable in terms of protecting confidentiality.
Taking an oath of secrecy under the Statistics Act is a requirement for to all employees of Statistics Canada and to persons “deemed to be employees” (according to the Statistics Act). Employees who swear in by affirming this oath promise to fulfill their duties by agreeing to respect the confidentiality requirements of the Statistics Act. Of key importance is the promise never to disclose identifiable information about any individual person, business or organization that employees learn of while undertaking their duties. This oath lasts a lifetime. Even after leaving the employment of Statistics Canada, persons must remain faithful to the oath and maintain the confidentiality of any statistical information to which they had access. Persons are liable to the penalties outlined in the Statistics Act (fines and/or imprisonment) or other sanctions that could lead to and include termination of employment if they break the oath. Refer to Box 2.6.1 (at the end of this chapter) for the wording of Statistics Canada’s oath of secrecy.
2. Training
Statistics Canada has taken measures to improve its training in the areas of privacy, confidentiality and security. Flagship training courses that are mandatory for specific groups of employees contain a module on these three topics. The orientation course that all new employees must also attend includes basic training on confidentiality and security.
To address the needs of not only all new employees, but also those in the professional streams, a computer-based training module has been developed. This course is delivered to employees when they receive their user identification (ID) card for the computer system. It takes only 20 minutes to complete and it covers all the basic information on confidentiality, privacy, network use, IT security, physical security, fire safety and building evacuation practices. This course must be retaken periodically when employees renew their ID cards.
3. strong culture of respect for the need for privacy and confidentiality
Statistics Canada is known for its strong traditions of respect for privacy and protection of confidentiality. Directors from statistical program areas play a very important role and have direct responsibility for controlling and protecting all sensitive statistical information obtained by their respective work units in fulfilling their program objectives. For example, they must ensure that appropriate control measures regarding access to confidential microdata files are in place in their divisions. They must also determine the need to retain identifiable files and ensure that such files are referenced as required under the Privacy Act and the Access to Information Act.

Statistics Canada – Catalogue no. 11-634-X 251
Section 4 - Communicating with key stakeholders Chapter 4.6 - Respecting privacy and protecting confidentiality
4. Physical security
The Government of Canada’s approach to physical security measures is to design and manage environments or facilities with specific physical security safeguards.
Physical security is implemented at various levels across the agency. The extent to which physical security measures are applied in a given work area will vary according to operations, location, type, and the nature of work, and any other factors bearing on the general work environment.
• Identification cards
Electronic identification cards are issued to all employees and contractors of Statistics Canada, as well as all other employees of departments that occupy space in Statistics Canada headquarters.
The electronic identification card has an expiry date (usually three years from the date issue for indeterminate employees). Prior to the card’s expiry, employees are required to report to the Departmental Security Office to have their card updated to continue their access to the agency’s buildings. The electronic identification card is required to enter Statistics Canada premises and it is to be visibly worn by all employees at all times.
• Areas with restricted access
All three buildings at headquarters are designated as restricted-access areas, which means that safeguards are in place that will allow access to authorized personnel only. In the regional offices, restricted areas are designated in accordance with operational requirements.
Security personnel are hired to protect the health and safety of employees and to safeguard departmental assets and information. Specifically, a security guard’s duties include reception, building access control, patrol and escort functions, monitoring of alarm/video- and life-safety systems, and emergency response.
• Building controls and access
All perimeter doors are equipped to monitor unauthorized entry or departure. These doors are to be used only in the event of a building emergency or during a scheduled building evacuation.
Employees who use these doors without proper authority are subject to disciplinary action.
5. Information technology security
Information technology (IT) security addresses the protection of information during collection and transaction input, transmission, processing, storage, retrieval, output and disposal. It also includes the protection of IT systems and facilities. This protection is achieved using technical, procedural and administrative procedures and practices. Collectively, these procedures and practices are designed to prevent, detect potential loss, and enable recovery from damage to the confidentiality, integrity and availability of the agency’s data, systems and facilities.
Statistics Canada has always maintained a very strict code of IT security by implementing and maintaining the following measures:
• Agency Network Use Policy
All employees are required to read and accept the Network Use Policy as a condition of receiving their computer user account. In addition, they are required to sign, three times a year, a reaffirmation that indicates their understanding of the policy and acknowledges that they will follow its requirements. This policy governs their use of the IT system and covers issues such as acceptable use of email and the Internet, as well as virus protection.
• Controlled access to the database system
The agency manages the various accesses through to the Corporate Access Request System (CARS), which is used to automate and control employees’ access to data, applications and after-hours buildings.
• Virus protection

Statistics Canada – Catalogue no. 11-634-X252
Compendium of Management Practices for Statistical Organizations From Statistics Canada’s International Statistical Fellowship Program
Serious viruses can cause havoc to an information-based organization. The most up-to-date detection, isolation and irradiation methods must be in place along with employee awareness and compliance with the virus prevention and protection protocols. Statistics Canada IT staff and employees are very vigilant in this matter as data reliability, integrity and confidentiality are at risk in an event of a serious virus attack.
All Statistics Canada employees must consider privacy and confidentiality when choosing email as a means of communication. The agency’s email system does not currently provide security features such as encryption to protect email messages or attachments during transmission. However, confidential information can be shared through an electronic-file-transfer platform, if necessary.
6. Disclosure control Disclosure control measures are designed to ensure that the confidentiality protection commitment of statistical organizations is met while preserving the usefulness of data outputs to the greatest extent possible.
• These mechanisms are usually applied as indicated below:
• During data collection and data processing, there are separation between the direct identifiers and the statistics provided; personal data and questionnaires are kept secure, and later destroyed after a required length of time.
• Prior to publishing aggregated data, information is suppressed if the number of respondents allows easy disclosure of individual data; use of standard software for checking tabulations is used; and a review is conducted by authorized staff of all data prepared for publication and possible disclosure.
• When releasing individual data, all applications must be examined in relation to access to confidential data requirements by the Disclosure Review Committee; the release of individual data are authorized as anonymized microdata only for research purposes; and releases must limit geographic detail, the number of variables, recoding and sampling.
The Disclosure Review Committee was established to share best practices across the program areas. Furthermore, the increase in the amount and complexity of analyses being undertaken—mostly through research data centres—has created new challenges for disclosure control.
Under specific circumstances, the Chief Statistician is the only official who may, by order, authorize the disclosure of confidential data, as stated in the Statistics Act.
7. Control over record linkageAccording to the Directive on Record Linkage, record linkage is defined as combining two or more microrecords to form one composite record containing information about the same entity. Record linkage is an important technique used in the development, production, analysis and evaluation of statistical data. This technique reduces respondent burden because it does not make it necessary to go back to a respondent to collect the information.
Record linkage can be undertaken at Statistics Canada for research and statistical purposes only, and the linkage must lead to benefits that serve the public interest. It must also be clear how the proposed methodology could lead to results that, in turn, could be implemented to address important public issues.
Record linkage has always dealt with a balance between the competing public goods of privacy protection and the value of the information that can be delivered through linkage. Given the wide scope of record linkage within a centralized statistical system, particularly one with Statistics Canada’s broad access to data holdings of other departments, the agency developed a multi-level review procedure, as well as extensive ongoing consultation mechanisms with stakeholders and the Office of the Privacy Commissioner. All linkages must be approved by the Executive Management Board, chaired by the Chief Statistician.
8. Privacy impact assessmentsA privacy impact assessment (PIA) is an evaluation that looks at privacy, confidentiality and security risks associated with the collection, use or disclosure of personal information. PIAs help program areas develop measures to mitigate or eliminate the identified risks.
All PIAs are to be sent to the Office of the Privacy Commissioner.

Statistics Canada – Catalogue no. 11-634-X 253
Section 4 - Communicating with key stakeholders Chapter 4.6 - Respecting privacy and protecting confidentiality
Key success factors Statistics Canada has a long history as a statistical agency that is up-to-date in terms of maintaining policies, procedures, and tools that continually enhance the protection of statistical information.
A strong confidentiality culture is paramount. Awareness among and training of employees are key in safeguarding the confidentiality of respondent data. Training tools guarantee due diligence and ensure that all practices are consistently followed and systematically applied.
Enhancing research by being informed and considering new methods, trends or best practices while protecting confidentiality are also key to success. All improvements to technical means can add a layer of protection, with a positive impact.
Challenges and looking aheadRespect for the privacy of respondents and maintaining the confidentiality of individuals’ responses are key for the survival of any national statistics office. Any serious breach or even perceived breach of privacy could severely damage the public’s trust and confidence, with an impact on response rates.
With rapid advances in electronic communication technology, along with growing awareness of the privacy concerns that this technology brings, statistical agencies are experiencing increasing pressure to justify their activities in the context of privacy implications. An open and coherent approach to addressing privacy issues on the part of the statistical agencies is a necessary element of their successful management in the future.

Statistics Canada – Catalogue no. 11-634-X254
Compendium of Management Practices for Statistical Organizations From Statistics Canada’s International Statistical Fellowship Program
Box 4.6.1 Statistics Canada Oath or Solemn Affirmation of Office and SecrecyFor employees and deemed employees
1. PurposeThe purpose of this preamble is to clarify the implications of the secrecy provisions and consequences of violating your oath or affirmation of the Statistics Act. The Statistics Act requires all employees and deemed employees of Statistics Canada to take an oath or solemn affirmation of office and secrecy. The Statistics Act gives Statistics Canada the authority to collect information by contacting respondents directly and by accessing administrative records held by other departments, at the federal and provincial level, or by municipal governments, businesses, corporations and organizations.
2. Obligation to protect confidentialityTo balance Statistics Canada’s extensive powers to collect and access information, the Statistics Act establishes the rigorous legal obligation for the Agency to keep the confidential information obtained in trust. The Statistics Act makes a formal commitment to respondents and data providers that the information they provide will never be released to anyone in a form that is identifiable, without their authorization.
3. The principle of confidentialityThe general principle of confidentiality is described in subsection 17(1) of the Statistics Act: no person other than an employee or a deemed employee of Statistics Canada who has sworn or affirmed the following oath can examine identifiable information collected under the authority of the Statistics Act. Furthermore, such information may not be disclosed in a form that may identify an individual person, business or organization.
4. PenaltiesAs noted in the Statistics Act, violations of the confidentiality provisions are a criminal offence. After taking the Statistics Act Oath or Solemn Affirmation of Office and Secrecy, all persons who seek to obtain information they are not authorized to have, who desert from their duties or make false statements or returns in the performance of their duties, or who disclose identifiable statistical information are liable to fines of up to $1,000 or to a prison term of up to six months, or to both. Additionally, the Statistics Act also provides for more severe penalties for employees and deemed employees who, after taking the oath of office, unlawfully disclose information which might influence the value of any security or other asset, or who use such information for the purpose of speculation. Penalties in these circumstances can be fines ranging up to $5,000 or prison terms of up to five years, or both.
The Statistics Act Oath or Solemn Affirmation of Office and SecrecyThe Statistics Act Oath or Solemn Affirmation of Office and Secrecy is a requirement of the Statistics Act. It reflects and supports the confidentiality provisions of the Statistics Act. Persons swearing/affirming this oath promise to fulfill their duties by agreeing to respect the confidentiality requirements of the Statistics Act. Of key importance is the promise never to disclose identifiable information about any individual person, business or organization that they became aware of while undertaking their duties as employees or deemed employees of Statistics Canada. The oath lasts a lifetime, so even after leaving the employment of Statistics Canada, persons must still adhere to the oath and protect the confidentiality of any statistical information to which they had access.
I , (name) do solemnly swear (or affirm) that I will faithfully and honestly fulfill my duties as an employee of Statistics Canada in conformity with the requirements of the Statistics Act, and of all rules and instructions thereunder, and that I will not without due authority on that behalf disclose or make known any matter or thing that comes to my knowledge by reason of my employment.

Statistics Canada – Catalogue no. 11-634-X 255
Section 4 - Communicating with key stakeholders Chapter 4.6 - Respecting privacy and protecting confidentiality
BibliographyUnited Nations (2014). United Nations Fundamental Principles of Official Statistics; Implementation Guide.
Government of Canada (2005). Statistics Act. L.R.C 1985, c. S-19. Amended by 1988, c. 65, s. 146; 1990, c. 45, s. 54; 1992, c. 1, ss. 130, 131; 2005, c. 31; 2005, c. 38. Consulted on 11th of March 2016 and retrieved from http://laws-lois.justice.gc.ca/eng/acts/S-19/FullText.html
Government of Canada (1985). Privacy Act, Consulted on the 11th of March 2016 and retrieved from http://laws-lois.justice.gc.ca/eng/acts/P-21/
Statistics Canada (2008). Access to Information Act, Ottawa. Consulted on the 11th oh March 2016 and retrieved from http://laws-lois.justice.gc.ca/eng/acts/A-1/
Statistics Canada (2012). Directive on Security of Sensitive Statistical Information, Ottawa. Internal document. Accessible on demand.
Statistics Canada (1998). Network Use Policy, Ottawa. Internal document. Accessible on demand.
Statistics Canada (2011). Directive on Record Linkage, Ottawa. Internal document. Accessible on demand.

Statistics Canada – Catalogue no. 11-634-X256
Compendium of Management Practices for Statistical Organizations From Statistics Canada’s International Statistical Fellowship Program
Statistics Canada – Catalogue no. 11-634-X 257
Conclusion
Conclusion
It is no easy matter to devise a conclusion to this compendium, given the range and number of topics and issues covered. However, we could conclude by focusing, one last time, on the key elements that national statistical offices should try to implement to create winning conditions so that they can continually improve and strengthen their statistical system:
• Adopting, communicating and implementing a clear medium- and long-term strategic vision that considers the need to invest in statistical infrastructure and capabilities on an ongoing, consistent and optimal basis. This vision should, among other things, give priority to allocating resources strategically, based on all the statistical needs to be met, rather than responding to requests and producing surveys on a case-by-case basis. With this in mind, statistical offices should press for the development of skilled, mobile and innovative staff and the implementation of an integrated statistical infrastructure of information systems, production processes and generalized tools to sustainably strengthen the effectiveness, coherence and efficiency of the statistical system.
• Managers’ commitment to the sound and effective management of the organization and their active participation in conveying the desired vision, values and culture to employees. Senior management must, in the interests of the organization, maintain credibility, trust and an image and reputation of excellence. They must also make informed, ethical and responsible decisions. Their role is also to ensure consistency between the strategic directions and the actions to implement them. Consequently, managers must not only give the necessary support to employees in fulfilling the vision, but they must also institute controls to guarantee the conformity and cohesion of practices within the organization.
• The existence of a well-established and coherent governance structure based on the creation of management committees, committees of experts from different areas of the organization, and finally advisory committees whose members are external. This governance structure will avoid the silo effect in decision-making, which is not optimal for the organization; it must be well known to employees and transparent through the publication of minutes, and it must be supported by clear and comprehensive governance frameworks and instruments. Establishing governance instruments, including policies, directives, standards and guidelines, is crucial for the effective, coherent and transparent functioning of a national statistical system. Thus, all the practices, processes, measures, instructions and roles and responsibilities must be clearly and explicitly stated to be respected by all concerned.
• Management mechanisms, practices and principles that are rigorous, coherent and effective with respect to integrated strategic planning, project management, quality management, financial management, talent management, internal communications and internal controls.
• The ability to mobilize financial resources that will be reinvested in new programs or in the system’s statistical capabilities and infrastructures. This is made possible, first, by tackling performance problems and developing innovative and integrated solutions that will achieve efficiencies within the system. Second, strategic and proactive management of key partnerships will stimulate the investments needed to meet statistical needs. Finally, the development of an integrated system and a mobile workforce may also make it possible to carry out cost-recovery projects that, in turn, will strengthen the statistical infrastructures and capabilities over the medium and long term.
• A value-based corporate culture rooted in respect, integrity and confidentiality, and which encourages co-operation, innovation and team spirit. Along these lines, appropriate strategies for internal communications, human resources management and leadership by managers will further engage employees in the desired business culture and the creation of esprit de corps within the organization.

Statistics Canada – Catalogue no. 11-634-X258
Compendium of Management Practices for Statistical Organizations From Statistics Canada’s International Statistical Fellowship Program
• An approach based on harmonization, dialogue, listening and maintaining partnerships. In its dealings with key partners and data users, and with data suppliers and survey respondents, a national statistical office must be attentive to their needs and concerns. Otherwise, without key partners and data users, the data would be neither useful nor used; and without data suppliers and survey respondents, they would simply not be produced. To maintain the relevance and quality of its data, a statistical office must make those data central to its concerns. Lastly, all statistical offices must maintain and strengthen their co-operation with the national statistical offices of other countries and with international bodies. These forums of collaboration, networking and discussion offer invaluable opportunities to share international standards, lessons learned and best practices in improving and strengthening statistical systems.