comparison of soil carbon measuring...
TRANSCRIPT

1
KK--StateState
Comparison of Soil Carbon
Measuring Techniques
Comparison of Soil Carbon Comparison of Soil Carbon
Measuring Techniques Measuring Techniques
R.C. Izaurralde, M.H. Ebinger, J.B. Reeves, C.W. Rice,L. Wielopolski, B.A. Francis, R.D. Harris, S. Mitra,
A.M. Thomson, J.D. Etchevers, K.D. Sayre, A. Rappaport, and B. Govaerts
Agriculture’s Role in the New Carbon EconomyCASMGS Forum
Manhattan, KS17-18 December, 2007
2
IntroductionIntroductionIntroduction
Changes in soil C stocks can be
measured directly through soil
sampling or estimated using eddy
covariance, stratified accounting,
or simulation models
Steps for measuring soil C include
soil sampling, sample preparation,
measurement by dry combustion,
and calculation of results on a soil-
mass basis
However, there is a need to
develop fast and accurate
procedures to measure soil C
changes at the field scale
Root C
Litter
C
Eroded C
Cropland C
Wetland C
Eddy flux
Sample
probe
Soil profile
Remote
sensor
Respired C
Captured C
Heavy
fraction
C
Woodlot C
Harvested C
Buried C
Light
fraction
C
Respired C
Soil organic C
Soil inorganic C
Simulation modelsDatabases / GIS
SOCt = SOC0 + Cc + Cb - Ch - Cr - Ce
Post et al. (2001) Climatic Change 51:73-99
2
3
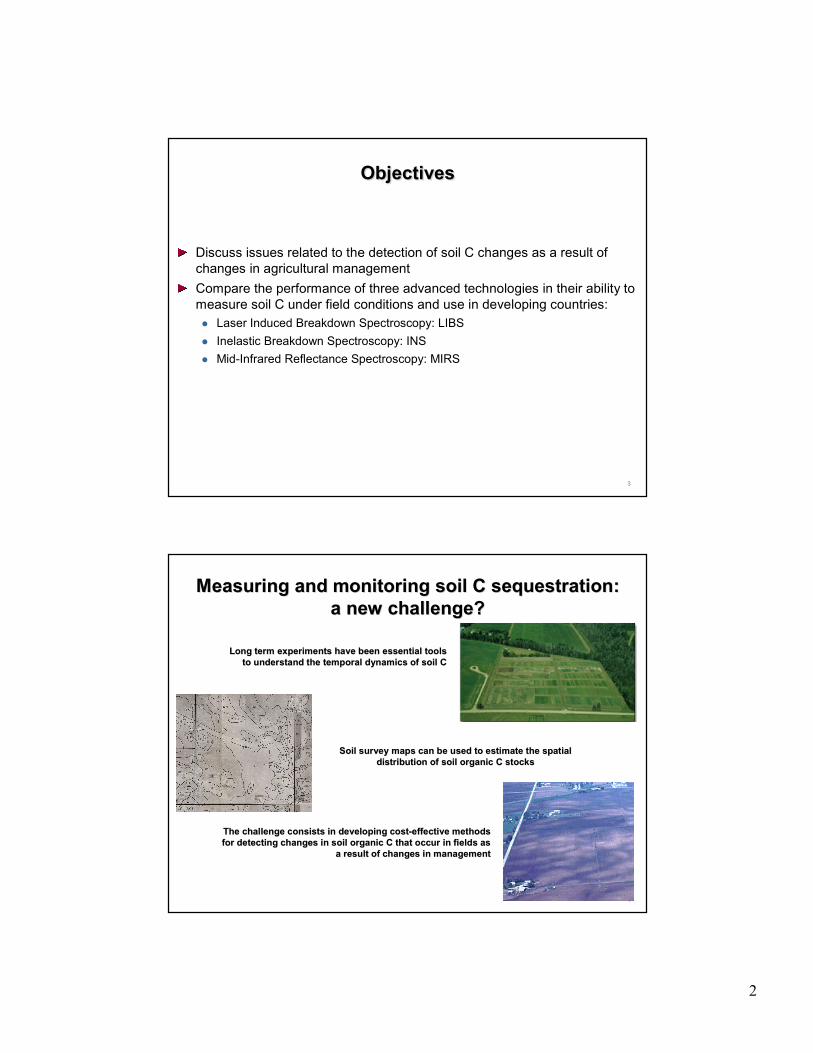
ObjectivesObjectivesObjectives
Discuss issues related to the detection of soil C changes as a result of
changes in agricultural management
Compare the performance of three advanced technologies in their ability to
measure soil C under field conditions and use in developing countries:
� Laser Induced Breakdown Spectroscopy: LIBS
� Inelastic Breakdown Spectroscopy: INS
� Mid-Infrared Reflectance Spectroscopy: MIRS
4
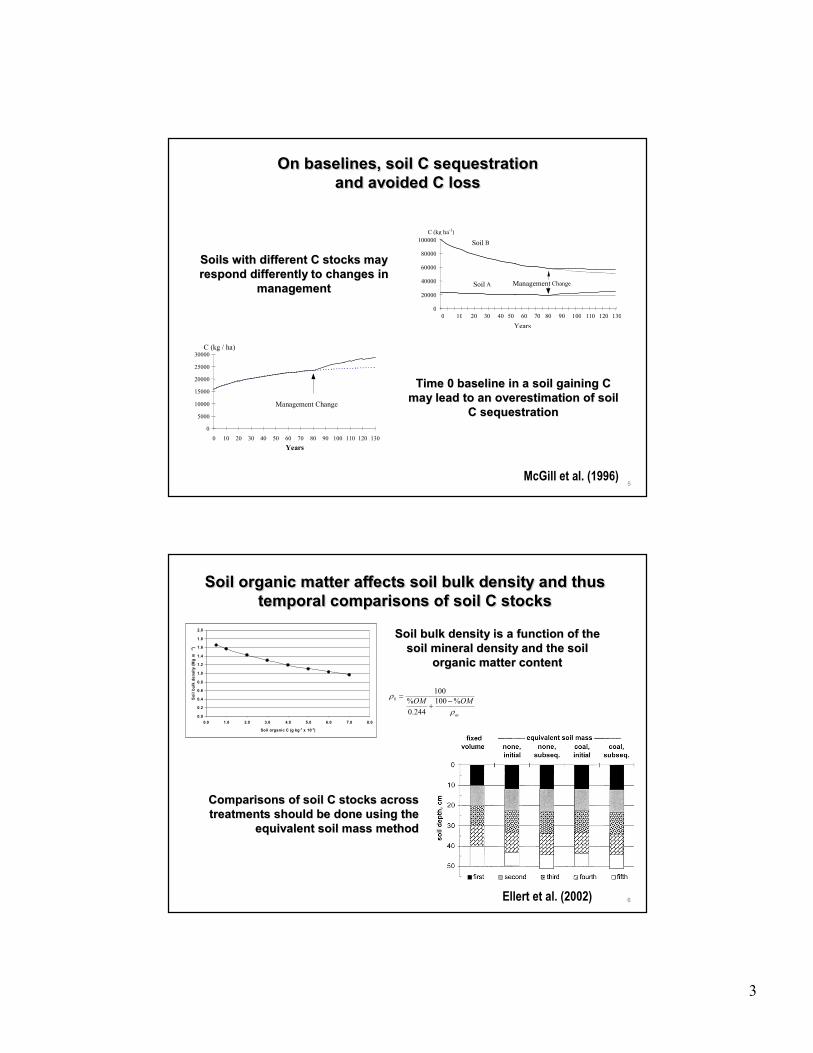
Soil survey maps can be used to estimate the spatial Soil survey maps can be used to estimate the spatial
distribution of soil organic C stocksdistribution of soil organic C stocks
Long term experiments have been essential tools Long term experiments have been essential tools
to understand the temporal dynamics of soil Cto understand the temporal dynamics of soil C
The challenge consists in developing costThe challenge consists in developing cost--effective methods effective methods
for detecting changes in soil organic C that occur in fields as for detecting changes in soil organic C that occur in fields as
a result of changes in managementa result of changes in management
Measuring and monitoring soil C sequestration: Measuring and monitoring soil C sequestration:
a new challenge?a new challenge?
3
5
On baselines, soil C sequestration
and avoided C loss
On baselines, soil C sequestration On baselines, soil C sequestration
and avoided C lossand avoided C loss
0
20000
40000
60000
80000
100000
0 10 20 30 40 50 60 70 80 90 100 110 120 130
Years
C (kg ha-1)
Management ChangeSoil A
Soil B
McGill et al. (1996)
0
5000
10000
15000
20000
25000
30000
0 10 20 30 40 50 60 70 80 90 100 110 120 130
Years
C (kg / ha)
Management Change
Soils with different C stocks may Soils with different C stocks may
respond differently to changes in respond differently to changes in
managementmanagement
Time 0 baseline in a soil gaining C Time 0 baseline in a soil gaining C
may lead to an overestimation of soil may lead to an overestimation of soil
C sequestrationC sequestration
6
Soil organic matter affects soil bulk density and thus
temporal comparisons of soil C stocks
Soil organic matter affects soil bulk density and thus Soil organic matter affects soil bulk density and thus
temporal comparisons of soil C stockstemporal comparisons of soil C stocks
Ellert et al. (2002)
0.0
0.2
0.4
0.6
0.8
1.0
1.2
1.4
1.6
1.8
2.0
0.0 1.0 2.0 3.0 4.0 5.0 6.0 7.0 8.0
Soil organic C (g kg-1 x 10⁻¹)
Soil bulk density (Mg m
-3)
Soil bulk density is a function of the Soil bulk density is a function of the
soil mineral density and the soil soil mineral density and the soil
organic matter contentorganic matter content
Comparisons of soil C stocks across Comparisons of soil C stocks across
treatments should be done using the treatments should be done using the
equivalent soil mass methodequivalent soil mass method
m
bOMOM
ρ
ρ%100
244.0
%
100
−+
=
4
7
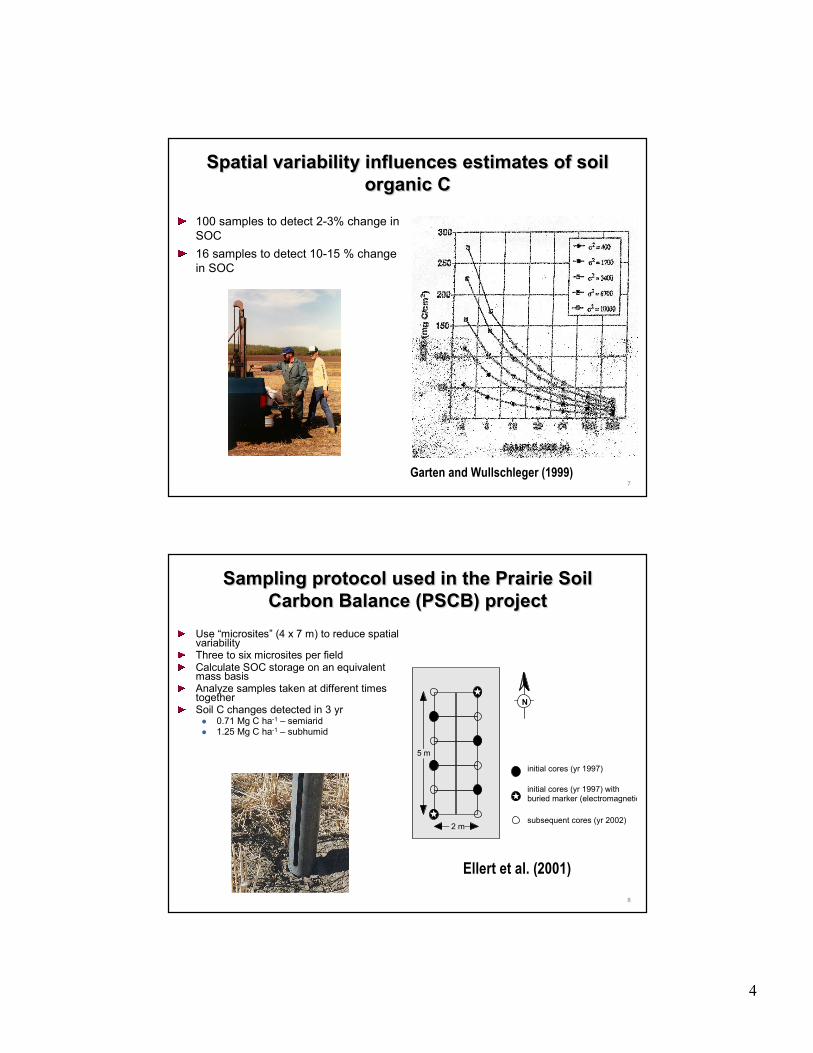
Spatial variability influences estimates of soil
organic C
Spatial variability influences estimates of soil Spatial variability influences estimates of soil
organic Corganic C
100 samples to detect 2-3% change in
SOC
16 samples to detect 10-15 % change
in SOC
Garten and Wullschleger (1999)
8
Sampling protocol used in the Prairie Soil
Carbon Balance (PSCB) project
Sampling protocol used in the Prairie Soil Sampling protocol used in the Prairie Soil
Carbon Balance (PSCB) projectCarbon Balance (PSCB) project
Use “microsites” (4 x 7 m) to reduce spatial variabilityThree to six microsites per fieldCalculate SOC storage on an equivalent mass basisAnalyze samples taken at different times togetherSoil C changes detected in 3 yr� 0.71 Mg C ha-1 – semiarid� 1.25 Mg C ha-1 – subhumid
2 m
5 m
initial cores (yr 1997)
subsequent cores (yr 2002)
initial cores (yr 1997) with buried marker (electromagnetic)
N
Ellert et al. (2001)

5
9
Random
Grid
Mean SD CV n
Grid 1 48.4 3.9 8.0 25
Grid 2 47.8 3.5 7.4 25
Grid 3 47.8 2.7 5.7 25
Average 48.0 3.4 7.0 75
Comp 1 48.5 1
Comp 2 44.7 1
Comp 3 46.7 1
Average 46.6 1.9 4.1 3
Grid and sampling schemes demonstrate that soil C Grid and sampling schemes demonstrate that soil C
stocks can be determined with low errorsstocks can be determined with low errors
Source: G. Watson and C. Rice
Soil C (Mg C haSoil C (Mg C ha--11 to 30to 30--cm soil depth)cm soil depth)
10
Determination of soil organic C concentration:
standard methods
Determination of soil organic C concentration: Determination of soil organic C concentration:
standard methodsstandard methods
Wet combustion� Soil sample treated with acid dichromate
solution� CO2 generated evaluated with titrimetric or
gravimetric methods� Recovery is incomplete (avg. 81%)
Dry combustion� High temperature (1000 – 1500 C)� CO2 generated assessed with
spectrophotometric, volumetric, titrimetric, gravimetric, or conductimetric techniques
� Very accurate, minimal variability, low operational errors
� Corrections needed when samples contain carbonates
National and international efforts needed to cross-calibrate methods against standard (soil) samples
y = 1.0216x + 0.0342
R2 = 0.9453**, n = 171
0.0
0.5
1.0
1.5
2.0
2.5
3.0
0.0 0.5 1.0 1.5 2.0 2.5 3.0
Instrument 1 (g C kg-1 x 10⁻¹)
Instrument 2 (g C kg
-1 x 10⁻¹)
Izaurralde and Rice (2006)
Total soil C as measured by two dry
combustion instruments
6
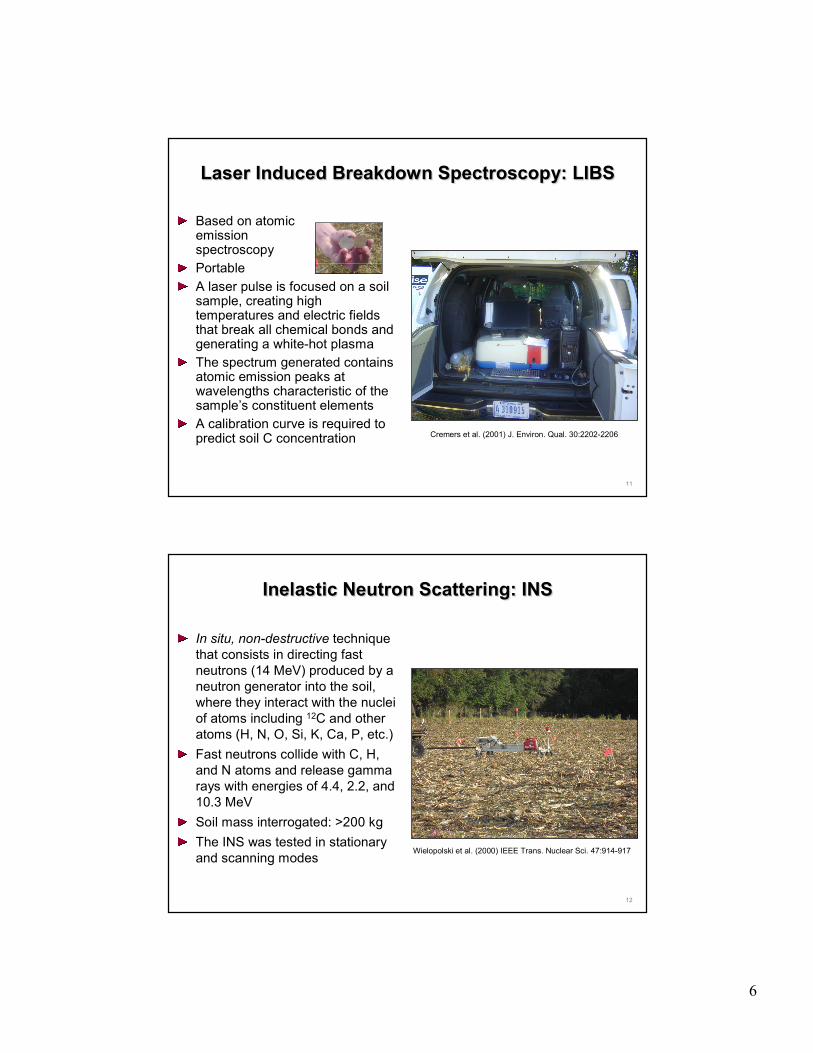
11
Laser Induced Breakdown Spectroscopy: LIBSLaser Induced Breakdown Spectroscopy: LIBSLaser Induced Breakdown Spectroscopy: LIBS
Based on atomic emission spectroscopy
Portable
A laser pulse is focused on a soil sample, creating high temperatures and electric fields that break all chemical bonds and generating a white-hot plasma
The spectrum generated contains atomic emission peaks at wavelengths characteristic of the sample’s constituent elements
A calibration curve is required to predict soil C concentration Cremers et al. (2001) J. Environ. Qual. 30:2202-2206
12
Inelastic Neutron Scattering: INSInelastic Neutron Scattering: INSInelastic Neutron Scattering: INS
In situ, non-destructive technique
that consists in directing fast
neutrons (14 MeV) produced by a
neutron generator into the soil,
where they interact with the nuclei
of atoms including 12C and other
atoms (H, N, O, Si, K, Ca, P, etc.)
Fast neutrons collide with C, H,
and N atoms and release gamma
rays with energies of 4.4, 2.2, and
10.3 MeV
Soil mass interrogated: >200 kg
The INS was tested in stationary
and scanning modesWielopolski et al. (2000) IEEE Trans. Nuclear Sci. 47:914-917
7
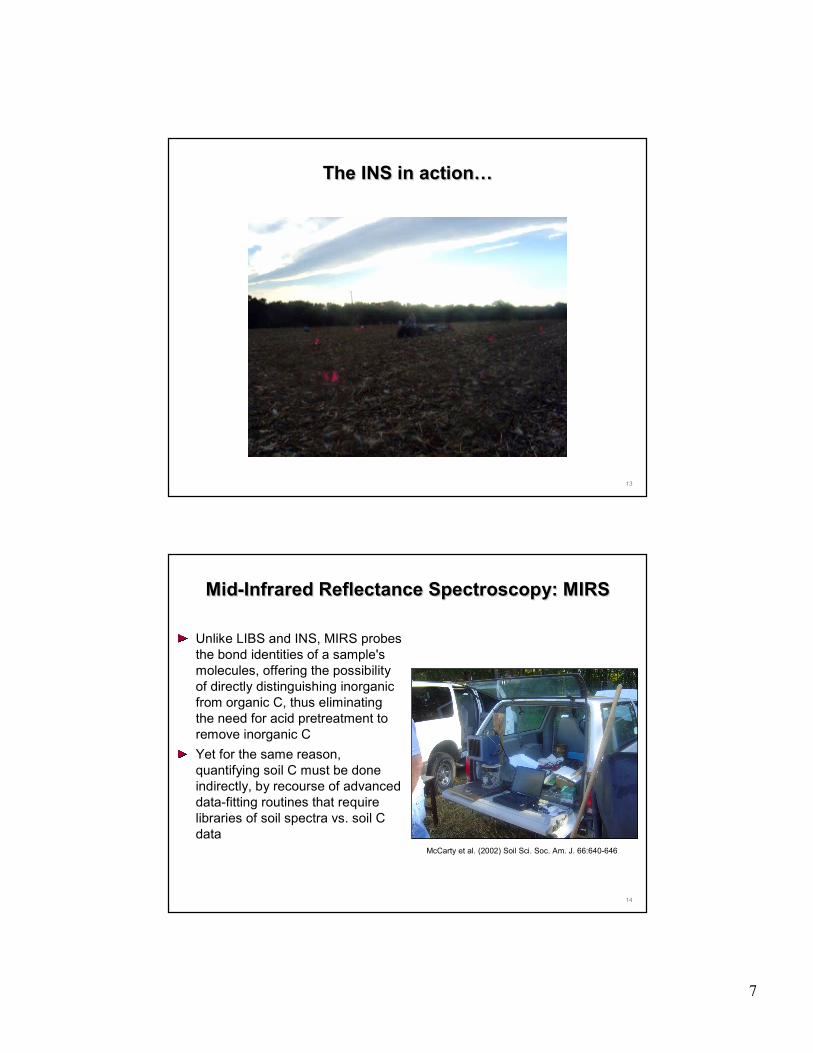
13
The INS in action…The INS in actionThe INS in action……
14
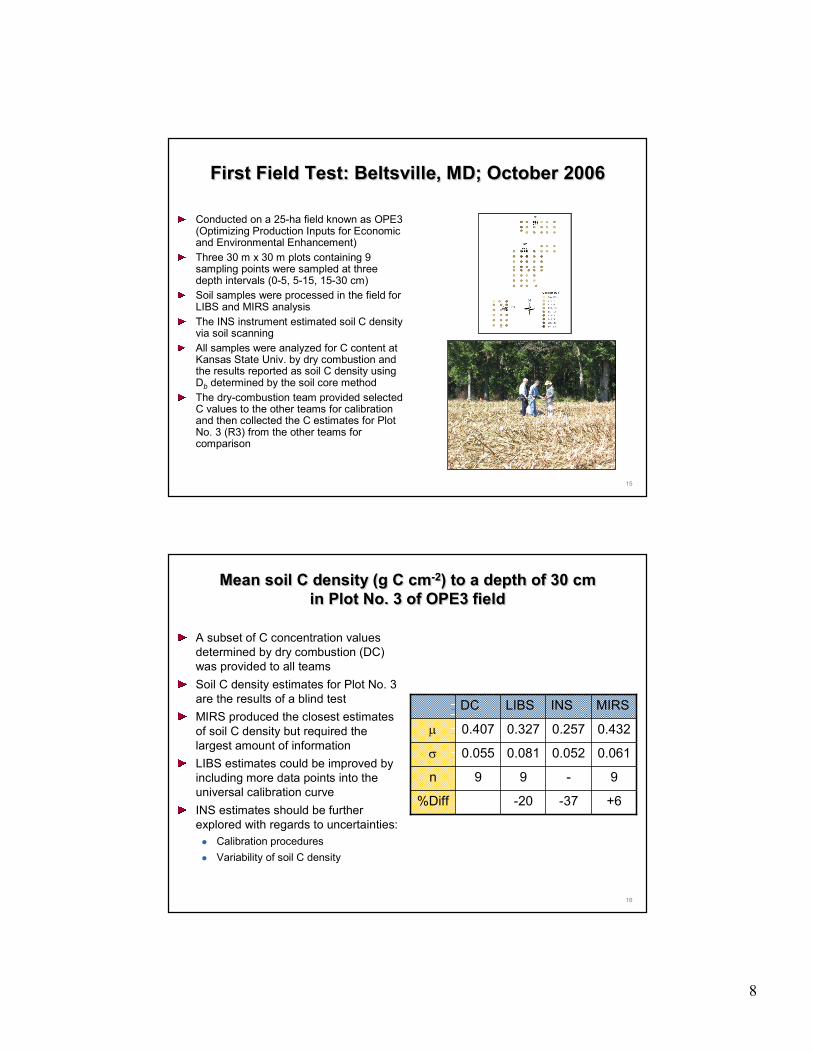
Mid-Infrared Reflectance Spectroscopy: MIRSMidMid--Infrared Reflectance Spectroscopy: MIRSInfrared Reflectance Spectroscopy: MIRS
Unlike LIBS and INS, MIRS probes
the bond identities of a sample's
molecules, offering the possibility
of directly distinguishing inorganic
from organic C, thus eliminating
the need for acid pretreatment to
remove inorganic C
Yet for the same reason,
quantifying soil C must be done
indirectly, by recourse of advanced
data-fitting routines that require
libraries of soil spectra vs. soil C
dataMcCarty et al. (2002) Soil Sci. Soc. Am. J. 66:640-646
8
15
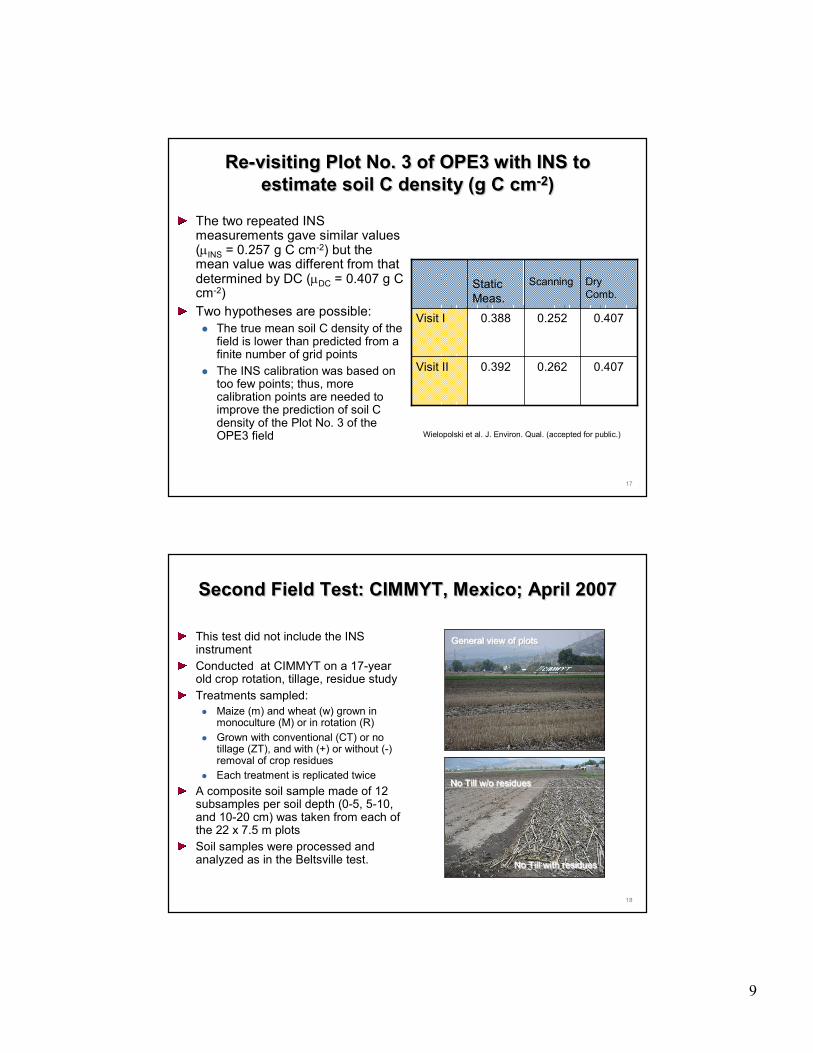
First Field Test: Beltsville, MD; October 2006First Field Test: Beltsville, MD; October 2006First Field Test: Beltsville, MD; October 2006
Conducted on a 25-ha field known as OPE3 (Optimizing Production Inputs for Economic and Environmental Enhancement)
Three 30 m x 30 m plots containing 9 sampling points were sampled at three depth intervals (0-5, 5-15, 15-30 cm)
Soil samples were processed in the field for LIBS and MIRS analysis
The INS instrument estimated soil C density via soil scanning
All samples were analyzed for C content at Kansas State Univ. by dry combustion and the results reported as soil C density using Db determined by the soil core method
The dry-combustion team provided selected C values to the other teams for calibration and then collected the C estimates for Plot No. 3 (R3) from the other teams for comparison
16
Mean soil C density (g C cm-2) to a depth of 30 cm
in Plot No. 3 of OPE3 field
Mean soil C density (g C cmMean soil C density (g C cm--22) to a depth of 30 cm ) to a depth of 30 cm
in Plot No. 3 of OPE3 fieldin Plot No. 3 of OPE3 field
A subset of C concentration values
determined by dry combustion (DC)
was provided to all teams
Soil C density estimates for Plot No. 3
are the results of a blind test
MIRS produced the closest estimates
of soil C density but required the
largest amount of information
LIBS estimates could be improved by
including more data points into the
universal calibration curve
INS estimates should be further
explored with regards to uncertainties:
� Calibration procedures
� Variability of soil C density
+6-37-20%Diff
9-99n
0.0610.0520.0810.055σ
0.4320.2570.3270.407µ
MIRSINSLIBSDC
9
17
Re-visiting Plot No. 3 of OPE3 with INS to
estimate soil C density (g C cm-2)
ReRe--visiting Plot No. 3 of OPE3 with INS to visiting Plot No. 3 of OPE3 with INS to
estimate soil C density (g C cmestimate soil C density (g C cm--22))
The two repeated INS measurements gave similar values (µINS = 0.257 g C cm
-2) but the mean value was different from that determined by DC (µDC = 0.407 g C cm-2)
Two hypotheses are possible:
� The true mean soil C density of the field is lower than predicted from a finite number of grid points
� The INS calibration was based on too few points; thus, more calibration points are needed to improve the prediction of soil C density of the Plot No. 3 of the OPE3 field
0.4070.2620.392Visit II
0.4070.2520.388Visit I
Dry
Comb.
ScanningStatic
Meas.
Wielopolski et al. J. Environ. Qual. (accepted for public.)
18
Second Field Test: CIMMYT, Mexico; April 2007Second Field Test: CIMMYT, Mexico; April 2007Second Field Test: CIMMYT, Mexico; April 2007
This test did not include the INS instrument
Conducted at CIMMYT on a 17-year old crop rotation, tillage, residue study
Treatments sampled:
� Maize (m) and wheat (w) grown in monoculture (M) or in rotation (R)
� Grown with conventional (CT) or no tillage (ZT), and with (+) or without (-) removal of crop residues
� Each treatment is replicated twice
A composite soil sample made of 12 subsamples per soil depth (0-5, 5-10, and 10-20 cm) was taken from each of the 22 x 7.5 m plots
Soil samples were processed and analyzed as in the Beltsville test.
General view of plotsGeneral view of plotsGeneral view of plots
No Till w/o residuesNo Till w/o residuesNo Till w/o residues
No Till with residuesNo Till with residuesNo Till with residues

10
19
Mean soil C density (kg C m-2) by treatment and
summary statistics in the CIMMYT experiment
Mean soil C density (kg C mMean soil C density (kg C m--22) by treatment and ) by treatment and
summary statistics in the CIMMYT experimentsummary statistics in the CIMMYT experiment
0.00
0.50
1.00
1.50
2.00
2.50
3.00
3.50
4.00
4.50
5.00
ZTMw+r
ZTMw-r
ZTMm+r
ZTMm-r
CTRw-m+r
CTRw-m-r
ZTRw-m+r
ZTRw-m-r
CTMw+r
CTMw-r
CTMm+r
CTMm-r
ZTRm-w+r
ZTRm-w-r
CTRm-w+r
CTRm-w-r
Soil C density (kg C m
-2)
DryComb
LIBS
MIRS
112112112n
0.6251.7001.500Range
1.1660.6000.814Min
1.7912.3002.315Max
0.1340.3930.301σ
1.4131.4401.306µ
MIRSLIBSDC
Although LIBS and MIRS followed the C density trends detected by DC method
Correlation between methods was low� LIBS vs. DC: R2 = 0.174
� MIRS vs. DC: R2 = 0.329
20
Further calibration of LIBS and re-estimation of
CIMMYT data
Further calibration of LIBS and reFurther calibration of LIBS and re--estimation of estimation of
CIMMYT dataCIMMYT data
Partial Least Squares method was
used to improve calibration curves
A calibration curve was developed
using 31 samples run 3 times each
(1 missing value)
Re-estimation of data points
improved significantly (see graph
on the right)
Software issues need to be
addressed by Australian
developers
New software (The Unscrambler),
is being tested
y = 1.003x
R2 = 0.919
0.5
1.0
1.5
2.0
2.5
0.5 1.0 1.5 2.0 2.5
LIBS
DC
11
21
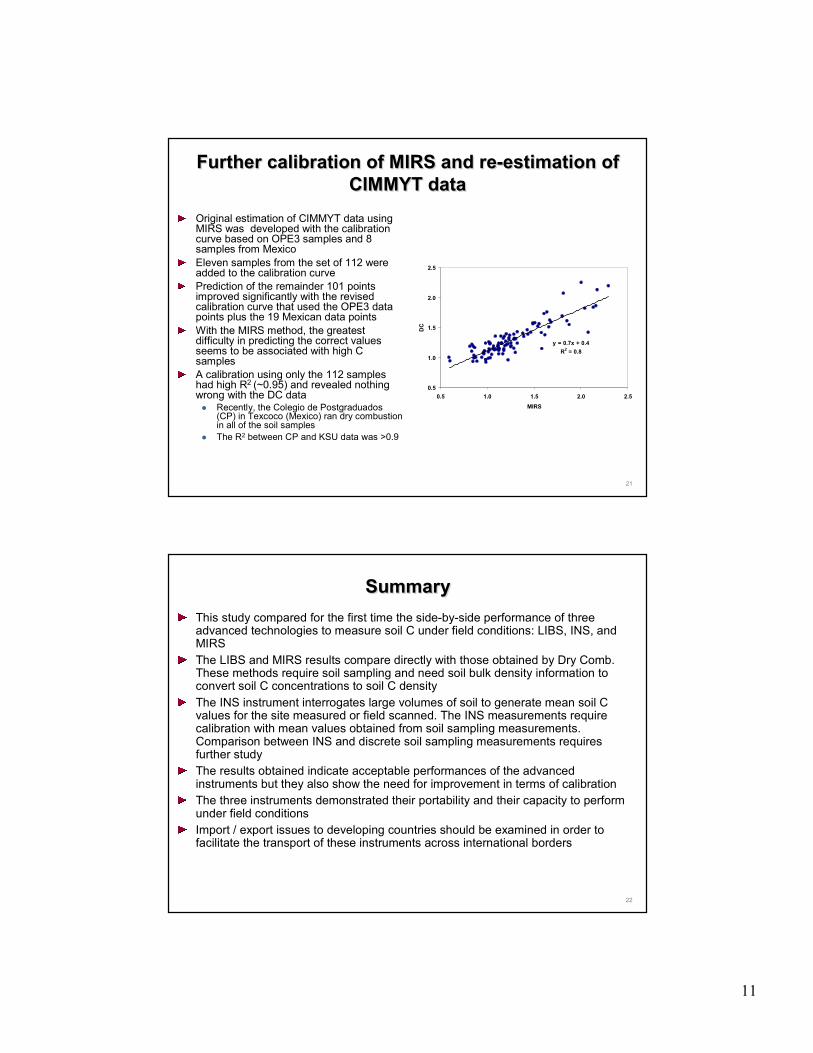
Further calibration of MIRS and re-estimation of
CIMMYT data
Further calibration of MIRS and reFurther calibration of MIRS and re--estimation of estimation of
CIMMYT dataCIMMYT data
Original estimation of CIMMYT data using MIRS was developed with the calibration curve based on OPE3 samples and 8 samples from Mexico
Eleven samples from the set of 112 were added to the calibration curve
Prediction of the remainder 101 points improved significantly with the revised calibration curve that used the OPE3 data points plus the 19 Mexican data points
With the MIRS method, the greatest difficulty in predicting the correct values seems to be associated with high C samples
A calibration using only the 112 samples had high R2 (~0.95) and revealed nothing wrong with the DC data� Recently, the Colegio de Postgraduados
(CP) in Texcoco (Mexico) ran dry combustion in all of the soil samples
� The R2 between CP and KSU data was >0.9
y = 0.7x + 0.4
R2 = 0.8
0.5
1.0
1.5
2.0
2.5
0.5 1.0 1.5 2.0 2.5
MIRS
DC
22
SummarySummarySummary
This study compared for the first time the side-by-side performance of three advanced technologies to measure soil C under field conditions: LIBS, INS, and MIRS
The LIBS and MIRS results compare directly with those obtained by Dry Comb. These methods require soil sampling and need soil bulk density information to convert soil C concentrations to soil C density
The INS instrument interrogates large volumes of soil to generate mean soil C values for the site measured or field scanned. The INS measurements require calibration with mean values obtained from soil sampling measurements. Comparison between INS and discrete soil sampling measurements requires further study
The results obtained indicate acceptable performances of the advanced instruments but they also show the need for improvement in terms of calibration
The three instruments demonstrated their portability and their capacity to perform under field conditions
Import / export issues to developing countries should be examined in order to facilitate the transport of these instruments across international borders