comparison of particle velocity measurement techniques in ... · entrainment and particle ......
TRANSCRIPT

Comparison of particle velocity measurementtechniques in a fluidized bed operating in thesquare-nosed slugging flow regimeTebianian, Sina; Dubrawski, Kristian; Ellis, Naoko; Cocco, Ray A.; Hays, Roy; Reddy Karri,S.b.; Leadbeater, Thomas; Parker, David; Chaouki, Jamal; Jafari, Rouzbeh; Garcia-trinanes,Pablo; Seville, Jonathan P.k.; Grace, John R.DOI:10.1016/j.powtec.2015.08.040
License:Creative Commons: Attribution-NonCommercial-NoDerivs (CC BY-NC-ND)
Document VersionPeer reviewed version
Citation for published version (Harvard):Tebianian, S, Dubrawski, K, Ellis, N, Cocco, RA, Hays, R, Reddy Karri, S, Leadbeater, TW, Parker, DJ, Chaouki,J, Jafari, R, Garcia-trinanes, P, Seville, JP & Grace, JR 2015, 'Comparison of particle velocity measurementtechniques in a fluidized bed operating in the square-nosed slugging flow regime' Powder Technology. DOI:10.1016/j.powtec.2015.08.040
Link to publication on Research at Birmingham portal
General rightsUnless a licence is specified above, all rights (including copyright and moral rights) in this document are retained by the authors and/or thecopyright holders. The express permission of the copyright holder must be obtained for any use of this material other than for purposespermitted by law.
•Users may freely distribute the URL that is used to identify this publication.•Users may download and/or print one copy of the publication from the University of Birmingham research portal for the purpose of privatestudy or non-commercial research.•User may use extracts from the document in line with the concept of ‘fair dealing’ under the Copyright, Designs and Patents Act 1988 (?)•Users may not further distribute the material nor use it for the purposes of commercial gain.
Where a licence is displayed above, please note the terms and conditions of the licence govern your use of this document.
When citing, please reference the published version.
Take down policyWhile the University of Birmingham exercises care and attention in making items available there are rare occasions when an item has beenuploaded in error or has been deemed to be commercially or otherwise sensitive.
If you believe that this is the case for this document, please contact [email protected] providing details and we will remove access tothe work immediately and investigate.
Download date: 09. Jul. 2018

�������� ����� ��
Comparison of particle velocity measurement techniques in a fluidized bedoperating in the square-nosed slugging flow regime
Sina Tebianian, Kristian Dubrawski, Naoko Ellis, Ray A. Cocco, RoyHays, S.B. Reddy Karri, Thomas W. Leadbeater, David J. Parker, JamalChaouki, Rouzbeh Jafari, Pablo Garcia-Trinanes, Jonathan P.K. Seville, JohnR. Grace
PII: S0032-5910(15)30037-1DOI: doi: 10.1016/j.powtec.2015.08.040Reference: PTEC 11208
To appear in: Powder Technology
Please cite this article as: Sina Tebianian, Kristian Dubrawski, Naoko Ellis, Ray A.Cocco, Roy Hays, S.B. Reddy Karri, Thomas W. Leadbeater, David J. Parker, Ja-mal Chaouki, Rouzbeh Jafari, Pablo Garcia-Trinanes, Jonathan P.K. Seville, JohnR. Grace, Comparison of particle velocity measurement techniques in a fluidized bedoperating in the square-nosed slugging flow regime, Powder Technology (2015), doi:10.1016/j.powtec.2015.08.040
This is a PDF file of an unedited manuscript that has been accepted for publication.As a service to our customers we are providing this early version of the manuscript.The manuscript will undergo copyediting, typesetting, and review of the resulting proofbefore it is published in its final form. Please note that during the production processerrors may be discovered which could affect the content, and all legal disclaimers thatapply to the journal pertain.
ACC
EPTE
D M
ANU
SCR
IPT
ACCEPTED MANUSCRIPT
1
Comparison of particle velocity measurement techniques in a
fluidized bed operating in the square-nosed slugging flow regime
Sina Tebianian
1,, Kristian Dubrawski
1, Naoko Ellis
1, Ray A. Cocco
2, Roy Hays
2, S.B.
Reddy Karri2, Thomas W. Leadbeater
3, David J. Parker
3, Jamal Chaouki
4, Rouzbeh
Jafari4, Pablo Garcia-Trinanes
5, Jonathan P. K. Seville
5 and John R. Grace
1
1 Department of Chemical and Biological Engineering, University of British Columbia,
Vancouver, Canada V6T 1Z3
2 Particulate Solid Research, Inc. Chicago, IL, 60632 United States
3 Positron Imaging Centre, University of Birmingham, Birmingham, B15 2TT United
Kingdom
4 Département de génie chimique, Ecole Polytechnique, Montréal, QC, Canada H3T 1J4
5 Department of Chemical and Process Engineering, University of Surrey, Guildford, Surrey
GU2 7XH, United Kingdom
Abstract
The novel “travelling fluidized bed” (TFB), operated under identical conditions, was deployed to
compare alternate experimental measurement techniques for the investigation of solid motion in
gas-fluidized beds operating in the square-nosed slugging regime. Measurements of particle
velocity obtained by radioactive particle tracking (RPT – non-invasive at the Ecole
Polytechnique de Montréal), positron emission particle tracking (PEPT – non-invasive at
University of Birmingham), optical fibre probes (invasive at UBC) and borescopic high speed
particle image velocimetry (invasive at PSRI) are compared for sand particles of mean diameter
292 μm. Significant differences between the time-average radial profiles of particle velocity are
observed in many cases. The results provide valuable insights on the merits and challenges of
advanced particle velocity measurement techniques.
Keywords: Fluidization; Square-nosed slugging; Particle velocity; Optical probes; Particle
tracking; Borescopy
Corresponding author, Email: [email protected], Phone: (604)8223121

ACC
EPTE
D M
ANU
SCR
IPT
ACCEPTED MANUSCRIPT
2
1. Introduction
Among the hydrodynamic features characterizing gas-fluidized beds, particle velocity represents
a key parameter which influences heat transfer, gas-solids mixing, erosion, attrition, solids
entrainment and particle flux [1].
Various techniques have been investigated for measuring particle velocity in gas-fluidized beds
using invasive and non-invasive methods [2]. Invasive techniques based on probing methods
represent a good candidate for monitoring plant performance and process optimization in
industrial units. However, the degree of flow interference from the probes must be quantified by
direct comparison with other techniques employed on the same equipment under identical
operating conditions [1,3]. Reliability of non-invasive particle tracking techniques for
representing the solid motion should also be investigated. Direct comparison with other
techniques represents the most suitable approach.
Except for our group’s recent work on voidage and particle velocity measurements [1,3], there
have been few attempts to systematically compare different measurement techniques in the past.
Werther et al. [4] compared solid velocity measurements obtained by a laser doppler anemometer
(LDA) and a single fibre reflection probe in the dilute zone of a circulating fluidized bed riser.
These experiments were performed under identical conditions with the same equipment.
However, the comparison could not be performed for high-solid-concentration flows since LDA
is effective only for dilute suspensions. Panday et al. [5] compared the time-average solid
velocity in a CFB obtained by a dual multi fibre optical probe with data obtained by high-speed
particle image velocimetry. Good agreement was observed between the results of these two
techniques, but the comparison was limited to one operating condition and few locations.
ACC
EPTE
D M
ANU
SCR
IPT
ACCEPTED MANUSCRIPT
3
In this study, four different experimental techniques radioactive particle tracking (RPT) a non-
invasive technique available at the Ecole Polytechnique de Montréal, Positron emission particle
tracking (PEPT), a non-invasive technique developed at the University of Birmingham, optical
fibre probes, an invasive technique deployed at the University of British Columbia (UBC), and
borescopic high-speed particle image velocimetry (PIV), an invasive measurement technique
owned and operated by Particulate Solid Research Inc. (PSRI) were employed to investigate
particle vertical motion in the travelling fluidized bed (TFB) facility. This equipment and its
auxiliaries were designed and built to assure identical operation in different locations where
alternative experimental measurement techniques are available.
In this paper, radial profiles of time-average particle velocity and the probability distribution
function of solid velocity obtained by all four techniques are directly compared. Particle velocity
results obtained from the TFB with fluid cracking catalyst (FCC) particles are presented
elsewhere [1]. In this paper, the TFB experiments were performed with a Geldart group B
particulate material, sand particles which differed greatly in properties from the group A particles
investigated separately [1]. This resulted in a different flow regime and different solid velocity
profiles. In particular, for the operating conditions of interest, the sand particles exhibited the
square-nosed slugging flow regime typical of Geldart B particles fluidized at superficial gas
velocities (Ug) greater than the minimum slugging velocity (Ums), satisfying the criteria for
reaching the slug flow regime [6]. This type of slug flow is regarded as a breakdown of proper
fluidization, where high pressures and high interstitial flow rates may break up the dense phase
regions releasing pockets of gas, resulting in unstable behaviour. This flow regime, mainly
observed in laboratory and pilot scale fluidized beds and of interest for few applications [7,8],
provides a useful platform for satisfying the main objective of the study, which is to compare
ACC
EPTE
D M
ANU
SCR
IPT
ACCEPTED MANUSCRIPT
4
experimental the features of a number of the most advanced particle velocity measurement
techniques under identical operating conditions. Analysis of the results, focusing on the physical
principles underlying each experimental technique and taking into account global flow structures
of the multiphase system, provides valuable insights into the reasons for the observed
discrepancies.
2. Experimental
The experimental apparatus consists of the easily-disassembled fluidization column, its support
structure, basic instrumentation and auxiliary components, all of which travelled with silica sand
(dsauter = 292 μm, ρp = 2640 kg/m3) particles (as well as FCC powder) to different research
laboratories for experimentation using different sophisticated instrumentation. The travelling
fluidized bed apparatus, shown schematically in Figure 1, features a transparent plexiglass
column of 0.96 m length × 0.133 m i.d. dense bed section, surmounted by a 1.36 m long × 0.190
m i.d. freeboard section. An internal cyclone with its dipleg terminating in the dense section
(0.70 m above the distributor) was employed to capture any entrained particles. Detailed
description of the apparatus, and its auxiliary components are given elsewhere [1,9]. Details of
the measurement techniques used to determine particle velocity optical fibre probes,
borescopic high-speed PIV, PEPT and RPT are given elsewhere [1]. Table 1 summarizes the
key features of each of these experimental techniques. The optical probe, borescope and RPT
solid tracer used in the previous study with FCC powder [1] were used again in this paper for
sand.

ACC
EPTE
D M
ANU
SCR
IPT
ACCEPTED MANUSCRIPT
5
Table 1 – Summary of particle velocity measurements techniques characteristics. In each
case, measurements were at 0.24, 0.40 and 0.56 m above the distributor and at superficial
gas velocities of 0.40, 0.50 and 0.60 m/s. The static bed height was 0.82 m for all cases.
Borescopic high-
speed PIV Optical fibre probe RPT PEPT
Sampling
rate 3000 frame/s 15.6 kHz (wall region)
62.5 (other positions) 100 Hz Variable up to
500 Hz
Sampling
period 10 s (10 × 1 s
intervals) 40 s (80 × 0.5 s intervals) 8 h (2 × 4 h) 3.5 h (3 × 1 h + 1
× 0.5 h)
The minimum fluidization velocity of the sand particles was 0.0796 m/s [9], and all the operating
superficial gas velocities investigated were less than Uc (0.72 m/s), the superficial gas velocity
corresponding to onset of the turbulent fluidization flow regime, obtained from pressure
fluctuation data [3,9], and above Ums (0.16 m/s), the minimum slugging velocity, calculated from
the correlation of Stewart and Davidson [6]. As visually observed from X-ray images [10],
typical of Geldart B particles [11] in smooth-walled columns of high H/D, the sand particles
exhibited square-nosed slugging behaviour, with dense plugs occupying the entire cross-section
of the bed moving upwards and solids raining from the bottom through the slug.
The tracer used for the PEPT study with sand differed from that used for FCC powder in order to
better match the physical properties of the bulk solids. Sand particles could not be activated
enough for the PEPT experiments. Therefore, aluminum oxide, in super-activated base form
(gamma-alumina) with properties given in Table 2, was used as the tracer particle. The size and
shape of this tracer particle matched well the bulk solid mean diameter, but its density was
higher. The RPT tracer particle differed in shape, diameter and density from the sand particles, as
shown in Table 2. Considering the sensitivities of the systems when the experiments were
performed, the tracer particles employed for both RPT and PEPT represented the best available

ACC
EPTE
D M
ANU
SCR
IPT
ACCEPTED MANUSCRIPT
6
substitutes for sand particles. For the RPT and PEPT experiments, a single tracer particle was
added to the system and its motion followed by the detectors.
Table 2 – Comparison of key physical properties of bed material and RPT and PEPT
tracer particles
Sand PEPT Tracer RPT Tracer
Composition 99.9% SiO2 γ-Al2O3 Pure scandium dipped in epoxy
dsauter (μm) 292 300 400
ρp (kg/m3) 2640 3000 2000
shape Irregular Irregular Nearly spherical
Ut (m/s) 0.73 0.91 2.35
Radioactivity (mCi) 0 1.34 (1
st day)
0.60 (2nd
day) 0.20
The sand particles were white, producing bright images without proper contrast in the borescopic
imaging, resulting in poor particle boundary distinction. Antipolar filters mounted on the
borescope window did not improve the image quality. The best solution in terms of the image
contrast was achieved by colouring all the particles using a dark red PSRI proprietary dye.
Application of this dye did not appreciably alter the particle diameter or density.
The same data analysis techniques as were described by Tebianian et al. [1] for the FCC
particles, were employed for the sand particles.
3. Results
3.1 Radial profiles of time-average particle velocity
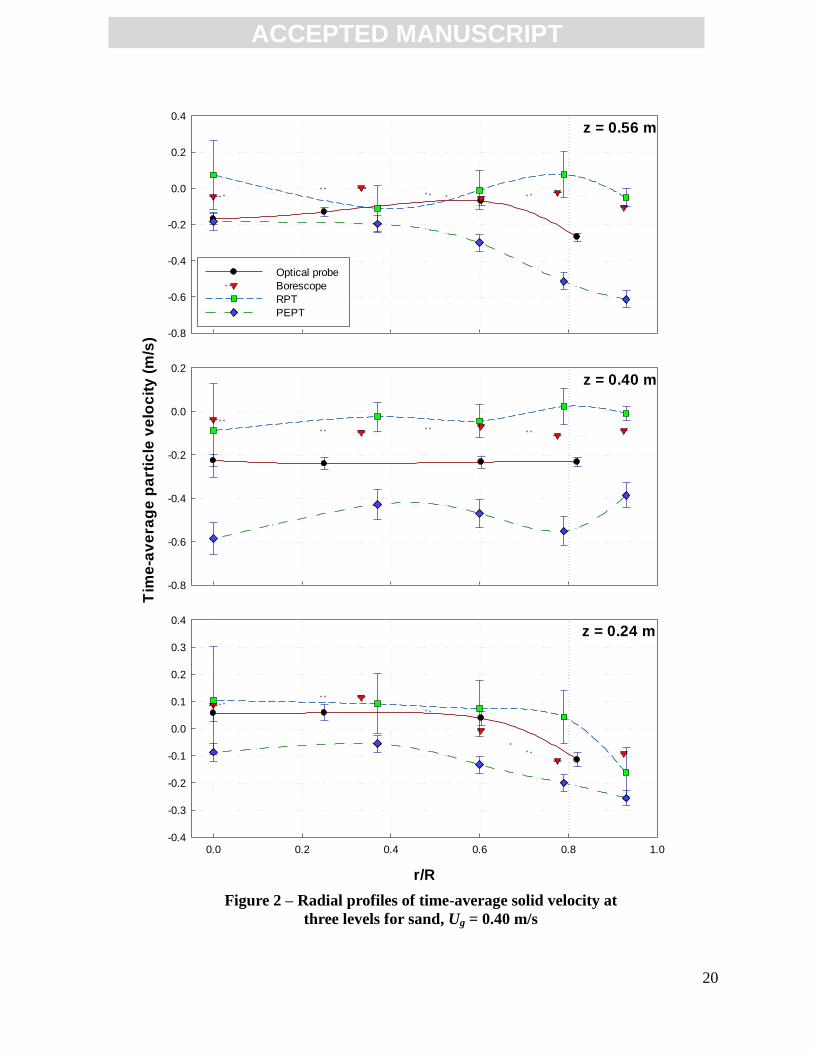
Radial profiles of time-average particle velocity obtained by all four experimental techniques are
reported in Figures 2 to 4. Axial symmetry is assumed in each of these figures. As for FCC
particles [1], the results from the borescope, PEPT and RPT results in these plots only include
velocity vectors associated with solid motion with a deviation angle with respect to the vertical
ACC
EPTE
D M
ANU
SCR
IPT
ACCEPTED MANUSCRIPT
7
direction of 30 degrees or less. As for FCC particles [1], considering each measurement level, the
time-averaged particle velocity profiles have been determined by considering the average
velocity obtained from the motion of all particles moving almost vertically in a specific radial
location, without distinguishing whether they were moving in the dense plug or the dilute region,
given that the simultaneous voidage data are not obtainable from particle tracking techniques.
The measurement locations of the optical probe and the borescope were points along a diameter
of the bed while for RPT and PEPT the measurements were obtained in five concentric areas into
which the cross-section was divided. The radial positions of PEPT and RPT particle velocity
profiles correspond to the centres of these concentric annuli. The error bars for the RPT,
borescope and optical fibre probe represent 90% confidence intervals, obtained by considering
the whole sample of velocity vectors in the time series data recorded during the measurement
period for each measurement location. For PEPT, since the location precision was available for
each instantaneous tracer position, the uncertainty in the solid velocity was determined using the
same error propagation formula as for FCC powder [1].
The solid raining associated with the square-nosed slug flow regime produced, mainly for the
upper sections of the column, an unusual trend, with pronounced negative time-average solid
velocity at all radial positions. However, although the measured velocities were mostly negative,
solids flux data [12] indicate that the upward and downward mass fluxes averaged over time and
the cross-section were in balance, as expected when entrainment fluxes are low.
For Ug = 0.40 m/s, the results obtained by RPT, the optical probe and borescopy are in good
qualitative and quantitative agreement at the lowest measurement level (z = 0.24 m), where these
three techniques provide downward solid velocity near the wall and upward velocities in the
centre of the bed, typical of bubbling fluidized beds (Figure 2). The poorest agreement between

ACC
EPTE
D M
ANU
SCR
IPT
ACCEPTED MANUSCRIPT
8
the results was observed at 0.40 m above the distributor plate where a quasi-flat radial profile
was observed for all four techniques due to the uniform upward motion of particles in the dense
plugs and downwards motion resulting from particles raining in the slugs, with PEPT providing
the most negative values, RPT and borecope results close to zero, and the optical probe results in
the middle. For all three measurement levels, the profiles obtained by RPT and borescopy are
quite close to each other, as shown in Figure 2.
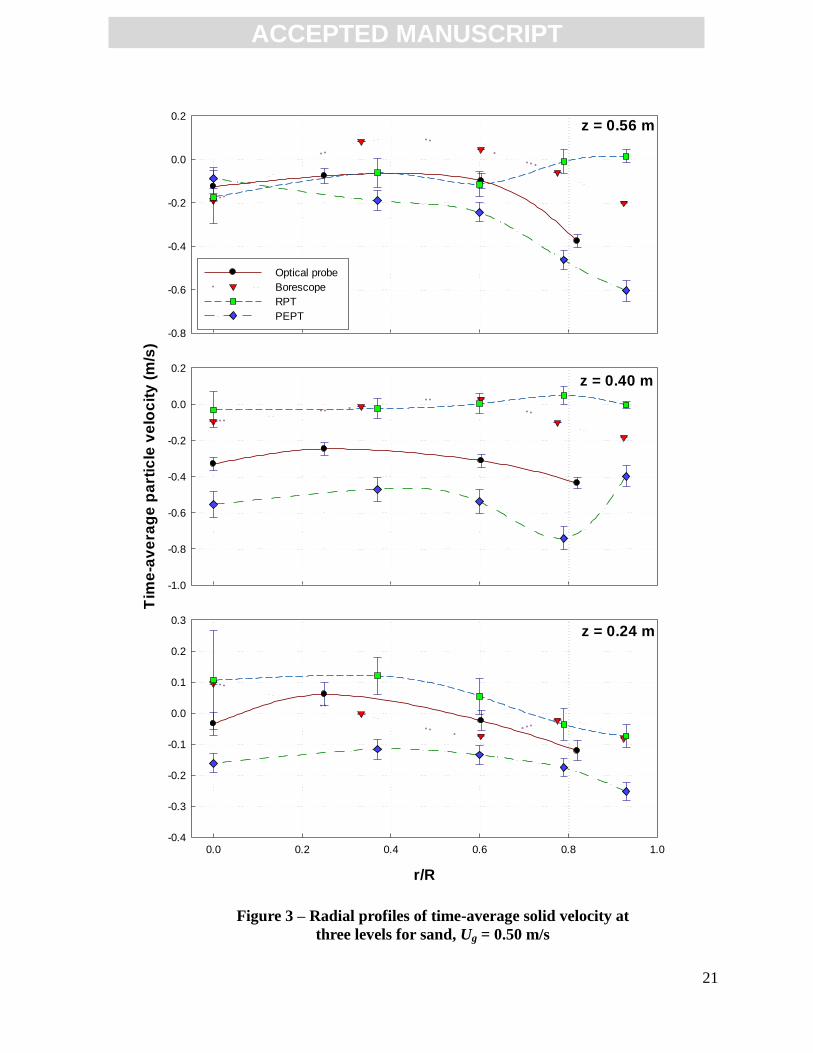
For Ug = 0.50 m/s, agreement among the results of the borescopy, RPT and optical probe at the
lowest measurement height is slightly worse than for Ug = 0.40 m/s, where some signs of
downward solid velocity in the core region are observable from the optical probe radial profile.
At the upper measurement section (z = 0.56 m), there is poor agreement among the results in the
wall region relative to the central region where the profiles obtained by all four techniques were
closer to each other. Similar behaviour to that shown in Figure 2 for z = 0.40 m was observed for
Ug = 0.50 m/s in Figure 3, where PEPT produced negative values of greater magnitude than the
other three techniques for most cases.
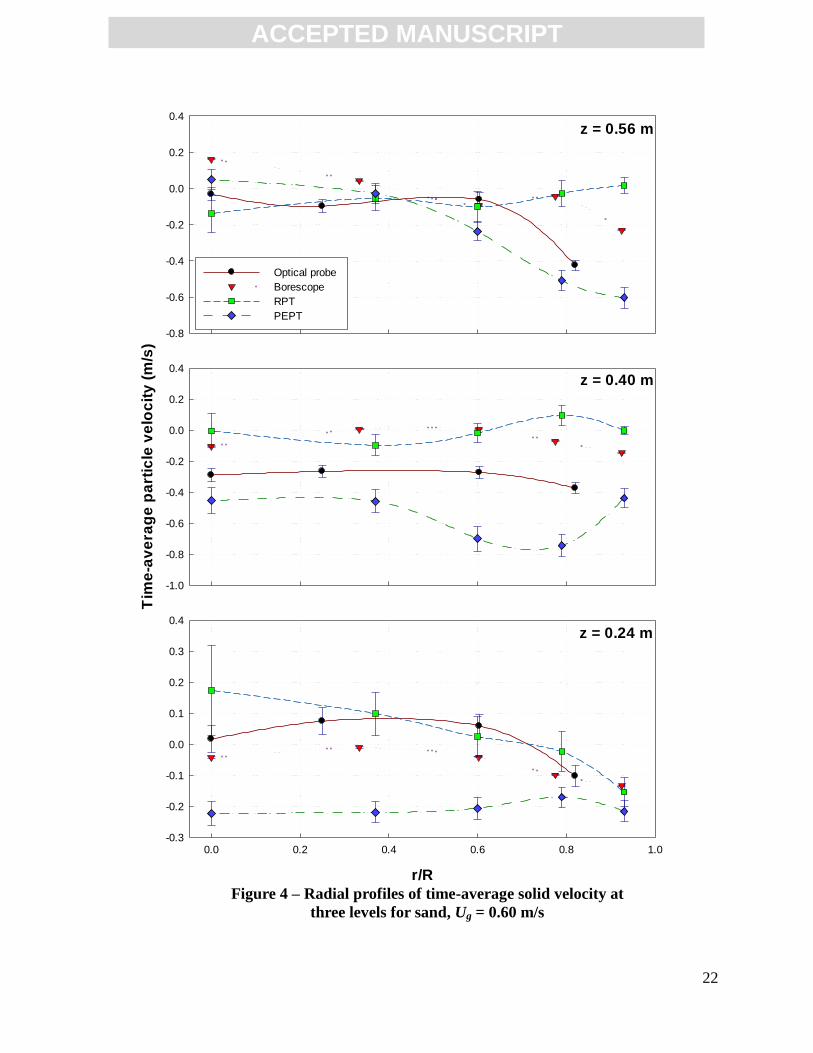
For Ug = 0.60 m/s (Figure 4), radial profiles of solid velocity at z = 0.24 and 0.40 m presented
similar behaviour as described for Ug = 0.50 m/s. At the upper measurement level, solid raining
in the central region of the bed was less prominent compared to the two lower superficial gas
velocities investigated.
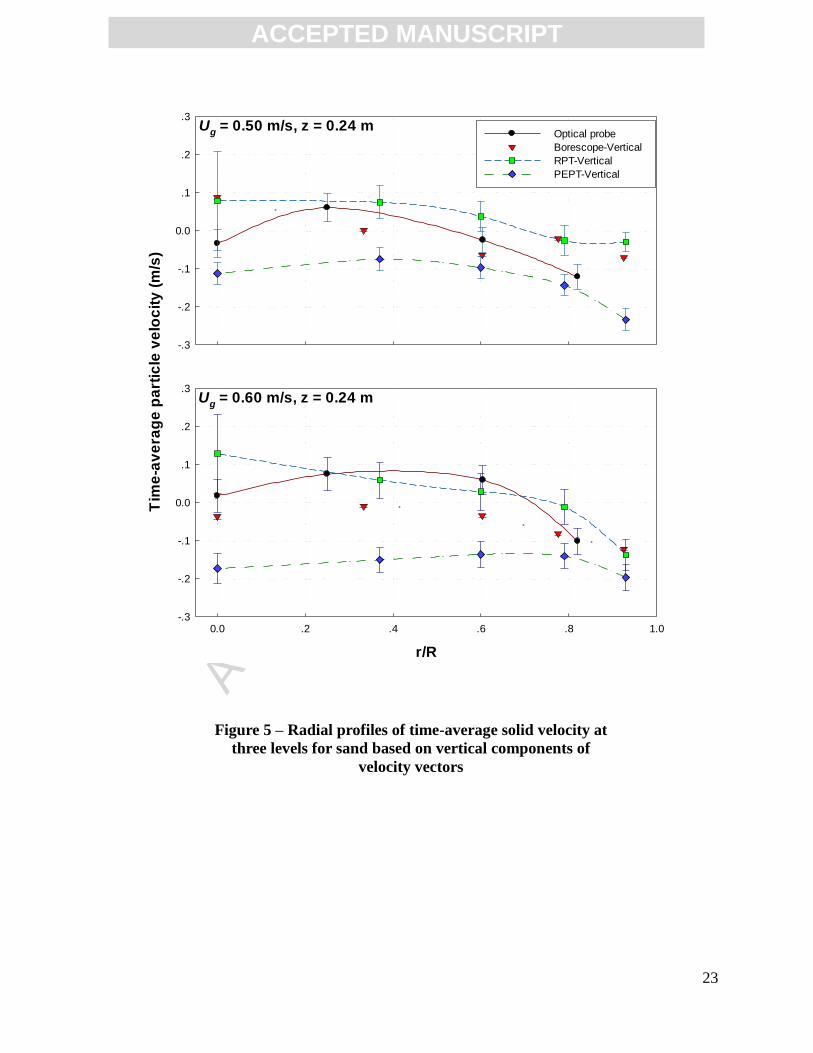
Since the optical fibre probe detects only the vertical motion of particles, the data were also
analyzed by averaging the vertical component of all velocity vectors of particles that cross the
measurement level for the borescope, PEPT and RPT (i.e. by removing the restriction of
diverging by ≤30˚ from the vertical). However, except for a few cases in Figure 5 (comparable to

ACC
EPTE
D M
ANU
SCR
IPT
ACCEPTED MANUSCRIPT
9
the Figures 2 and 3 results at the lowest measurement level), there was no significant change in
the results, suggesting that contributions from non-vertical particle velocities were minimal.
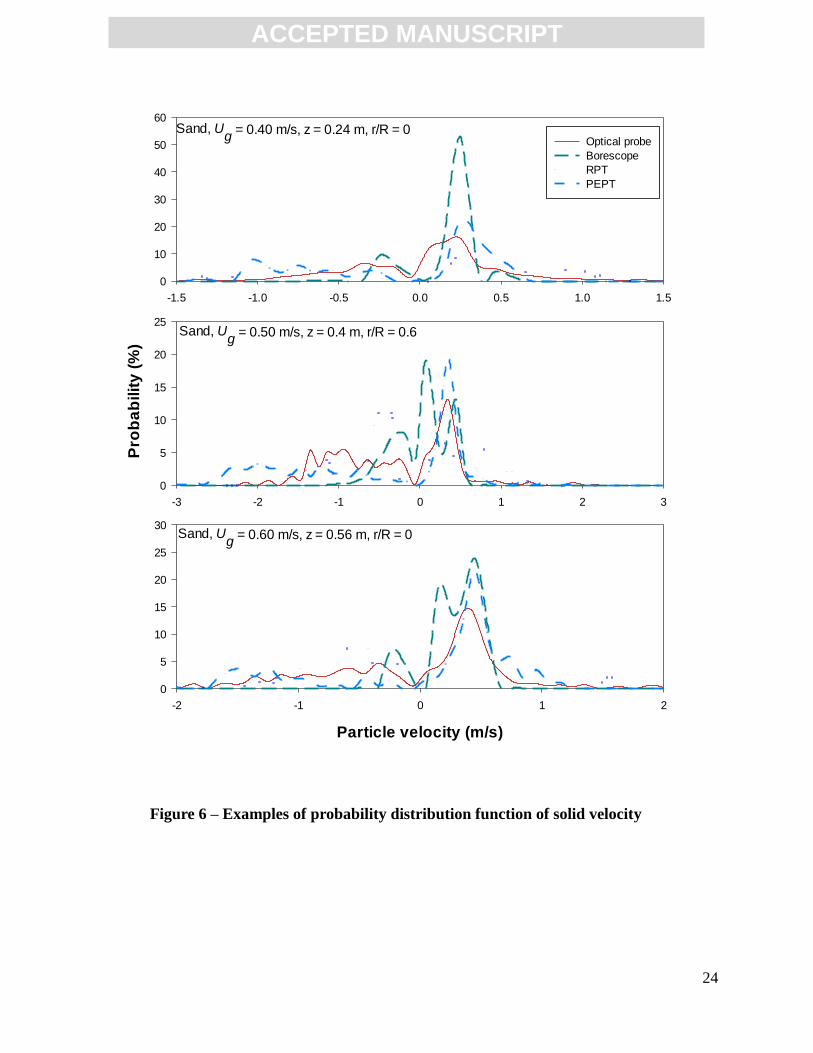
3.2 Probability distribution function of solid velocity
Probability distribution functions (PDF) of the instantaneous solid velocity measured at different
positions obtained by each measurement technique are plotted in Figure 6. All four techniques
detected particles raining inside the slugs, giving bimodal PDFs. The optical probe and PEPT
detected downward velocities of greater magnitude than RPT and the borescopic high-speed PIV,
especially in the middle section of the column (z = 0.40 m). PEPT, borescopy and optical probe
detected similar upward velocities, whereas RPT presented more wide-ranging data, i.e. more
prominent “tails”.
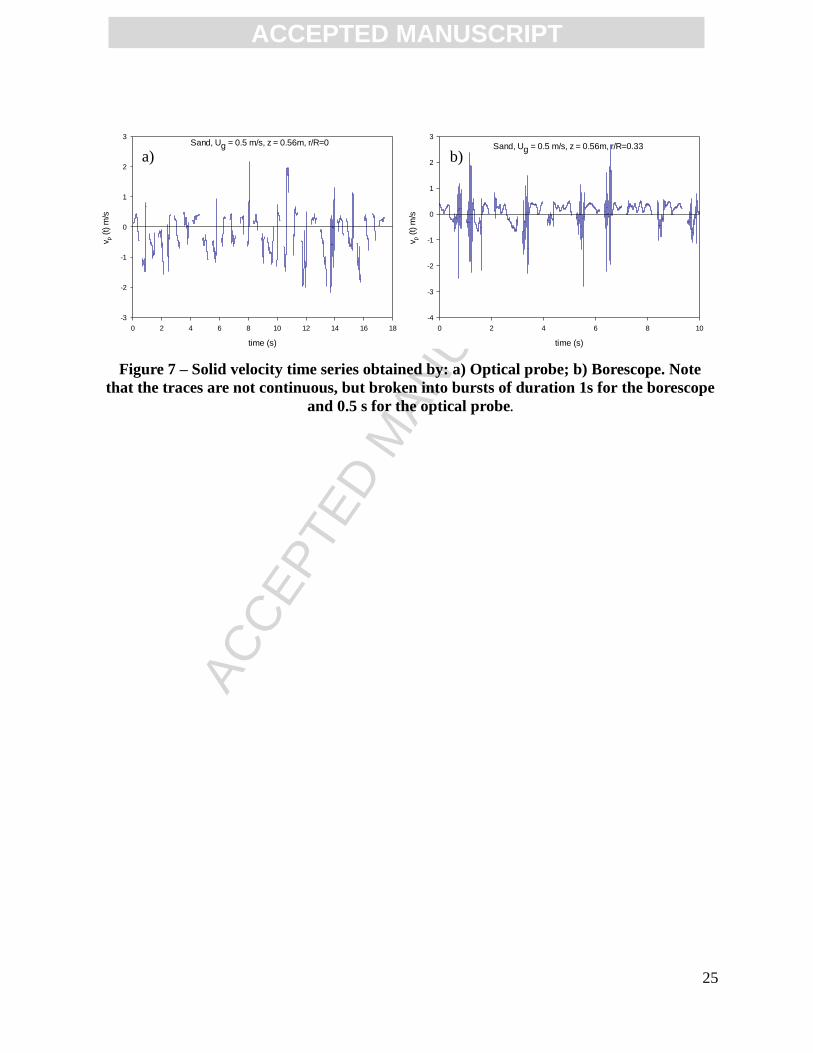
Figure 7 shows instantaneous movement of the particles in the central region of the bed captured
by the optical probe and the borescope. The sampling time consisted of ten periods of 1 s
duration for the borescope and 80 periods of only 0.5 s duration for the optical probe. Continuous
data capture giving a complete picture of the slugging phenomena and the raining phenomenon
was not possible in either case. Nevertheless, the plots still portray the intermittency of upward
velocities associated with the roof and floor regions of slugs interspersed with downward motion
caused by particles raining inside the voids. Note that the actual time intervals between
successive bursts (random for the optical probe and 5.67 s for the borescopy) are not represented
in the plots in order to facilitate the visualization of the slugging phenomena.
The presence of the slugs for sand particles was further confirmed by the pressure fluctuation
data in Figure 8, with the frequency confined to a narrow range of lower frequencies, more
characteristic of slug flow, than for the FCC particles. The differential pressure was measured at

ACC
EPTE
D M
ANU
SCR
IPT
ACCEPTED MANUSCRIPT
10
different 0.16 m-height sections of the column. The zero-magnitude pressure drop observed
regularly for sand particles corresponds to the passage of the square-nosed slugs covering the
entire section across which the differential pressure transducer was measured. It can be observed
that unlike FCC powder, for sand particles the pressure drop was zero for almost 1 s, indicating
that the slug heights exceeded the height of the measurement interval of the pressure transducers.
The pressure fluctuations data of FCC powder reported in Figure 8 confirm the presence of a
more chaotic flow regime typical of turbulent fluidization, as reported in the previous study [1].
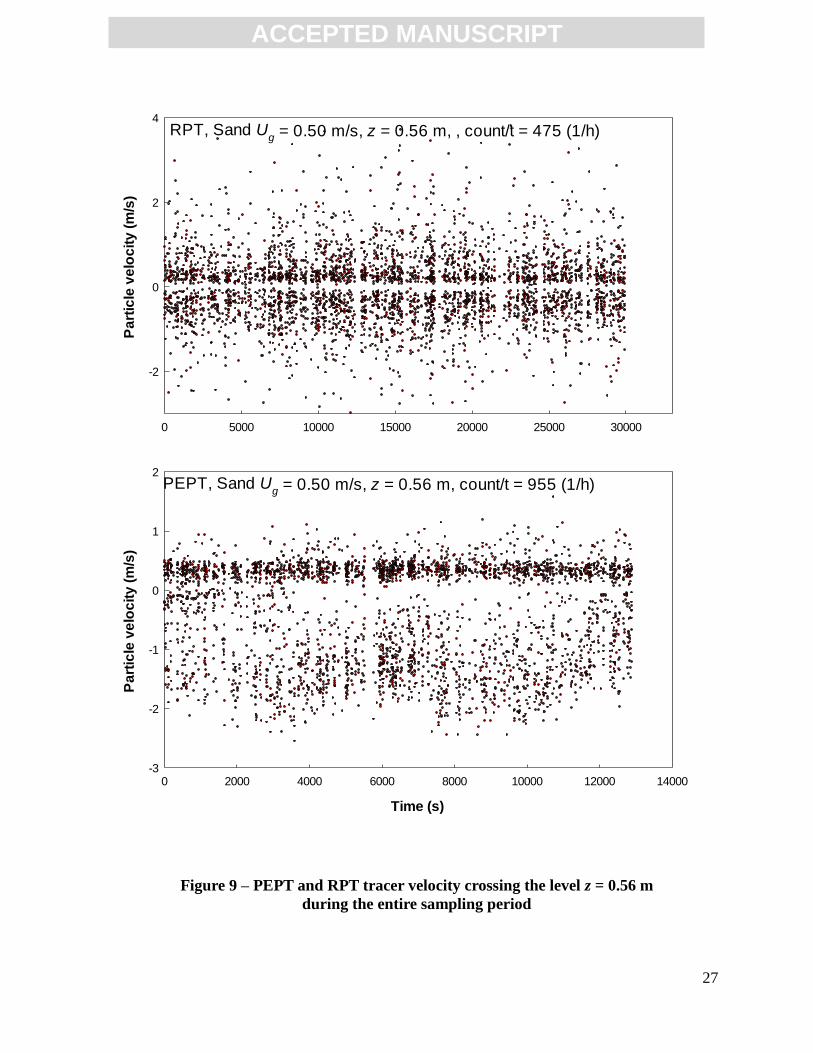
Figure 9 represents the instantaneous velocity of the tracer particle passing the level 0.56 m
above the distributor for both RPT and PEPT. PEPT shows a higher density of upward velocities,
with an almost constant value and more scattered downward velocities characterized by bigger
magnitudes. RPT, as indicated also in the PDFs, presents more symmetrical velocity vectors with
respect to zero and a smaller count frequency than PEPT.
4. Discussion
Consideration of the unique characteristics of each of the four measurement techniques, taking
into account the presence of square-nosed slugging flow regime, helps to explain the quantitative
differences in the data yielded by these four advanced methods. Factors which have contributed,
at least in part, to the differences include:
The optical probe and borescopic probe are both intrusive, and therefore interfere to some
extent with the flow field being measured. The degree of interference depends on factors
such as the probe shape, size and orientation, velocity and void fraction of the local gas-
solid flow [10].

ACC
EPTE
D M
ANU
SCR
IPT
ACCEPTED MANUSCRIPT
11
The PEPT and RPT methods rely on the tracer particle travelling in a manner that is
identical to the other particles in the bed. However, as seen in Table 2, the shape, diameter
and density of the tracer particle used for RPT differed substantially from those of the bulk
particles, with the tracer particle being considerably larger and less dense. This was the best
tracer particle available with RPT system when these experiments were performed.
However, note that the RPT tracer preparation method has been improved since then, with
the ability to produce tracer particles with properties closer to those of the bed material. For
the PEPT measurements, the tracer particle size and shape were well matched, but its
density was higher. These differences in particle properties may have affected the
measurements, e.g. influencing velocity fluctuations and acceleration, thereby preventing
the tracer from faithfully representing the behaviour of the bed material. Particle tracking
techniques require close matching of all three key particle physical properties (size, shape,
density) for accurate determination of particle motion by following the motion of a tracer
particle. Note also that an ideal radioactive tracer particle only represents a single average
size and density of the sand particles; whereas the optical probe and borescope measure the
velocities of all particles present in the bed. The terminal velocity (Ut) of the RPT and, to a
lesser extent, PEPT tracer particles in air was greater than that of the bulk sand particles.
However, the terminal velocity only accounts for a combination of tracer density and
diameter (slightly more important) given in the drag coefficient expression. As reported by
Rowe and Nienow [13], the density difference is considerably more important than the size
difference in determining solid segregation in gas-fluidized beds. The tracer particles
employed in the RPT and PEPT experiments differed significantly in terms of density
which can produce different circulation patterns, regardless of the degree of similarity of

ACC
EPTE
D M
ANU
SCR
IPT
ACCEPTED MANUSCRIPT
12
terminal velocities. In fact, as shown in Figure 9, the count frequency, defined as the
number of times the tracer particle was detected in a certain region over the entire sampling
time, obtained by PEPT was more than twice that of RPT. One reason leading to this could
have been less “mobilization” of the RPT tracer particle, possibly due to its greater
diameter. Sand particles may also have abraded the tracer particles modifying their shape
during the operation of the system.
The sampling rate of the RPT system was fixed and equal to 100 Hz, whereas the PEPT
detection rate was variable and could reach rates as high as 500 Hz. Suppose that the tracer
displacement during time-steps Δt1 and Δt2 are 1x and 2x , respectively, where Δt1 + Δt2
= Δt = 10 ms. RPT detects the mean tracer movement associated with Δt given by
1 2( ) /x x t , whereas PEPT can detect two velocity vectors Δx1 /Δt1 and Δx2 /Δt2.
Generally 1 2 1 1 2 2( ) / ( / , / )x x t mean x t x t . This difference may result in
different velocities evaluated by PEPT and RPT. Note that recent modifications in RPT
system mean that higher sampling frequencies could now be achieved.
As reported in Tables 1 and 2, tracer radioactivity, detection instrumentation and the
localization algorithm employed by the two particle tracking techniques (RPT and PEPT)
differed substantially, possibly resulting in different detected tracer velocities over the
sampling time as shown in Figure 9.
The average resolution of the PEPT system given by location uncertainty was between 2.7
and 4.3 mm for different runs, which was of the same order as the distance travelled by the
particle during one time step at low velocities (< 0.06 m/s). This may have resulted in poor

ACC
EPTE
D M
ANU
SCR
IPT
ACCEPTED MANUSCRIPT
13
accuracy when detecting low solid velocities. Instantaneous location uncertainty of RPT
data was not available, but RPT applied to systems similar to the TFB [14] presented a
spatial resolution of around 6 mm, which may lead to similar lack of accuracy.
The four methods have different dependencies on particle volume fraction, as discussed in
our previous work [1]. The PIV algorithm used to analyse the borescopic images requires a
sufficient number of particles in the measurement volume for accurate velocity
determination [15]. Detection of the movement of solids far from the borescope tip is
challenging due to loss of focus. The velocities measured by the optical probe can be
considered to be “volume-fraction-independent” since, in a given time interval, a particle
velocity is returned irrespective of the number of particles passing in the correct direction
during that interval. On the other hand, in the RPT and PEPT methods, over a certain time
period, the tracer particle spends more time in regions of high flux than in low-flux regions.
Therefore, RPT and PEPT are “flux-dependent”.
The Fast Fourier Transform (FFT) analysis performed on the time-series of pressure
fluctuations of the system suggests a dominant frequency in the range of [0.40-0.43 Hz] for
passage of slugs, as shown for example in Figure 8, corresponding to a time-interval
between arrival of slugs of 2.3 to 2.5 s, though with surrounding peaks of higher frequency.
The time interval between successive acquisitions (of duration of 1 s) was 5.67 s for the
borescopy, i.e. one measurement every 6.67 s. This may have led to some aliasing in the
borescope data, with successive measurements tending to favour one phase. The optical
probe data did not present the same aliasing issue since its data were captured randomly
over a longer sampling period. RPT and PEPT data samplings were continuous for long
periods of time, again preventing the aliasing problem.

ACC
EPTE
D M
ANU
SCR
IPT
ACCEPTED MANUSCRIPT
14
Raining of particles inside the slugs (extremely dilute region) played a prominent role in
the determining the values of time-average solid velocity (Figures 7 - 9). Negative particle
velocities in the interior of the column are detected more accurately when flux-independent
or concentration-independent measurement techniques encounter such flows. It can
observed that there is significantly better agreement between the results of RPT, borescopy
and optical probe in the lower region of the bed where the slugs have not yet formed and
upward movement of the particles in the middle of the bed is dominant (rising with bubble
noses and wakes). The profiles obtained by all four techniques are closer in the upper
region than in the middle section (z = 0.40 m). This could be due to the presence of the
cyclone dipleg terminating at z = 0.70 m that could have contributed to slug break-up and
reduced particle raining [9].
5. Conclusion
Radioactive particle tracking, positron emission particle tracking, optical fibre probe and
borescopic high-speed PIV were deployed to investigate local particle velocities in a novel
traveling fluidized bed operated under identical experimental conditions with sand particles (a
Geldart Group B powder). Significant quantitative differences were observed among the radial
profiles of time-average velocity provided by the four techniques, especially in the middle
section of the bed. Likely reasons for these differences include invasiveness of two of the
methods, differences between the physical properties of the tracer and sand particles, differences
in sensitivity to the concentration of particles in the measurement zone, spatial resolution of the
particle tracking systems and differences in measurement volumes. The analysis of the data gives
valuable insights into the features of each measurement technique.

ACC
EPTE
D M
ANU
SCR
IPT
ACCEPTED MANUSCRIPT
15
The scatter of the data, especially in the middle section, limits the usefulness of these results as
benchmarks for CFD validation. However, direct comparison of the results provides useful
information for the future deployment of these techniques in the investigation of particle
velocities in gas-fluidized beds.
Acknowledgement
The authors are grateful to the Natural Sciences and Engineering Research Council of Canada for
an RTI grant, which made it possible to build the equipment, and for Discovery grant funding
which assisted in supporting graduate students and in covering the costs of transportation,
insurance and equipment operation.
Nomenclature
D Column diameter, m
dsauter Sauter mean particle diameter, μm
H Static bed height, m
Uc superficial gas velocity at transition to turbulent fluidization flow regime, m/s
Ug superficial gas velocity, m/s
Ums minimum slugging velocity, m/s
Ut terminal settling velocity in air, m/s

ACC
EPTE
D M
ANU
SCR
IPT
ACCEPTED MANUSCRIPT
16
x tracer particle displacement, m
t time lag between successive tracer detections, ms
ρp solid density, kg/m3
z vertical coordinate measured from top of gas distrbutor, m
Acronyms
FCC fluid cracking catalyst
FFT Fast Fourier Transform
PDF probability distribution function
PEPT positron emission particle tracking
PIV particle image velocimetry
PSRI Particulate Solid Research Inc.
RPT radioactive particle tracking
TFB travelling fluidized bed
UBC University of British Columbia
References
[1] S. Tebianian, K. Dubrawski, N. Ellis, R.A. Cocco, R. Hays, S.B. Reddy Karri, T. W.
Leadbeater, D. J. Parker, J. Chaouki, R. Jafari, P. Garcia-Trinanes, J. K. Seville, J. R.
Grace, Investigation of particle velocity in FCC gas-fluidized beds based on different

ACC
EPTE
D M
ANU
SCR
IPT
ACCEPTED MANUSCRIPT
17
measurement techniques, Chem. Eng. Sci. 127 (2015) 310–322.
doi:10.1016/j.ces.2015.01.049.
[2] J. Werther, Measurement techniques in fluidized beds, Powder Technol. 102 (1999) 15–36.
doi:10.1016/S0032-5910(98)00202-2.
[3] K. Dubrawski, S. Tebianian, H. T. Bi, J. Chaouki, N. Ellis, R. Gerspacher, R. Jafari, A.
Kantzas, C. Lim, G. S. Patience, T. Pugsley, M. Z. Qi, J. X. Zhu, J. R. Grace, Traveling
column for comparison of invasive and non-invasive fluidization voidage measurement
techniques, Powder Technol. 235 (2013) 203–220. doi:10.1016/j.powtec.2012.10.031.
[4] J. Werther, B. Hage, C. Rudnick, A comparison of laser Doppler and single-fibre reflection
probes for the measurement of the velocity of solids in a gas-solid circulating fluidized bed,
Chem. Eng. Process. Process Intensif. 35 (1996) 381–391. doi:10.1016/0255-
2701(96)80018-3.
[5] R. Panday, L.J. Shadle, M. Shahnam, R. Cocco, A. Issangya, J.S. Spenik, et al., Challenge
problem: 1. Model validation of circulating fluidized beds, Powder Technol. 258 (2014)
370–391. doi:10.1016/j.powtec.2014.02.010.
[6] P.S.B. Stewart, J.F. Davidson, Slug flow in fluidised beds, Powder Technol. 1 (1967) 61–80.
doi:10.1016/0032-5910(67)80014-7.
[7] I.W. Noordergraaf, A. Van Dijk, C.M. Van Den Bleek, Fluidization and slugging in large-
particle systems, Powder Technol. 52 (1987) 59–68. doi:10.1016/0032-5910(87)80007-4.
[8] I.C. van Putten, M. van Sint Annaland, G. Weickert, Fluidization behavior in a circulating
slugging fluidized bed reactor. Part I: Residence time and residence time distribution of
polyethylene solids, Chem. Eng. Sci. 62 (2007) 2522–2534. doi:10.1016/j.ces.2005.10.025.
[9] S. Tebianian, Comparison of Alternative Advanced Experimental Techniques for
Measurement of Hydrodynamic Characteristics of Gas-Fluidized Beds, PhD disseration,
University of British Columbia (2015).
[10] S. Tebianian, N. Ellis, P. Lettieri, J.R. Grace, X-ray imaging for flow characterization and
investigation of invasive probe interference in travelling fluidized bed, Chem. Eng. Res.
Des. In press (2015). doi:10.1016/j.cherd.2015.08.006.
[11] W.-C. Yang, Bubbling Fluidized Beds, in: W-C. Yang (Ed.), Handbook of Fluidization and
Fluid-Particle Systems, Marcel Dekker, Inc., New York, (2003).
[12] S. Tebianian, K. Dubrawski, N. Ellis, R.A. Cocco, R. Hays, S.B. Reddy Karri, T. W.

ACC
EPTE
D M
ANU
SCR
IPT
ACCEPTED MANUSCRIPT
18
Leadbeater, D. J. Parker, J. Chaouki, R. Jafari, P. Garcia-Trinanes, J. K. Seville, J. R.
Grace, Comparison of alternative solids flux measuring techniques in fluidized beds,
Submitted for publication (2015).
[13] P.N. Rowe, A.W. Nienow, Particle mixing and segregation in gas fluidised beds. A review,
Powder Technol. 15 (1976) 141–147. doi:10.1016/0032-5910(76)80042-3.
[14] M. Rasouli, RPT Error Position, Personal Communication (2014).
[15] M. Raffel, C. Willert, J. Kompenhans, Particle Image Velocimetry, A Practical Guide
Springer, N. Y. (1998).
List of Figures
Figure 1 – Schematic diagram of travelling fluidized bed apparatus: a) assembled; b) exploded
modular view. Adapted from Tebianian et al. [1]
Figure 2 – Radial profiles of time-average solid velocity at three levels for sand, Ug = 0.40 m/s
Figure 3 – Radial profiles of time-average solid velocity at three levels for sand, Ug = 0.50 m/s
Figure 4 – Radial profiles of time-average solid velocity at three levels for sand, Ug = 0.60 m/s
Figure 5 – Radial profiles of time-average solid velocity at three levels for sand based on vertical
components of velocity vectors
Figure 6 – Examples of probability distribution function of solid velocity
Figure 7 – Solid velocity time series obtained by: a) Optical probe; b) Borescope. Note that the
traces are not continuous, but broken into bursts of duration 1s for the borescope and 0.5 s for the
optical probe.
Figure 8 – Pressure fluctuation data and FFT analysis for sand and FCC particles at Ug = 0.50
m/s between z = 0.24 and z = 0.56 m. Expanded bed height was 1.17 m.
Figure 9 – PEPT and RPT tracer velocity crossing the level z = 0.56 m during the entire sampling
period

ACC
EPTE
D M
ANU
SCR
IPT
ACCEPTED MANUSCRIPT
19
(a) (b)
Dense bed section
Freeboard
Internal cyclone
Figure 1 – Schematic diagram of travelling fluidized bed apparatus: a)
assembled; b) exploded modular view. Adapted from Tebianian et al. [1]
ACC
EPTE
D M
ANU
SCR
IPT
ACCEPTED MANUSCRIPT
20
z = 0.56 m
-0.8
-0.6
-0.4
-0.2
0.0
0.2
0.4
z = 0.24 m
r/R
0.0 0.2 0.4 0.6 0.8 1.0-0.4
-0.3
-0.2
-0.1
0.0
0.1
0.2
0.3
0.4
Optical probe
Borescope
RPT
PEPT
z = 0.40 m
Tim
e-a
ve
rag
e p
art
icle
ve
loc
ity
(m
/s)
-0.8
-0.6
-0.4
-0.2
0.0
0.2
Figure 2 – Radial profiles of time-average solid velocity at
three levels for sand, Ug = 0.40 m/s
ACC
EPTE
D M
ANU
SCR
IPT
ACCEPTED MANUSCRIPT
21
z = 0.56 m
-0.8
-0.6
-0.4
-0.2
0.0
0.2
z = 0.24 m
r/R
0.0 0.2 0.4 0.6 0.8 1.0-0.4
-0.3
-0.2
-0.1
0.0
0.1
0.2
0.3
Optical probe
Borescope
RPT
PEPT
z = 0.40 m
Tim
e-a
ve
rag
e p
art
icle
ve
loc
ity
(m
/s)
-1.0
-0.8
-0.6
-0.4
-0.2
0.0
0.2
Figure 3 – Radial profiles of time-average solid velocity at
three levels for sand, Ug = 0.50 m/s
ACC
EPTE
D M
ANU
SCR
IPT
ACCEPTED MANUSCRIPT
22
z = 0.56 m
-0.8
-0.6
-0.4
-0.2
0.0
0.2
0.4
z = 0.24 m
r/R
0.0 0.2 0.4 0.6 0.8 1.0-0.3
-0.2
-0.1
0.0
0.1
0.2
0.3
0.4
Optical probe
Borescope
RPT
PEPT
z = 0.40 m
Tim
e-a
ve
rag
e p
art
icle
ve
loc
ity
(m
/s)
-1.0
-0.8
-0.6
-0.4
-0.2
0.0
0.2
0.4
Figure 4 – Radial profiles of time-average solid velocity at
three levels for sand, Ug = 0.60 m/s
ACC
EPTE
D M
ANU
SCR
IPT
ACCEPTED MANUSCRIPT
23
Ug = 0.50 m/s, z = 0.24 m
Tim
e-a
ve
rag
e p
art
icle
ve
loc
ity
(m
/s)
-.3
-.2
-.1
0.0
.1
.2
.3
Ug = 0.60 m/s, z = 0.24 m
r/R
0.0 .2 .4 .6 .8 1.0-.3
-.2
-.1
0.0
.1
.2
.3
Optical probe
Borescope-Vertical
RPT-Vertical
PEPT-Vertical
Figure 5 – Radial profiles of time-average solid velocity at
three levels for sand based on vertical components of
velocity vectors
ACC
EPTE
D M
ANU
SCR
IPT
ACCEPTED MANUSCRIPT
24
Sand, Ug
= 0.40 m/s, z = 0.24 m, r/R = 0
-1.5 -1.0 -0.5 0.0 0.5 1.0 1.5
0
10
20
30
40
50
60
Sand, Ug
= 0.60 m/s, z = 0.56 m, r/R = 0
Particle velocity (m/s)
-2 -1 0 1 2
0
5
10
15
20
25
30
Optical probe
Borescope
RPT
PEPT
Sand, Ug
= 0.50 m/s, z = 0.4 m, r/R = 0.6
-3 -2 -1 0 1 2 3
Pro
ba
bilit
y (
%)
0
5
10
15
20
25
Figure 6 – Examples of probability distribution function of solid velocity
ACC
EPTE
D M
ANU
SCR
IPT
ACCEPTED MANUSCRIPT
25
Sand, Ug = 0.5 m/s, z = 0.56m, r/R=0
time (s)
0 2 4 6 8 10 12 14 16 18
v p (
t) m
/s
-3
-2
-1
0
1
2
3
Sand, Ug = 0.5 m/s, z = 0.56m, r/R=0.33
time (s)
0 2 4 6 8 10
v p (
t) m
/s
-4
-3
-2
-1
0
1
2
3
Figure 7 – Solid velocity time series obtained by: a) Optical probe; b) Borescope. Note
that the traces are not continuous, but broken into bursts of duration 1s for the borescope
and 0.5 s for the optical probe.
a) b)

ACC
EPTE
D M
ANU
SCR
IPT
ACCEPTED MANUSCRIPT
26
Sand
Time (s)
0 5 10 15 20
P (
kP
a)
-1
0
1
2
3
4
5
6
7
Ug = 0.50 m/s, Sand, z=0.40 m - 0.56 m
FCC
Time (s)
0 5 10 15 20
P (
kP
a)
-2
-1
0
1
2
3
4
5
Ug = 0.50 m/s, FCC, z=0.40 m - 0.56 m
0 2 4 6 8 10
0.0
0.1
0.2
0.3
0.4
0 10 20 30 40
0.00
0.02
0.04
0.06
0.08
0.10
0.12
0.14
0.16
0.18
Am
pli
tud
e (
kP
a2/H
z)
Frequency (Hz)
Am
pli
tud
e (
kP
a2/H
z)
Frequency (Hz)
FCC Sand
Figure 8 – Pressure fluctuation data and FFT analysis for sand and FCC particles
at Ug = 0.50 m/s between z = 0.24 and z = 0.56 m. Expanded bed height was 1.17
m.
Sand FCC
ACC
EPTE
D M
ANU
SCR
IPT
ACCEPTED MANUSCRIPT
27
PEPT, Sand Ug = 0.50 m/s, z = 0.56 m, count/t = 955 (1/h)
Time (s)
0 2000 4000 6000 8000 10000 12000 14000
Pa
rtic
le v
elo
cit
y (
m/s
)
-3
-2
-1
0
1
2
RPT, Sand Ug = 0.50 m/s, z = 0.56 m, , count/t = 475 (1/h)
0 5000 10000 15000 20000 25000 30000
Pa
rtic
le v
elo
cit
y (
m/s
)
-2
0
2
4
Figure 9 – PEPT and RPT tracer velocity crossing the level z = 0.56 m
during the entire sampling period

ACC
EPTE
D M
ANU
SCR
IPT
ACCEPTED MANUSCRIPT
28
Graphical abstract

ACC
EPTE
D M
ANU
SCR
IPT
ACCEPTED MANUSCRIPT
29
Highlights
Identical operating conditions were achieved in different locations
The hydrodynamics of the square-nosed slugging flow regime were investigated
Advanced particle velocity measurement techniques give different results
The reasons for the observed discrepancies among the results are explored