comparing public and private sector compensation in...
TRANSCRIPT

Labour MarketsStudies in
April 2013
fraserinstitute.org
Comparing Public and Private Sector Compensation in Canadaby Milagros Palaciosand Jason Clemens
Studies in Labour Markets
April 2013
Comparing Public and PrivateSector Compensation
in Canada
by Milagros Palacios and Jason Clemens

Fra ser Insti tute 4 www.fraserinstitute.org
4 Comparing Public and Private Sector Compensation in Canada 4 April 2013
Contents
Executive summary 4 5
Intro duc tion 4 8
I Comparing the Size of the Public and Private Sectors 4 9
II Past Research Com par ing Wages in the Pub lic and Pri vate Sec tors 4 13
III Comparing Wages in Canada’s Public and Private Sectors 4 18
IV Comparing Non-Wage Benefits in Canada’s Public and Private Sectors 4 26
IV Solutions to the Disparities in Compensation 4 31
Appen dix A: Empir i cal Meth od ol ogy 4 34
Appen dix B: Fed eral Pub lic Sec tor Com pen sa tion 4 37
Ref er ences 4 39
About the authors 4 43
Acknowledgments 4 44
Pub lish ing infor ma tion 4 45
About the Fraser Institute 4 48
Edi to rial Advi sory Board 4 49
Fra ser Insti tute 4 www.fraserinstitute.org
Comparing Public and Private Sector Compensation in Canada 4 April 2013 4 3
Executive summary
As fed eral and many pro vin cial gov ern ments con tinue to strug gle with both def i citsand find ing ways to con strain spend ing, there is height ened in ter est in how wages andnon-wage ben e fits (i.e., to tal com pen sa tion) in the pub lic sec tor com pare with those in the pri vate sec tor.
While a lack of non-wage ben e fits data mean that there is insuf fi cient infor ma -tion to make a defin i tive com par i son of total com pen sa tion between the pri vate andpub lic sec tors, the data that are avail able indi cate that the pub lic sec tor enjoys a clearwage pre mium. There are also strong indi ca tions that the pub lic sec tor has more gen -er ous non-wage ben e fits than the pri vate sec tor.
Wage com par i son
Af ter con trol ling for such fac tors as gen der, age, mar i tal sta tus, ed u ca tion, ten ure, sizeof firm, prov ince, city, type of job, and in dus try, pub lic sec tor work ers (in clud ing fed -eral, pro vin cial, and lo cal) en joyed a 12.0 per cent wage pre mium, on av er age, overtheir pri vate sec tor coun ter parts in Can ada. When union iza tion sta tus is fac tored inthe anal y sis, the wage pre mium for the pub lic sec tor de clines to 9.5 per cent.
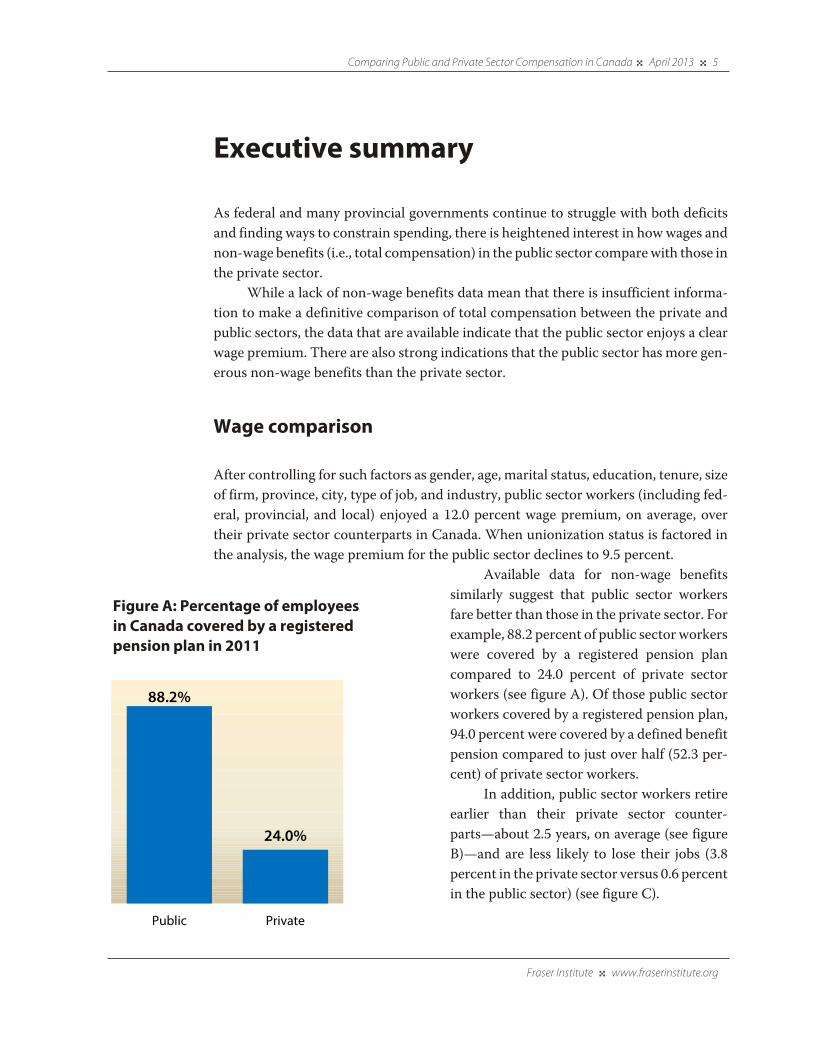
Avail able data for non-wage ben e fitssim i larly sug gest that pub lic sec tor work ersfare better than those in the pri vate sec tor. Forexam ple, 88.2 per cent of pub lic sec tor work ers were cov ered by a reg is tered pen sion plancom pared to 24.0 per cent of pri vate sec torwork ers (see fig ure A). Of those pub lic sec torwork ers cov ered by a reg is tered pen sion plan,94.0 per cent were cov ered by a defined ben e fitpen sion com pared to just over half (52.3 per -cent) of pri vate sec tor work ers.
In addi tion, pub lic sec tor work ers retireear lier than their pri vate sec tor coun ter -parts—about 2.5 years, on aver age (see fig ureB)—and are less likely to lose their jobs (3.8per cent in the pri vate sec tor ver sus 0.6 per cent in the pub lic sec tor) (see fig ure C).
Fra ser Insti tute 4 www.fraserinstitute.org
Comparing Public and Private Sector Compensation in Canada 4 April 2013 4 5
Fig ure A: Per cent age of employ eesin Canada cov ered by a reg is teredpen sion plan in 2011
88.2%
24.0%
0%
30%
60%
90%
Public Private

Over all, pub lic sec tor work ers in Can ada enjoy higher wages and prob a blyhigher non-wage ben e fits than com pa ra ble work ers in the pri vate sec tor.
To ensure that the over all pub lic sec tor com pen sa tion is fair to both tax pay ersand pub lic sec tor work ers, it is clear that a new insti tu tional frame work is needed.
(1) Col lect better data
The first step to achiev ing an im proved sys tem of wage and ben e fit set ting in the pub lic sec tor is to get a more ac cu rate as sess ment of the to tal pub lic sec tor com pen sa tionpre mium in Can ada. To de ter mine this, Sta tis tics Can ada must col lect data on wageand non-wage ben e fits for pub lic and pri vate sec tor work ers more reg u larly and more sys tem at i cally than it now does. The data cur rently avail able on these ben e fits are nei -ther de tailed nor com pre hen sive enough to al low for a reg u lar, em pir i cal anal y sis ofto tal com pen sa tion be tween the two sec tors.
(2) Recognize that total compensation is what mat ters, not wages alone
A sec ond step in the re form pro cess is to en sure that the com par i son in cludes to talcom pen sa tion, not just a nar rower com par i son of wages or spe cific ben e fits such aspen sions. The key is that the over all com pen sa tion lev els should be com pa ra ble be -tween the pub lic and pri vate sec tor work ers.
Fra ser Insti tute 4 www.fraserinstitute.org
6 4 Comparing Public and Private Sector Compensation in Canada 4 April 2013
Fig ure B: Average retirement age inCanada, 2007–2011
Fig ure C: Job loss as a per cent ageof employ ment in 2011
0.6%
3.8%
0.0%
0.5%
1.0%
1.5%
2.0%
2.5%
3.0%
3.5%
4.0%
4.5%
Public PrivatePublic Private
I retired at I retired at
60.0 62.4
(3) Ensure trans par ency and rou tine dis clo sure
In or der for this new frame work to func tion prop erly, in for ma tion re gard ing pub licsec tor wages and ben e fits must be trans par ent, ac ces si ble, and dis closed reg u larly.
(4) Insti tute a mech a nism for set ting com pen sa tion
A num ber of mech a nisms are avail able that would better en sure that over all pub licsec tor com pen sa tion is com pa ra ble with the pri vate sec tor.
a) For mal mech a nisms within gov ern mentOne ap proach is sim ply to leg is late a spe cific mech a nism within gov ern ment thatreg u larly cal cu lates and sets the to tal com pen sa tion lev els for pub lic sec tor po si -tions based on pri vate sec tor equiv a lents.
b) Wage boards: An arms-length ap proachAn other mech a nism is to cre ate a wage board, an in de pend ent gov ern men talbody that is re spon si ble for col lect ing, an a lyz ing, and set ting pub lic sec tor wagesand ben e fits based on pri vate sec tor equiv a lents.
c) Lump-sum pay mentsAn other, per haps more rad i cal re form is to em power pub lic sec tor un ions to be -come more in volved in the de ter mi na tion of the com po si tion of com pen sa tionfor their mem bers. This means pro vid ing un ions with a lump-sum amount ofmoney for the to tal com pen sa tion, and al low ing each of them to de ter mine themix of wages and ben e fits for their mem bers. Given the high union iza tion rates inthe pub lic sec tor, bring ing the un ions into the so lu tion would be ben e fi cial to thelon ger term sustainability of pub lic sec tor com pen sa tion.
Fra ser Insti tute 4 www.fraserinstitute.org
Comparing Public and Private Sector Compensation in Canada 4 April 2013 4 7

Intro duc tion
The fed eral and al most ev ery pro vin cial gov ern ment in Can ada have faced on go ingstrug gles to bal ance their bud gets. Fur ther, in re cent years, there have been a num berof large-scale, high-pro file re forms in some US states.1 For these and a va ri ety of otherrea sons, there is height ened in ter est in how wages and non-wage ben e fits (i.e., to talcom pen sa tion) in the pub lic sec tor in Can ada com pare with those in the pri vate sec tor.
This study rep li cates a pre vi ously used meth od ol ogy by which to com pare wagesin the two sec tors. It then com pares three avail able non-wage ben e fits more gen er allyin an attempt to quan tify com pen sa tion dif fer ences between the pub lic and pri vatesec tors in Can ada.
It is impor tant to empha size that wages are only one com po nent of over all com -pen sa tion. Var i ous non-wage ben e fits such as pen sions, health and den tal insur ance,dura tion of vaca tion, life and dis abil ity insur ance, etc. can increase over all com pen sa -tion lev els sig nif i cantly. In this study, we are unable to esti mate the over all total com -pen sa tion pre mium in the pub lic sec tor due to a lack of data on non-wage ben e fits.How ever, we do pres ent the data that are avail able on non-wage ben e fits to shed somelight on the dif fer ences in these ben e fits between the pub lic and pri vate sec tors.
The study is divided into a num ber of sec tions. The first pro vides some basic sta -tis tics on pub lic and pri vate sec tor employ ment in Can ada. The sec ond dis cusses dif -fer ences in the wage-set ting pro cess in the two sec tors. It also includes a sum mary ofpre vi ous research quan ti fy ing pub lic sec tor wage pre mi ums. The third sec tion pres -ents the results of cal cu la tions used to deter mine the wage pre mium in the pub lic sec -tor. (Appen dix A dis cusses the meth od ol ogy employed in mak ing these cal cu la tions.)The paper’s fourth sec tion com pares avail able non-wage ben e fits to ascer tain the like -li hood that there is a pre mium for non-wage ben e fits in the pub lic com pared to thepri vate sec tor. The final sec tion pro vides some gen eral rec om men da tions.
Fra ser Insti tute 4 www.fraserinstitute.org
8 4 Comparing Public and Private Sector Compensation in Canada 4 April 2013
1 For exam ple, in order to tackle the state def i cit, Wis con sin Gov er nor Scott Walker has enacted a broadrange of fairly sub stan tial changes in pub lic sec tor com pen sa tion in his state. For exam ple, he has reducedgen er ous pub lic sec tor pen sion and health care ben e fits, and restricted col lec tive bar gain ing in the pub licsec tor (Walker, 2011, March 1).

I Comparing the Size of the Public andPrivate Sectors
Be fore an a lyz ing and dis cuss ing com pen sa tion in the pub lic and pri vate sec tors, it isuse ful to com pare the two sec tors more gen er ally.
National over view: Com po si tion of total employ ment
Fig ure 1 il lus trates the com po si tion of to tal em ploy ment in 2011. In that year, some 3.6 mil lion Ca na dian work ers, rep re sent ing 20.6 per cent of to tal em ploy ment, were em -ployed in the pub lic sec tor, in clud ing fed eral, pro vin cial, and lo cal gov ern ment, gov -ern ment agen cies, crown cor po ra tions, and gov ern ment-funded es tab lish ments such
as schools (in clud ing uni ver si ties), andhos pi tals (Sta tis tics Can ada, 2012b).2
In con trast, there were 11.1 mil -lion work ers employed in the pri vatesec tor in 2011, rep re sent ing 64.0 per -cent of total employ ment (Sta tis ticsCan ada, 2012b). The remain ing 15.4per cent were self-employed (fig ure 1).
Fig ure 2 depicts the changes inpub lic sec tor, pri vate sec tor, andself-employ ment as a share of totalemploy ment from 1976 to 2011. Pub licsec tor employ ment has increased from2.3 mil lion work ers in 1976 to 3.6 mil -lion work ers in 2011, an increase of 54.5per cent (Sta tis tics Can ada, 2012b). As ashare of total employ ment, pub lic sec tor
Fra ser Insti tute 4 www.fraserinstitute.org
Comparing Public and Private Sector Compensation in Canada 4 April 2013 4 9
Fig ure 1: Com po nents of total employ ment, 2011
Public sector20.6%
Private sector64.0%
Self-employment
15.4%
Sources: Sta tis tics Can ada (2012b); cal cu la tions by the authors.
2 Unless oth er wise stated, data used in this sec tion come from Sta tis tics Can ada’s Labour Force Sur vey(LFS). This is a house hold sur vey of a sam ple of indi vid u als who are rep re sen ta tive of the civil ian pop u la -tion 15 years of age or older. Excluded from the sur vey’s cov er age are per sons liv ing on reserves and otherAborig i nal set tle ments in the prov inces, full-time mem bers of the Cana dian Forces, and the insti tu tion al -ized pop u la tion (for exam ple, inmates of penal insti tu tions and patients in hos pi tals or nurs ing homeswho have resided in the insti tu tion for more than six months). These groups together rep re sent an exclu -sion of approx i mately 2% of the pop u la tion aged 15 and over (Sta tis tics Can ada, 2012g: 19).
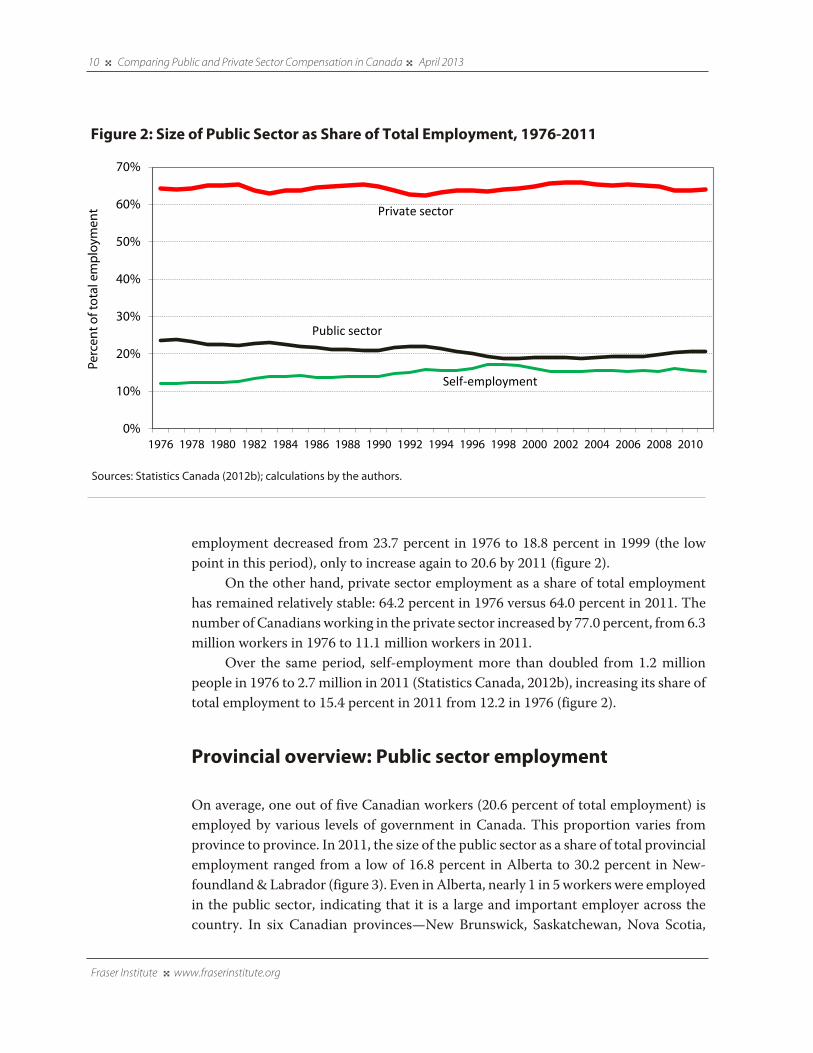
employ ment decreased from 23.7 per cent in 1976 to 18.8 per cent in 1999 (the lowpoint in this period), only to increase again to 20.6 by 2011 (fig ure 2).
On the other hand, pri vate sec tor employ ment as a share of total employ menthas remained rel a tively sta ble: 64.2 per cent in 1976 ver sus 64.0 per cent in 2011. Thenum ber of Cana di ans work ing in the pri vate sec tor increased by 77.0 per cent, from 6.3 mil lion work ers in 1976 to 11.1 mil lion work ers in 2011.
Over the same period, self-employ ment more than dou bled from 1.2 mil lionpeo ple in 1976 to 2.7 mil lion in 2011 (Sta tis tics Can ada, 2012b), increas ing its share oftotal employ ment to 15.4 per cent in 2011 from 12.2 in 1976 (fig ure 2).
Pro vin cial over view: Pub lic sec tor employ ment
On av er age, one out of five Ca na dian work ers (20.6 per cent of to tal em ploy ment) isem ployed by var i ous lev els of gov ern ment in Can ada. This pro por tion var ies fromprov ince to prov ince. In 2011, the size of the pub lic sec tor as a share of to tal pro vin cialem ploy ment ranged from a low of 16.8 per cent in Al berta to 30.2 per cent in New -found land & Lab ra dor (fig ure 3). Even in Al berta, nearly 1 in 5 work ers were em ployed in the pub lic sec tor, in di cat ing that it is a large and im por tant em ployer across thecoun try. In six Ca na dian prov inces—New Bruns wick, Sas katch e wan, Nova Sco tia,
Fra ser Insti tute 4 www.fraserinstitute.org
10 4 Comparing Public and Private Sector Compensation in Canada 4 April 2013
Figure 2: Size of Public Sector as Share of Total Employment, 1976-2011
Sources: Sta tis tics Can ada (2012b); cal cu la tions by the authors.
0%
10%
20%
30%
40%
50%
60%
70%
1976 1978 1980 1982 1984 1986 1988 1990 1992 1994 1996 1998 2000 2002 2004 2006 2008 2010
Perc
ent o
f tot
al e
mpl
oym
ent
Self-employment
Public sector
Private sector
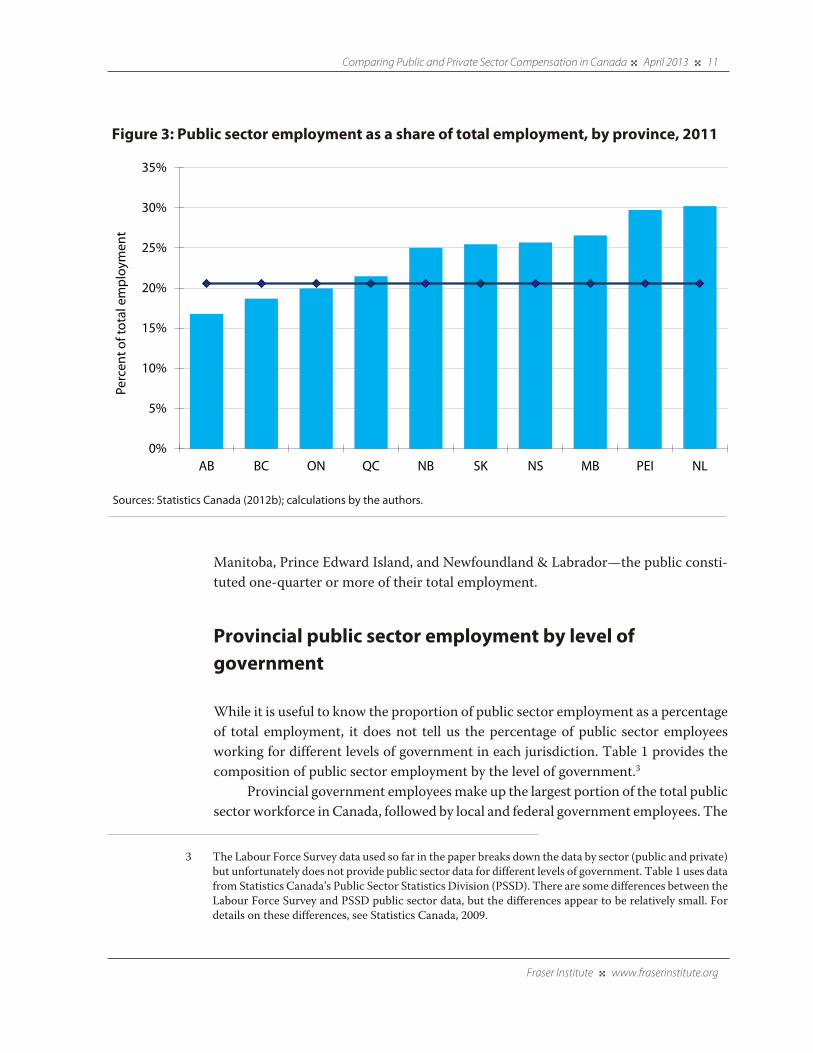
Man i toba, Prince Ed ward Is land, and New found land & Lab ra dor—the pub lic con sti -tuted one-quar ter or more of their to tal em ploy ment.
Pro vin cial pub lic sec tor employ ment by level ofgov ern ment
While it is use ful to know the pro por tion of pub lic sec tor em ploy ment as a per cent ageof to tal em ploy ment, it does not tell us the per cent age of pub lic sec tor em ploy eeswork ing for dif fer ent lev els of gov ern ment in each ju ris dic tion. Ta ble 1 pro vides thecom po si tion of pub lic sec tor em ploy ment by the level of gov ern ment.3
Pro vin cial gov ern ment employ ees make up the larg est por tion of the total pub licsec tor workforce in Can ada, fol lowed by local and fed eral gov ern ment employ ees. The
Fra ser Insti tute 4 www.fraserinstitute.org
Comparing Public and Private Sector Compensation in Canada 4 April 2013 4 11
Figure 3: Public sector employment as a share of total employment, by province, 2011
Sources: Sta tis tics Can ada (2012b); cal cu la tions by the authors.
3 The Labour Force Sur vey data used so far in the paper breaks down the data by sec tor (pub lic and pri vate)but unfor tu nately does not pro vide pub lic sec tor data for dif fer ent lev els of gov ern ment. Table 1 uses datafrom Sta tis tics Can ada’s Pub lic Sec tor Sta tis tics Divi sion (PSSD). There are some dif fer ences between theLabour Force Sur vey and PSSD pub lic sec tor data, but the dif fer ences appear to be rel a tively small. Fordetails on these dif fer ences, see Sta tis tics Can ada, 2009.
0%
5%
10%
15%
20%
25%
30%
35%
AB BC ON QC NB SK NS MB PEI NL
Perc
ent o
f tot
al e
mpl
oym
ent

pro por tion of total pub lic sec tor employ ees work ing for the pro vin cial gov ern ment in2011 ranged from 39.3 per cent in Ontario to 76.1 in New Bruns wick. In only threeprov inces (Ontario, Alberta, and Nova Sco tia,) was the pro por tion of pub lic sec torwork ers work ing for the pro vin cial gov ern ment below 50 per cent.
New Bruns wick had by far the low est per cent age of pub lic sec tor work ers work -ing for the local gov ern ment, 9.6 per cent. For the remain der of the prov inces, the pro -por tion of local gov ern ment work ers ranged from 20.4 per cent in New found land &Lab ra dor to 48.2 per cent in Alberta.
Fed eral pub lic sec tor employ ment did not exceed one quar ter of total employ -ment in any of the prov inces. Alberta had the low est pro por tion of pub lic sec tor work -ers work ing for the fed eral gov ern ment (7.0 per cent), fol lowed closely bySas katch e wan at 8.1 per cent. Prince Edward Island, at 24.7 per cent, had the high estpro por tion of pub lic sec tor work ers work ing for the fed eral gov ern ment.
Con clu sion
The pub lic sec tor is a vi tal part of the coun try’s la bour force and rep re sents roughlyone in five work ers across the coun try, al though that pro por tion var ies by prov ince.
Fra ser Insti tute 4 www.fraserinstitute.org
12 4 Comparing Public and Private Sector Compensation in Canada 4 April 2013
Table 1: Composition of Public Sector Employment, 2011
Federala Provincial Local
Canada 12.3 49.4 38.3
Newfoundland & Labrador 12.8 66.8 20.4
Prince Edward Island 24.7 53.9 21.4
Nova Scotia 16.3 49.9 33.8
New Brunswick 14.3 76.1 9.6
Quebec 10.0 56.9 33.1
Ontario 14.8 39.3 46.0
Manitoba 15.6 52.6 31.8
Saskatchewan 8.1 58.1 33.8
Alberta 7.0 44.7 48.2
British Columbia 11.0 55.5 33.6
Note: (a) Federal government data excludes reservists and full-time military personnel.Sources: Statistics Canada (2012a and 2012c); calculations by the authors.
II Past Research Com par ing Wages in the Pub lic and Pri vate Sec tors
A num ber of stud ies have em pir i cally quan ti fied wage dif fer ences be tween sim i lar oc -cu pa tions in the pri vate and pub lic sec tors.4 All of the stud ies sum ma rized in this sec -tion, ex cept for one, mea sure just the wage dif fer ences be tween the pub lic and pri vatesec tors; this is due to lack of suf fi cient data on non-wage ben e fits.
In a sem i nal study, Uni ver sity of Toronto Pro fes sor Morley Gunderson (1979)exam ined wage dif fer ences between the pub lic and pri vate sec tors using the 1971Cana dian Cen sus data. He found that after con trol ling for the effect of other deter mi -nants of pay, the pure wage pre mium in Can ada’s pub lic sec tor was 6.2 per cent formales and 8.6 per cent for females when com pared to the pri vate sec tor. Lower wagework ers received the larg est pre mium.
Shapiro and Stelcner (1989) extended Gunderson’s anal y sis using the 1981Cana dian Cen sus data. They found that after account ing for fac tors such as edu ca tion,train ing, and work expe ri ence, the pub lic sec tor wage pre mium was 4.2 per cent formales and 12.2 per cent for females in 1980.
In a com pre hen sive fol low-up study, Gunderson and two of his col leaguesexpanded his orig i nal anal y sis by using Cen sus data from 1971, 1981, 1991, and 1996,as well as data from the 1997 Labour Force Sur vey (Gunderson et al., 2000).5 Theyfound a pub lic sec tor wage pre mium of 7.6 per cent using the sur vey data and about 9.0 per cent using the 1996 Cen sus data. Over all, Gunderson et al. (2000) found that thefind ings from the two data sources were quite con sis tent, sug gest ing that, on aver age,those in the pub lic sec tor received a wage pre mium of roughly 9 per cent com pared tosim i lar work ers in the pri vate sec tor.6,7
Fra ser Insti tute 4 www.fraserinstitute.org
Comparing Public and Private Sector Compensation in Canada 4 April 2013 4 13
4 Note that male-female wage and union/non-union wage dif fer en tials are out side of the scope of this study. For a sur vey of this lit er a ture, see Ehrenberg and Schwarz (1986) and Bender (1998).
5 The major advan tage of the Labour Force Sur vey data is that pub lic sec tor work ers are explic itly iden ti -fied, whereas they are not in the Cen sus data.
6 While the 1996 Cen sus data are not strictly com pa ra ble to those from ear lier Cen suses due to dif fer entindus try clas si fi ca tions, the wage pre mium based on the 1996 data is higher than the wage pre mium fromear lier Cen suses (4.6 per cent in 1971, 5.5 per cent in 1981, and 8.5 per cent in 1991) sug gest ing that the pre -mium has poten tially increased over the past few decades.
7 The Gunderson et al. (2000) esti mate of the pub lic sec tor wage pre mium in 1971 is dif fer ent from thatfound in Gunderson (1979). This is likely due to slightly dif fer ent spec i fi ca tions used in the 2000 study to

Prescott and Wandschneider (1999) exam ined 1981 and 1990 sur vey data fromCan ada’s Sur vey of Con sumer Finances and found a higher pub lic sec tor wage pre -mium: 14.3 per cent for males and 25.0 per cent for females for 1990.8
Mueller (2000) exam ined dif fer ences in pub lic sec tor wage pre mi ums by thelevel of gov ern ment (fed eral, pro vin cial, and local) using Cana dian data from 1988 to1990 from the Labour Mar ket Activ ity Sur vey (LMAS) and found that the pre mi umswere the high est for fed eral gov ern ment employ ees fol lowed by those in local and pro -vin cial gov ern ments.9 Over all, the pub lic sec tor wage pre mium was 3.3 per cent formales and 11.3 per cent for females. At the fed eral level, the wage pre mium for pub licsec tor work ers was 7.8 per cent for males and 16.0 per cent for females com pared to thepri vate sec tor. At the pro vin cial level, the pub lic sec tor wage pre mium was neg a tive 3.5 per cent for males and pos i tive 10.9 per cent for females. Finally, at the local or munic i -pal level, the pub lic sec tor wage pre mium was 5.0 per cent for males and 6.6 per cent for females over the pri vate sec tor.
The Cana dian Fed er a tion of Inde pend ent Busi nesses (CFIB) used 2006 Cen susdata and found that it was not only wages that were higher in the pub lic sec tor, butnon-wage ben e fits, too. The CFIB found “that gov ern ment and pub lic sec toremployees are paid roughly 8 to 17 per cent more than sim i larly employed indi vid u -als in the pri vate sec tor” (Mallett and Wong, 2008:1). How ever, after “tak ing intoaccount sig nif i cantly higher paid [non-wage] ben e fits and shorter work weeks, thepub lic sec tor total com pen sa tion advan tage bal loons past 30 per cent” (Mallett andWong, 2008: 1).10
More recently, Tiagi (2010) exam ined the pub lic sec tor wage pre mium for maleand female work ers in Can ada using data from Sta tis tics Can ada’s Sep tem ber 2008Labour Force Sur vey. After con trol ling for indi vid ual dif fer ences among work ers in the two sec tors such as edu ca tion, mar i tal sta tus, occu pa tion, job ten ure, and union iza -tion, the author found that both male and female pub lic sec tor work ers receive a wagepre mium: 5.4 per cent for men and 19.8 per cent for women.
Fra ser Insti tute 4 www.fraserinstitute.org
14 4 Comparing Public and Private Sector Compensation in Canada 4 April 2013
make the wage pre mium esti mates com pa ra ble across the three Cen sus years (1971, 1981, and 1991). Forexam ple, Gunderson et al. (2000) includes those in the mil i tary, since those peo ple could not be excludedfrom the 1991 Cen sus, whereas peo ple in the mil i tary are excluded in Gunderson (1979).
8 The authors found that from 1981 to 1990, the pub lic sec tor wage pre mium for males slightly declinedwhile it increased for females.
9 Mueller (1998) obtained sim i lar results. The author found that pub lic sec tor wage pre mi ums tend to behigher for fed eral gov ern ment employ ees, females, and low-wage indi vid u als.
10 Mallett and Wong (2008) found that the pub lic sec tor wage pre mium was the high est at the fed eral level(17.3 per cent) fol lowed by the munic i pal level (11.2 per cent) and pro vin cial level (7.9 per cent). Once thenon-wage ben e fits are included, the pub lic sec tor com pen sa tion pre mium increases to 41.7 per cent forfed eral work ers, 35.9 per cent for munic i pal work ers, and 24.9 per cent for pro vin cial work ers.

There are a few stud ies that have sur veyed the research on pub lic sec tor wagepre mi ums in Can ada. For instance, Bender (1998) com pleted a com pre hen sive reviewof past research on pub lic sec tor wage pre mi ums for this coun try and a select group ofdevel oped and devel op ing nations. He found that the pub lic sec tor wage pre mium inCan ada was between 5 and 15 per cent.
In 2006, James Lahey, an asso ci ate sec re tary at the Trea sury Board Sec re tar iat,reviewed the lit er a ture on the pub lic sec tor wage pre mium in Can ada and con cludedthat the “fed eral pub lic ser vice wage pre mium was likely well under 10 per cent” (Trea -sure Board of Can ada Sec re tar iat, 2006: 73).
In an update of his study, in 2011 Lahey con cluded that the pub lic sec tor wagepre mium at the fed eral level was likely between 8 and 9 per cent (Lahey, 2011). Heargued that the total com pen sa tion pre mium for fed eral employ ees is roughly 15 to 20per cent once the non-wage ben e fits such as pen sions are added.
Sim i lar stud ies as those com pleted for Can ada have been under taken in othercoun tries with sim i lar results: the pub lic sec tor is con sis tently observed to main tainhigher wages and com pen sa tion than the pri vate sec tor.11 For exam ple, Biggs andRichwine (2011) found that fed eral work ers in the US enjoyed a wage pre mium of 14per cent. Crit i cally, how ever, the authors spent con sid er able time devel op ing esti mates for both non-wage ben e fits and job secu rity. They cal cu lated that the pre miumenjoyed by the pub lic sec tor increased to over 60 per cent after non-wage ben e fits andjob secu rity were included.
Explain ing the pub lic sec tor pre mium
There are a num ber of po ten tial causes for the com pen sa tion pre mium ob served in the pub lic sec tor. Im por tantly, two of them yield an un der stand ing of how such a pre -mium might be man aged and elim i nated over time.
The first con sid er ation is the type of con straint fac ing pri vate sec tor wages. Uni -ver sity of Toronto Pro fes sor Morley Gunderson noted in his sem i nal study, Earn ingsDif fer en tials between the Pub lic and Pri vate Sec tors (1979), that the main dif fer ence inthe pro cess of deter min ing wages between the pub lic and pri vate sec tors was the typeof con straint imposed on wages. In the pri vate sec tor, prof its are the main con strainton wages. That is, to max i mize prof its, busi nesses set wages in line with work ers’ pro -duc tiv ity so they can attract and retain the work ers they require to com pete.
Comparing Public and Private Sector Compensation in Canada 4 April 2013 4 15
Fra ser Insti tute 4 www.fraserinstitute.org
11 See, for exam ple, Smith (1976 and 1977), Venti (1985), Moore and Raisian (1991), Choudhury (1994), andRamoni-Perazzi and Bellante (2007). Greg ory and Borland (1999) and Ehrenberg and Schwarz (1986) pro -vide prom i nent reviews of this lit er a ture for the US and/or other coun tries.

In the pub lic sec tor, on the other hand, Gunderson observed that the “profit con -straint [on wages] is replaced by an ulti mate polit i cal con straint” (1979: 230). That is,wages are deter mined through polit i cal bar gain ing between gov ern ments andemployee groups (largely unions). Ulti mately, pub lic sec tor wages “depend on their[i.e., employee groups’] abil ity to com pete with other inter est groups over the allo ca -tion of the pub lic bud get” (1979: 230). In addi tion, Gunderson explained that the gov -ern ment’s abil ity to tax and bor row enables it to increase wages with out hav ing toreduce pub lic ser vices or sub sti tute labour for other inputs such as cap i tal. For theserea sons, Gunderson con cluded that the polit i cal con straint in the pub lic sec tor onwages may be less bind ing (effec tive) than the profit con straint in the pri vate sec tor.
The sec ond con sid er ation is the envi ron ment within which the pri vate and pub -lic sec tors exist. Most of the pub lic sec tor oper ates as a monop oly, which means thereis no threat from com pe ti tion. In other words, indi vid u als can not choose an alter na -tive pro vider for gov ern ment ser vices. This monop oly on ser vice pro vi sion means thatthe unions rep re sent ing pub lic sec tor work ers can demand a wage pre mium with outfear of com pet i tive pres sure or responses from other firms.
In con trast, the pri vate sec tor is rarely in a monop oly sit u a tion; when one doesexist, it is nor mally imposed by the state. Com pe ti tion and the threat of com pe ti tionchar ac ter ize non-monop oly mar kets. Firms, there fore, have to better bal ance the need to retain and attract work ers with their abil ity to com pete against other firms on price,qual ity, and cost.
These two envi ron ments have dis tinct effects on unions and the threat of strikes.Since the pub lic sector oper ates in a monop oly with no com pet i tors, work ers canthreaten and under take strikes that dis rupt ser vice in the pub lic sec tor with almost nofear of los ing cus tom ers or a con tract.
In stark con trast, in the pri vate sector, both employ ers and unions have anincen tive to set tle their dif fer ences quickly, espe cially under the increased com pet i -tive pres sures from glob al iza tion. Unions know that exces sive wage demands willmake the firm uncom pet i tive, which will likely result in reduced future employ ment. Employ ers, on the other hand, face trade-offs between wage demands and a loss ofmar ket share, prof it abil ity, etc., that result from a pro longed dis pute. Ulti mately, thepar ties usu ally come up with a com pro mise accept able to both.12
Fra ser Insti tute 4 www.fraserinstitute.org
16 4 Comparing Public and Private Sector Compensation in Canada 4 April 2013
12 For an addi tional dis cus sion about the dif fer ences between the pub lic and pri vate sec tor, see Christensen(1980), Kornai (1992), and Kornai et al. (2003).

Con clu sion
The pro cess of de ter min ing wages in the pub lic sec tor is mark edly dif fer ent from thatin the pri vate sec tor. The pub lic sec tor wage pro cess is largely de ter mined by po lit i calfac tors, while the pro cess in the pri vate sec tor is largely guided by mar ket forces andprofit con straints. These dif fer ences are am pli fied by the mo nop oly en vi ron ment inwhich the pub lic sec tor op er ates ver sus the com pet i tive en vi ron ment of the pri vatesec tor.
The Cana dian research exam in ing wage dif fer ences between the two sec torsover the past three decades con sis tently indi cates a pre mium for pub lic sec tor work -ers. The spe cific wage pre mi ums vary depend ing on the data source and tim ing. Whatis clear, how ever, is that a premium exists.
Fra ser Insti tute 4 www.fraserinstitute.org
Comparing Public and Private Sector Compensation in Canada 4 April 2013 4 17
III Comparing Wages in Canada’s Public and Private Sectors
Meth od ol ogy and data sources
This study uses data from the La bour Force Sur vey for April 2011 (Sta tis tics Can ada,2011). The sam ple for Can ada con sists of 52,849 in di vid u als for whom hourly wagerate, age, gen der, ed u ca tion, prov ince, mar i tal sta tus, type of work, and other char ac -ter is tics were avail able. The anal y sis cov ers paid gov ern ment and pri vate sec tor em -ploy ees only (per sons 15 years of age and over with em ploy ment in come); it ex cludesself-em ploy ment, un em ployed per sons, and per sons not in the la bour force. The La -bour Force Sur vey data breaks down the data by sec tor (pub lic and pri vate) but un for -tu nately does not pro vide data for dif fer ent lev els of gov ern ment. There fore, thepub lic sec tor wage pre mium in this sec tion per tains to lo cal, pro vin cial, and fed eralwork ers lo cated in Can ada.13 In Can ada, fed eral gov ern ment em ploy ees rep re sent12.3 per cent of the to tal pub lic sec tor. Pro vin cial pub lic sec tor work ers rep re sent 49.4per cent of the to tal pub lic sec tor with lo cal gov ern ment em ploy ees rep re sent ing there main ing 38.3 per cent (see ta ble 1).14
Descrip tive sta tis tics
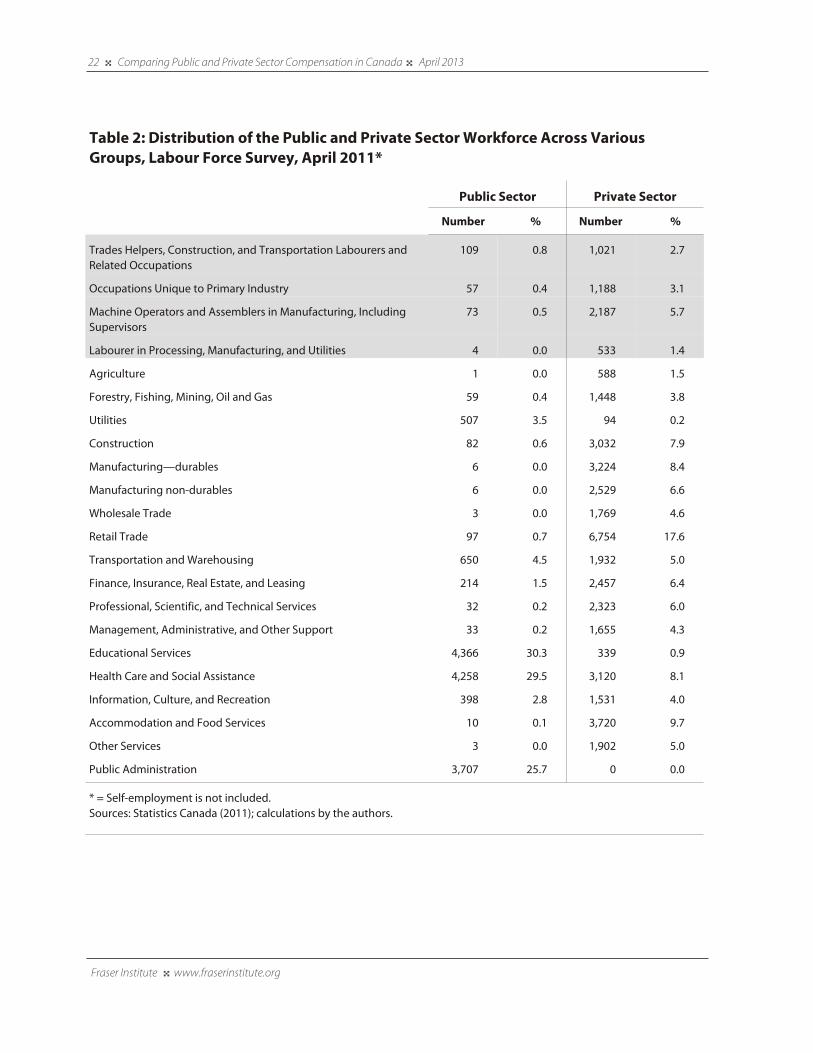
Ta ble 2 in di cates how pub lic and pri vate sec tor em ploy ment is dis trib uted across var i -ous la bour force char ac ter is tics such as gen der, age, and ed u ca tion. The dis tinc tion inthe ta ble be tween pub lic and pri vate in di cates whether the em ployer is a gov ern mentor a pri vate sec tor or ga ni za tion.
Approx i mately 27.3 per cent of the Cana dian paid workforce is in the pub lic sec -tor, while 72.7 per cent is in the pri vate sec tor. Unlike the sta tis tics pre sented in Sec -tion I, those shown here exclude self-employed peo ple.
Fra ser Insti tute 4 www.fraserinstitute.org
18 4 Comparing Public and Private Sector Compensation in Canada 4 April 2013
13 Spe cif i cally, the Labour Force Sur vey con sid ers the pub lic sec tor as those work ing for fed eral gen eralgovernment (i.e., fed eral pub lic admin is tra tion), fed eral gov ern ment busi ness enter prises, pro vin cial gen eral gov ern ment, pro vin cial health and social ser vice insti tu tions, uni ver si ties, col leges, voca tional and tradeinsti tu tions, pro vin cial gov ern ment busi ness enter prises, local gen eral gov ern ment, local school boards, and local gov ern ment busi ness enter prises. Those in the mil i tary armed forces are excluded from the sur vey.
14 Some pub lic sec tor employ ees do not reside or work in Can ada. These work ers account for a very smallper cent age (sta tis ti cally insig nif i cant) of pub lic sec tor work ers in the coun try.

Fra ser Insti tute 4 www.fraserinstitute.org
Comparing Public and Private Sector Compensation in Canada 4 April 2013 4 19
Table 2: Distribution of the Public and Private Sector Workforce Across Various Groups, Labour Force Survey, April 2011*
Public Sector Private Sector
Number % Number %
TOTAL 14,432 27.3 38,417 72.7
Male 5,225 36.2 20,693 53.9
Female 9,207 63.8 17,724 46.1
Age 15-19 124 0.9 3,016 7.9
Age 20-24 747 5.2 4,225 11.0
Age 25-29 1,215 8.4 4,211 11.0
Age 30-34 1,546 10.7 3,925 10.2
Age 35-39 1,604 11.1 3,962 10.3
Age 40-44 1,870 13.0 4,085 10.6
Age 45-49 2,210 15.3 4,573 11.9
Age 50-54 2,228 15.4 4,421 11.5
Age 55-59 1,743 12.1 3,258 8.5
Age 60-64 881 6.1 1,881 4.9
Age 65-69 208 1.4 611 1.6
Age 70 + 56 0.4 249 0.6
Married 8,170 56.6 17,487 45.5
Living in common-law 2,095 14.5 5,613 14.6
Widowed 181 1.3 414 1.1
Separated 449 3.1 1,066 2.8
Divorced 845 5.9 1,767 4.6
Single, never married 2,692 18.7 12,070 31.4
0 to 8 years education 77 0.5 872 2.3
Some secondary 482 3.3 4,824 12.6
Grade 11 to 13, graduate 1,820 12.6 9,199 23.9
Some post secondary 805 5.6 3,608 9.4
Post secondary certificate of diploma 5,646 39.1 14,038 36.5
University: bachelors degree 3,732 25.9 4,480 11.7
University: graduate degree 1,870 13.0 1,396 3.6

Fra ser Insti tute 4 www.fraserinstitute.org
20 4 Comparing Public and Private Sector Compensation in Canada 4 April 2013
Table 2: Distribution of the Public and Private Sector Workforce Across Various Groups, Labour Force Survey, April 2011*
Public Sector Private Sector
Number % Number %
Full-time (30+ hours) 11,953 82.8 30,471 79.3
Part-time (1 to 29 hours) 2,479 17.2 7,946 20.7
Tenure 1-5 months 592 4.1 4,174 10.9
Tenure 6-11 months 931 6.5 4,560 11.9
Tenure 1-5 years 3,791 26.3 13,796 35.9
Tenure 6-10 years 2,748 19.0 6,190 16.1
Tenure 11-20 years 6,370 44.1 9,697 25.2
Permanent 12,028 83.3 34,013 88.5
Not permanent, seasonal 154 1.1 1,058 2.8
Not permanent, Temporary, term or contract(incl temp. help agency)
1,536 10.6 1,889 4.9
Not permanent, Casual or other 714 4.9 1,457 3.8
Union member 10,407 72.1 6,525 17.0
Not member, covered by collective agreement 513 3.6 553 1.4
Not member or covered 3,512 24.3 31,339 81.6
Establishment, less than 20 employees 2,673 18.5 15,605 40.6
Establishment, 20-99 employees 4,779 33.1 13,071 34.0
Establishment, 100-500 employees 3,527 24.4 7,090 18.5
Establishment, more than 500 3,453 23.9 2,651 6.9
Newfoundland 598 4.1 1,122 2.9
Prince Edward Island 485 3.4 849 2.2
Nova Scotia 805 5.6 1,776 4.6
New Brunswick 706 4.9 1,738 4.5
Quebec 2,475 17.1 6,561 17.1
Ontario 3,965 27.5 11,293 29.4
Manitoba 1,512 10.5 3,374 8.8
Saskatchewan 1,321 9.2 2,658 6.9
Alberta 1,169 8.1 4,668 12.2
British Columbia 1,396 9.7 4,378 11.4

Fra ser Insti tute 4 www.fraserinstitute.org
Comparing Public and Private Sector Compensation in Canada 4 April 2013 4 21
Table 2: Distribution of the Public and Private Sector Workforce Across Various Groups, Labour Force Survey, April 2011*
Public Sector Private Sector
Number % Number %
Montreal 503 3.5 1,743 4.5
Toronto 564 3.9 2,241 5.8
Vancouver 484 3.4 1,732 4.5
Other CMA or Non-CMA 12,881 89.3 32,701 85.1
Senior Management Occupations 76 0.5 146 0.4
Other Management Occupations 753 5.2 2,305 6.0
Professional Occupations in Business and Finance 338 2.3 900 2.3
Financial, Secretarial, and Administrative Occupations 912 6.3 1,737 4.5
Clerical Occupations, including Supervisors 1,797 12.5 4,092 10.7
Natural and Applied Sciences and Related Occupations 916 6.3 2,441 6.4
Professional Occupations in Health, Nurse Supervisors, andRegistered Nurses
1,285 8.9 312 0.8
Technical, Assisting and Related Occupations in Health 1,206 8.4 1,141 3.0
Occupations in Social Science, Government Service and Religion 1,065 7.4 1,477 3.8
Teachers and Professors 2,536 17.6 163 0.4
Occupations in Art, Culture, Recreation and Sport 348 2.4 712 1.9
Wholesale, Technical, Insurance, Real Estate Sales Specialists, andRetail, Wholesale, and Grain Buyers
11 0.1 1,257 3.3
Retail Salespersons, Sales Clerks, Cashiers, including Retail Trade Supervisors
108 0.7 3,874 10.1
Chefs and Cooks, and Occupations in Food and Beverage Service,including Supervisors
90 0.6 1,960 5.1
Occupation in Protective Services 642 4.4 309 0.8
Childcare and Home Support Workers 522 3.6 308 0.8
Sales and Service Occupations n.e.c., Including Occ. in Travel andAccommodation, Attendants in Recreation and Sport as well asSupervisors
789 5.5 4,202 10.9
Contractors and Supervisors in Trades and Transportation 98 0.7 472 1.2
Construction Trades 54 0.4 1,037 2.7
Other Trades Occupations 314 2.2 2,855 7.4
Transport and Equipment Operators 329 2.3 1,788 4.7
Fra ser Insti tute 4 www.fraserinstitute.org
22 4 Comparing Public and Private Sector Compensation in Canada 4 April 2013
Table 2: Distribution of the Public and Private Sector Workforce Across VariousGroups, Labour Force Survey, April 2011*
Public Sector Private Sector
Number % Number %
Trades Helpers, Construction, and Transportation Labourers andRelated Occupations
109 0.8 1,021 2.7
Occupations Unique to Primary Industry 57 0.4 1,188 3.1
Machine Operators and Assemblers in Manufacturing, IncludingSupervisors
73 0.5 2,187 5.7
Labourer in Processing, Manufacturing, and Utilities 4 0.0 533 1.4
Agriculture 1 0.0 588 1.5
Forestry, Fishing, Mining, Oil and Gas 59 0.4 1,448 3.8
Utilities 507 3.5 94 0.2
Construction 82 0.6 3,032 7.9
Manufacturing—durables 6 0.0 3,224 8.4
Manufacturing non-durables 6 0.0 2,529 6.6
Wholesale Trade 3 0.0 1,769 4.6
Retail Trade 97 0.7 6,754 17.6
Transportation and Warehousing 650 4.5 1,932 5.0
Finance, Insurance, Real Estate, and Leasing 214 1.5 2,457 6.4
Professional, Scientific, and Technical Services 32 0.2 2,323 6.0
Management, Administrative, and Other Support 33 0.2 1,655 4.3
Educational Services 4,366 30.3 339 0.9
Health Care and Social Assistance 4,258 29.5 3,120 8.1
Information, Culture, and Recreation 398 2.8 1,531 4.0
Accommodation and Food Services 10 0.1 3,720 9.7
Other Services 3 0.0 1,902 5.0
Public Administration 3,707 25.7 0 0.0
* = Self-employment is not included.Sources: Statistics Canada (2011); calculations by the authors.

Table 2 shows that there are many ways the pub lic and pri vate sec tor workforcesin Can ada dif fer. Over all, the workforce in both sec tors com bined is 49.0 per cent maleand 51.0 per cent female. How ever, at 63.8 per cent, the pub lic sec tor has dis pro por -tion ately more female work ers than the pri vate sec tor at 46.1 per cent. Pub lic sec toremploy ees are also older, as indi cated by the smaller pro por tion of the sec tor in youn -ger age brack ets. Con sis tent with these age dif fer ences, there are pro por tion ately more mar ried work ers in the pub lic than in the pri vate sec tor.
The pub lic sec tor is also sub stan tially more edu cated than the pri vate sec tor; agreater pro por tion of work ers in the pub lic sec tor have under grad u ate or grad u atedegrees. Both sec tors have a fairly sim i lar pro por tion of part-time work ers, albeitslightly lower in the pub lic sec tor (17.2 per cent ver sus 20.7 per cent).
A larger pro por tion of pub lic sec tor work ers have more than 10 years of ten ure,sug gest ing a higher level of job secu rity in the pub lic sec tor. The pro por tion of employ -ees with per ma nent jobs, how ever, is slightly lower in the pub lic sec tor than in the pri -vate sec tor, largely because of the higher pro por tion of work ers on con tract work inthat sec tor: 10.6 per cent ver sus 4.9 per cent in the pri vate sec tor. Pub lic sec tor work ersare dis pro por tion ately rep re sented in larger orga ni za tions. As well, 75.7 per cent ofpub lic sec tor work ers are union mem bers or cov ered by a col lec tive agree ment, com -pared to 18.4 per cent in the pri vate sec tor.
The vast major ity of pub lic sec tor jobs in Can ada are in three indus tries: edu ca -tional ser vices, health care and social assis tance, and pub lic admin is tra tion. Pri vatesec tor employ ment, on the other hand, is much more dis persed across indus tries, with retail trade, accom mo da tion and food ser vices, and man u fac tur ing indus try pro vid ingthe larg est per cent age of pri vate sec tor jobs.
To sum ma rize, the pub lic sec tor workforce is dis pro por tion ately female, older,mar ried, union ized, long-ten ured, employed in larger estab lish ments, more edu cated,and con cen trated in a few indus tries.
The pub lic-sec tor wage pre mium: Results from empir i cal anal y sis
The anal y sis in this sec tion closely mim ics that done by Gunderson et al. (2000). Forde tails on the meth od ol ogy used to com pute the pub lic sec tor wage pre mium in thissec tion, please see Ap pen dix A.
Table 3 pres ents the results of the anal y sis of the pub lic and pri vate wage sec torcom par i son in Can ada. The table’s sec ond col umn (Model 1) pro vides the pub lic sec -tor wage pre mium cal cu la tion with out con trol ling for any fac tors. In other words,Model 1 rep re sents a cal cu la tion that ignores vari ables like age, expe ri ence, edu ca tion,etc., which we know influ ence wages. The Model 1 esti mate indi cates that wages in the
Fra ser Insti tute 4 www.fraserinstitute.org
Comparing Public and Private Sector Compensation in Canada 4 April 2013 4 23

Model 1Coefficient
(%)
Model 2Coefficient
(%)
(Private)
Public 35.8*** 12.0***
(Female)
Male 13.4***
(Age 15-19)
Age 20-24 1.6*
Age 25-29 13.8***
Age 30-34 18.6***
Age 35-39 19.6***
Age 40-44 19.2***
Age 45-49 21.2***
Age 50-54 20.2***
Age 55-59 18.0***
Age 60-64 15.1***
Age 65-69 4.6***
Age 70 + 3.8*
(Married)
Living in common-law 0.2
Widowed -4.6***
Separated -2.7***
Divorced -1.5**
Single, never married -5.4***
(Grade 0-8)
Some secondary 5.9***
11 to 13 years of schooling 10.7***
Some post secondary 15.1***
Post secondary certificate 21.6***
Bachelors degree 36.6***
Masters degree 45.6***
(Tenure 1-5 months)
Tenure 6-11 months 1.9***
Tenure 1-5 years 6.4***
Tenure 6-10 years 14.5***
Tenure 11-20 years 23.5***
(Permanent Work)
Seasonal Work -9.8***
Contract Work -5.1***
Casual Work -6.5***
(Full Time)
Part Time -10.5***
Model 1Coefficient (%)
Model 2Coefficient (%)
(Establishment, less than 20 employees)
Establishment, 20-99 employees 6.4***
Establishment, 100-500 employees 10.8***
Establishment, more than 500 17.7***
(Newfoundland)
Prince Edward Island -3.3***
Nova Scotia -2.9***
New Brunswick -5.2***
Quebec 2.2**
Ontario 9.2***
Manitoba 1.5
Saskatchewan 11.6***
Alberta 18.7***
British Columbia 13.2***
(Montreal)
Toronto 0.4
Vancouver -4.7***
Other CMA or Non CMA -0.7
(Agriculture)
Forestry, Fishing, Mining, Oil and Gas 42.5***
Utilities 35.0***
Construction 33.8***
Manufacturing—durables 18.6***
Manufacturing non-durables 12.4***
Wholesale Trade 20.5***
Retail Trade -1.6
Transportation and Warehousing 16.4***
Finance, Insurance, Real Estate, and Leasing 23.5***
Professional, Scientific, and Technical Services 31.8***
Management, Administrative, and OtherSupport
3.4**
Educational Services 22.6***
Health Care and Social Assistance 19.7***
Information, Culture, and Recreation 16.8***
Accommodation and Food Services -5.5***
Other Services 11.7***
Public Administration 26.1***
Constant 2.9*** 2.2***
N 52,849 52,849
Adjusted R Square 0.11 0.49
Notes: 1Self-employment is not included.2Bolded estimates are significant at either a 90% (*), 95% (**), or99% (***) level. All are based on robust standard errors.Sources: Statistics Canada (2011); calculations by the authors.
Table 3: Pub lic sec tor wage pre mium in Can ada, Labour Force Sur vey, April 2011 (Depend ant vari able, log of Hourly wage)
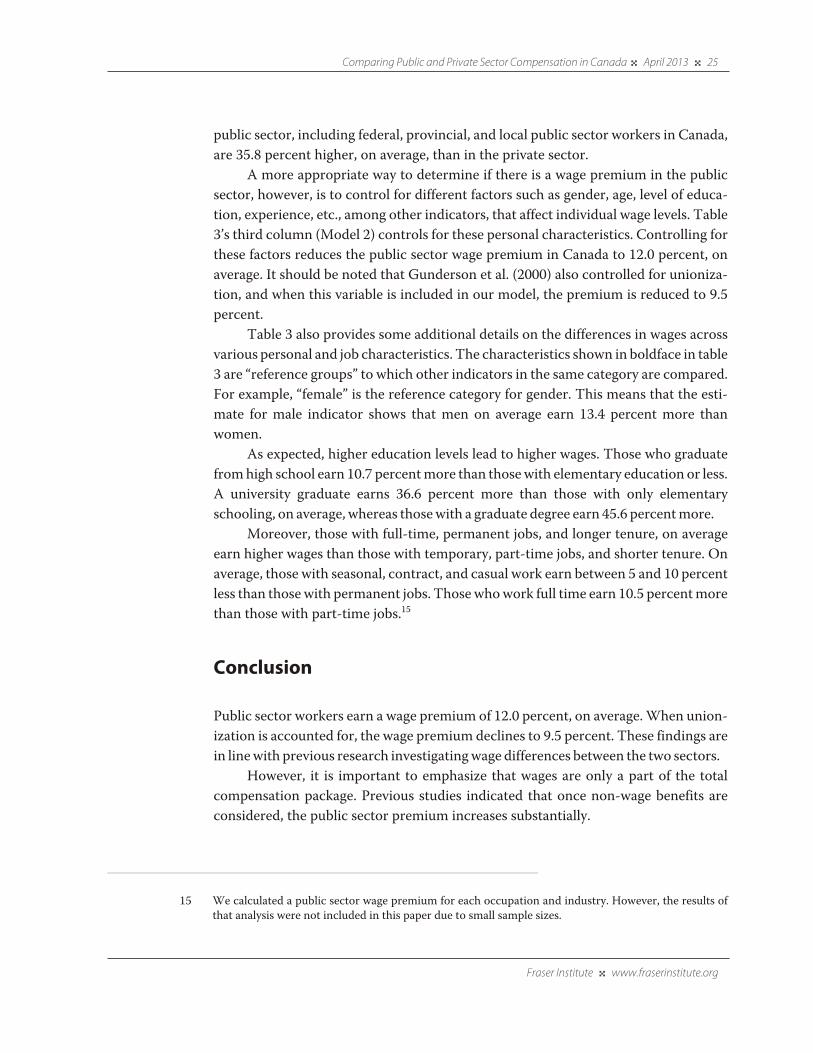
pub lic sec tor, includ ing fed eral, pro vin cial, and local pub lic sec tor work ers in Can ada,are 35.8 per cent higher, on aver age, than in the pri vate sec tor.
A more appro pri ate way to deter mine if there is a wage pre mium in the pub licsec tor, how ever, is to con trol for dif fer ent fac tors such as gen der, age, level of edu ca -tion, expe ri ence, etc., among other indi ca tors, that affect indi vid ual wage lev els. Table3’s third col umn (Model 2) con trols for these per sonal char ac ter is tics. Con trol ling forthese fac tors reduces the pub lic sec tor wage pre mium in Can ada to 12.0 per cent, onaver age. It should be noted that Gunderson et al. (2000) also con trolled for union iza -tion, and when this vari able is included in our model, the pre mium is reduced to 9.5per cent.
Table 3 also pro vides some addi tional details on the dif fer ences in wages acrossvar i ous per sonal and job char ac ter is tics. The char ac ter is tics shown in bold face in table 3 are “ref er ence groups” to which other indi ca tors in the same cat e gory are com pared.For exam ple, “female” is the ref er ence cat e gory for gen der. This means that the esti -mate for male indi ca tor shows that men on aver age earn 13.4 per cent more thanwomen.
As expected, higher edu ca tion lev els lead to higher wages. Those who grad u atefrom high school earn 10.7 per cent more than those with ele men tary edu ca tion or less. A uni ver sity grad u ate earns 36.6 per cent more than those with only ele men taryschool ing, on aver age, whereas those with a grad u ate degree earn 45.6 per cent more.
More over, those with full-time, per ma nent jobs, and lon ger ten ure, on averageearn higher wages than those with tem po rary, part-time jobs, and shorter ten ure. Onaver age, those with sea sonal, con tract, and casual work earn between 5 and 10 per centless than those with per ma nent jobs. Those who work full time earn 10.5 per cent more than those with part-time jobs.15
Con clu sion
Pub lic sec tor work ers earn a wage pre mium of 12.0 per cent, on av er age. When union -iza tion is ac counted for, the wage pre mium de clines to 9.5 per cent. These find ings arein line with pre vi ous re search in ves ti gat ing wage dif fer ences be tween the two sec tors.
How ever, it is impor tant to empha size that wages are only a part of the totalcom pen sa tion pack age. Pre vi ous stud ies indi cated that once non-wage ben e fits arecon sid ered, the pub lic sec tor pre mium increases sub stan tially.
Fra ser Insti tute 4 www.fraserinstitute.org
Comparing Public and Private Sector Compensation in Canada 4 April 2013 4 25
15 We cal cu lated a pub lic sec tor wage pre mium for each occu pa tion and indus try. How ever, the results ofthat anal y sis were not included in this paper due to small sam ple sizes.

IV Comparing Non-Wage Benefits in Canada’s Public and Private Sectors
As dis cussed ear lier, wages are only a part of to tal em ployee com pen sa tion. Eventhough pub lic sec tor work ers in Can ada en joy a wage pre mium, this does not tell uswhether or not their over all com pen sa tion is higher than, com pa ra ble to, or lowerthan that for work ers in the pri vate sec tor.
Unfor tu nately, indi vid ual data on non-wage ben e fits such as pen sions, vaca tiontime, and health ben e fits, is not readily avail able in Can ada, which explains the lack ofresearch on this aspect of employee com pen sa tion. As a side note, it is crit i cal thatCan ada’s sta tis ti cal agency, Sta tis tics Can ada, aug ment its cur rent sur vey in order tobegin col lect ing and ana lyz ing data on non-wage ben e fits.
For tu nately there are some aggre gated non-wage ben e fit data that can be exam -ined to roughly sur mise whether non-wage ben e fits are lower, com pa ra ble, or higherin Can ada’s pub lic sec tor than in the nation’s pri vate sec tor. Three spe cific sources ofnon-wage ben e fits data are exam ined: reg is tered pen sions, aver age age of retire ment,and job loss. To some degree, the lat ter is meant to mea sure job secu rity.
Reg is tered pen sions
The pen sion ben e fit is the first non-wage ben e fit to con sider. It has two im por tant di -men sions. The first is the per cent age of work ers in both sec tors who have a reg is teredpen sion. Ta ble 4 sum ma rizes the pen sions data for Can ada. In terms of pen sion cov er -age, there is a dra matic dif fer ence be tween the pub lic and pri vate sec tors. In 2011, thelat est data avail able at the time of writ ing, 24.0 per cent of pri vate sec tor work ers inCan ada were cov ered by a pen sion com pared to 88.2 per cent of pub lic sec tor work ers.
This means that whereas about one out of four work ers in the pri vate sec tor has a registered pen sion plan, nearly nine of out 10 of pub lic sec tor work ers do. This gapgrows when we con sider the sec ond dimen sion—the type of pen sion plan in each sec tor.
A defined ben e fit plan pro vides work ers with a guar an teed ben e fit in retire ment.A defined con tri bu tion plan, on the other hand, pro vides employ ees with a ben e fit that is based on their con tri bu tions, their employ ers’ con tri bu tions, and earn ings on thepen sion sav ings over time. A defined ben e fit plan is increas ingly scarce in the pri vatesec tor because of its high costs and risks for the employer. Spe cif i cally, in a definedben e fit pen sion plan, the employer bears all the finan cial risk since the employee is
Fra ser Insti tute 4 www.fraserinstitute.org
26 4 Comparing Public and Private Sector Compensation in Canada 4 April 2013
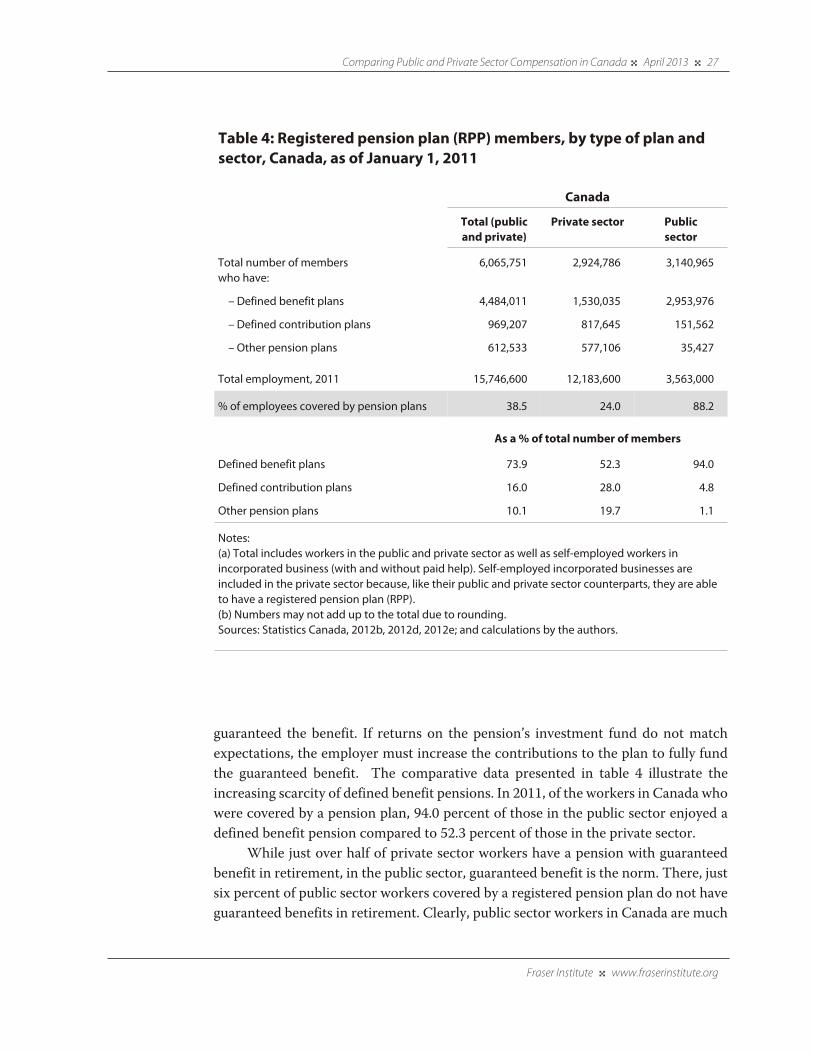
guar an teed the ben e fit. If returns on the pen sion’s invest ment fund do not matchexpec ta tions, the employer must increase the con tri bu tions to the plan to fully fundthe guar an teed ben e fit. The com par a tive data pre sented in table 4 illus trate theincreas ing scar city of defined ben e fit pen sions. In 2011, of the work ers in Can ada whowere cov ered by a pen sion plan, 94.0 per cent of those in the pub lic sec tor enjoyed adefined ben e fit pen sion com pared to 52.3 per cent of those in the pri vate sec tor.
While just over half of pri vate sec tor work ers have a pen sion with guar an teedben e fit in retire ment, in the pub lic sec tor, guar an teed ben e fit is the norm. There, justsix per cent of pub lic sec tor work ers cov ered by a reg is tered pen sion plan do not haveguar an teed ben e fits in retire ment. Clearly, pub lic sec tor work ers in Can ada are much
Fra ser Insti tute 4 www.fraserinstitute.org
Comparing Public and Private Sector Compensation in Canada 4 April 2013 4 27
Table 4: Registered pension plan (RPP) members, by type of plan andsector, Canada, as of January 1, 2011
Canada
Total (publicand private)
Private sector Publicsector
Total number of memberswho have:
6,065,751 2,924,786 3,140,965
– Defined benefit plans 4,484,011 1,530,035 2,953,976
– Defined contribution plans 969,207 817,645 151,562
– Other pension plans 612,533 577,106 35,427
Total employment, 2011 15,746,600 12,183,600 3,563,000
% of employees covered by pension plans 38.5 24.0 88.2
As a % of total number of members
Defined benefit plans 73.9 52.3 94.0
Defined contribution plans 16.0 28.0 4.8
Other pension plans 10.1 19.7 1.1
Notes:(a) Total includes workers in the public and private sector as well as self-employed workers inincorporated business (with and without paid help). Self-employed incorporated businesses areincluded in the private sector because, like their public and private sector counterparts, they are ableto have a registered pension plan (RPP).(b) Numbers may not add up to the total due to rounding.Sources: Statistics Canada, 2012b, 2012d, 2012e; and calculations by the authors.

more likely to be in a reg is tered pen sion plan, and are much more likely to receive adefined ben e fit pen sion, than their pri vate sec tor coun ter parts.
Aver age and median age of retire ment
Ta ble 5a and 5b pres ents in for ma tion about the av er age and me dian age of re tire mentfor all work ers—pub lic and pri vate sec tor—be tween 2007 and 2011 both for Can ada as a whole and for in di vid ual prov inces.16 Re gard less of whether the av er age or me dianage of re tire ment is used, pub lic sec tor work ers in Can ada re tire at an ear lier age thantheir pri vate sec tor coun ter parts. Spe cif i cally, on av er age, Can ada’s pub lic sec torwork ers re tire 2.5 years ear lier than do the coun try’s pri vate sec tor work ers. The gapin creases to 2.9 years if the me dian rather than the av er age is used.
On aver age, the gap was larg est in New found land & Lab ra dor and New Bruns -wick where pub lic sec tor work ers retire 4.1 and 4.0 years ear lier, respec tively, thantheir pri vate sec tor coun ter parts. At 1.3 years, Ontario has the small est gap. What isclear from tables 5a and 5b is that in every prov ince, pub lic sec tor work ers tend toretire ear lier than pri vate sec tor work ers.
Job loss as a proxy for job secu rity
Ta ble 6 pres ents data on job losses (ex clud ing those from tem po rary em ploy ment) for2011 for Can ada as a whole and the prov inces. Ta ble 6 gives sev eral rea sons for jobloss. They in clude firms mov ing lo ca tion, firms that went out of busi ness, chang ingbusi ness con di tions, and dis missal. In 2011, 3.8 per cent of those em ployed in the pri -vate sec tor ex pe ri enced job loss in Can ada, com pared to only 0.6 per cent of those em -ployed in the pub lic sec tor.
The loss of jobs in the pub lic sec tor was sim i lar across all prov inces and rangedfrom 0.5 per cent in Que bec and Sas katch e wan to 0.9 per cent in Prince Edward Island.Pri vate sec tor work ers, on the other hand, were much more likely to lose their jobs inthe Atlan tic Prov inces than in the rest of the Can ada. Job losses ranged from 4.8 per -cent in Nova Sco tia to 7.4 in New found land & Lab ra dor. At 2.5 per cent, pri vate sec torwork ers in the three Prai rie prov inces (Alberta, Sas katch e wan, and Man i toba) had thelow est job loss rates.
Fra ser Insti tute 4 www.fraserinstitute.org
28 4 Comparing Public and Private Sector Compensation in Canada 4 April 2013
16 Sta tis tics Can ada, which pro vided the data, noted that it should be used with cau tion due to small sam plesizes, espe cially for the prov inces. Five-year aver ages were used (2007 to 2011) to try to mit i gate the sam -ple size proble.

Fra ser Insti tute 4 www.fraserinstitute.org
Comparing Public and Private Sector Compensation in Canada 4 April 2013 4 29
Table 5a: Average retirement age, from 2007 to 2011 (in years)
Totala Public sectoremployees
Private sectoremployees
Differencec
(in years)
Canada 61.9 60.0 62.4 2.5
Newfoundland & Labrador 60.0 58.2 62.3 4.1
Prince Edward Island 61.8 60.8 62.4b 1.6
Nova Scotia 61.5 60.0 62.0 2.1
New Brunswick 61.3 59.1 63.1 4.0
Quebec 60.4 58.5 61.7 3.2
Ontario 62.1 60.7 62.0 1.3
Manitoba 62.4 60.6 62.6 2.0
Saskatchewan 62.7 60.3 62.7 2.4
Alberta 63.5 61.7 63.8 2.0
British Columbia 63.0 60.7 63.5 2.8
Notes:(a) Total includes workers in the public and private sector, and self-employed individuals (including unpaid family workers).(b) The retirement age of private sector workers in Prince Edward Island was not provided by Statistics Canada for the year2011 since the sample was too small to be reliable. For Prince Edward Island, estimates based on a sample of less than 200are not reported. Therefore, the retirement age for Prince Edward Island is based on four years of data, 2007 to 2010.(c) Numbers may not add up to the total due to rounding.Sources: Statistics Canada, 2012f; and calculations by the authors.
Table 5b: Median retirement age, from 2007 to 2011 (in years)
Totala Public sectoremployees
Private sectoremployees
Differencec
(in years)
Canada 61.5 59.7 62.6 2.9
Newfoundland & Labrador 59.7 58.2 62.9 4.7
Prince Edward Island 61.3 60.1 63.0b 2.8
Nova Scotia 60.3 59.8 61.5 1.7
New Brunswick 60.8 59.1 64.0 4.9
Quebec 59.9 58.3 61.6 3.3
Ontario 62.1 60.6 62.4 1.8
Manitoba 62.3 60.6 62.9 2.4
Saskatchewan 62.0 60.2 62.3 2.1
Alberta 64.3 63.2 64.3 1.1
British Columbia 62.8 60.0 64.2 4.2
Notes and sources: Same as for Table 5a.

Con clu sion
While there is in suf fi cient data to cal cu late or make a de fin i tive state ment aboutnon-wage ben e fits dif fer ences be tween the pub lic and pri vate sec tors in Can ada, avail -able data sug gest that the pub lic sec tor en joys more gen er ous non-wage ben e fits thanthe pri vate sec tor. More spe cif i cally, pub lic sec tor work ers in Can ada have higher rates of pen sion cov er age, higher rates of de fined ben e fit pen sions, lower ages of re tire ment, and lower rates of job loss than pri vate sec tor work ers in the coun try.
Fra ser Insti tute 4 www.fraserinstitute.org
30 4 Comparing Public and Private Sector Compensation in Canada 4 April 2013
Table 6: Job loss, by class of workers for Canada and the provinces, 2011
Number of those who lost a job(in thousands)
Number of those who lost a jobas a % of employment
Total Publicsector
Privatesector
Total Publicsector
Privatesector
Difference(percent-
age points)
Canada 445.4 22.1 423.4 3.0 0.6 3.8 3.2
Newfoundland &Labrador
10.4 0.5 10.0 5.1 0.7 7.4 6.6
Prince Edward Island 2.5 0.2 2.3 4.1 0.9 5.8 4.8
Nova Scotia 14.2 0.8 13.3 3.6 0.7 4.8 4.1
New Brunswick 13.4 0.8 12.6 4.3 0.9 5.7 4.7
Quebec 106.8 4.3 102.5 3.1 0.5 4.0 3.5
Ontario 178.2 8.8 169.4 3.1 0.7 3.9 3.2
Manitoba 10.4 1.0 9.5 1.9 0.6 2.5 1.9
Saskatchewan 8.0 0.7 7.3 1.9 0.5 2.5 2.0
Alberta 37.4 2.5 34.9 2.1 0.7 2.5 1.8
British Columbia 64.1 2.5 61.6 3.5 0.6 4.3 3.7
Notes:(a) Total job losses cover public and private sector workers only. Self-employed are excluded.(b) Reasons for losing a job include: company moved, company went out of business, business conditions, and dismissalby employer. Job losses due to an end of temporary, casual, and seasonal work are not included.(c) Numbers may not add up to the total due to rounding.Sources: Statistics Canada, 2012b and 2012f; and calculations by the authors.

V Solutions to the Disparities in Compensation
Ear lier sec tions have out lined a num ber of dif fer ences be tween the pub lic and pri vatesec tor that re sult in a per sis tent com pen sa tion pre mium for pub lic sec tor work ers. Tobe fair, set ting pub lic-sec tor wages and non-wage ben e fits is not an easy task. To at -tract and re tain skilled and tal ented em ploy ees, gov ern ments have to of fer com pet i tive com pen sa tion pack ages. How ever, a sys tem that is overly gen er ous (i.e., pays pub licsec tor work ers a pre mium) is un fair to tax pay ers. This gen er os ity can also havespillover ef fects, in clud ing in flated wage set tle ments in the pri vate sec tor as it at tempts to re main com pet i tive with the pub lic sec tor.17
An empir i cal anal y sis of the wage data indi cate that pub lic sec tor work ers inCan ada (includ ing fed eral, pro vin cial, and local pub lic sec tor work ers), enjoy a 12.0percent wage pre mium, on aver age, com pared to their pri vate sec tor coun ter parts.This is after adjust ing for per sonal and other char ac ter is tics that affect wages, such asgen der, age, mar i tal sta tus, edu ca tion, ten ure, size of estab lish ment, type of job, andindus try. When union iza tion sta tus is included in the anal y sis, the wage pre mium forthe pub lic sec tor declines to 9.5 per cent.
An exam i na tion of the avail able non-wage ben e fits data sim i larly indi cates thatpub lic sec tor work ers fare better than those in the pri vate sec tor. For exam ple, 24.0per cent of pri vate sec tor work ers were cov ered by a pen sion com pared to 88.2 per centof pub lic sec tor work ers. More over, of those pub lic sec tor work ers cov ered by a reg is -tered pen sion plan, 94.0 per cent were cov ered by a defined ben e fit pen sion. In con -trast, just over half (52.3 per cent) of pri vate sec tor work ers cov ered by a reg is teredpen sion have a defined ben e fit pen sion. In addi tion, pub lic sec tor work ers retire ear -lier than their pri vate sec tor coun ter parts—by about 2.5 years, on aver age. Finally,pub lic sec tor work ers have more job secu rity. In 2011, 3.8 per cent of pri vate sec torwork ers lost their jobs com pared to 0.6 per cent of pub lic sec tor work ers.
Clearly, pub lic sec tor work ers in Can ada enjoy higher wages and more thanlikely higher non-wage ben e fits than com pa ra ble work ers in the pri vate sec tor. Giventhe pres ence of this wage (and likely, non-wage), pre mium in Can ada, the coun tryneeds a new insti tu tional frame work that is fair both to tax pay ers and pub lic sec torwork ers.
Fra ser Insti tute 4 www.fraserinstitute.org
Comparing Public and Private Sector Compensation in Canada 4 April 2013 4 31
17 For instance, Afonso and Gomes (2010) exam ined the rela tion ship between pub lic and pri vate sec torwages using data from 1973 to 2000 for 18 OECD coun tries, includ ing Can ada. They found that a 1.0 per -cent increase in pub lic sec tor wages increased the wage in the pri vate sec tor by 0.3 per cent.
Gather better data
The first step in achiev ing an im proved sys tem of wage and ben e fit set ting in the pub lic sec tor is to gather data better and more reg u larly. Sta tis tics Can ada needs to col lectdata on wage and non-wage ben e fits of pub lic and pri vate sec tor work ers more com -pre hen sively and on a reg u lar ba sis. While some of the ag gre gate data on non-wageben e fits such as re tire ment age, job losses, and pen sion cov er age are avail able, it is nei -ther de tailed enough nor com pre hen sive enough to en able the non-wage ben e fits be -tween the pub lic and pri vate sec tor work ers to be em pir i cally an a lyzed. The ad di tionaldata would al low re search ers and bu reau crats alike to as sess over all pub lic sec tor com -pen sa tion and com pare it to sim i lar re im burse ment in the pri vate sec tor.
Rec og nize that total com pen sa tion is what mat ters, not wages alone
A sec ond and chal leng ing step in the re form pro cess is to en sure that the com par i sonbe tween the pub lic and pri vate sec tors should cen tre on to tal com pen sa tion, not justthe nar rower com par i son of wages or spe cific ben e fits such as pen sions. The key is that over all com pen sa tion should be com pared, not just its spe cific com po nents. It is en -tirely fea si ble—and con cep tu ally ac cept able—for the pub lic sec tor to have a dif fer entset of pref er ences for its com pen sa tion than does the pri vate sec tor. How ever, again,the crit i cal com po nent is that the to tal amount of com pen sa tion is com pa ra ble.
Ensure trans par ency and rou tine dis clo sure
In or der for the mech a nisms that link pub lic sec tor com pen sa tion and pri vate sec torequiv a lents to work, in for ma tion about pub lic sec tor wages and ben e fits must betrans par ent, ac ces si ble, and dis closed reg u larly.
Insti tute a mech a nism for set ting com pen sa tion
A new in sti tu tional frame work for set ting the over all com pen sa tion lev els in the pub lic sec tor is nec es sary. This new frame work should link the pub lic sec tor’s over all com -pen sa tion to that in the pri vate sec tor. This means that the over all com pen sa tion ofpub lic sec tor work ers should be sim i lar to that for their pri vate sec tor coun ter partswith the same or sim i lar job re spon si bil i ties, ed u ca tion level, ten ure, etc.
There are a vari ety of options that will enable a more sys tem atized approach tocom pen sa tion set ting using the pri vate sec tor as a guide for pub lic sec tor com pen sa tion.
Fra ser Insti tute 4 www.fraserinstitute.org
32 4 Comparing Public and Private Sector Compensation in Canada 4 April 2013

For mal mech a nisms within gov ern ment
One ap proach is to sim ply leg is late a spe cific mech a nism within gov ern ment (see ap -pen dix B for in for ma tion on com pen sa tion in Can ada’s fed eral gov ern ment) that reg u -larly and for mally cal cu lates to tal com pen sa tion for pub lic sec tor po si tions based onpri vate sec tor equiv a lents.
Wage boards: An arms-length approach
Over three de cades ago, Pro fes sor San dra Christensen sug gested the cre ation of in de -pend ent wage boards18 to elim i nate the prob lem of wage pre mi ums in the pub lic sec tor.
A wage board is an inde pend ent gov ern ment body respon si ble for col lect ing,ana lyz ing, and set ting pub lic sec tor wages and ben e fits based on pri vate sec tor equiv a -lents. This infor ma tion col lected and ana lyzed by these boards would pro vide the nec -es sary trans par ency to both tax pay ers and gov ern ments to set the pub lic sec torcom pen sa tion at the lev els pre vail ing in the pri vate sec tor.19
Lump sum pay ments
An other more rad i cal re form is to em power pub lic sec tor un ions to be come more in -volved in de ter min ing the com po si tion of com pen sa tion for their mem bers.20 Spe cif i -cally, the rec om men da tion is to pro vide un ions with a lump-sum com pen sa tion to talby hour, or per haps per year, for work ers cov ered by col lec tive agree ments. The un ionwould then be asked to de ter mine the mix of wages and ben e fits for its mem bers.Given that nearly three-quar ters of the work ers in the pub lic sec tor are union ized, ask -ing the un ions to con trib ute to the so lu tion, rather than main tain ing the ad versarial re -la tion ship, is crit i cal to the lon ger-term sustainability of pub lic sec tor com pen sa tion.
Fra ser Insti tute 4 www.fraserinstitute.org
Comparing Public and Private Sector Compensation in Canada 4 April 2013 4 33
18 For more infor ma tion on the wage board con cept, please see Christensen, 1980.
19 Over the past sev eral decades, the fed eral gov ern ment has attempted to col lect wage and non-wage dataon pub lic and pri vate sec tor work ers to help set pub lic sec tor worker com pen sa tion lev els. For exam ple, in 1957, the fed eral gov ern ment cre ated the Pay Research Bureau with the mis sion “to pro vide objec tiveinfor ma tion on com pen sa tion and work ing con di tions in gov ern ment, busi ness, and indus try, and toassem ble and ana lyze fac tual evi dence of trends in out side employ ment” (Trea sury Board of Can ada Sec -re tar iat, 2006: 14). How ever, the bureau was elim i nated in 1992. For details on its role and short com ings,see Gunderson, 1978: 118-121, and Trea sury Board of Can ada Sec re tar iat, 2006. More recently, in 2003,the fed eral gov ern ment asked the Pub lic Ser vice Labour Rela tions Board “to pro vide impar tial, accu rate,and timely infor ma tion on com par a tive rates of pay, employee earn ings, con di tions of employ ment, andben e fits in the pub lic and pri vate sec tors” (Pub lic Ser vice Labour Rela tions Board, 2012).
20 Jason Clem ens has made this rec om men da tion in both Can ada and the United States (see Clem ens, 2010and 2012).
Appen dix A: Empir i cal Meth od ol ogy
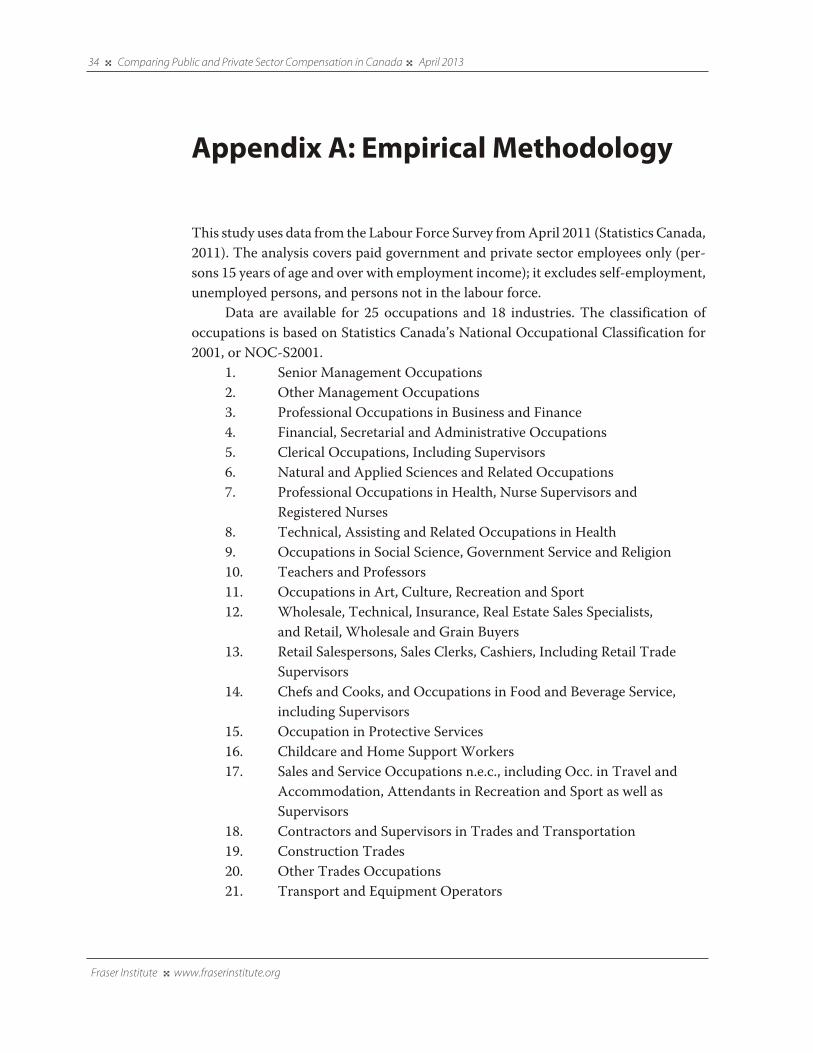
This study uses data from the La bour Force Sur vey from April 2011 (Sta tis tics Can ada, 2011). The anal y sis cov ers paid gov ern ment and pri vate sec tor em ploy ees only (per -sons 15 years of age and over with em ploy ment in come); it ex cludes self-em ploy ment,un em ployed per sons, and per sons not in the la bour force.
Data are avail able for 25 occu pa tions and 18 indus tries. The clas si fi ca tion ofoccu pa tions is based on Sta tis tics Can ada’s National Occu pa tional Clas si fi ca tion for2001, or NOC-S2001.
1. Senior Man age ment Occu pa tions2. Other Man age ment Occu pa tions3. Pro fes sional Occu pa tions in Busi ness and Finance4. Finan cial, Sec re tarial and Admin is tra tive Occu pa tions5. Cler i cal Occu pa tions, Includ ing Super vi sors6. Nat u ral and Applied Sci ences and Related Occu pa tions7. Pro fes sional Occu pa tions in Health, Nurse Super vi sors and
Reg is tered Nurses8. Tech ni cal, Assist ing and Related Occu pa tions in Health9. Occu pa tions in Social Sci ence, Gov ern ment Ser vice and Reli gion10. Teach ers and Pro fes sors11. Occu pa tions in Art, Cul ture, Rec re ation and Sport12. Whole sale, Tech ni cal, Insur ance, Real Estate Sales Spe cial ists,
and Retail, Whole sale and Grain Buy ers13. Retail Sales per sons, Sales Clerks, Cash iers, Includ ing Retail Trade
Super vi sors14. Chefs and Cooks, and Occu pa tions in Food and Bev er age Ser vice,
including Super vi sors15. Occu pa tion in Pro tec tive Ser vices16. Childcare and Home Sup port Work ers17. Sales and Ser vice Occu pa tions n.e.c., includ ing Occ. in Travel and
Accom mo da tion, Atten dants in Rec re ation and Sport as well as Super vi sors
18. Con trac tors and Super vi sors in Trades and Trans por ta tion19. Con struc tion Trades20. Other Trades Occu pa tions21. Trans port and Equip ment Oper a tors
Fra ser Insti tute 4 www.fraserinstitute.org
34 4 Comparing Public and Private Sector Compensation in Canada 4 April 2013

22. Trades Help ers, Con struc tion, and Trans por ta tion Labour ers andRelated Occu pa tions
23. Occu pa tions Unique to Pri mary Indus try24. Machine Oper a tors and Assem blers in Man u fac tur ing, includ ing
Super vi sors25. Labourer in Pro cess ing, Man u fac tur ing and Util i ties
The 18 indus try groups used in this study are based on the 2007 North Amer i canIndus trial Clas si fi ca tion Sys tem (NAICS).
1. Agri cul ture2. For estry, Fish ing, Min ing, Oil and Gas3. Util i ties4. Con struc tion5. Man u fac tur ing—durables6. Man u fac tur ing non-durables7. Whole sale Trade8. Retail Trade9. Trans por ta tion and Ware hous ing10. Finance, Insur ance, Real Estate and Leas ing11. Pro fes sional, Sci en tific and Tech ni cal Ser vices12. Man age ment, Admin is tra tive and Other Sup port13. Edu ca tional Ser vices14. Health Care and Social Assis tance15. Infor ma tion, Cul ture and Rec re ation16. Accom mo da tion and Food Ser vices17. Other Ser vices18. Pub lic Admin is tra tion
The model used for esti mat ing a pub lic sec tor wage pre mium in Can ada is sim i -lar to meth od ol ogy used in Gunderson et al. (2000):
w P xi i i i= + +b a h
In the equa tion, wi denotes the (log) hourly wage of indi vid ual i, P is the dummyvari able denot ing sec toral sta tus (P = 1 for the pub lic sec tor sta tus), x is a vec tor of con -trol vari ables such as gen der, age, mar i tal sta tus, edu ca tion, ten ure, type of work (per -ma nent or sea sonal), size of firm, indus try, prov ince, city, and h is an error term whichincludes fac tors such as unob served skill or abil ity. The a and b are coef fi cient esti -mates. In other words, the model con trols for age, gen der, mar i tal sta tus, edu ca tion,ten ure, type of work, prov ince, city, size of estab lish ment, and indus try. Some mayargue that age and ten ure mea sure the same thing, i.e., expe ri ence. How ever, ten ure in
Fra ser Insti tute 4 www.fraserinstitute.org
Comparing Public and Private Sector Compensation in Canada 4 April 2013 4 35
the Labour Force Sur vey only mea sures the length of time in the per son’s cur rent joband thus ignores over all expe ri ence. The age indi ca tor is needed to cap ture the indi -vid ual’s cumu la tive expe ri ence from dif fer ent jobs over time.
Ordi nary least squares (OLS) were used to esti mate the wage pre mium in thepub lic sec tor. Results are shown in table 3 using dif fer ent con trol vari ables.
Fra ser Insti tute 4 www.fraserinstitute.org
36 4 Comparing Public and Private Sector Compensation in Canada 4 April 2013

Appen dix B: Fed eral Pub lic Sec torCom pen sa tion
There are short com ings in the ex ist ing fed eral com pen sa tion sys tem. Some of the cur -rent is sues and po ten tial ar eas for im prove ment re volve around the pro cess of set tingwage and non-wage ben e fits.
In 2006 (and its 2011 update), the Treasury Board of Can ada Sec re tar iat pro -vided a detailed anal y sis of how the wage and non-wage ben e fits are set in the fed eralpub lic sec tor (Treasury Board of Can ada Sec re tar iat, 2006; Lahey, 2011). These twostud ies high light three areas in which the cur rent sys tem could be improved sub stan -tially. First, fed eral com pen sa tion should be more com pa ra ble to that in the pri vatesec tor. While some attempts have made in the past to do so, very lit tle prog ress hasbeen made so far because “[t]he exist ing sys tem tends to fluc tu ate between rapidincreases and arbi trary con straints, inflat ing costs in ‘good’ times and alien at ingemploy ees in ‘bad’” (Lahey, 2011: 84).
The last 20 years are a good exam ple of this insta bil ity. For exam ple, fed eral pub -lic sec tor employ ment dropped by about 20 per cent in the mid-1990s as part of thePro gram Review (Lahey, 2011), a rather dras tic (but nec es sary) mea sure to cut fed eralspend ing and bal ance the fed eral bud get. How ever, after the Pro gram Review, fed eralemploy ment grew by about 40 per cent by 2009/10 (Lahey, 2011). As a result, the sal arycosts of fed eral employ ees more than dou bled from mid 1990s to 2009/10 (Lahey,2011). This sug gests that fed eral sec tor com pen sa tion ebbs and flows with the fed eralfis cal sit u a tion rather than the actual com pen sa tion in the pri vate sec tor, a proxy forwages that would pre vail in a com pet i tive mar ket.
A sec ond issue is the lack of trans par ency. Cur rently, detailed data on the fed eralsec tor total com pen sa tion lev els and trends (not just wages), is lack ing (Lahey, 2011).This infor ma tion would not only increase pub lic scru tiny but would also allow greatercom pa ra bil ity with the pri vate sec tor (Lahey, 2011). More over, once the costs of totalcom pen sa tion are known and readily avail able, all sides would find it eas ier to makebetter informed deci sions.
Related to the sec ond point is the balkanization of the cur rent sys tem of sal aryand non-sal ary ben e fits. While the sal ary lev els for fed eral gov ern ment work ers are seteither directly by the Trea sure Board for non-union ized pub lic employ ees, or throughcol lec tive bar gain ing for union ized employ ees, ben e fits such as health, den tal, dis abil -ity, and pen sion plans are set sep a rately (Lahey, 2011). The pen sion plan for fed eralemploy ees is gov erned by stat ute and, thus, is not cov ered by col lec tive bar gain ing.
Fra ser Insti tute 4 www.fraserinstitute.org
Comparing Public and Private Sector Compensation in Canada 4 April 2013 4 37
Con se quently, this par tial sys tem pre vents the gov ern ment from mak ing trade-offsamong dif fer ent parts of total com pen sa tion when set ting the sal a ries for pub lic ser -vants or engag ing in col lec tive bar gain ing (Lahey, 2011).
These three fac tors make the fed eral pub lic sec tor com pen sa tion a “black box” to all but a few spe cial ists (Lahey, 2011: 84). A more inte grated, trans par ent com pen sa -tion sys tem in line with the pri vate sec tor com pen sa tion would ben e fit both work ersand taxpayers.
Fra ser Insti tute 4 www.fraserinstitute.org
38 4 Comparing Public and Private Sector Compensation in Canada 4 April 2013

Ref er ences
Afonso, An to nio, and Pedro Gomes (2010). In ter ac tions be tween Pri vate and Pub licSec tor Wages. IZA Dis cus sion Paper No. 5322 (No vem ber).<http://ftp.iza.org/dp5322.pdf >, as of March 15, 2013.
Bender, Keith A. (1998). The Cen tral Gov ern ment-Pri vate Sec tor Wage Dif fer en tial. Jour nal of Eco nomic Sur veys 12, 2: 177-220.
Biggs, An drew, and Ja son Richwine (2011). Com par ing Fed eral and Pri vate Sec torCom pen sa tion. AEI Eco nomic Pol icy Work ing Pa per 2011-02 (March). Amer i canEn ter prise In sti tute. <http://www.aei.org/files/2011/06/08/AEI-Working-Paper-on-Federal-Pay-May-2011.pdf>, as of De cem ber 19, 2012.
Choudhury, Sharmila (1994). New Ev i dence on Pub lic Sec tor Wage Dif fer en tials.Ap plied Eco nom ics 26, 3: 259-266.
Clem ens, Ja son (2010, Nov. 30). Ja son Clem ens: Rad i cal Re think for State Work ers’Pay. Or ange County Reg is ter. <http://www.ocregister.com/articles/state-278202-benefits-sector.html>, as of March 5, 2013.
Clem ens, Ja son (2012, April 4). Re think ing Pub lic Sec tor Pay. Van cou ver Sun.http://www.macdonaldlaurier.ca/the-vancouver-sun-rethinking-public-sector-pay/,as of March 5, 2013
Christensen, San dra (1980). Un ions and the Pub lic In ter est. The Fra ser In sti tute.
Ehrenberg, R.G., and J.L. Schwarz (1986). Pub lic-sec tor La bor Mar kets. In O.Ashenfelter and R. Layard (eds.), Hand book of La bor Eco nom ics (vol. 2) (North-Hol -land): 1219-1260.
Ehrenberg, R.G., and J.L. Schwarz (1986). Pub lic-sec tor La bor Mar kets. In O.Ashenfelter and D. Card (eds.), Hand book of La bor Eco nom ics (vol. 2) (North-Hol -land): 1219-1260.
Greg ory, Rob ert, and Jeffrey Borland (1999). Re cent De vel op ments in Pub lic Sec torLa bor Mar kets. In O. Ashenfelter and D. Card (eds.), Hand book of La bor Eco nom ics(vol. 3) (North-Hol land): 3573-3630.
Fra ser Insti tute 4 www.fraserinstitute.org
Comparing Public and Private Sector Compensation in Canada 4 April 2013 4 39
Gunderson, Morley (1978). Data on Public Sec tor Wages in Can ada. In D. Foot (ed.). Pub lic Em ploy ment and Com pen sa tion in Can ada: Myths and Re al i ties. (Butterworths):107-26.
Gunderson, Morley (1979). Earn ings Dif fer en tials be tween the Pub lic and Pri vateSec tors. The Ca na dian Jour nal of Eco nom ics 12, 2: 228-242.
Gunderson, Morley (1980). Pub lic Sec tor Com pen sa tion in Can ada and the US. In -dus trial Re la tions 19 (3): 257-271.
Gunderson, Morley, Douglas Hyatt, and Craig Rid dell (2000). Pay Dif fer ences be -tween the Gov ern ment and Pri vate Sec tors: La bour Force Sur vey and Cen sus Es ti -mates. Hu man Re sources in Gov ern ment Se ries, CPRN Dis cus sion Pa per No. W10.Ca na dian Pol icy Re search Net works. <http://www.cprn.org/documents/15680_en.pdf>, as of De cem ber 19, 2012.
Kornai, Janos (1992). The So cial ist Sys tem: The Po lit i cal Econ omy of Com mu nism.Prince ton Uni ver sity Press.
Kornai, Janos, Eric Maskin, and Gerard Roland (2003). Un der stand ing the Soft Bud -get Con straint. Jour nal of Eco nomic Lit er a ture, XLI (De cem ber): 1095-1136.
Lahey, James (2011). Con trol ling Fed eral Com pen sa tion Costs: To wards a Fairerand More Sus tain able Sys tem. In Chris to pher Stoney and G. Bruce Doern (eds.),How Ot tawa Spends 2011-2012 (School of Pub lic Pol icy and Ad min is tra tion atCarleton Uni ver sity): 84-105.
Mallett, Ted, and Queenie Wong (2008). Wage Watch: A Com par i son of Pub lic-sec -tor and Pri vate-sec tor Wages. Ca na dian Fed er a tion of In de pend ent Busi nesses.<http://www.cfib.ca/research/reports/rr3077.pdf >, as of March 6, 2013.
Moore, Wil liam J., and John Raisian (1991). Gov ern ment Wage Dif fer en tials Re vis -ited. Jour nal of La bor Re search 12, 1: 13-33.
Mueller, Rich ard E. (1998). Pub lic-Pri vate Sec tor Wage Dif fer en tials in Can ada: Ev i -dence from Quantile Re gres sions. Eco nomic Let ters 60, 2: 229-235.
Mueller, Rich ard E. (2000). Pub lic- and Pri vate-Sec tor Wage Dif fer en tials in Can adaRe vis ited. In dus trial Re la tions 39, 3: 375-400.
Prescott, Da vid, and Bo Wandscheneider (1999). Pub lic/Pri vate sec tor Wage Dif fer -en tials in Can ada—Ev i dence from the 1991 and 1982 Sur veys of Con sumer Fi nance.Ap plied Eco nom ics 31: 723-731.
Fra ser Insti tute 4 www.fraserinstitute.org
40 4 Comparing Public and Private Sector Compensation in Canada 4 April 2013

Pub lic Ser vice La bour Re la tions Board (2012). Com pen sa tion Anal y sis and Re searchSer vices. Web page. Gov ern ment of Can ada. <http://www.pslrb-crtfp.gc.ca/cars-sarr/intro_e.asp>, as of De cem ber 20, 2012.
Ramoni-Perazzi, Josefa, and Don Bellante (2007). Do Truly Com pa ra ble Pub lic andPri vate Sec tor Work ers Show Any Com pen sa tion Dif fer en tial? Jour nal of La bor Re -search XXVIII, 1: 117-133.
Shapiro, Dan iel M., and Mor ton Stelcner (1989). Ca na dian Pub lic-Pri vate Sec torEarn ings Dif fer en tials, 1970-1980. In dus trial Re la tions 28 (1): 72-81.
Smith, Sharon (1976). Pay Dif fer en tials be tween Fed eral Gov ern ment and Pri vateSec tor Work ers. In dus trial and La bor Re la tions Re view 19 (Jan): 179-197.
Smith, Sharon (1977). Gov ern ment Wage Dif fer en tials. Jour nal of Ur ban Eco nom ics4: 248-271.
Sta tis tics Can ada, Pub lic Sec tor Sta tis tics Di vi sion (2009). Rec on cil i a tion of Pub licEm ploy ment Es ti mates from Mul ti ple Sources (July). Sta tis tics Can ada.<http://www23.statcan.gc.ca/imdb-bmdi/document/1713_D4_T9_V2-eng.pdf>, asof March 4, 2012.
Sta tis tics Can ada (2011). La bour Force Sur vey. Microdata file (April 2011). Sta tis ticsCan ada.
Sta tis tics Can ada (2012a). De part ment of Na tional De fence, mil i tary per son nel sea -son ally un ad justed and ad justed, and wages and sal a ries, an nual. CANSIM Ta ble183-0004. (Ac cessed No vem ber 27, 2012). Sta tis tics Canada.
Sta tis tics Can ada (2012b). La bour force sur vey es ti mates (LFS), em ploy ment by class of worker, North Amer i can In dus try Clas si fi ca tion Sys tem (NAICS) and sex, an nual(per sons). CANSIM Ta ble 282-0012. Sta tis tics Can ada.
Sta tis tics Can ada (2012c). Pub lic sec tor em ploy ment, wages and sal a ries, sea son allyun ad justed and ad justed, an nual. CANSIM Ta ble 183-0002. (Ac cessed No vem ber23, 2012). Sta tis tics Can ada.
Sta tis tics Can ada (2012d). Reg is tered pen sion plan (RPP) mem bers, by area of em -ploy ment, sec tor, type of plan and con trib u tory sta tus, an nual. CANSIM Ta ble280-0008. Sta tis tics Can ada.
Fra ser Insti tute 4 www.fraserinstitute.org
Comparing Public and Private Sector Compensation in Canada 4 April 2013 4 41

Sta tis tics Can ada (2012e). Spe cial re quest from Sta tis tics Can ada re gard ing de finedben e fits, de fined con tri bu tion, and other pen sion plans for pri vate and pub lic sec torby area of em ploy ment (re ceived on No vem ber 7, 2012). Sta tis tics Can ada.
Sta tis tics Can ada (2012f). Spe cial re quest from Sta tis tics Can ada us ing data from the La bour Force Sur vey (re ceived on Sept. 18, Oct. 19, and Oct. 29, 2012). Sta tis ticsCan ada.
Sta tis tics Can ada (2012g). Guide to the La bour Force Sur vey. Cat a logue No.71-543-G. <http://www.statcan.gc.ca/pub/71-543-g/71-543-g2012001-eng.pdf>, asof March 15, 2013.
Tiagi, Raaj (2010). Pub lic Sec tor Wage Pre mium in Can ada: Ev i dence from La bourForce Sur vey. La bour 24, 4: 456–473.
Trea sury Board of Can ada Sec re tar iat (2006). Ex pen di ture Re view of Fed eral Pub licSec tor Com pen sa tion Pol icy and Com pa ra bil ity (Web page—ar chived).<http://www.tbs-sct.gc.ca/report/orp/2007/er-ed/er-ed-eng.asp>, as of De cem ber19, 2012.
Venti, Ste ven (1985). Wages in the Fed eral and Pri vate Sec tors. NBER Work ing Pa -per No. 1641. Na tional Bu reau of Eco nomic Re search.
Walker, Scott (2011, March 1). Facts Are Clear—Wis con sin’s Broke. To ronto Sun.<http://www.torontosun.com/comment/columnists/2011/03/01/17457981.html> ,as of March 5, 2013.
Fra ser Insti tute 4 www.fraserinstitute.org
42 4 Comparing Public and Private Sector Compensation in Canada 4 April 2013

About the authors
Milagros Palacios is a Se nior Re search Econ o mist in the Fis cal Stud ies De part ment at the Fra ser In sti tute. Since join ing the In sti tute, Ms. Palacios has authored or co-authored over 40 re search stud ies on a wide range of pub lic pol icy is sues in clud ing tax -a tion, gov ern ment fi nances, in vest ment, pro duc tiv ity, la bour mar kets, and char i ta blegiv ing, among oth ers. She has co-writ ten three books and is a reg u lar con trib u tor toFra ser Fo rum, the Fra ser In sti tute’s pol icy mag a zine. Her re cent com men tar ies haveap peared in ma jor Ca na dian news pa pers such as the Na tional Post, To ronto Sun,Wind sor Star, and Van cou ver Sun. Ms. Palacios holds a BA in In dus trial En gi neer ingfrom the Pon tif i cal Cath o lic Uni ver sity of Peru and an MSc in Eco nom ics from theUni ver sity of Concepcion, Chile.
Ja son Clem ens is the Fra ser In sti tute’s Ex ec u tive Vice-Pres i dent. Mr. Clem ens held anum ber of po si tions with the Fra ser In sti tute be tween 1996 and 2008, in clud ing Di rec -tor of Re search Qual ity, Di rec tor of Bud get ing and Stra te gic Plan ning, and Di rec tor ofFis cal Stud ies. He most re cently worked with the Ot tawa-based Mac don ald-LaurierIn sti tute (MLI) as Di rec tor of Re search and held a sim i lar po si tion with the San Fran cisco-based Pa cific Re search In sti tute for over three years. Mr. Clem ens has an Hon oursBach e lors De gree of Com merce and a Mas ters’ De gree in Busi ness Ad min is tra tionfrom the Uni ver sity of Wind sor as well as a Post Bac ca lau re ate De gree in Eco nom icsfrom Si mon Fra ser Uni ver sity. He has pub lished over 70 ma jor stud ies on a wide rangeof top ics, in clud ing tax a tion, gov ern ment spend ing, la bor mar ket reg u la tion, bank ing,wel fare re form, health care, pro duc tiv ity, and en tre pre neur ship. He has pub lishednearly 300 shorter ar ti cles, which have ap peared in such news pa pers as the Wall StreetJour nal, In ves tors’ Busi ness Daily, the Wash ing ton Post, the Globe and Mail, the Na -tional Post, and a host of US, Ca na dian, and in ter na tional news pa pers.
Fra ser Insti tute 4 www.fraserinstitute.org
Comparing Public and Private Sector Compensation in Canada 4 April 2013 4 43
Acknowl edg ments
The au thors would like to thank a num ber of in di vid u als for their con tri bu tion and as -sis tance in com plet ing this study. They first thank the Uni ver sity of To ronto Pro fes sorMorley Gunderson and an anon y mous re viewer for for mally peer-re view ing the studyand pro vid ing help ful com ments and sug ges tions. The au thors also thank NachumGabler for his as sis tance on this study.
The authors are also grate ful for the assis tance and dil i gence of the Fra ser Insti -tute’s pub li ca tions and com mu ni ca tions depart ments whose work improved the qual -ity of the study.
Any remain ing errors or omis sions are the sole respon si bil ity of the authors. Wewould also like to express our grat i tude to those who donated to sup port this pro ject.With out their dona tions, this pro ject would not have been pos si ble.
Fra ser Insti tute 4 www.fraserinstitute.org
44 4 Comparing Public and Private Sector Compensation in Canada 4 April 2013

Pub lish ing infor ma tion
DistributionThese pub li ca tions are avail able from <http://www.fraserinstitute.org> in Por ta ble Doc u mentFor mat (PDF) and can be read with Adobe Ac ro bat® 7 or later, or with Adobe Reader® 7 or later.Adobe Reader® X, the most re cent ver sion, is avail able free of charge from Adobe Sys tems Inc.and may be down loaded from: <http://get.adobe. com/reader/>. We en cour age you to in -stall the most re cent ver sion.
Order ing pub li ca tionsFor in for ma tion about or der ing the Fra ser In sti tute’s printed pub li ca tions, please con tact thepub li ca tions co or di na tor
4 e-mail: [email protected] 4 tele phone: 604.688.0221 ext. 580 or, toll free, 1.800.665.3558 ext. 580
MediaFor me dia in qui ries, please con tact our Com mu ni ca tions De part ment:tele phone: 604.714.4582 or e-mail: [email protected]
Copy rightCopy right © 2013 by the Fra ser In sti tute. All rights re served. No part of this pub li ca tion may bere pro duced in any man ner what so ever with out writ ten per mis sion ex cept in the case of briefpas sages quoted in crit i cal ar ti cles and re views.
Dis claimerThe au thors of this pub li ca tion have worked in de pend ently and opin ions ex pressed by themare, there fore, their own, and do not nec es sar ily re flect the opin ions of the sup port ers, trust ees,or other staff of the Fra ser In sti tute. This pub li ca tion in no way im plies that the Fra ser In sti tute, its trust ees, or staff are in fa vor of, or op pose the pas sage of, any bill; or that they sup port or op -pose any par tic u lar po lit i cal party or can di date.
Date of issueApril 2013
Cita tionPalacios, Milagros, and Ja son Clem ens (2013). Com par ing Pub lic and Pri vate Sec tor Com pen -sa tion in Can ada. Stud ies in La bour Mar kets. Fra ser In sti tute.
ISSNISSN 1715-7439—On-line ver sion
Editing and pro duc tionKristin McCahon
Fra ser Insti tute 4 www.fraserinstitute.org
Comparing Public and Private Sector Compensation in Canada 4 April 2013 4 45

DesignLindsey Thomas Mar tin
Cover designBill Ray
Cover imagesOf fice worker, copy right © diego-cervo, Depositphoto
Sup port ing the Fra ser In sti tuteTo learn how to sup port the Fra ser In sti tute, please con tact
4 Devel op ment Depart ment, The Fra ser Insti tute, Fourth Floor, 1770 Burrard Street, Van cou ver, Brit ish Colum bia, Can ada V6J 3G7
4 tele phone, toll-free: 1.800.665.3558 ext. 586
4 e-mail: [email protected]
Lifetime Patrons
For their long-stand ing and valu able sup port con trib ut ing to the suc cess of the Fra serIn sti tute, the fol low ing peo ple have been rec og nized and in ducted as Life time Pa tronsof the Fra ser In sti tute.
Fra ser Insti tute 4 www.fraserinstitute.org
46 4 Comparing Public and Private Sector Compensation in Canada 4 April 2013
Sonja BataCharles BarlowEv BergArt GrunderJim Chap linSerge DarkazanliJohn Dobson
Ray mond HeungBill KorolBill MacknessFred MannixJack PirieCon RileyCatherine Windels

Pur pose, fund ing, and inde pend ence
The Fra ser In sti tute pro vides a use ful pub lic ser vice. We re port ob jec tive in for ma tionabout the eco nomic and so cial ef fects of cur rent pub lic pol i cies, and we of fer ev i -dence-based re search and ed u ca tion about pol icy op tions that can im prove the qual ity of life.
The Insti tute is a non-profit orga ni za tion. Our activ i ties are funded by char i ta bledona tions, unre stricted grants, ticket sales and spon sor ships from events, the licens -ing of prod ucts for pub lic dis tri bu tion, and the sale of pub li ca tions.
All research is sub ject to rig or ous review by exter nal experts, and is con ductedand pub lished sep a rately from the Insti tute’s Board of Trust ees and its donors.
The opin ions expressed by staff or author(s) are those of the indi vid u als them -selves, and should not be inter preted to reflect those of the Insti tute, its Board ofTrust ees, or its donors and sup port ers.
As a healthy part of pub lic dis cus sion among fel low cit i zens who desire toimprove the lives of peo ple through better pub lic pol icy, the Insti tute wel comes evi -dence-focused scru tiny of the research we pub lish, includ ing ver i fi ca tion of datasources, rep li ca tion of ana lyt i cal meth ods, and intel li gent debate about the prac ti caleffects of pol icy rec om men da tions.
Fra ser Insti tute 4 www.fraserinstitute.org
Comparing Public and Private Sector Compensation in Canada 4 April 2013 4 47
About the Fraser Institute
Our vi sion is a free and pros per ous world where in di vid u als ben e fit from greaterchoice, com pet i tive mar kets, and per sonal re spon si bil ity. Our mis sion is to mea sure,study, and com mu ni cate the im pact of com pet i tive mar kets and gov ern ment in ter -ven tions on the wel fare of in di vid u als. Founded in 1974, we are an in de pend ent Ca na -dian re search and ed u ca tional or ga ni za tion with lo ca tions through out North Amer icaand in ter na tional part ners in over 85 coun tries. Our work is fi nanced by tax-de duct iblecon tri bu tions from thou sands of in di vid u als, or ga ni za tions, and foun da tions. In or der to pro tect its in de pend ence, the In sti tute does not ac cept grants from gov ern ment or con -tracts for re search.
Nous envisageons un monde li bre et prospère, où chaque personne bénéficie d’un plusgrand choix, de marchés concurrentiels et de responsabilités individuelles. No tre mis -sion consiste à mesurer, à étudier et à communiquer l’effet des marchés concurrentielset des in ter ven tions gouvernementales sur le bien-être des individus.
Peer review
Val i dat ing the accu racy of our research
The Fra ser In sti tute main tains a rig or ous peer re view pro cess for its re search. Newre search, ma jor re search pro jects, and sub stan tively mod i fied re search con ducted by the Fra ser In sti tute are re viewed by ex perts with a rec og nized ex per tise in the topicarea be ing ad dressed. When ever pos si ble, ex ter nal re view is a blind pro cess. Up dates to pre vi ously re viewed re search or new edi tions of pre vi ously re viewed re search arenot re viewed un less the up date in cludes sub stan tive or ma te rial changes in themeth od ol ogy.
The review pro cess is over seen by the direc tors of the Insti tute’s research depart -ments who are respon si ble for ensur ing all research pub lished by the Insti tute passesthrough the appro pri ate peer review. If a dis pute about the rec om men da tions of thereview ers should arise dur ing the Insti tute’s peer review pro cess, the Insti tute has anEdi to rial Advi sory Board, a panel of schol ars from Can ada, the United States, andEurope to whom it can turn for help in resolving the dispute.
Fra ser Insti tute 4 www.fraserinstitute.org
48 4 Comparing Public and Private Sector Compensation in Canada 4 April 2013

Edi to rial Advi sory Board
Fra ser Insti tute 4 www.fraserinstitute.org
Comparing Public and Private Sector Compensation in Canada 4 April 2013 4 49
Pro fes sor Terry L. Ander sonPro fes sor Rob ert BarroPro fes sor Michael BlissPro fes sor Jean-Pierre CentiPro fes sor John ChantPro fes sor Bev DahlbyPro fes sor Erwin DiewertPro fes sor Ste phen EastonPro fes sor J.C. Her bert EmeryPro fes sor Jack L. GranatsteinPro fes sor Her bert G. GrubelPro fes sor James GwartneyPro fes sor Ron ald W. JonesDr. Jerry Jor danPro fes sor Ross McKitrick
Pro fes sor Michael ParkinPro fes sor Friedrich Schnei derPro fes sor Law rence B. SmithDr. Vito Tanzi
Past mem bersPro fes sor Armen Alchian*Pro fes sor James M. Buchanan*† Pro fes sor Friedrich A. Hayek*† Pro fes sor H.G. John son*Pro fes sor F.G. Pennance*Pro fes sor George Stigler*† Pro fes sor Edwin G. West*Sir Alan Walters*
* De ceased
† No bel Lau re ate