comparing full-scale and wind tunnel results
TRANSCRIPT
A Resource for the State of Florida
HURRICANE LOSS REDUCTION
FOR HOUSING IN FLORIDA:
Section 6
Comparing Full-Scale and Wind Tunnel Results
A Research Project Funded by The State of Florida Department of Community Affairs
Through Contract # 06RC-A%-13-00-05-261
Prepared by: David O. Prevatt, Ph.D., Wind Load Test Facility
Department of Civil Engineering Clemson University
In Partnership with: The International Hurricane Research Center
Florida International University

FIU Final Report RCMP Year 6: Wind Tunnel Section 6-ii
TABLE OF CONTENTS
1. PROJECT SCOPE ...............................................................................................................................1 2. BACKGROUND...................................................................................................................................2
2.1 SOURCES OF FULL-SCALE DATA – THE FCMP PROJECT ................................................................4 2.2 THE 2005 HURRICANE SEASON DEPLOYMENTS..............................................................................6
3. FULL-SCALE DATA COLLECTION AND ANALYSIS..............................................................10 3.1 FIELD SURVEYS OF PROTOTYPE HOUSES ......................................................................................10
3.1.1 Prototype House FL-18 ...........................................................................................................12 3.1.2 Prototype House FL-19 ...........................................................................................................14 3.1.3 Prototype House FL-23 ...........................................................................................................17 3.1.4 Prototype House FL-24 ...........................................................................................................18 3.1.5 Prototype House FL-26 ...........................................................................................................20
3.2 FULL-SCALE ANALYSIS OF PRESSURE COEFFICIENTS ...................................................................21 3.2.1 Data Collection .......................................................................................................................21
3.3 NEAR REAL-TIME UPDATES..........................................................................................................22 3.4 VALIDATED WIND SPEED SUMMARY............................................................................................23 3.5 DATA ANALYSIS...........................................................................................................................25 3.6 WIND SPEED DATA AND PRESSURE COEFFICIENTS.......................................................................26 3.7 PRESSURE RESULTS FL-18 PROTOTYPE HOUSE............................................................................30
4. WIND TUNNEL TESTING...............................................................................................................32 4.1 WIND TUNNEL TESTING ...............................................................................................................32 4.2 MODELS .......................................................................................................................................33 4.3 DATA COLLECTION.......................................................................................................................34 4.4 COMPARISON OF FULL-SCALE AND MODEL-SCALE PRESSURE DATA...........................................36
5. WIND PRESSURE VISUALIZATION SOFTWARE ....................................................................39 5.1 BACKGROUND ..............................................................................................................................39 5.2 STRUCTURE OF THE PROGRAM .....................................................................................................42 5.3 RESULTS .......................................................................................................................................44 5.4 WEB PAGE....................................................................................................................................46
6. CONCLUSIONS.................................................................................................................................46 7. REFERENCES ...................................................................................................................................47

FIU Final Report RCMP Year 6: Wind Tunnel Section 6-iii
LIST OF FIGURES Figure 1. Tower Deployed for Data Collection. .................................................................5 Figure 2. Track of Hurricane Dennis and FCMP Towers and House Locations................8 Figure 3. Track of Hurricane Katrina and FCMP Towers and House Locations. ..............9 Figure 4. Track of Hurricane Rita and FCMP Towers and House Locations. ...................9 Figure 5. Track of Hurricane Wilma and FCMP Towers and House Locations...............10 Figure 6. Cardinal Directions for FL-18. ..........................................................................11 Figure 7. Roof Plan of Prototype FL-18 Showing Tap Locations. ...................................13 Figure 8. Front View of Prototype FL-18. ........................................................................14 Figure 9. Roof Plan of Prototype FL-19 Showing Tap Locations. ...................................15 Figure 10. Front View of Prototype FL-19. ......................................................................16 Figure 11. View of Prototype FL-19 Attached Porch at Rear of House...........................16 Figure 12. Roof Plan of Prototype FL-23 Showing Tap Locations. .................................17 Figure 13. Front View of Prototype FL-23. ......................................................................18 Figure 14. Roof Plan of Prototype FL-24 Showing Tap Locations. .................................19 Figure 15. Partial Front View of Prototype FL-24. ...........................................................19 Figure 16. Roof Plan of Prototype FL-26 Showing Tap Locations. .................................20 Figure 17. Front View of Prototype FL-26. ......................................................................21 Figure 20. Aerial View of Tower T0 Location During Hurricane Katrina..........................22 Figure 21. Plot of Wind Speed and Direction Collected by T3 - Hurricane Dennis. ........23 Figure 22. Plot of Wind Speed and Direction Collected by T1 - Hurricane Katrina. ........24 Figure 23. Plot of Wind Speed and Direction Collected by T0 - Hurricane Rita. .............24 Figure 24. Plot of Wind Speed and Direction Collected by T0 - Hurricane Wilma. .........25 Figure 30. Schematic of FL-18 with preliminary peak minimum pressure results. ..........30 Figure 31. Schematic of FL-19 with preliminary peak minimum pressure results. ..........31 Figure 32. Wind tunnel terrain arrangement for 1:50 suburban exposure.......................32 Figure 33. Wind Velocity and Turbulence Intensity Profile for 1:50 Suburban Terrain....33 Figure 34. Peak Minima and Maxima External Pressure Coefficients for FL-18.............35 Figure 35. Peak Minima and Maxima External Pressure Coefficients for FL-19.............36 Figure 36. Program Flowchart for the SeeBreeze Visualization Software. .....................39 Figure 37. Screenshot of the SeeBreeze Program .........................................................45 Figure 38. Rotated Views of the House Model Showing Pressure Contours. .................46

FIU Final Report RCMP Year 6: Wind Tunnel Section 6-iv
LIST OF TABLES Table 1. List of Storms with Wind Towers Deployments ..................................................4 Table 2. 2005 FCMP Wind Tower Deployments. .............................................................7 Table 3. Data Summary from Instrumented Houses Collected in 2005. ...........................8 Table 4. FCMP House Identifications and Locations. .....................................................12 Table 5. Comparison of ARA Model Wind Speeds to Full-scale Wind Speeds...............26 Table 6. Preliminary Uncorrected External Pressure Coefficients for FL-18 for 320˚. ....37 Table 7. Preliminary Uncorrected External Pressure Coefficients for FL-19 for 355˚. ....38

FIU Final Report RCMP Year 6: Wind Tunnel Section 6-v
SUMMARY
This report summarizes results of Clemson University’s continuing field research on wind effects on buildings during the land falling hurricanes of 2005. The project goal is to analyze field data of wind pressures and wind tunnel studies on model houses and compare pressure coefficients. The report presents results of full-scale pressure measurements made during tropical cyclones in the 2005 Hurricane season, experimental wind tunnel test results from scale model buildings and a pressure visualization prototype end-user software. Partial results are details are presented through the World-Wide Web. The report was prepared by David O. Prevatt, Ph.D., Assistant Professor and Director of the Wind Load Test Facility at Clemson University. The author wishes to acknowledge the contributions of Clemson University graduate and undergraduate students who participated in this research and assisted with the final preparation of the report. In particular, recognition is paid to two graduate students, Mr. Russell R. Carter who led field investigation exercises and to Mr. Peter L. Datin who carried out full-scale and wind tunnel analyses of pressure data. The author is grateful for the contributions and consultation with Dr. Stanley T. Birchfield, Assistant Professor of Electrical and Computer Engineering at Clemson University and his students for leading the research effort to develop the pressure visualization software. KEYWORDS: Aerodynamics, boundary layer, buildings, wind engineering, full-scale, wind tunnels, suburban terrain, residential. _____________________________________________________________________

FIU Final Report RCMP Year 6: Wind Tunnel Section 6-1
1. PROJECT SCOPE
The primary goal of this project is analysis of field data of wind pressures and wind
tunnel studies on models of houses located in a typical Florida neighborhood. The
pressure measurements were recorded during the passage of four hurricanes during the
2004 Hurricane season. The report presents results on the following sub-tasks described
below:
Subtask 1 – Data Analysis of Field Data on neighborhood houses
Five instrumented prototype homes were hit by tropical cyclone-strength winds during
2005, yielding pressure and wind speed data for further analysis. The field data included
near-ground level hurricane-strength wind speeds and directions, and pressure
measurements from sensors located in critical corner roof areas of houses situated in
residential neighborhoods. We performed the following scope:
1. Conduct field investigations at the houses to record location of surrounding
buildings, and large obstructions relative to the prototype house. 2. Analyze pressure server data and available wind speed data to derive pressure
coefficient time-histories for the houses affected by the hurricanes. Subtask 2 – Wind Tunnel Model Studies
ASCE 7 wind design pressure coefficients are based on research conducted in boundary
layer wind tunnels. There is limited full-scale data available to validate wind load results.
Wind tunnel studies on models of the prototype houses need to be compared to full-
scale results with wind tunnel studies.
Conduct wind tunnel studies to develop a pressure coefficient database to serve as a
baseline for future studies that include the wind load variation in open and suburban
terrain.
1. Construct 1:50 scale geometrically-similar models of the prototype houses,
measure pressures at equivalent locations to full-scale, and determine the pressure coefficients at pressure taps for the incident wind direction of the storm.
2. Compare wind tunnel test results for incident wind with prototype pressure data derived from the houses in the storm direction.

FIU Final Report RCMP Year 6: Wind Tunnel Section 6-2
Subtask 3 – Wind Pressure Visualization To aid in the review and analysis of this data, wind tunnel studies require analysis of
very large volumes of data, since a high sampling rate is needed (greater than 400
samples per second) and models need a dense tap array of several hundred pressure
taps. Developing prototype end-user visualization software would be vital to achieve this
goal. The proposed software should be capable of 3D-display of pressure distributions,
and provide flexibility to allow the user view model at any rotation, translation, or scale.
1. Develop a file format to relate the wind pressure statistical data with the 3D
building geometry structure and coordinates of the pressure sensors. 2. Write software to parse the statistical data, and to display results in 3D.
2. BACKGROUND
Hurricanes remain one of the most costly natural hazards within the United States. The
average annual loss due to windstorm damage in the East and Gulf Coast states is
about $5 billion. Recent hurricane damage in 2005 from Hurricanes Katrina, Rita and
Wilma highlight the vulnerability of residential buildings in coastal areas. Damage from
high winds disproportionately affects low-rise residential buildings located along
vulnerable coastal areas of the Carolinas, Florida and Gulf States. The provision of
reliable scientific information that relates damaging wind speeds with failure loads of
building components is needed to evaluate the effectiveness of retrofit and existing
structural design of houses and to validate current methodologies for boundary layer
wind tunnel tests.
The analysis of time-histories of wind speeds and wind-induced pressures on buildings
are critical for post-storm engineering analyses of building damage. However, existing
anemometers at regional airports typically do not provide the high-quality data on wind
characteristics and in many cases, these anemometers typically are switched off or prior
to the storm or lose power during the event. In addition, typically the flat, airport terrain

FIU Final Report RCMP Year 6: Wind Tunnel Section 6-3
around the anemometers are not representative of the rougher suburban environments
in which most homes are located.
To address this shortfall, the Florida Coastal Monitoring Program, started in 1998, has
conducted field measurements of hurricane wind velocities and wind-induced pressures
on residential buildings. This related study carries out model scale experiments in
Clemson’s boundary layer wind tunnel and provides a comparison between full-scale
and model scale wind pressures.
Until recently there has been very limited data available on the full-scale pressure
distribution for low-rise buildings exposed to hurricane-force winds. The majority of
previous full-scale and wind tunnel studies (Levitan and Mehta 1992) focused primarily
on commercial construction that built in less complex terrain and with simpler building
shapes than the typical residential neighborhood. In addition, the few wind tunnel
studies on houses used relatively simple house shapes (Holmes 1982) that did not
incorporate intersecting roofs and architectural features commonly seen in residential
neighborhoods today.
Even fewer full-scale wind tunnel results are available for houses located in suburban
exposures. As a result, building codes currently provide neither wind pressure
coefficients nor sufficient guidance for estimating wind loads for typical residential
construction with complex shapes and architectural features. Residential structures
typically have suffered more damage than commercial structures, owing to the
prescriptive nature of building codes for non-engineered structures and limited wind
design guides. There is an urgent need to understand the wind load generated on low-
FIU Final Report RCMP Year 6: Wind Tunnel Section 6-4
rise buildings and to improve building code provisions to address the design
requirements for these unique geometries.
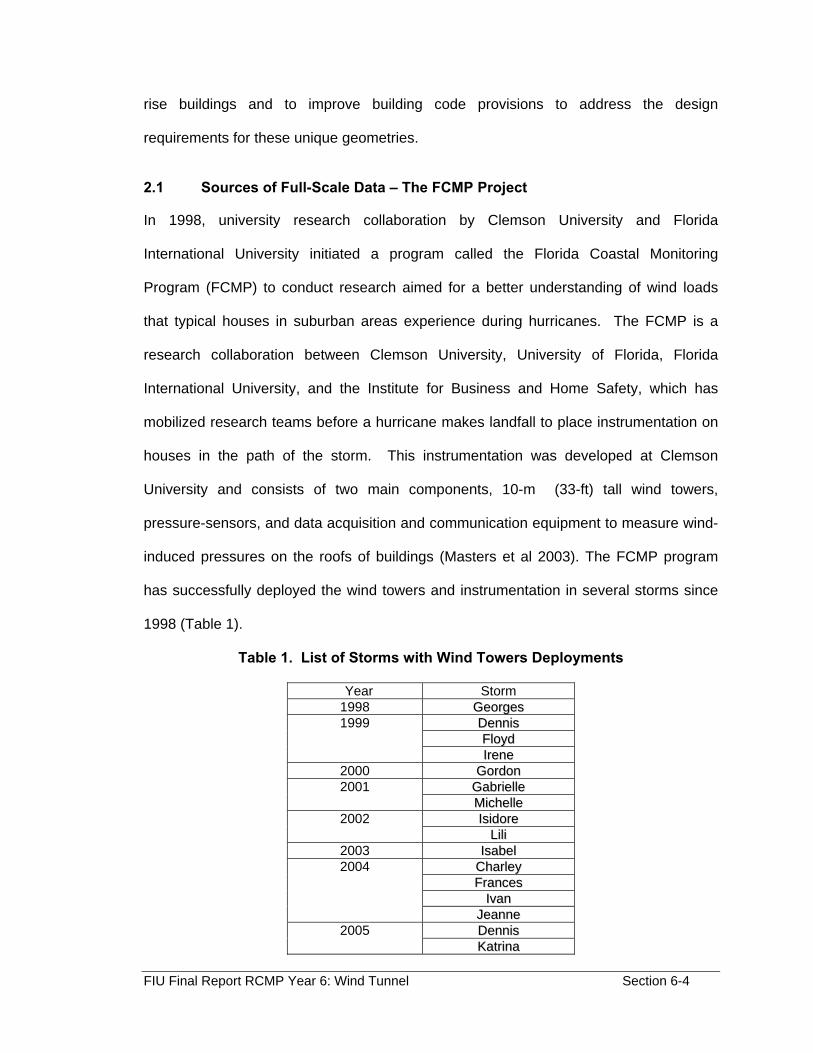
2.1 Sources of Full-Scale Data – The FCMP Project
In 1998, university research collaboration by Clemson University and Florida
International University initiated a program called the Florida Coastal Monitoring
Program (FCMP) to conduct research aimed for a better understanding of wind loads
that typical houses in suburban areas experience during hurricanes. The FCMP is a
research collaboration between Clemson University, University of Florida, Florida
International University, and the Institute for Business and Home Safety, which has
mobilized research teams before a hurricane makes landfall to place instrumentation on
houses in the path of the storm. This instrumentation was developed at Clemson
University and consists of two main components, 10-m (33-ft) tall wind towers,
pressure-sensors, and data acquisition and communication equipment to measure wind-
induced pressures on the roofs of buildings (Masters et al 2003). The FCMP program
has successfully deployed the wind towers and instrumentation in several storms since
1998 (Table 1).
Table 1. List of Storms with Wind Towers Deployments
Year Storm 1998 GGeeoorrggeess
DDeennnniiss FFllooyydd
1999
IIrreennee 2000 GGoorrddoonn
GGaabbrriieellllee 2001 MMiicchheellllee IIssiiddoorree 2002
LLiillii 2003 IIssaabbeell
CChhaarrlleeyy FFrraanncceess
IIvvaann
2004
JJeeaannnnee DDeennnniiss 2005 KKaattrriinnaa

FIU Final Report RCMP Year 6: Wind Tunnel Section 6-5
RRiittaa WWiillmmaa
The following sections briefly explain the main FCMP instrumentation components:
• Wind Anemometer Towers – Portable towers designed to resist 200 mph
winds support instruments to measure wind speed at 5 m and 10 m heights,
temperature and barometric pressure changes during a hurricane (see Figure
1). Summary wind speed data is collected from each tower and stored on a
computer before being transmitted in near real-time to the World Wide Web,
http://users.ce.ufl.edu/~fcmp/. Currently six self-powered wind towers are
available for deployment.
Figure 1. Tower Deployed for Data Collection.

FIU Final Report RCMP Year 6: Wind Tunnel Section 6-6
• Pressure Sensors on Residential Buildings – Pre-selected and pre-wired
residential structures located in suburban neighborhoods are fitted with
pressure sensors prior to a hurricane landfall. Battery operated computers
collect the time histories of wind induced pressures from up to 28 absolute
pressure transducers installed on the roofs of the buildings. An additional
pressure transducer, located either in the attic or in the yard, away from the
structure, identified as the reference pressure transducer, is used to monitor
changes in atmospheric pressure. This reference pressure gage is necessary to
convert pressures measured at roof sensors to the non-dimensional pressure
coefficients.
2.2 The 2005 Hurricane Season Deployments
2005 was the most active hurricane season on record, with 28 named storms, with four
of those making landfall in the United States. Hurricane Dennis (Figure 2) was the first
storm to make landfall, affecting both the Louisiana and Florida coasts. The season was
most memorable for Hurricane Katrina (Figure 3), which became the most costly
hurricane disaster to hit the US, resulting in over 1800 deaths and over $100 billion in
damage. Hurricane Rita (Figure 4) caused several hours of traffic gridlock as residents
of Galveston County, Texas, attempted to evacuate the coast. Hurricane Wilma (Figure
5) made landfall in Florida’s Gulf Coast and caused damage that included the failures of
glass curtain-wall structures in Miami, FL.
The FCMP program deployed wind towers in all four events and collected 817 hours of
wind speed and directional data (Table 2). Additionally, the five instrumented houses in
the FCMP that were hit by hurricane-force winds yielded approximately 204 hours of
wind-pressure data (Table 3). Three houses were subjected to hurricane force winds

FIU Final Report RCMP Year 6: Wind Tunnel Section 6-7
during Hurricane Dennis (peak 3-second gusts of 54 m/s (121 mph)), two in Destin, FL,
and one in Navarre, FL (Figure 2). Hurricane Wilma (peak 3-second gusts of 49 m/s
(109 mph)) struck the other two houses, one located in Naples, FL, and the other in
Marco Island, FL (Figure 5).
Table 2. 2005 FCMP Wind Tower Deployments.
Tower Data
Storm Tower Number of
Files Hours of
Data Dennis T0 22 5.5 T2 138 34.5 T3 101 25.25 Katrina T0 92 23 T1 104 26 T2 56 14 T3 77 19.25 T5 29 7.25 Rita T0 102 25.5 T1 53 13.25 T3 74 18.5 T5 105 26.25 Wilma T0 75 18.75 T1 57 14.25 T2 62 15.5 T3 16 4

FIU Final Report RCMP Year 6: Wind Tunnel Section 6-8
Table 3. Data Summary from Instrumented Houses Collected in 2005.
House Data
Storm House
No. Number of
Files Hours of
Data Wind
Speed Wind
Direction Reference Pressure
# of Pressure
Taps Dennis FL-23 173 43.25 No Yes Yes 23 FL-24 130 32.5 Yes Yes No 26 FL-26 149 37.25 Yes Yes Yes 20 Wilma FL-18 189 47.25 Yes Yes Yes 26 FL-19 176 44 Yes Yes Yes 25 Totals 817 204.25
Figure 2. Track of Hurricane Dennis and FCMP Towers and House Locations.

FIU Final Report RCMP Year 6: Wind Tunnel Section 6-9
Figure 3. Track of Hurricane Katrina and FCMP Towers and House Locations.
Figure 4. Track of Hurricane Rita and FCMP Towers and House Locations.

FIU Final Report RCMP Year 6: Wind Tunnel Section 6-10
Figure 5. Track of Hurricane Wilma and FCMP Towers and House Locations.
3. FULL-SCALE DATA COLLECTION AND ANALYSIS
3.1 Field Surveys of Prototype Houses
In January and February 2006, a team of Clemson University civil engineering students,
led by Russell Carter and including Peter Datin, Stephen Furr and Kenneth Hill,
conducted field surveys of the five houses that were hit by strong winds in the 2005
hurricane season (see Table 4). The team documented the dimensions of the prototype
houses and of its immediate neighboring buildings and verified locations of the pressure
sensors on the roofs of these buildings. The team used digital photographs of the terrain
and surroundings in eight cardinal directions around the house (shown in Figure 6).

FIU Final Report RCMP Year 6: Wind Tunnel Section 6-11
North Northeast
East Southeast
South Southwest
West Northwest Figure 6. Cardinal Directions for FL-18.

FIU Final Report RCMP Year 6: Wind Tunnel Section 6-12
Table 4. FCMP House Identifications and Locations.
House Identification
Number City, State Hurricane Latitude Longitude
Date of Field
Survey
FL-18 Marco Island, FL Wilma 25° 56’ 30.4” 81° 42’ 53.1” 1/21/06
FL-19 Naples, FL Wilma 26° 15’ 23.4” 81° 49’ 1.0” 1/21/06
FL-23 Destin, FL Dennis 30° 23’ 15.2” 86° 22’ 4.7” 2/3/06
FL-24 Destin, FL Dennis 30° 23’ 35.9” 86° 29’ 29.2” 2/3/06
FL-26 Navarre, FL Dennis 30° 26’ 2.4” 86° 52’ 39.4” 2/4/06
Field documentation of neighborhoods is needed in order to create scale models of the
prototype building’s immediate surroundings in the wind tunnel. Accurate measurements
of pressure tap locations are also needed to ensure agreement between the prototype
and scale-model structures. Brief descriptions of the prototype houses follows below:
3.1.1 Prototype House FL-18
The FL-18 House is a single-story, L-shaped house on Marco Island, Florida (Figure 7).
The roof shape consists of inter-connected Dutch-hips and a gable end roof over the
garage. The house has extensive lawns with low hedges along the property boundaries
(Figure 8). There are a few ornamental trees that are approximately 30 ft or less in
height. The surrounding houses are approximately similar in size to the prototype
house.

FIU Final Report RCMP Year 6: Wind Tunnel Section 6-13
17
1620
19 23 24
27
26
65'-6"
28'
35'-4"
65'-6"
37'-6"
30'-2"
25
28
22
21
15
141364 5
110
1211
87
9
NO
RTH
Figure 7. Roof Plan of Prototype FL-18 Showing Tap Locations.

FIU Final Report RCMP Year 6: Wind Tunnel Section 6-14
Figure 8. Front View of Prototype FL-18.
3.1.2 Prototype House FL-19
The FL-19 House is a single-story rectangular house measuring approximately 49 ft by
39 ft in plan and approximately 15 ft 7 in tall at the roof ridge (Figure 9). The roof
structure is a Dutch-hip shape with low-sloped roofs over the porch at the rear of the
home (Figure 10 and 11).
Some of the neighboring lots are densely covered with vegetation and trees, while other
lots are sparsely covered. Maximum tree height ranges between 30 and 40 ft.

FIU Final Report RCMP Year 6: Wind Tunnel Section 6-15
123
56
49'-2"
39'-1"
78
1011
131415
161718
20212223
26 242528
1927
16'-3" 8'-2" 11'-8"
11'-7"11'-10"
9'-5"
NO
RTH
Figure 9. Roof Plan of Prototype FL-19 Showing Tap Locations.

FIU Final Report RCMP Year 6: Wind Tunnel Section 6-16
Figure 10. Front View of Prototype FL-19.
Figure 11. View of Prototype FL-19 Attached Porch at Rear of House.
FIU Final Report RCMP Year 6: Wind Tunnel Section 6-17
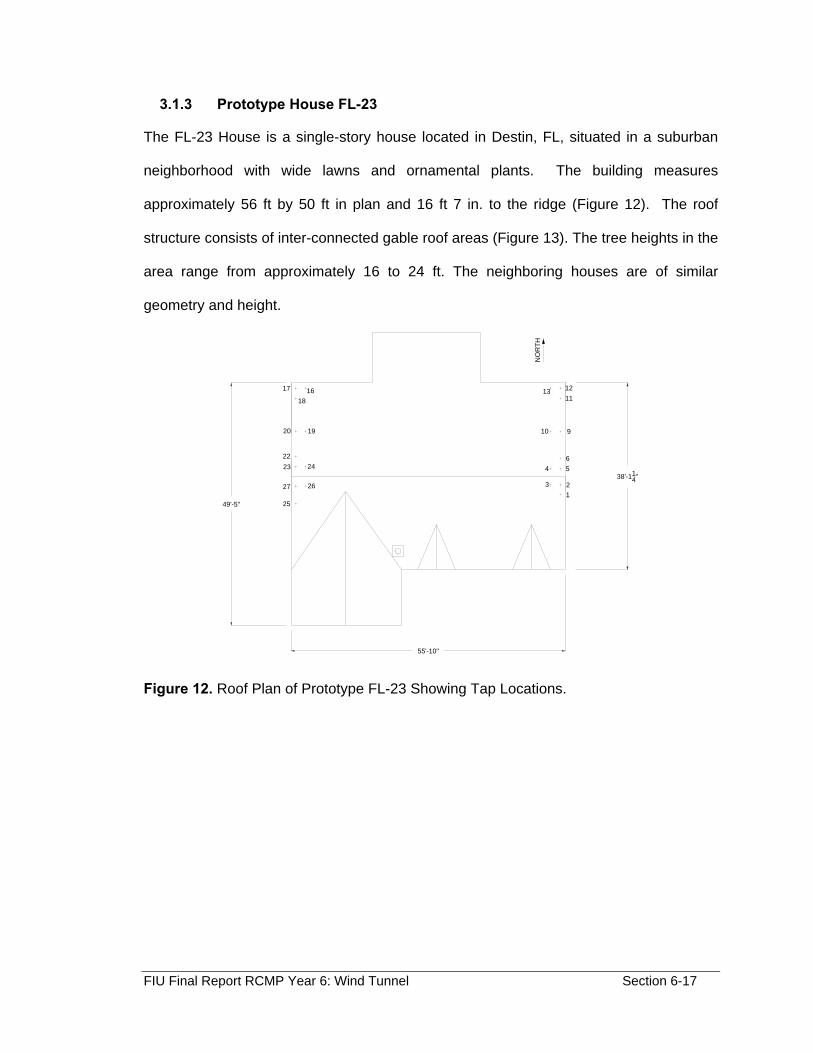
3.1.3 Prototype House FL-23
The FL-23 House is a single-story house located in Destin, FL, situated in a suburban
neighborhood with wide lawns and ornamental plants. The building measures
approximately 56 ft by 50 ft in plan and 16 ft 7 in. to the ridge (Figure 12). The roof
structure consists of inter-connected gable roof areas (Figure 13). The tree heights in the
area range from approximately 16 to 24 ft. The neighboring houses are of similar
geometry and height.
55'-10"
38'-114"
49'-5"123
546
10 9
111213
18
17 16
20 19
2223 24
27 26
25
NO
RTH
Figure 12. Roof Plan of Prototype FL-23 Showing Tap Locations.

FIU Final Report RCMP Year 6: Wind Tunnel Section 6-18
Figure 13. Front View of Prototype FL-23.
3.1.4 Prototype House FL-24
The FL-24 House is a single-story house located on flat site in Destin, Florida. The
building measures approximately 72 ft by 45 ft in plan and is 13 ft 3 in tall at the roof
ridge (Figure 14). The roof structure consists of relatively low-sloped inter-connected
gable roof areas, and the center section is approximately 6 in. taller than either side
(Figure 15).
There is a mix of ornamental, deciduous, and pine trees within the neighborhood,
ranging in height from 1 to 1.5 times the ridge height of FL-24. The neighboring
structures vary in geometry but are of similar height. 6 ft tall wood fences surround most
of the backyards in the neighborhood.

FIU Final Report RCMP Year 6: Wind Tunnel Section 6-19
123
5 6
10 9
7
12
1317 16
20 19
2223 24
27 26
21 8
15
28
24'-1" 24'-114"24'-21
4"
30'-1012"
NO
RTH
Figure 14. Roof Plan of Prototype FL-24 Showing Tap Locations.
Figure 15. Partial Front View of Prototype FL-24.
FIU Final Report RCMP Year 6: Wind Tunnel Section 6-20
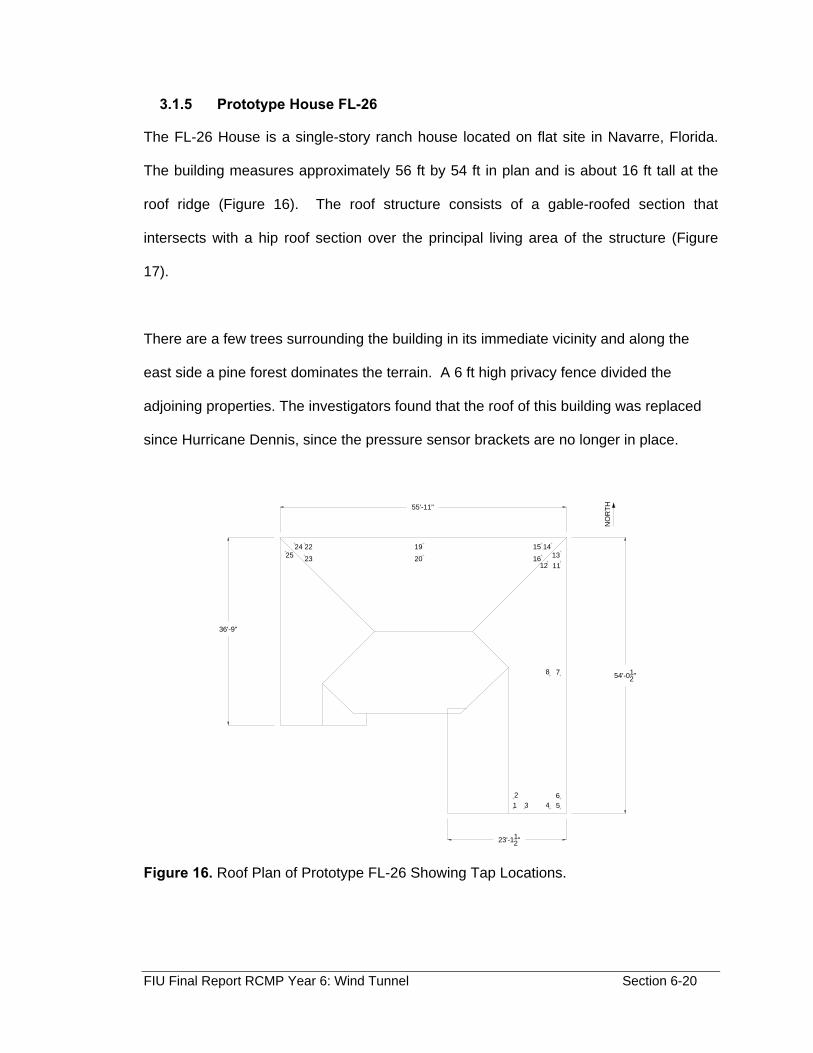
3.1.5 Prototype House FL-26
The FL-26 House is a single-story ranch house located on flat site in Navarre, Florida.
The building measures approximately 56 ft by 54 ft in plan and is about 16 ft tall at the
roof ridge (Figure 16). The roof structure consists of a gable-roofed section that
intersects with a hip roof section over the principal living area of the structure (Figure
17).
There are a few trees surrounding the building in its immediate vicinity and along the
east side a pine forest dominates the terrain. A 6 ft high privacy fence divided the
adjoining properties. The investigators found that the roof of this building was replaced
since Hurricane Dennis, since the pressure sensor brackets are no longer in place.
56
4
1213
1 32
55'-11"
54'-012"
36'-9"
23'-112"
NO
RTH
78
11
1415
16
19
202524 22
23
Figure 16. Roof Plan of Prototype FL-26 Showing Tap Locations.
FIU Final Report RCMP Year 6: Wind Tunnel Section 6-21
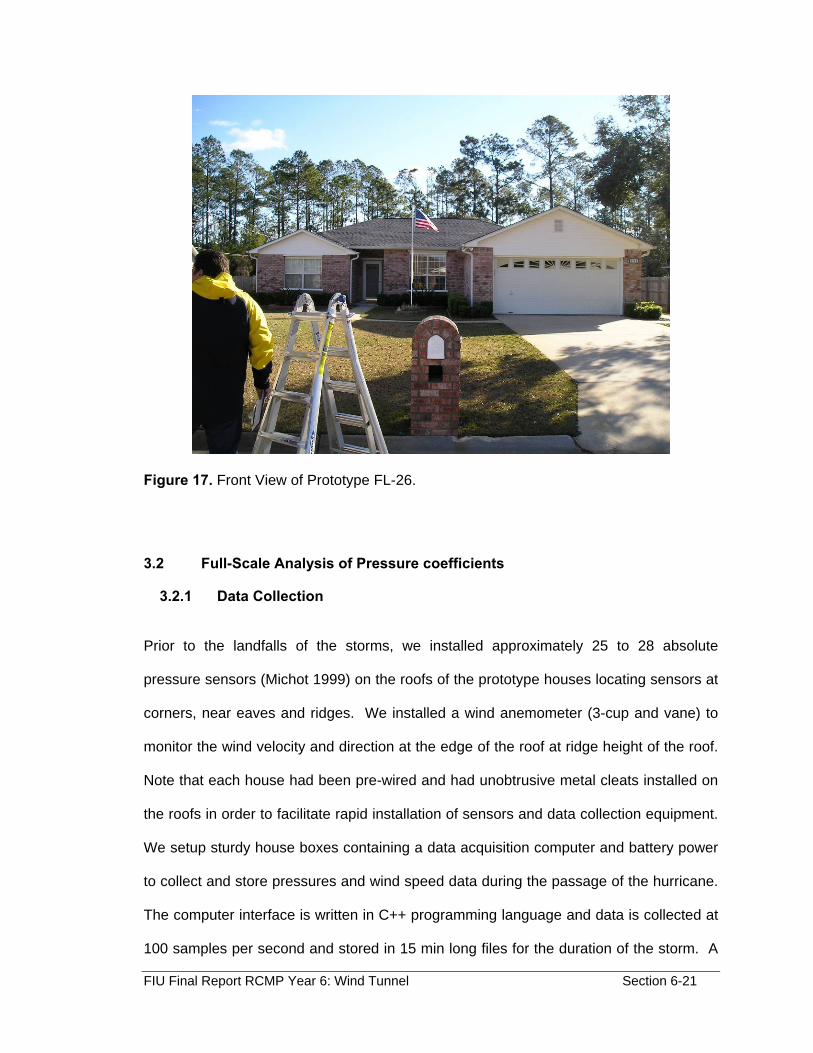
Figure 17. Front View of Prototype FL-26.
3.2 Full-Scale Analysis of Pressure coefficients
3.2.1 Data Collection
Prior to the landfalls of the storms, we installed approximately 25 to 28 absolute
pressure sensors (Michot 1999) on the roofs of the prototype houses locating sensors at
corners, near eaves and ridges. We installed a wind anemometer (3-cup and vane) to
monitor the wind velocity and direction at the edge of the roof at ridge height of the roof.
Note that each house had been pre-wired and had unobtrusive metal cleats installed on
the roofs in order to facilitate rapid installation of sensors and data collection equipment.
We setup sturdy house boxes containing a data acquisition computer and battery power
to collect and store pressures and wind speed data during the passage of the hurricane.
The computer interface is written in C++ programming language and data is collected at
100 samples per second and stored in 15 min long files for the duration of the storm. A
FIU Final Report RCMP Year 6: Wind Tunnel Section 6-22
typical data record for one house would contain 150 to 200 files covering 30 to 40 hours.
The wind speed data from the 3-cup anemometer is reported directly in mph and is a 3-
second gust wind speed.
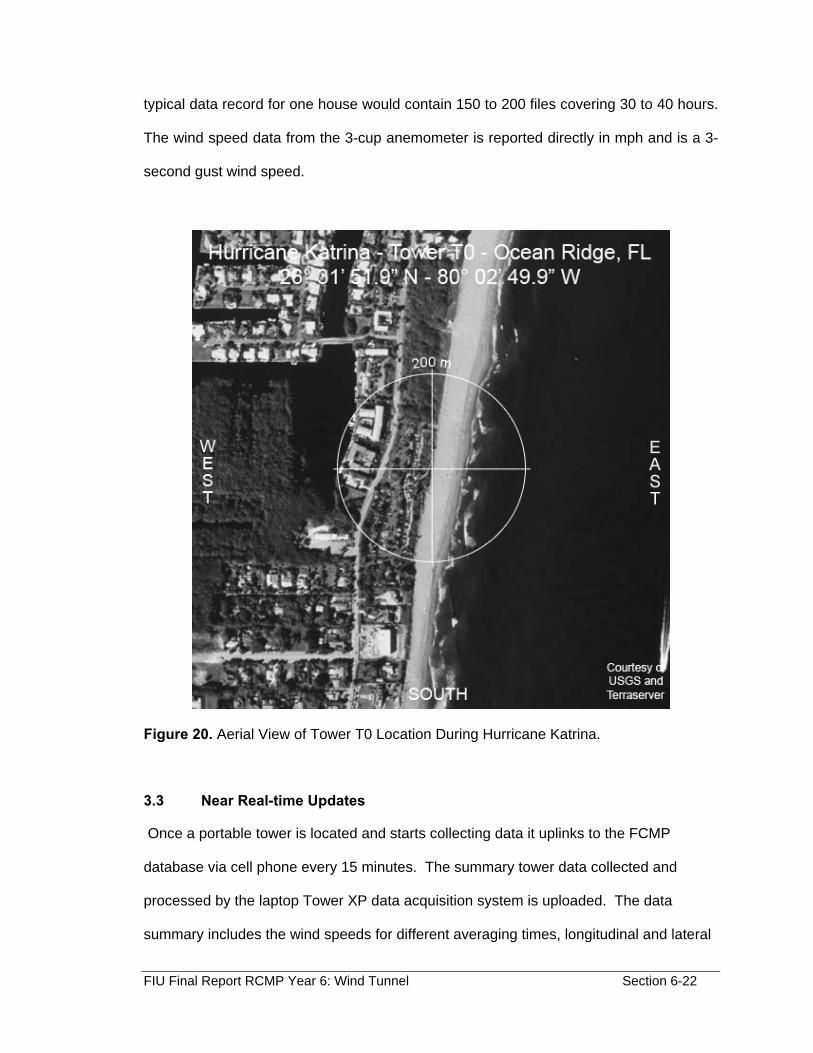
Figure 20. Aerial View of Tower T0 Location During Hurricane Katrina.
3.3 Near Real-time Updates
Once a portable tower is located and starts collecting data it uplinks to the FCMP
database via cell phone every 15 minutes. The summary tower data collected and
processed by the laptop Tower XP data acquisition system is uploaded. The data
summary includes the wind speeds for different averaging times, longitudinal and lateral
FIU Final Report RCMP Year 6: Wind Tunnel Section 6-23
turbulence intensity, temperature, relative humidity, and barometric pressure. The two
most predominantly used numbers are the 3 sec gust speed and the 60 sec mean wind
speed from the 10 m anemometers.
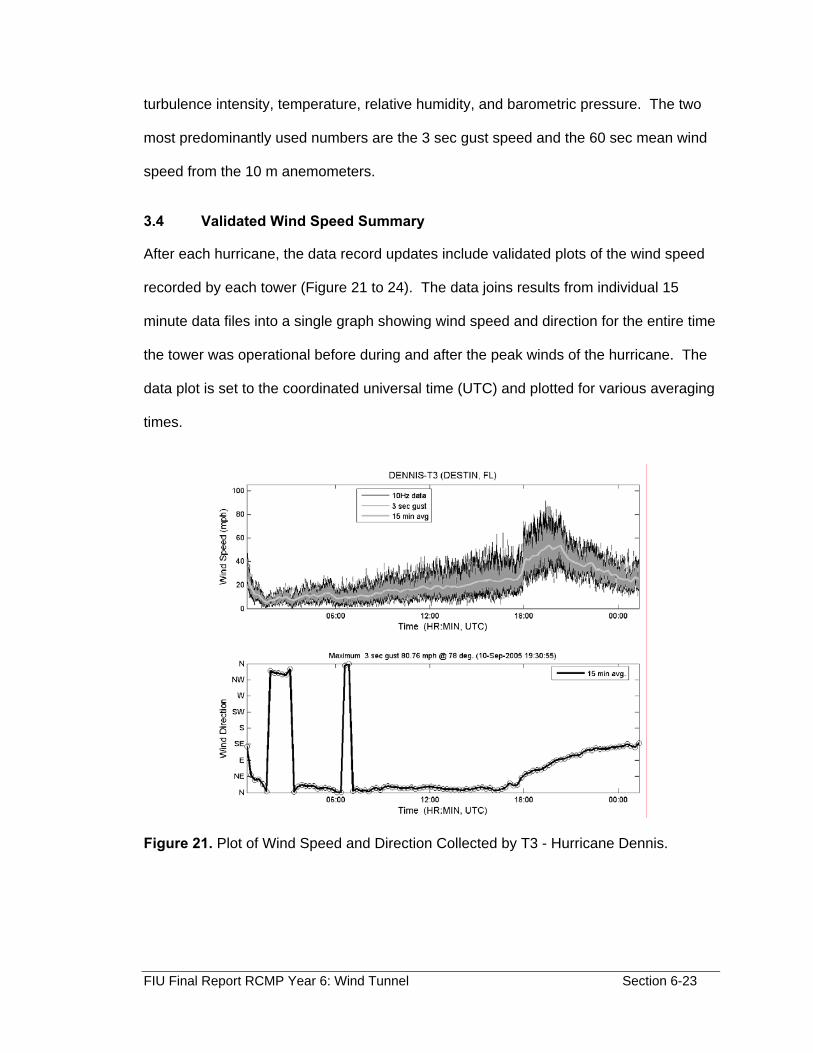
3.4 Validated Wind Speed Summary
After each hurricane, the data record updates include validated plots of the wind speed
recorded by each tower (Figure 21 to 24). The data joins results from individual 15
minute data files into a single graph showing wind speed and direction for the entire time
the tower was operational before during and after the peak winds of the hurricane. The
data plot is set to the coordinated universal time (UTC) and plotted for various averaging
times.
Figure 21. Plot of Wind Speed and Direction Collected by T3 - Hurricane Dennis.

FIU Final Report RCMP Year 6: Wind Tunnel Section 6-24
Figure 22. Plot of Wind Speed and Direction Collected by T1 - Hurricane Katrina.
Figure 23. Plot of Wind Speed and Direction Collected by T0 - Hurricane Rita.

FIU Final Report RCMP Year 6: Wind Tunnel Section 6-25
Figure 24. Plot of Wind Speed and Direction Collected by T0 - Hurricane Wilma.
3.5 Data Analysis
For every pressure sensor output reading, we used a pressure calibration chart to
convert raw voltage to engineering units (i.e. pound per square foot (psf)). We used the
pressure values obtained at a reference sensor located a short distance away from the
house to establish changes in ambient barometric pressure. We subtracted this
barometric pressure reading from each roof top sensor value and made temperature
corrections to obtain the wind-induced pressures on the roof, as developed in (Dearhart
2003).

FIU Final Report RCMP Year 6: Wind Tunnel Section 6-26
3.6 Wind Speed Data and Pressure Coefficients
Applied Research Associates (ARA), Raleigh, NC provided the simulated wind speed
and directional information used in this analysis. We selected this data because it is
based on a wide collection of independent data sources and has its methodology has
shown to provide reasonable results. A comparison of the ARA’s simulated wind speed
and the measured wind speed for each of the houses is provided in Table 5. The ARA
model simulated wind speeds in open terrain at 10 m height and we adjusted these
values, using theoretical conversion (Simiu, 1996), to reflect the 3 sec gust speed to
suburban terrain and ridge height of the house roof. In our analysis, we used the wind
speed estimates developed by Applied Research Associates (ARA 2006) provided in
Figures 25 through 29.
Table 5. Comparison of ARA Model Wind Speeds to Full-scale Wind Speeds.
ARA Model Data Full Scale Data
House Peak 3 Sec. Gust Wind
Speed (mph)1
Corrected Peak 3 Sec. Gust Wind
Speed (mph)2
Wind Direction (degrees)
Peak 3 Sec. Gust
Speed (mph)3
Peak 15 Min. Wind
Speed (mph)3
Wind Direction (degrees)
FL-18 110 70 319 N/A N/A N/A
FL-19 104 64 355 N/A N/A N/A
FL-23 77 48 133 N/A N/A N/A
FL-24 85 51 109 58 45 N/A
FL-26 117 72 141 44 36 N/A
1. Simulated in open terrain at 10 meter height. 2. Corrected for suburban terrain at mean roof height. 3. Peak wind speeds were measured at roof height and in suburban terrain.
We adjusted the roof pressure measurements for atmospheric pressure and temperature
changes during the storm. We used temperature measurements from the

FIU Final Report RCMP Year 6: Wind Tunnel Section 6-27
meteorological towers located near to the prototype houses for temperature corrections.
Using the roof pressure and wind speed we calculated the external pressure coefficients
at the sensor locations on the roof using the formula given below:
20.00256p
PCV
= Eqn. 1
Simulated Wind Speed and Direction for FL-18 During Hurricane WilmaCoordinates: 25.94177800 N Latitude and -81.71475000 W Longitude
0
10
20
30
40
50
60
70
80
90
100
110
120
10/22/2
005 15
:36
10/22
/2005 19:1
2
10/22/2
005 22
:48
10/23
/2005 2:24
10/23/2
005 6:
00
10/23/2
005 9:
36
10/23
/2005 13
:12
10/23/2
005 16
:48
10/23/2
005 20
:24
10/24/2
005 0:
00
10/24/2
005 3:
36
10/24
/2005 7:12
10/24
/2005 10:4
8
10/24/2
005 14
:24
10/24
/2005 18:0
0
10/24/2
005 21
:36
10/25
/2005 1:
12
10/25/2
005 4:
48
10/25/2
005 8:
24
Time (hours)
Win
d G
ust S
peed
(mph
)
0
30
60
90
120
150
180
210
240
270
300
330
360
Win
d D
irect
ion
(deg
rees
)
Gust wind speed (3 sec) in open terrain
Direction
Maximum Wind Speed is 110 mph at 319 degrees
Figure 25. ARA’s modeled wind speed and direction at the FL-18 site.

FIU Final Report RCMP Year 6: Wind Tunnel Section 6-28
Simulated Wind Speed and Direction for FL-19 During Hurricane WilmaCoordinates: 26.25650000 N Latitude and -81.81694400 W Longitude
0
20
40
60
80
100
120
10/22
/2005
15:36
10/22
/2005
19:12
10/22
/2005
22:48
10/23
/2005
2:24
10/23
/2005
6:00
10/23
/2005
9:36
10/23
/2005
13:12
10/23
/2005
16:48
10/23
/2005
20:24
10/24
/2005
0:00
10/24
/2005
3:36
10/24
/2005
7:12
10/24
/2005
10:48
10/24
/2005
14:24
10/24
/2005
18:00
10/24
/2005
21:36
10/25
/2005
1:12
10/25
/2005
4:48
10/25
/2005
8:24
Time (hours)
Win
d G
ust S
peed
(mph
)
0
30
60
90
120
150
180
210
240
270
300
330
360
Win
d D
irect
ion
(deg
rees
)
Gust wind speed (3 sec) in open terrainDirection
Maximum Wind Speed is 104 mph at 355 degrees
Figure 26. ARA’s modeled wind speed and direction at the FL-19 site.
Simulated Wind Speed and Direction for FL-23 During Hurricane DennisCoordinates: 30.38755600 N Latitude and -86.36797200 W Longitude
0
10
20
30
40
50
60
70
80
90
7/9/20
05 22
:48
7/10/2
005 2
:24
7/10/2
005 6
:00
7/10/2
005 9
:36
7/10/2
005 1
3:12
7/10/2
005 1
6:48
7/10/2
005 2
0:24
7/11/2
005 0
:00
7/11/2
005 3
:36
7/11/2
005 7
:12
7/11/2
005 1
0:48
7/11/2
005 1
4:24
7/11/2
005 1
8:00
7/11/2
005 2
1:36
Time (hours)
Win
d G
ust S
peed
(mph
)
0
30
60
90
120
150
180
210
240
270
300
330
360
Win
d D
irect
ion
(deg
rees
)
Gust wind speed (3 sec) in open terrainDirection
Maximum Wind Speed is 78 mph at 133 degrees
Figure 27. ARA’s modeled wind speed and direction at the FL-23 site.

FIU Final Report RCMP Year 6: Wind Tunnel Section 6-29
Simulated Wind Speed and Direction for FL-24 During Hurricane DennisCoordinates: 30.39330600 N Latitude and -86.49144400 W Longitude
0
10
20
30
40
50
60
70
80
90
7/10/2
005 9
:36
7/10/2
005 1
3:12
7/10/2
005 1
6:48
7/10/2
005 2
0:24
7/11/2
005 0
:00
7/11/2
005 3
:36
7/11/2
005 7
:12
7/11/2
005 1
0:48
7/11/2
005 1
4:24
7/11/2
005 1
8:00
7/11/2
005 2
1:36
Time (hours)
Win
d G
ust S
peed
(mph
)
0
30
60
90
120
150
180
210
240
270
300
330
360
Win
d D
irect
ion
(deg
rees
)
Gust wind speed (3 sec) in open terrainDirection
Maximum Wind Speed is 85 mph at 109 degrees
Figure 28. ARA’s modeled wind speed and direction at the FL-24 site.
Simulated Wind Speed and Direction for FL-26 During Hurricane DennisCoordinates: 30.43400000 N Latitude and -86.87761100 W Longitude
0
20
40
60
80
100
120
140
7/9/20
05 22
:48
7/10/2
005 2
:24
7/10/2
005 6
:00
7/10/2
005 9
:36
7/10/2
005 1
3:12
7/10/2
005 1
6:48
7/10/2
005 2
0:24
7/11/2
005 0
:00
7/11/2
005 3
:36
7/11/2
005 7
:12
7/11/2
005 1
0:48
7/11/2
005 1
4:24
7/11/2
005 1
8:00
7/11/2
005 2
1:36
Time (hours)
Win
d G
ust S
peed
(mph
)
0
30
60
90
120
150
180
210
240
270
300
330
360
Win
d D
irect
ion
(deg
rees
)
Gust wind speed (3 sec) in open terrainDirection
Maximum Wind Speed is 117 mph at 141degrees
Figure 29. ARA’s modeled wind speed and direction at the FL-26 site.

FIU Final Report RCMP Year 6: Wind Tunnel Section 6-30
3.7 Pressure Results FL-18 Prototype House
The FL-18 House experienced a peak 3-second gust wind speeds of 31 m/s (70 mph)
during Hurricane Wilma, from a direction of 355 degrees.
17
1620
19 23 24
27
26
25
28
22
2115
141364 5
110
1211
87
9
NO
RTH
Figure 30. Schematic of FL-18 with preliminary peak minimum pressure results.
Tap Cp 1 NA 4 -3.40 5 -3.25 6 -2.97 7 -3.53 8 -3.61 9 -2.76 10 -1.87 11 -2.28 12 -2.78 13 -1.52 14 -1.72 15 -2.65 16 -2.48 17 -2.51 19 -2.82 20 -3.58 21 -3.01 22 -2.94 23 -0.50 24 -1.41 25 -3.84 26 -2.81 27 -2.47 28 -3.83

FIU Final Report RCMP Year 6: Wind Tunnel Section 6-31
The FL-18 House experienced a peak 3-second gust wind speeds of 31 m/s (70 mph)
during Hurricane Wilma, from a direction of 355 degrees.
123
56
78
1011
131415
161718
20212223
26 242528
1927
NO
RTH
Figure 31. Schematic of FL-19 with preliminary peak minimum pressure results.
Tap Cp 1 NA 4 -3.40 5 -3.25 6 -2.97 7 -3.53 8 -3.61 9 -2.76 10 -1.87 11 -2.28 12 -2.78 13 -1.52 14 -1.72 15 -2.65 16 -2.48 17 -2.51 19 -2.82 20 -3.58 21 -3.01 22 -2.94 23 -0.50 24 -1.41 25 -3.84 26 -2.81 27 -2.47 28 -3.83

FIU Final Report RCMP Year 6: Wind Tunnel Section 6-32
4. WIND TUNNEL TESTING
4.1 Wind Tunnel Testing
We conducted wind tunnel studies on models of the prototype structures in the
atmospheric boundary layer wind tunnel at the Wind Load Test Facility (WLTF) of
Clemson University. This open flow boundary layer wind tunnel has a working section
that measures 3 m (10 ft) wide and 2 m (6.7 ft) high and overall length of 30 m (100 ft).
We simulated upwind terrain at 1:50 geometric scale and modeled the velocity and
turbulence intensity profiles to model suburban exposure. Details of the tunnel set up
(Figure 25) and instrumentation are provided by Chen (Chen 2000).
We established the velocity and turbulence intensity profiles by using a combination of
spires measuring 241.3 mm (9.5 in) wide at the top and 406.4 mm (16 in) wide at the
base), a 25.4 mm x 203.2 mm (1 in x 8 in) trip board at the based of the spires, and 76.2
mm (3 in) cube roughness elements randomly installed along the wind tunnel floor to
simulate suburban terrain roughness.
1:50 Suburban Terrain Exposure Setting
3@9x16" spires1x8" tripboard
10' 44' 4'
Turn table 3" Cubes Blank
Figure 32. Wind tunnel terrain arrangement for 1:50 suburban exposure.

FIU Final Report RCMP Year 6: Wind Tunnel Section 6-33
We obtained the simulated mean wind velocity and turbulence intensity profiles shown in
Figure 26. We compared the measurements with the log-law which showed good
agreement with a velocity profile roughness element z0=0.4 m.
Figure 33. Wind Velocity and Turbulence Intensity Profile for 1:50 Suburban Terrain.
4.2 Models
We constructed the pressure tap models of the prototype houses using 5.6 mm (0.22 in)
thick acrylic sheet and 1.6 mm (0.063 in) diameter stainless steel pressure taps installed
at the locations of the full-scale pressure sensors. We modeled the surrounding houses
0
5
10
15
20
25
30
35
40
45
0.00 0.20 0.40 0.60 0.80 1.00 1.20 1.40 1.60U/Uref
0
5
10
15
20
25
30
35
40
450 0.2 0.4 0.6 0.8 1
Turbulence Intensity
U/Uref ( z0=0.40 m)
U/Uref ( z0=0.15 m) ASCE 7 minimum
U/Uref ( z0=0.7 m) ASCE 7 maximumWind Tunnel U/Uref
Wind Tunnel lulu ( z0=0.40 )
Hei
ght (
m)

FIU Final Report RCMP Year 6: Wind Tunnel Section 6-34
out of blue extruded 50.8 mm (2 in) and 76.2 mm (3 in) polystyrene sheets that were
then glued together with silicone sealant.
4.3 Data Collection
The wind tunnel data collection system uses a Scanivalve Corporation USB based data
acquisition system, consisting of Scanivalve ZOC33/64PX miniature pressure scanners.
Each pressure tap on the model is attached to the pressure scanner using 1.6 mm
(0.063 in) I.D. vinyl tubing. The pressure scanners are connected to a 16-bit RAD
A/D3200 analog-to-digital converter that converts the analog pressure data to digital
format for input to the computer. The A/D3200 is mounted into a RADBASE 3200 that
includes the USB system to relay the digital data to a control/storage computer. The
data acquisition system is software controlled linked to the storage computer through a
Telnet protocol over the wind tunnel’s Ethernet/Fiber Optic internet system.
We took 120 seconds of data sampled at 300 Hz for each wind direction measured. We
varied the wind direction in 10-degree intervals for 360°. We analyzed the wind tunnel
pressure data collected for each of the 36 wind directions on 1:50 scale models in flat
suburban terrain conditions. Summary statistics are provided in Figures 27 and 28
below (Note: top value is peak minima / bottom value is peak maxima pressure
coefficients.)

FIU Final Report RCMP Year 6: Wind Tunnel Section 6-35
17
16
20
19 23 24
27
26
25
28
22
21
15
141364 5
110
1211
87
9
NO
RTH
-1.90+0.73
-2.99+0.77
-2.33+0.58
-1.55+0.87
-1.46+0.92
-1.82+0.84
-1.43+0.92
-2.41+0.70
-3.94+0.63
-1.42+0.93
-1.26+1.15
-2.50+0.54
-3.43+0.68
-2.49+0.65
-1.38+0.89
-1.31+1.01
-1.95+0.86
-1.87+1.09
-3.10+0.91-1.80
+1.05
-3.46+0.97
-2.65+0.73
-2.80+0.57
-3.26+0.54-1.41
+1.18
Figure 34. Peak Minima and Maxima External Pressure Coefficients for FL-18.
Peak MinPeak Max
Key

FIU Final Report RCMP Year 6: Wind Tunnel Section 6-36
123
56
78
1011
131415
161718
20212223
26 242528
1927
NO
RTH
-1.21+1.23
-1.03+0.90
-1.43+0.57
-2.45+0.81
-1.80+0.82
-0.85+1.26
-0.98+0.99
-1.16+1.17
-1.26+0.91
-1.10+1.02
-1.56+0.98
-1.40+0.71
-2.26+0.84
-1.51+0.98
-2.14+0.77
-1.47+0.80
-2.68+0.66
-1.00+0.68
-3.07+0.61
-2.99+0.60
-2.65+0.46
-3.22+0.64
-2.68+0.55
-2.32+0.76
-3.01+0.60
Figure 35. Peak Minima and Maxima External Pressure Coefficients for FL-19.
4.4 Comparison of Full-Scale and Model-Scale Pressure Data
The peak external measured minimum (negative) pressure coefficients from the full-
scale data are compared to that of the model-scale tests for corresponding angle of
attack in Tables 6 and 7 below. The external pressure coefficients from FL-18 and FL-
19 presented are preliminary values and further analysis and validation are continuing.
The lack of reliable wind speed data from non-functional anemometers at the houses did
not provide independent validation of ARA’s simulated wind speed used for the
determination of pressure coefficients.
Peak MinPeak Max
Key

FIU Final Report RCMP Year 6: Wind Tunnel Section 6-37
Table 6. Preliminary Uncorrected External Pressure Coefficients for FL-18 for 320˚.
Full - Scale Analysis
Wind Tunnel Test
Tap Cp Minimum Cp Maximum ∆ Cp Cp Minimum Cp Maximum ∆ Cp
1 N/A N/A N/A -0.94 0.70 1.64 4 -3.40 1.68 5.08 -1.06 0.65 1.71 5 -3.25 0.45 3.69 -0.76 0.33 1.09 6 -2.97 0.77 3.74 -1.01 0.57 1.58 7 -3.53 0.15 3.68 -0.67 0.30 0.98 8 -3.61 0.03 3.63 -0.80 0.30 1.10 9 -2.76 0.53 3.29 -0.58 0.31 0.89 10 -1.87 1.78 3.65 -1.63 0.10 1.72 11 -2.28 -0.32 1.96 -1.52 0.08 1.61 12 -2.78 1.00 3.77 -1.22 0.13 1.35 13 -1.52 2.24 3.76 -1.32 0.17 1.49 14 -1.72 2.03 3.75 -1.14 0.32 1.46 15 -2.65 0.91 3.56 -1.47 0.07 1.54 16 -2.48 1.44 3.91 -0.83 0.28 1.11 17 -2.51 1.18 3.69 -1.07 0.26 1.34 19 -2.82 0.74 3.56 -0.90 0.31 1.21 20 -3.58 0.23 3.81 -0.82 0.25 1.07 21 -3.01 0.74 3.75 -0.82 0.35 1.18 22 -2.94 0.67 3.61 -1.00 0.33 1.33 23 -0.50 3.35 3.85 -0.81 0.24 1.05 24 -1.41 2.13 3.54 -0.88 0.30 1.19 25 -3.84 0.07 3.91 -0.91 0.21 1.12 26 -2.81 1.15 3.95 -1.23 0.32 1.55 27 -2.47 1.38 3.85 -1.36 0.14 1.50 28 -3.83 0.20 4.03 -1.30 0.12 1.42

FIU Final Report RCMP Year 6: Wind Tunnel Section 6-38
Table 7. Preliminary Uncorrected External Pressure Coefficients for FL-19 for 355˚.
Full – Scale Analysis
Wind Tunnel Test
Tap Cp Minimum Cp Maximum ∆ Cp Cp Minimum Cp Maximum ∆ Cp
1 -0.96 0.91 1.88 -1.65 0.30 1.95 2 -1.70 0.74 2.44 -1.76 0.33 2.09 3 -1.20 3.79 4.99 -1.23 0.24 1.47 5 -0.21 1.76 1.96 -1.02 0.24 1.26 6 -1.23 0.83 2.06 -1.03 0.25 1.27 7 -1.38 0.95 2.32 -0.85 0.20 1.05 8 -0.04 2.23 2.27 -0.63 0.24 0.87 9 -0.88 1.45 2.34 -0.63 0.16 0.79 10 -3.24 1.16 4.40 -0.54 0.16 0.69 11 -0.57 1.28 1.85 -0.53 0.15 0.67 13 -1.39 1.04 2.43 -0.63 0.10 0.73 14 -1.35 1.67 3.02 -0.66 0.11 0.77 15 -1.57 1.37 2.94 -0.70 0.09 0.79 16 -1.87 0.34 2.21 -0.58 0.08 0.66 17 -1.07 1.21 2.28 -0.73 0.07 0.80 18 -2.37 0.10 2.48 -0.73 0.07 0.79 19 -0.82 1.78 2.60 -0.50 0.07 0.58 20 -0.97 1.58 2.55 -0.67 0.08 0.76 21 -2.37 0.23 2.60 -0.71 0.07 0.79 22 -1.39 3.48 4.87 -0.81 0.09 0.90 23 -2.05 1.16 3.21 -0.76 0.08 0.85 24 -1.79 1.52 3.31 -0.73 0.11 0.84 25 -0.79 2.30 3.09 -0.61 0.09 0.70 26 -2.91 1.00 3.91 -0.79 0.10 0.89 27 -0.94 2.09 3.03 -0.63 0.14 0.77 28 -3.48 1.36 4.84 -1.65 0.30 1.95

FIU Final Report RCMP Year 6: Wind Tunnel Section 6-39
5. WIND PRESSURE VISUALIZATION SOFTWARE
Prototype wind pressure visualization software has been written to display 3D pressure
distributions overlaid on a building. With this software, an end user can analyze and
interact with wind pressure data by immediately viewing the data from different locations,
and by observing the impact of various statistical analyses of the data. A basic flowchart
of the program is shown in the figure below.
Figure 36. Program Flowchart for the SeeBreeze Visualization Software.
5.1 Background
Previous researchers have attempted to visualize wind pressures on buildings (Banks et
al. 2000). This has been a common problem in wind tunnel testing for some time.
Studies on flat roofs have shown that the largest mean and peak suction values are
observed for taps beneath the conical `delta-wing type' corner vortices that occur for
oblique winds. It has been assumed that similar results occur on sloped roofs, but to
date no studies have confirmed the phenomenon. Since most buildings of a non-
Start program
Open file
Parse file
Load wind pressure data
Interpolate data
Compute visualization contours
Display contours
Change viewing direction
Change wind direction
Wait for user input
Exit program

FIU Final Report RCMP Year 6: Wind Tunnel Section 6-40
residential nature do not have this problem, studies have not been conducted on sloped
roofs.
The effect of aerodynamic buffeting around two- and three-dimensional bluff bodies in
tandem was investigated by (Havel 2001), for moderate Reynolds number, turbulent
flows. Havel combined flow visualizations, surface pressure and velocity measurements,
changes in aerodynamic loading and macroscale flow features to study the phenomena.
The civil engineer is concerned mostly with the surface pressures generated.
Prior research has investigated other means to visualize the flow. (Lopes 1997)
developed a graphical use interface, FlowVis, as a visualization tool for graphical post-
processing of data defined in a 2D or 3D raster grid. Written in the C programming
language, this software provides a quick and efficient way to display analysis results
obtained either from numerical models or experimental setup.
More recent work has sought to process the visual information in a form that is more
usable (Machacek and Rosgen 2001). The authors developed a measurement system
using a stereo arrangement of two CCD cameras to visualize, classify (based on
topological features) and quantify complex flows in large scale wind tunnel experiments.
The authors proposed using topological features of the flow, e.g. stream lines,
separation and reattachment regions, stagnation points and vortex lines are extracted
directly and preferably visualized in real-time in a virtual wind tunnel environment.
The system is based on a three dimensional particle tracking method (3D-PTV) using a
stereo arrangement of two CCD cameras. A frame rate of 120 frames per second allows
measurements at high flow velocities. For the 3D-PTV method an approach is taken

FIU Final Report RCMP Year 6: Wind Tunnel Section 6-41
where the tracer particles are recorded such that consecutive frames form continuous
path lines. The 3-dimensional positions and shapes of the particle path lines are
reconstructed by means of the epipolar constraint and the stereo camera model. The
particle path segments which contain both velocity and topological information are then
analysed to extract the relevant information. Neutrally buoyant helium bubbles are used
as tracer particles. Matching the density of the ambient air, the bubbles are ideal flow
tracers in this respect.
Finally the closest project to what was discussed for the wind tunnel was by (Uselton
1998) who developed software to apply visualization techniques to aeronautics data
collected during wind tunnel experiments. Interaction between the software developers
and the wind engineers has been crucial in making the software useful to these
particular users. The interaction has also been important in building the scientists'
confidence in the use of interactive, computer-mediated analysis tools.
The motivation for this work stems from the available database of wind tunnel studies
and the need to determine new uses. Full scale data from the FCMP houses will provide
real-world pressure variations. With the help of the wind tunnel the researchers will be
able to determine the maximum loaded areas on houses. The purpose of this study is to
identify the common features in a house that contribute to extreme pressure values. The
objective of this software is to utilize wind tunnel pressure data to generate contour plots
on residential buildings. The program will allow for rapid comparison of the variability of
wind pressures with wind direction and variation among different building shapes and
with different terrain conditions.

FIU Final Report RCMP Year 6: Wind Tunnel Section 6-42
5.2 Structure of the Program
The wind tunnel data results is collected from the experimental output and stored in very
large data files (typically about 30 GB per test), containing information on the building
geometry, tap locations, and wind pressure data (min, max, and mean) for all the taps
and sampling instants. The location of the pressure taps on the building surfaces are
stored in x, y co-ordinates related to each planar surface. The pressure coefficient
information is stored in this file for each wind direction, and there are several files used
for a complete experiment, to cover all wind directions tested.
An interpolation algorithm was needed to convert the individual pressure tap readings
into contours displayed on a 2-dimensional plane. Several methodologies were
attempted to see which would work, including nearest neighbor and linear interpolation .
The v4 algorithm included in the Matlab code has been used in the past by Clemson’s
WLTF wind engineering researchers with reasonable results. However, after trial and
error the SeeBreeze development team selected a weighted averaging algorithm as the
initial methodology, because it was simpler to implement and provides reasonable
results.
The interpolation algorithm computes the color of the pixel at location (x,y) on a surface
as follows:
• For each tap i on the surface,
o Compute the distance di from the pixel location to the tap (in our
implementation di is computed on the full-scale model in inches)
o Compute the inverse exponential πi = exp( - di )
• Compute the normalization constant by summing the values of all taps: ∑=i
iz π
FIU Final Report RCMP Year 6: Wind Tunnel Section 6-43
• Compute the interpolated pressure value using a weighted average of the taps:
zpyxp ii
i /),( ∑= π
• Use table lookup to determine the color associated with p(x,y), given the current
color map
The visualization software, called SeeBreeze, for parsing the file and displaying the data
was written primarily in the Spring 2006 semester by students in a combined senior-level
/ graduate-level Software Engineering course in the Electrical and Computer
Engineering Department at Clemson. Two of the students from the class continued to
work on the project during the summer to refine and extend the capabilities of the
software.
The code was written in Visual C++ with MFC for controlling the basic window
functionality and OpenGL for rendering the data in 3D. Writing the code in C++ has
enabled us to achieve display speeds far greater than are possible with higher-level
languages such as Matlab.
The software uses a novel file format that we have developed specifically for this project
that is divided into four sections. First, the coordinates of the vertices of the wireframe
building are stored. Secondly, the sequence of vertices that define the various surfaces
of the building are recorded. Thirdly, the file contains the format of the filenames
containing the sensor coordinates and actual wind data, along with the actual wind
directions contained in those files. Finally, auxiliary data such as the offset of the
coordinate systems of the sensors and building surfaces is stored. Being composed of
ASCII text, this file is easily edited by the user by hand.

FIU Final Report RCMP Year 6: Wind Tunnel Section 6-44
In this prototype version the SeeBrreeze software can be used to display statistical data
(mean, peak minimum, peak maximum and standard deveiations) of the pressure
coefficients on a geometrically complex roof structure. Future versions of thesoftware
will include the ability to display time-history data that illustrates the spatial and temporal
variations of wind pressures, as well as press-coefficients data from wall and other
building surfaces.
5.3 Results
A screenshot of the wind pressure overlaid on a residential building (the FIU 1 house) is
shown in the figure below. By clicking and dragging the mouse, the user can translate
and rotate around the building, as well as zoom in and out. The arrows on the menu bar
allow the user to change the wind direction, which is shown both by the black arrow to
the right of the house, as well as the value along the right side of the status bar at the
bottom of the window. In addition to the mean of the data over time, which is displayed
in this example, the user may also choose to display the minimum or maximum instead.

FIU Final Report RCMP Year 6: Wind Tunnel Section 6-45
Figure 37. Screenshot of the SeeBreeze Program
Views of this house from several different directions are shown below. Such views are
obtained in real time as the mouse is dragged, thus providing instantaneous
visualizations of the data from arbitrary viewpoints. The same is true for changing the
wind direction. Future versions of the software are expected to allow the user to change
the time instant as well.

FIU Final Report RCMP Year 6: Wind Tunnel Section 6-46
Figure 38. Rotated Views of the House Model Showing Pressure Contours.
5.4 Web Page
Further information is provided on the program and the course instruction at
http://www.davidoprevatt.com/student-projects/seebreeze/ and the course information is
provided at http://www.ces.clemson.edu/~stb/ece417 . Real-time updates of the
progress of the field deployment during the hurricane landfall can be tracked at the
Florida Coastal Monitoring Program (FCMP) website at http://users.ce.ufl.edu/~fcmp/.
Through the FCMP website people can monitor the deployments of the towers and
locations of full-scale prototype buildings in relation to the hurricane path.
6. CONCLUSIONS
The data collection possible during the 2005 hurricane season and the novel
development of pressure visualization software program has advanced available
knowledge on the wind-structure interactions for residential structures. Several
iterations are yet required to validate these preliminary results and provide final
comparative data between the wind tunnel and full-scale experiments.

FIU Final Report RCMP Year 6: Wind Tunnel Section 6-47
7. REFERENCES
Banks, D., Meroney, R. N., Sarkar, P. P., Zhao, Z., and Wu, W. (2000). "Flow visualization of conical vortices on flat roofs with simultaneous surface pressure measurement." Journal of Wind Engineering and Industrial Aerodynamics, 84(1), 65-85.
Chen, M.; (2000) "Characterization of Wind Pressure Fluctuations On a Gable Roof
House," Ph.D. Dissertation, Department of Civil Engineering, Clemson University, SC.
Dearhart, E.; (2003) "Comparison of Field and Model Wind Pressures On Residential
Buildings in Tropical Storm Winds," MS Thesis, Department of Civil Engineering, Clemson University, SC.
Havel, B., Hangan, H., and Martinuzzi, R. (2001). "Buffeting for 2D and 3D sharp-edged
bluff bodies." Journal of Wind Engineering and Industrial Aerodynamics, 89(14), 1369-1381.
Holmes, J. D. “Comparison of Model and Full-Scale Tests of the Aylesbury House,”
Wind Tunnel Modeling for Civil Engineering Applications, Proceedings of International Workshop on Wind Tunnel Modeling Criteria and Techniques in Civil Engineering Applications, Gaithersburg, MD, 1982, pp. 605-618.
Levitan, Marc. L, and Kishor C. Mehta “Texas Tech field experiments for wind loads part
1: building and pressure measuring system,” Journal of Wind Engineering and Industrial Aerodynamics, 41-44 (1992), pp. 1565-1575.
Lopes, A. M. G. (1997). "FlowVis - a CAD based solution for the graphical post-
processing of scalar and vectorial data." Environmental Modelling & Software, 12(2), 161-168.
Machacek, M., and Rosgen, T. (2001). "Development of a quantitative flow visualization
tool for applications in industrial wind tunnels." Proceedings of the 19th International Congress on Instrumentation in Aerospace Simulation Facilities (ICIASF), Cleveland, Ohio, 125-134.
Masters, F, Gurley, K and Reinhold, T (2003). “Ground level wind characteristics of
Isidore and Dennis”, 11th International Conference on Wind Engineering, Lubbock, Texas, June 2-5, 2003.
Michot, B. J., “Full-Scale Wind Pressure Measurement Utilizing Unobtrusive Absolute
Pressure Transducer Technology,” Master of Science Thesis, Clemson University, Department of Civil Engineering, 1999.
Simiu, E. and R. Scanlan (1996) "Wind effects on structures (3 ed.), New York (US):
John Wiley & Sons. Uselton, S. P. (1998). "ExVis and Wind Tunnel Experiment Data." IEEE Computer
Graphics and Applications, 18(4), 75-77.