comparing consumptive agricultural water use in … 3 case study and methods..... 9 3.1 study...
TRANSCRIPT

Comparing Consumptive Agricultural Water Use in the Sacramento-San Joaquin Delta
A Proof of Concept Using Remote Sensing
Josué Medellín-Azuara and Richard E. Howitt
Final Report to the Delta Protection Commission. September 2013
Center for Watershed Sciences University of California, Davis

i
Executive Summary
Estimating consumptive water use for agriculture in California has always been a challenge for farmers, water managers, researchers and government agencies. Quantification of consumptive use allows for more informed water use practices, consistent measures of the allocation among stakeholders, and improved planning. In this report we explore the potential of remote sensing technology using the Surface Energy Balance Algorithm for Land (SEBAL) method (Bastiaanssen et al., 1998a) to provide an accurate estimate of consumptive use of water in crop production on five islands in the Sacramento San Joaquin Delta (Delta). To that end, we used a SEBAL-produced dataset provided to us by the Department of Water Resources (DWR) on actual evapotranspiration for year 2007 and compared it to evapotranspiration (ET) estimates using methods from the Irrigation Training and Research Center (ITRC) of California Polytechnic State University-San Luis Obispo (ITRC-based spreadsheet approach), and the method used by DWR, Simulation of Evapotranspiration of Applied Water (SIMETAW) model (Snyder et al., 2012) in its California version Cal-SIMETAW (Orang et al., 2013). The main difference between the SIMETAW and Cal-SIMETAW models is that SIMETAW uses historical climate data to determine a daily soil water balance for individual cropped fields within a watershed region having one set of reference evapotranspiration (ETo) estimates, while Cal-SIMETAW uses historical climate data and batch files of soil and climate data to perform daily soil water balance for individual cropped fields, 20 crop categories, and 4 land-use categories over the period of record by combinations of detailed analysis unit (DAU) and county (DAU/County) over California.
To compare consumptive use in crop farming among these three methods, we selected eight crop groups in the Delta, namely, alfalfa, corn, grain, grapes, orchards, field crops, pasture, and tomatoes. The islands under consideration were Brack Tract, Ryer Island, Lower Roberts Island, Middle Roberts Island and Upper Roberts Island. Our comparison of methods included, actual evapotranspiration (ETa) measures from SEBAL, crop evapotranspiration (ETc) estimated from the ITRC, and evapotranspiration estimated from applied water from Cal-SIMETAW. Differences in spatial scale and time were considered. For SEBAL, we employed a field average of actual evapotranspiration by crop group weighted by the size of the field. For the ITRC spreadsheet method, two California Irrigation Management Information System (CIMIS) evapotranspiration zones 12 and 14 were employed. Lastly, Cal-SIMETAW was applied to use daily ETo grids to estimate daily water balance to determine ETc and evapotranspiration of applied water (ETaw) on each of the five islands within the Delta. Evapotranspiration estimates were recorded for the period from March to September of 2007, which covers the irrigation season for most crop groups. SEBAL reports monthly from March to September 2007, the ITRC-based spreadsheet approach uses year-round monthly crop evapotranspiration estimates (thus March to September were recorded), and the customized Cal-SIMETAW model reports daily from monthly, seasonal, and annual estimates.
Results from our comparison show that for the most part, SEBAL and the ITRC-based spreadsheet approach are closer in seasonal estimates of crop evapotranspiration than SEBAL and Cal-SIMETAW. Crops with higher evapotranspiration in SEBAL are corn, grain and tomatoes. Cal-SIMETAW estimates are generally higher, especially for pasture and alfalfa, yet these are lower for corn, grain and field crops than SEBAL. Some of the differences could be explained by the crop groups that aggregate together grain and silage corn, or processing and fresh tomato. Other differences are due to the ability of SEBAL to capture actual evapotranspiration in a smaller than 100 ft by 100 ft grid, regardless of the irrigation practices and the water availability.
We were able to compare estimates of crop evapotranspiration across the five islands in this study. For the eight crop groups analyzed, Ryer Island and Brack Tract have lower crop evapotranspiration on average than Lower, Middle and Upper Roberts Islands using any of the three methods. Yet with SEBAL, it is possible to examine actual evapotranspiration within a field and among fields for the five islands and all crop groups. A closer look at alfalfa over more than 300 fields provides a fine distribution of crop

ii
evapotranspiration that could not be obtained by using the other methods that have coarser spatial scales such as Evapotranspiration Zone (ITRC) or DAU/Island (CalSIMETAW). Comparison of results from SEBAL against finer resolution methods for the Delta such as Delta Evapotranspiration of Applied Water (DETAW) were beyond the scope of the present study, but should be encouraged for future work.
In summary, estimation of crop evapotranspiration in crops using remote sensing methods such as SEBAL is a promising and practical alternative to supplement or replace information from other methods without the need for crop signatures, irrigation practices and other field information. The methodology can provide timely and consistent data sources for water management problems. A collaborative inter-agency approach for comprehensive land and water use information the Sacramento-San Joaquin Delta can be cost-effective and is encouraged.
iii
Table Contents
Executive Summary ....................................................................................................................................... i Acronyms and Abbreviations ........................................................................................................................ v
Chapter 1 Introduction ............................................................................................................................... 1 Chapter 2 Evapotranspiration in Crop Agriculture .................................................................................... 3
2.1 Consumptive use estimation ......................................................................................................... 4 2.2 Meteorological methods ................................................................................................................ 5
2.2.1 The FAO 56 Method ............................................................................................................. 5 2.2.2 Simulation of Evapotranspiration of Applied Water (SIMETAW) ...................................... 5 2.2.3 Irrigation Training and Research Center Evapotranspiration data (ITRC) ........................... 6
2.3 Energy Balance Methods .............................................................................................................. 6 2.4 Mass balance methods .................................................................................................................. 7 2.5 Models for estimating crop consumptive water use in the Sacramento-San Joaquin Delta ......... 7
2.5.1 DETAW ................................................................................................................................ 7 2.5.2 Integrated Water Flow Model (IWFM) and IWFM Demand Calculator (IDC) ................... 8 2.5.3 MODFLOW with Farm Process ........................................................................................... 8
Chapter 3 Case Study and Methods ........................................................................................................... 9 3.1 Study Area ..................................................................................................................................... 9
3.1.1 Brack Tract .......................................................................................................................... 11 3.1.2 Ryer Island .......................................................................................................................... 14 3.1.3 Roberts Islands .................................................................................................................... 14 3.1.1 Land Use 2007 .................................................................................................................... 14 3.1.2 Methods for SEBAL raster value extraction ....................................................................... 14
3.2 Data Sources and methods to extract ET information ................................................................ 18 3.2.1 Crop Evapotranspiration (ITRC) ........................................................................................ 18 3.2.2 Crop Evapotranspiration Using Cal-SIMETAW ................................................................ 18 3.2.3 Spatial and temporal scales in ET estimation comparisons ................................................ 18
Chapter 4 Evapotranspiration Results ..................................................................................................... 19
4.1 Water use by Island averaged over major crops ......................................................................... 19 4.2 Discussion and Limitations ......................................................................................................... 25
Chapter 5 Conclusions ............................................................................................................................. 26
References ................................................................................................................................................... 27
iv
List of Figures
Figure 1. Reference (ETo), standard crop evapotranspiration and (ETc) and non-standard crop evapotranspiration (ETcadj) (after Allen et al. 1998) ..................................................................................... 3 Figure 2. Proportion of the crop transpiration and soil evaporation during the cropping season (after Allen et al., 1998). ................................................................................................................................................... 4 Figure 3. Conceptual schematic of the Surface Energy Balance (Bastiaanssen et al., 1998a). .................... 6 Figure 4. Map of the study area. ................................................................................................................... 9 Figure 5. Brack Tract land use in July 2007 and actual evapotranspiration from SEBAL. ........................ 12 Figure 6. Ryer Island land use in July 2007 and actual evapotranspiration from SEBAL. ........................ 13 Figure 7. Upper Roberts land use in July 2007 and actual evapotranspiration SEBAL. ............................ 15 Figure 8. Middle Roberts land use in July 2007 and actual evapotranspiration from SEBAL. .................. 16 Figure 9. Lower Roberts land use in July 2007 and actual evapotranspiration SEBAL. ............................ 17 Figure 10. Average evapotranspiration for a selection of crops in the five islands. ................................... 20 Figure 11. Comparison of alfalfa seasonal evapotranspiration by island. .................................................. 21 Figure 12. Comparison of corn average seasonal evapotranspiration by island. ........................................ 22 Figure 13. Comparison of tomatoes average seasonal evapotranspiration by island. ................................. 22 Figure 14. Comparison of seasonal evapotranspiration for alfalfa, corn, tomatoes and field crops. .......... 23 Figure 15. Comparison of evapotranspiration for grain, grapes, orchards and pasture. ............................. 23 Figure 16. Average actual seasonal evapotranspiration (in inches) for alfalfa from SEBAL. .................... 24 Figure 17. Distribution of average actual seasonal evapotranspiration (in inches) of alfalfa by field in all five islands from SEBAL, ITRC and Cal-SIMETAW. .............................................................................. 24
List of Tables Table 1. Areas (in acres) of selected land use classes in the study area. .................................................... 10 Table 2. Crop evapotranspiration during the irrigation season (March to September). .............................. 19

v
Acronyms and Abbreviations
Acronym Description
DAU Detailed Analysis Unit DETAW Delta Evapotranspiration of Applied Water DICU Delta Island Consumptive Use DSM2 Delta Simulation Model II DWR California Department of Water Resources ET Evapotranspiration ETc Crop Evapotranspiration ETa Actual Evapotranspiration ETp Potential Evapotranspiration ETaw Evapotranspiration of Applied Water FAO Food and Agriculture Organization of the United Nations IDC IWFM Demand Calculator ITRC Irrigation Training and Research Center at California Polytechnic State University IWFM Integrated Water Flow Model METRIC Mapping Evapotranspiration with Internalized Calibration MODFLOW Modular Three-Dimensional Finite-Difference Groundwater Flow Model SEBAL Surface Energy Balance Algorithm for Land SIMETAW Simulation of Evapotranspiration of Applied Water Model USGS United States Geological Survey
1
Chapter 1 Introduction
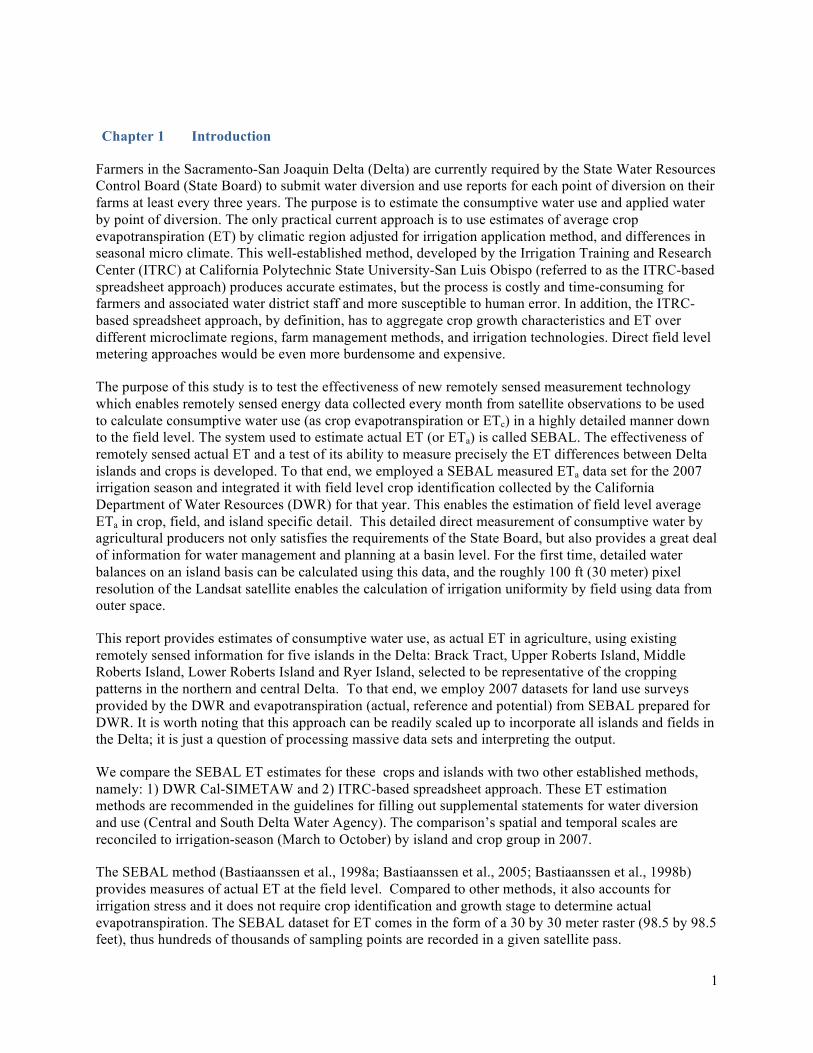
Farmers in the Sacramento-San Joaquin Delta (Delta) are currently required by the State Water Resources Control Board (State Board) to submit water diversion and use reports for each point of diversion on their farms at least every three years. The purpose is to estimate the consumptive water use and applied water by point of diversion. The only practical current approach is to use estimates of average crop evapotranspiration (ET) by climatic region adjusted for irrigation application method, and differences in seasonal micro climate. This well-established method, developed by the Irrigation Training and Research Center (ITRC) at California Polytechnic State University-San Luis Obispo (referred to as the ITRC-based spreadsheet approach) produces accurate estimates, but the process is costly and time-consuming for farmers and associated water district staff and more susceptible to human error. In addition, the ITRC-based spreadsheet approach, by definition, has to aggregate crop growth characteristics and ET over different microclimate regions, farm management methods, and irrigation technologies. Direct field level metering approaches would be even more burdensome and expensive.
The purpose of this study is to test the effectiveness of new remotely sensed measurement technology which enables remotely sensed energy data collected every month from satellite observations to be used to calculate consumptive water use (as crop evapotranspiration or ETc) in a highly detailed manner down to the field level. The system used to estimate actual ET (or ETa) is called SEBAL. The effectiveness of remotely sensed actual ET and a test of its ability to measure precisely the ET differences between Delta islands and crops is developed. To that end, we employed a SEBAL measured ETa data set for the 2007 irrigation season and integrated it with field level crop identification collected by the California Department of Water Resources (DWR) for that year. This enables the estimation of field level average ETa in crop, field, and island specific detail. This detailed direct measurement of consumptive water by agricultural producers not only satisfies the requirements of the State Board, but also provides a great deal of information for water management and planning at a basin level. For the first time, detailed water balances on an island basis can be calculated using this data, and the roughly 100 ft (30 meter) pixel resolution of the Landsat satellite enables the calculation of irrigation uniformity by field using data from outer space.
This report provides estimates of consumptive water use, as actual ET in agriculture, using existing remotely sensed information for five islands in the Delta: Brack Tract, Upper Roberts Island, Middle Roberts Island, Lower Roberts Island and Ryer Island, selected to be representative of the cropping patterns in the northern and central Delta. To that end, we employ 2007 datasets for land use surveys provided by the DWR and evapotranspiration (actual, reference and potential) from SEBAL prepared for DWR. It is worth noting that this approach can be readily scaled up to incorporate all islands and fields in the Delta; it is just a question of processing massive data sets and interpreting the output.
We compare the SEBAL ET estimates for these crops and islands with two other established methods, namely: 1) DWR Cal-SIMETAW and 2) ITRC-based spreadsheet approach. These ET estimation methods are recommended in the guidelines for filling out supplemental statements for water diversion and use (Central and South Delta Water Agency). The comparison’s spatial and temporal scales are reconciled to irrigation-season (March to October) by island and crop group in 2007.
The SEBAL method (Bastiaanssen et al., 1998a; Bastiaanssen et al., 2005; Bastiaanssen et al., 1998b) provides measures of actual ET at the field level. Compared to other methods, it also accounts for irrigation stress and it does not require crop identification and growth stage to determine actual evapotranspiration. The SEBAL dataset for ET comes in the form of a 30 by 30 meter raster (98.5 by 98.5 feet), thus hundreds of thousands of sampling points are recorded in a given satellite pass.
2
In the following section we present a brief review and comparison of methods for estimating consumptive water use in agriculture with a focus in California. We then present a description of the case study area, the islands of Brack Tract, Lower Roberts Island, Middle Roberts Island, Upper Roberts Island and Ryer Island. The datasets employed and a summary of the base conditions close the chapter. Modeling results using remote sensing and a comparison of estimates through other methods is presented in the modeling results chapter. Discussion and limitations of the approach are also considered. Lastly, a comparison of methods, policy implications and some recommendations for further work conform the conclusions chapter.
3
Chapter 2 Evapotranspiration in Crop Agriculture
The process by which water converts into vapor is called evaporation. In crop farming, evapotranspiration is the combined effect of evaporation from the soil and transpiration from the plant’s surface. In this study, we use estimates of crop evapotranspiration as an approximation to crop consumptive use. A number of methods exist to either measure or estimate evapotranspiration and are usually variants of mass balances, energy balances or meteorological approaches. The proportions of water vapor that comes from soil and from the plant varies by many factors including season, time of day, crop and soil type. Whereas total evaporation is a parameter of concern for open water bodies in a watershed, evapotranspiration is a parameter of interest to estimate consumptive water use from crop farming in a region. In particular, the evapotranspiration of applied water is helpful for water management purposes in estimating the amount of applied water for the crop.
Measurement of evapotranspiration can be obtained by direct and indirect methods and involves pan evaporation, lysimeters, eddy correlations, Bowen ratio, LIDAR and satellite information. The accuracy of the calculations generally depends on the weather data as well as the quality control and quality assurance procedures. Most of the estimations are empirical, pan evapotranspiration being one of the simplest ones (Abtew and Melesse, 2012). Other methods, such as the Blaney-Criddle method, require temperature and daylight duration information to provide reference evapotranspiration estimates.
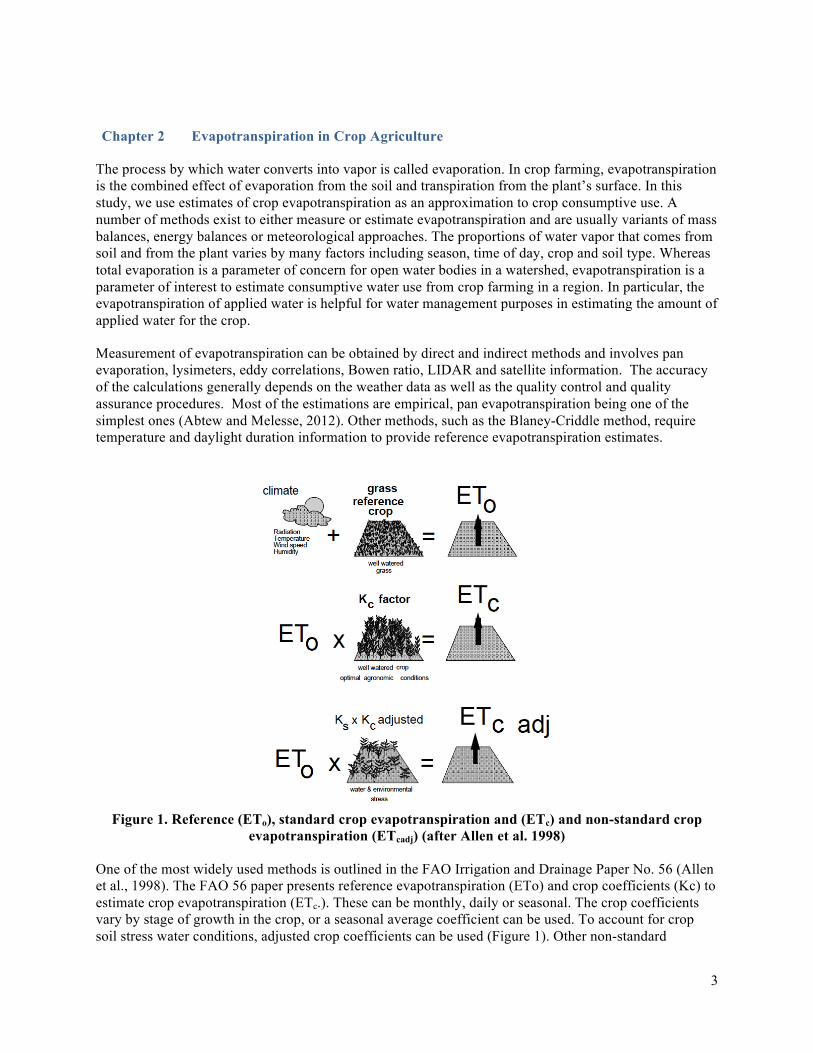
Figure 1. Reference (ETo), standard crop evapotranspiration and (ETc) and non-standard crop
evapotranspiration (ETcadj) (after Allen et al. 1998)
One of the most widely used methods is outlined in the FAO Irrigation and Drainage Paper No. 56 (Allen et al., 1998). The FAO 56 paper presents reference evapotranspiration (ETo) and crop coefficients (Kc) to estimate crop evapotranspiration (ETc.). These can be monthly, daily or seasonal. The crop coefficients vary by stage of growth in the crop, or a seasonal average coefficient can be used. To account for crop soil stress water conditions, adjusted crop coefficients can be used (Figure 1). Other non-standard

4
conditions that require adjusted crop coefficients include non-typical and non-pristine vegetation, management practices and non-growing periods.
The potential evapotranspiration (ETp) is the maximum amount of water that can be evaporated and is dependent only on weather conditions. This would resemble evaporation from open large water sources such as a lake. In contrast, actual evapotranspiration (ETa) is limited by the plant’s available moisture to evaporate, a function of the growth stage, soil moisture, and root system among other factors (Siegfried, 2012). Most transpiration occurs during daylight, when less water becomes available for the plant, transpiration decreases. When the moisture content falls below the wilting point, the plant may die.
Moisture content in the soil varies by season and is often dictated by the ratio between precipitation (P) and potential ET. When precipitation exceeds ETp, soil is recharged. If the recharge is large enough runoff may occur due to excess water. Water from the upper soil layers may recharge the lower soil layers. This process may continue and if there is now additional water source in the surface, moisture deficit in the upper layer may occur. This happens when precipitation is less than the potential evapotranspiration rate (Bendient et al. 1992).
Figure 2. Proportion of the crop transpiration and soil evaporation during the cropping season
(after Allen et al., 1998).
2.1 Consumptive use estimation
A number of methods exist to estimate consumptive use of water or crop evapotranspiration in irrigated agriculture. Energy approaches, mass balances and meteorological methods are among the most broadly used. This report briefly discusses these three families of methods used to estimate evapotranspiration in crop farming.
5
2.2 Meteorological methods
2.2.1 The FAO 56 Method
With meteorological approaches, it is possible to estimate crop evapotranspiration by using the well-known equation below (also shown in figure 1 above):
c c oET K ET= (1)
In this equation, ETc is crop evapotranspiration, Kc is the crop coefficient which can be seasonal or crop growth stage-dependent, and ETo is the reference evapotranspiration. Crop coefficients take into account soil moisture, crop maturity, wind speed, relative humidity. Allen et al. (1998) define crop coefficients as:
(2)
Where the crop coefficient Kcb is the basal crop coefficient for crop c, Ks is the water stress factor, and Kw is soil water content factor. Yet the most fundamental step for estimating crop evapotranspiration with this method is the estimation of the reference evapotranspiration or ETo. Allen et al. (1998) define as:
2
2
9000.408 ( ) ( )273
(1 0.34 )
n s a
o
R G u e eTET
u
γ
γ
Δ − + −+=
Δ+ + (3)
Where, ETo reference evapotranspiration [mm/day] Rn net radiation at the crop surface [MJ/m2 /day] G soil heat flux density [MJ/m2 /day] T mean daily air temperature at 2 m of height [C] U2 wind speed at 2 m height [m/s] es saturation vapour pressure [kPa] es-ea asaturation vapour pressure deficit [kPa] Δ slope vapour pressure curve [kPa/C] γ psychrometric constant [kPa / C]
Equation 3 above also known as Penman-Monteith combines radiation and aerodynamic information and provides evapotranspiration at different periods of the year and regions. It uses standard climatological records of solar radiation, air temperature, humidity and wind speed. Special conditions can be accounted for and discussed in Part C, crop evapotranspiration under non-standard conditions of Allen et al. (1998). In some cases, only accurate records of temperature, elevation, relative humidity or even lease measurements exist. Thus empirical relationships for local conditions can be developed over equation 3 in order to reduce the data requirements. A good compilation of methods and applications is presented in Abtew et al. (2012).
2.2.2 Simulation of Evapotranspiration of Applied Water (SIMETAW)
The Simulation of Evapotranspiration of Applied Water model (SIMETAW) was developed by the California Department of Water Resources and UC Davis (Snyder et al., 2012). SIMETAW creates simulated monthly climate data from monthly climate records to estimate reference evapotranspiration (ETo) and crop evapotranspiration (ETc). Effective rainfall with SIMETAW is estimated by using the
c cb s wK K K K= +

6
simulated daily rainfall, soil water holding characteristics, effective rooting depths and ETc (Snyder et al. 2012). Cal-SIMETAW uses weather data and the daily standardized Penman-Monteith equation for reference evapotranspiration, crop coefficients and effective rainfall to estimate evapotranspiration of applied water (ETaw), which is the amount of applied water that contributes to ETc. Crop coefficients in SIMETAW follow Doorenbos and Pruitt (1977) method separating the season into initial, rapid, midseason and late season growth periods. Cal-SIMETAW (Orang et al., 2013) has estimates of ETAW for 20 crop groups in California by detailed analysis unit and county (DAU/County), planning area (PA), an hydrologic region (HR) over California. Corrections for immature trees and vines, immature subtropical orchards and cover crops is possible. Fixed (seasonal) crop coefficients are available from some crops like pasture, turf grass and alfalfa.
2.2.3 Irrigation Training and Research Center Evapotranspiration data (ITRC)
The Irrigation Training and Research Center for the California Polytechnic State University in San Luis Obispo (ITRC) offers estimates of monthly crop evapotranspiration for 13 evapotranspiration zones in California for planning and irrigation scheduling purposes. ITRC provides a total of 117 tables, for 13 zones and 3 irrigation methods in typical, wet and dry years. Same as Cal-SIMETAW, ITRC employs methods outlined in the FAO Irrigation and Drainage Publication No. 56 (Allen et al. 1998) to estimate crop evapotranspiration. ITRC estimates of crop ET (ETc) include the non-irrigation season, thus estimated may be higher than those giving irrigation season estimates.
2.3 Energy Balance Methods
One drawback of the traditional methods to estimate ET in crops is the use of idealized crop coefficients (Kc). In many cases, the conditions of interest are not the ones under which the crop coefficients were calculated, such as is the case in areas with water shortage or water quality issues. Energy balance approaches such as SEBAL (Surface Energy Balance Algorithm for Land ) and METRIC (Mapping Evapotranspiration with Internalized Calibration) have been in use for several years (Allen et al., 2011). These methods estimate consumptive use in crops using land weather stations and satellite images.
SEBAL was developed by Dr. Bastiaansesen (Bastiaanssen et al., 1998a; Bastiaanssen et al., 2005; Bastiaanssen et al., 1998b). It uses spectral radiances recorded by satellite-based sensors, plus ordinary meteorological data to solve for the energy balance at the Earth’s surface (Figure 3). With SEBAL, actual evapotranspiration (ETa) for each pixel in multispectral satellite image is computed. An algorithm involving 25 steps is followed in undertaking that estimation and using radiative, aerodynamic and energy balance physics.
Figure 3. Conceptual schematic of the Surface Energy Balance (Bastiaanssen et al., 1998a).
7
The energy balance equation to be solved is: (4)
Where ET is the latent energy in evapotranspiration, Rn is the net radiation (incoming minus outgoing short wave and long wave radiation at the surface), G is the sensible heat flux conducted into the ground and H is the sensible heat flux convected to the air. Details on how each component is estimated are given in Allen et al. (2011). SEBAL employs digital elevation models from the USGS Landsat imagery and meteorological data including solar radiation, air temperature, relative humidity and wind speed from the California Irrigation Management Information System (CIMIS). Weather is interpolated among CIMIS stations using MeteoLook, accounting for elevation, surface roughness, albedo, incoming radiation, land wetness, and distance to water bodies.
Some of the advantages of the energy balance (SEBAL) approach versus traditional (FAO Paper 56) method are:
1) Calculation of actual, as opposed to crop ETc. This accounts for conditions such as stress, salinity disease or poor plant stands.
2) SEBAL does not require crop identification or crop stage identification for the mapping of ET 3) The area of water-using land is observed from the satellite image, thus land use is implicit in the
process.
Some disadvantages of the energy-based methods are that it requires highly trained personnel to run the model with confidence. High quality weather data is also required for methods like METRIC (not used for this report) that calibrates to a reference crop and local weather data. Model calibration and maintenance requires specialized modeling staff and is often sub-contracted. However, once the datasets are generated, the model provides accurate estimates of crop actual evapotranspiration at a high resolution that can be processed by support staff in an agency.
2.4 Mass balance methods
Soil water balance methods use conservation of mass to estimate ET. Sclanlon et al. (2005) propose the following equation:
oET P R D S= − − −Δ (5)
Where, ET is evapotranspiration, P is precipitation, Ro is runoff, D is drainage below the root zone and ΔS is the change in the soil water storage. The biggest challenge in this method is to estimating seepage into groundwater. Measuring precipitation, inflow, can also bring in errors.
2.5 Models for estimating crop consumptive water use in the Sacramento-San Joaquin Delta
Other methods at use for evapotranspiration or water use in crops in the Delta and in California include the DETAW model, Integrated Water Flow Model (IWFM) (with its IWFM Demand Calculator (IDC)), and MODFLOW with farm processes. These are in a way water budget (mass balance) models and some use the meteorological approach in Allen et al. (1998).
2.5.1 DETAW
The DETAW model was developed by the California Department of Water as an improvement over the DICU model and to reconcile two water simulation models used by DWR namely Cal-SIM II and DSM2. Preliminary modeling results for the Delta indicate that estimates of evapotranspiration of applied water in crops are very close to SEBAL estimates (Snyder et al., 2010). DETAW calculates evapotranspiration of applied water (ETAW) for 168 areas in the Delta adapting the SIMETAW to account for ET losses and
nET R G H= − −
8
water contributions from rainfall, seepage and irrigation and using datasets with a daily time step; simulating daily data is thus avoided and has a streamlined input data processes with respect to SIMETAW. DETAW has eleven crop categories, urban, native (and native riparian) vegetation and open water land use classes (a total of 15 land use classes). Two year types are considered; namely, critically dry and wet years (Snyder et al., 2010).
2.5.2 Integrated Water Flow Model (IWFM) and IWFM Demand Calculator (IDC)
The Integrated Water Flow Model (IWFM) was developed by DWR to better represent surface and groundwater interactions. The model is available at http://baydeltaoffice.water.ca.gov (Dogrul et al. 2011).The IWFM model has a water demand calculator called the IWFM Demand Calculator (IDC) a stand-alone root-zone budget model. IWMF accounts for groundwater and streams and other hydrologically-connected processes in a basin or sub-basin whereas IDC serves to estimate crop and other water requirements based on root zone budgets. IDC classifies crops into ponded crops like rice and native land use classes, and non-ponded crops (all the rest). For non-ponded crops IDC employs Allen et al. (1998) but the soil moisture in the root zone is a function of physical processes like infiltration, evapotranspiration and deep percolation. Water requirement is calculated considering the needs to raise soil moisture to a target level. To account for different management practices the user can modify this target level. User specified depth determines water needs for ponded land use classes like rice. Crop ET is calculated outside IDC by any conventional method (e.g. Allen et al. 1998). Crop stress by water availability can only be simulated if IWFM and IDC are integrated (Dogrul, personal communication).
2.5.3 MODFLOW with Farm Process
MODFLOW is a US Geological Survey three-dimensional, finite-element groundwater model that was updated to incorporate crop-farming processes (USGS 2011). MODFLOW simulates steady and non-steady flow conditions accounting also for external flows, and flow through riverbeds. A soil texture database is used for accounting for soil hydraulic conductivities for various layers. The farm process module simulates land surface, vadose zone process and crop demands based on land use.
All of the methods mentioned are in use in California. The choice among them depends on the ultimate application of the model results. Most of the methods to estimate water use and evapotranspiration from crops use some components of the FAO irrigation and drainage paper 56 (Allen et al. 1998). Energy balance methods like SEBAL provide some advantages over the more traditional methods like FAO 56 method in that crop growth stage and crop identification are not needed to measure actual evapotranspiration.
9
Chapter 3 Case Study and Methods
3.1 Study Area
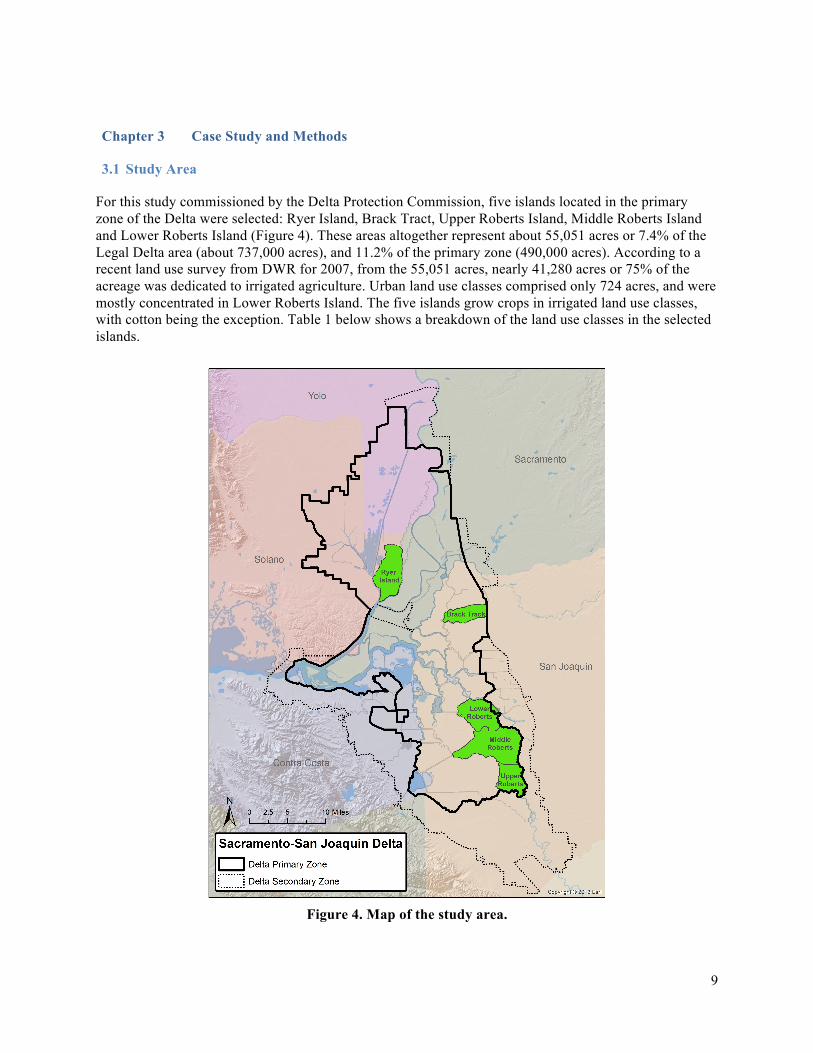
For this study commissioned by the Delta Protection Commission, five islands located in the primary zone of the Delta were selected: Ryer Island, Brack Tract, Upper Roberts Island, Middle Roberts Island and Lower Roberts Island (Figure 4). These areas altogether represent about 55,051 acres or 7.4% of the Legal Delta area (about 737,000 acres), and 11.2% of the primary zone (490,000 acres). According to a recent land use survey from DWR for 2007, from the 55,051 acres, nearly 41,280 acres or 75% of the acreage was dedicated to irrigated agriculture. Urban land use classes comprised only 724 acres, and were mostly concentrated in Lower Roberts Island. The five islands grow crops in irrigated land use classes, with cotton being the exception. Table 1 below shows a breakdown of the land use classes in the selected islands.
Figure 4. Map of the study area.
10
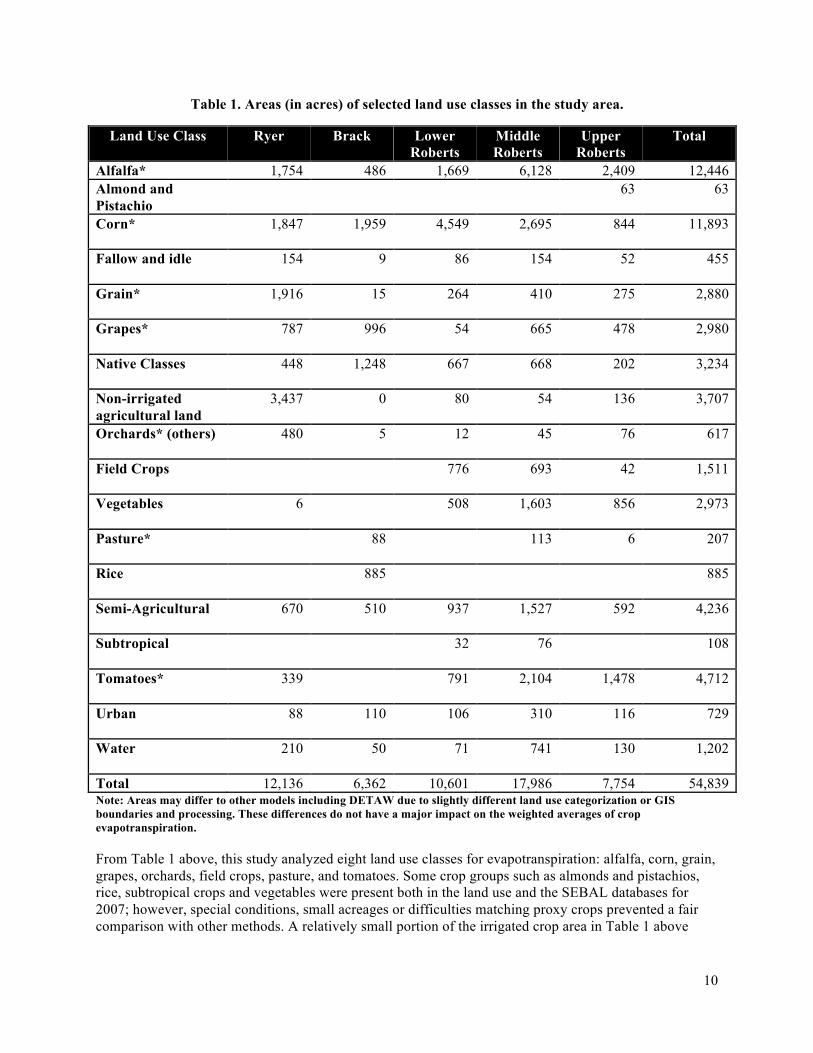
Table 1. Areas (in acres) of selected land use classes in the study area.
Land Use Class Ryer Brack Lower Roberts
Middle Roberts
Upper Roberts
Total
Alfalfa* 1,754 486 1,669 6,128 2,409 12,446 Almond and Pistachio
63 63
Corn*
1,847 1,959 4,549 2,695 844 11,893
Fallow and idle
154 9 86 154 52 455
Grain*
1,916 15 264 410 275 2,880
Grapes*
787 996 54 665 478 2,980
Native Classes
448 1,248 667 668 202 3,234
Non-irrigated agricultural land
3,437 0 80 54 136 3,707
Orchards* (others)
480 5 12 45 76 617
Field Crops
776 693 42 1,511
Vegetables
6 508 1,603 856 2,973
Pasture*
88 113 6 207
Rice
885 885
Semi-Agricultural
670 510 937 1,527 592 4,236
Subtropical
32 76 108
Tomatoes*
339 791 2,104 1,478 4,712
Urban
88 110 106 310 116 729
Water
210 50 71 741 130 1,202
Total 12,136 6,362 10,601 17,986 7,754 54,839 Note: Areas may differ to other models including DETAW due to slightly different land use categorization or GIS boundaries and processing. These differences do not have a major impact on the weighted averages of crop evapotranspiration.
From Table 1 above, this study analyzed eight land use classes for evapotranspiration: alfalfa, corn, grain, grapes, orchards, field crops, pasture, and tomatoes. Some crop groups such as almonds and pistachios, rice, subtropical crops and vegetables were present both in the land use and the SEBAL databases for 2007; however, special conditions, small acreages or difficulties matching proxy crops prevented a fair comparison with other methods. A relatively small portion of the irrigated crop area in Table 1 above
11
(<900 acres) was in multi-cropping. Two combinations were found, grains (most likely winter wheat) and corn, and grains with various truck crops (not analyzed).
3.1.1 Brack Tract
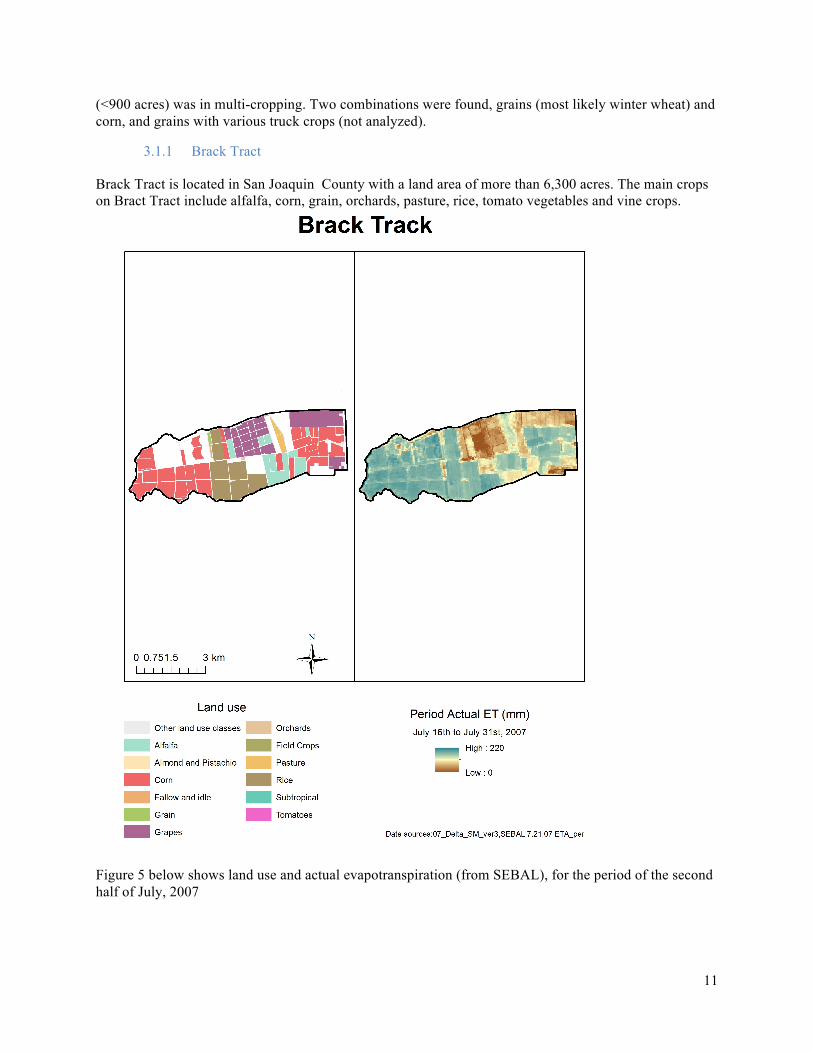
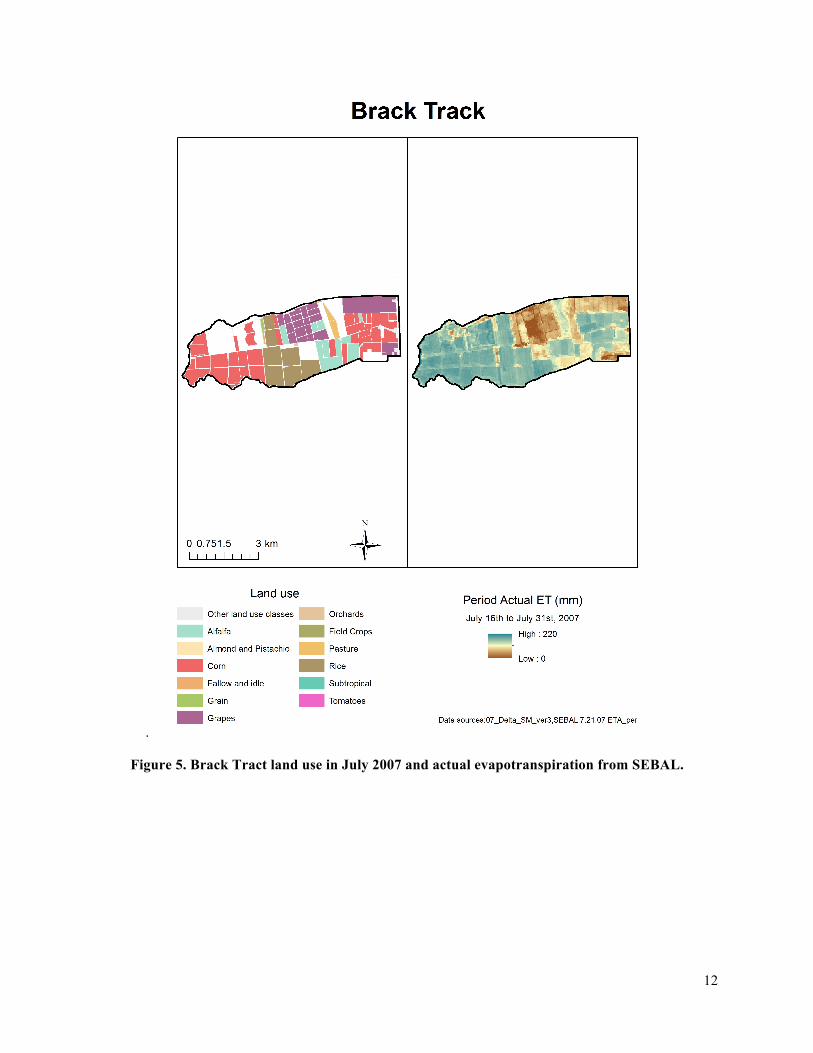
Brack Tract is located in San Joaquin County with a land area of more than 6,300 acres. The main crops on Bract Tract include alfalfa, corn, grain, orchards, pasture, rice, tomato vegetables and vine crops.
Figure 5 below shows land use and actual evapotranspiration (from SEBAL), for the period of the second half of July, 2007
12
.
Figure 5. Brack Tract land use in July 2007 and actual evapotranspiration from SEBAL.
13
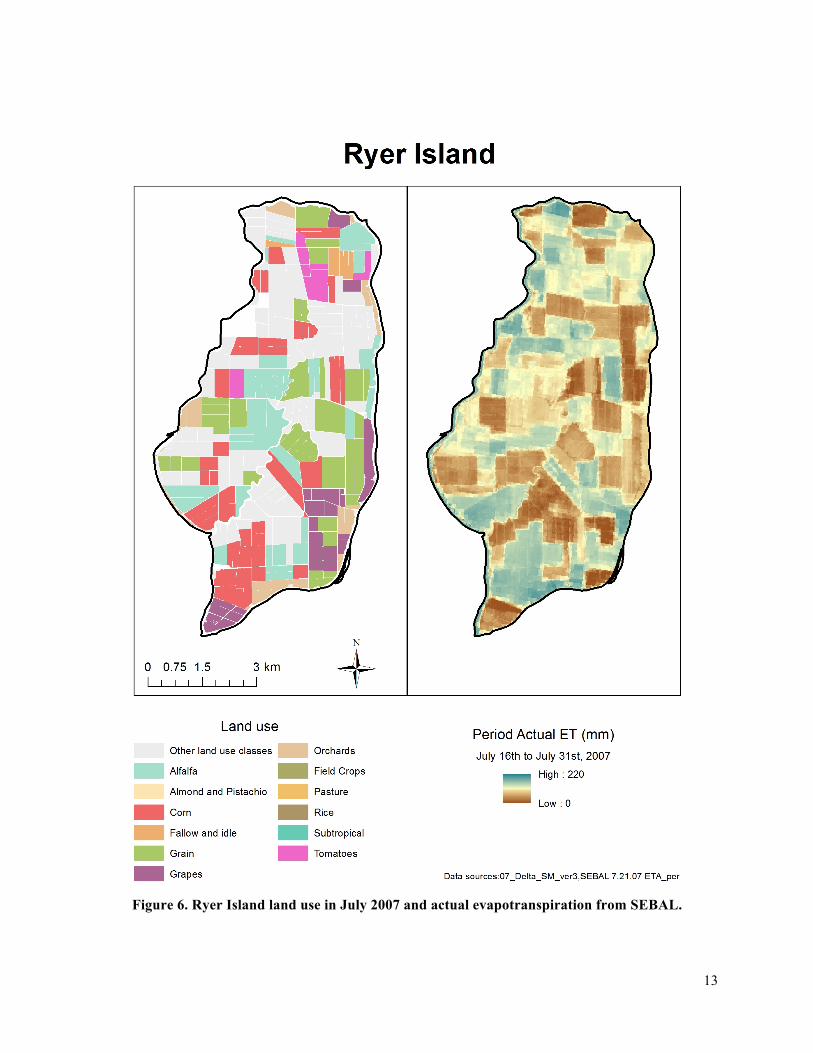
Figure 6. Ryer Island land use in July 2007 and actual evapotranspiration from SEBAL.
14
3.1.2 Ryer Island
Ryer Island (Figure 6) is located northeast of Rio Vista in Solano County. The island has a land area of about 11,900 acres1. Predominant land use includes alfalfa, corn, grain, vine crops, orchards, tomatoes and non-irrigated land.
3.1.3 Roberts Islands
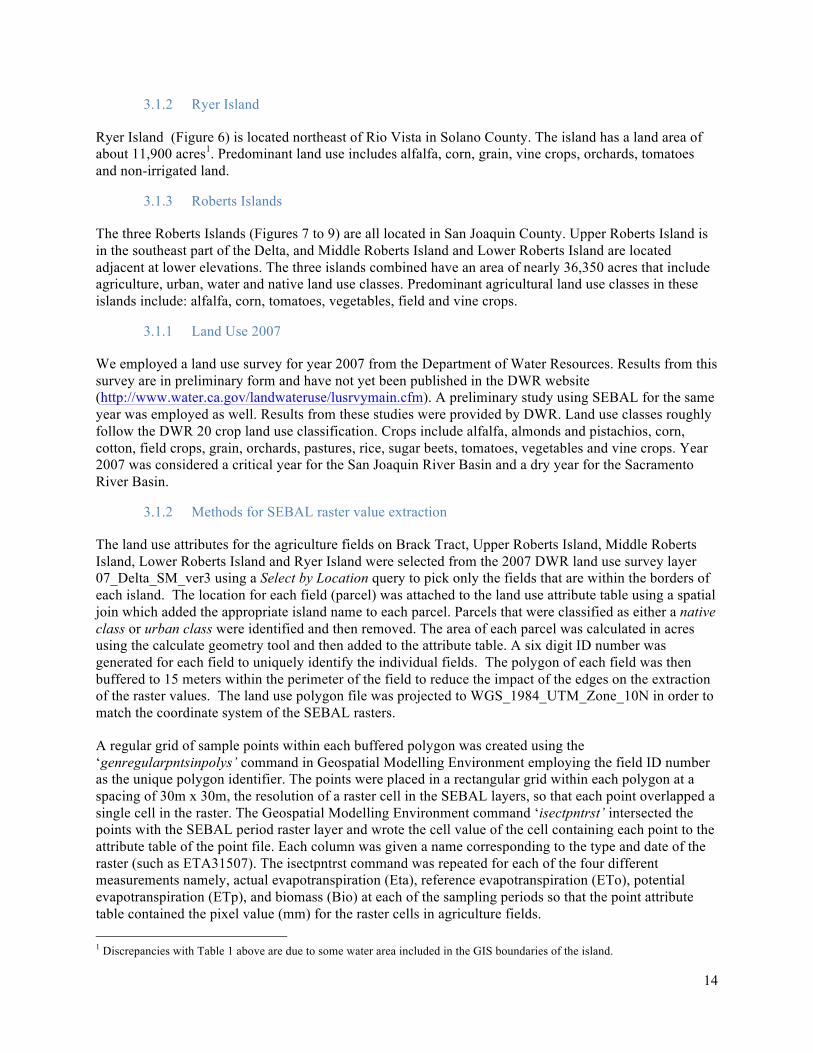
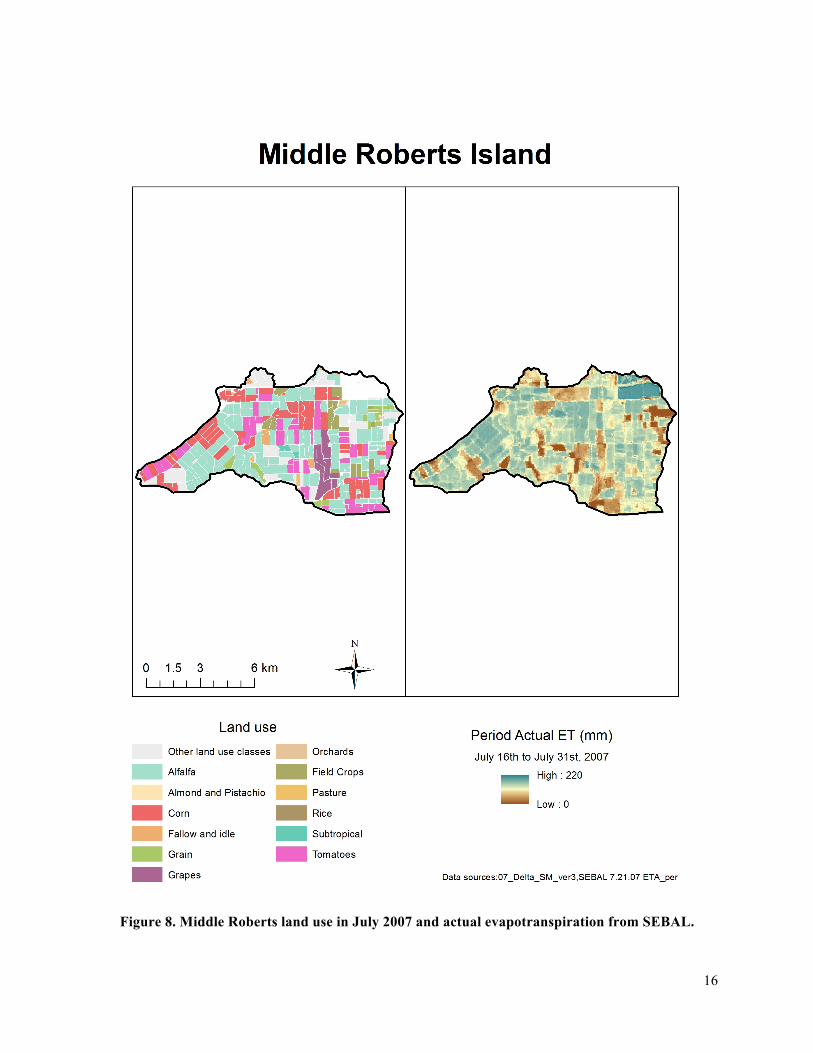
The three Roberts Islands (Figures 7 to 9) are all located in San Joaquin County. Upper Roberts Island is in the southeast part of the Delta, and Middle Roberts Island and Lower Roberts Island are located adjacent at lower elevations. The three islands combined have an area of nearly 36,350 acres that include agriculture, urban, water and native land use classes. Predominant agricultural land use classes in these islands include: alfalfa, corn, tomatoes, vegetables, field and vine crops.
3.1.1 Land Use 2007
We employed a land use survey for year 2007 from the Department of Water Resources. Results from this survey are in preliminary form and have not yet been published in the DWR website (http://www.water.ca.gov/landwateruse/lusrvymain.cfm). A preliminary study using SEBAL for the same year was employed as well. Results from these studies were provided by DWR. Land use classes roughly follow the DWR 20 crop land use classification. Crops include alfalfa, almonds and pistachios, corn, cotton, field crops, grain, orchards, pastures, rice, sugar beets, tomatoes, vegetables and vine crops. Year 2007 was considered a critical year for the San Joaquin River Basin and a dry year for the Sacramento River Basin.
3.1.2 Methods for SEBAL raster value extraction
The land use attributes for the agriculture fields on Brack Tract, Upper Roberts Island, Middle Roberts Island, Lower Roberts Island and Ryer Island were selected from the 2007 DWR land use survey layer 07_Delta_SM_ver3 using a Select by Location query to pick only the fields that are within the borders of each island. The location for each field (parcel) was attached to the land use attribute table using a spatial join which added the appropriate island name to each parcel. Parcels that were classified as either a native class or urban class were identified and then removed. The area of each parcel was calculated in acres using the calculate geometry tool and then added to the attribute table. A six digit ID number was generated for each field to uniquely identify the individual fields. The polygon of each field was then buffered to 15 meters within the perimeter of the field to reduce the impact of the edges on the extraction of the raster values. The land use polygon file was projected to WGS_1984_UTM_Zone_10N in order to match the coordinate system of the SEBAL rasters.
A regular grid of sample points within each buffered polygon was created using the ‘genregularpntsinpolys’ command in Geospatial Modelling Environment employing the field ID number as the unique polygon identifier. The points were placed in a rectangular grid within each polygon at a spacing of 30m x 30m, the resolution of a raster cell in the SEBAL layers, so that each point overlapped a single cell in the raster. The Geospatial Modelling Environment command ‘isectpntrst’ intersected the points with the SEBAL period raster layer and wrote the cell value of the cell containing each point to the attribute table of the point file. Each column was given a name corresponding to the type and date of the raster (such as ETA31507). The isectpntrst command was repeated for each of the four different measurements namely, actual evapotranspiration (Eta), reference evapotranspiration (ETo), potential evapotranspiration (ETp), and biomass (Bio) at each of the sampling periods so that the point attribute table contained the pixel value (mm) for the raster cells in agriculture fields. 1 Discrepancies with Table 1 above are due to some water area included in the GIS boundaries of the island.

15
Figure 7. Upper Roberts land use in July 2007 and actual evapotranspiration SEBAL.
16
Figure 8. Middle Roberts land use in July 2007 and actual evapotranspiration from SEBAL.
17
Figure 9. Lower Roberts land use in July 2007 and actual evapotranspiration SEBAL.

18
3.2 Data Sources and methods to extract ET information
The DWR 2007 land use survey land use attributes table was joined to the attribute table containing the cell values for all of the SEBAL rasters using the unique field (parcel) identifier as a common element. This table was saved as a text file which was then imported into MS Excel or Access for analysis. Raster sampling for all islands for actual evapotranspiration (ETa) is illustrated in the Figures 5 to 9 above.
Some quality assurance and quality control procedures were conducted to avoid the effect of outlier measures. As mentioned earlier, a land use buffer of 15 meters was used for every polygon in the land use file. This was employed with the intention to avoid noise in the boundaries of the fields caused by waterways and roads on measurement of evapotranspiration through remote sensing. Also, in cases in which a set of sampling points reported were deviated by more than a standard deviation, a review of the special conditions of the field in the DWR land use survey was conducted. Fields with young trees or those not irrigated that season were removed from the sample.
3.2.1 Crop Evapotranspiration (ITRC)
Crop evapotranspiration following the Irrigation Training and Research Center (ITRC) of California Polytechnic State University-San Luis Obispo (IRTC-based spreadsheet method) were employed. ITRC has 13 zones for California, from which two correspond to the Sacramento San Joaquin Delta: Zone 12 for the Central and South Delta and Zone 14 for the North and West Delta. Ryer Island was matched with Zone 14 whereas Brack Tract and the three Roberts Islands were located within Zone 12. The process to estimate evapotranspiration from crops follows the guidelines presented by the San Joaquin County Flood Control and Water Conservation District: these are available at http://www.sjwater.org. As with SIMETAW, crop classification from ITRC was matched with that from DWR’s 2007 land use survey.
3.2.2 Crop Evapotranspiration Using Cal-SIMETAW
Various measures of crop water use were provided by DWR from the Cal-SIMETAW model: These include applied water, fraction, effective precipitation, total evapotranspiration, evapotranspiration of applied water and irrigated crop areas. The level of aggregation of Cal-SIMETAW estimates is Detailed Analysis Unit and County, the smallest spatial analysis unit for DWR data and planning information. Cal-SIMETAW was modified to perform the daily water balance to determine ETc and ETaw for 8 crop categories on each of the 5 islands within the Delta that were included in this study. Total evapotranspiration was compared with SEBAL potential evapotranspiration. To compare Cal-SIMETAW with the SEBAL dataset, matching of land use classes between Cal-SIMETAW 20 crop group classification and land use classes from DWR’s 2007 land use surveys was completed.
3.2.3 Spatial and temporal scales in ET estimation comparisons
A three-way comparison was conducted for this proof of concept study. SEBAL 2007 evapotranspiration (actual and potential), Cal-SIMETAW crop evapotranspiration, and crop annual evapotranspiration using the ITRC calculations. Results of that comparison are presented in the next section. It is worth clarifying that the spatial and temporal scales of the three methods vary widely, yet the data was reconciled to average ET by island and crop group for the irrigation season (from March to October of 2007). The SEBAL actual ET estimations are the average of the field by crop group from March to September. ITRC yields crop ET estimates by month and crop group for two evapotranspiration zones in California. We add the monthly crop ET from March to October to obtain the seasonal crop ET. SIMETAW provides seasonal estimates at the island level for the same crop groups for potential (ETp).
19
Chapter 4 Evapotranspiration Results
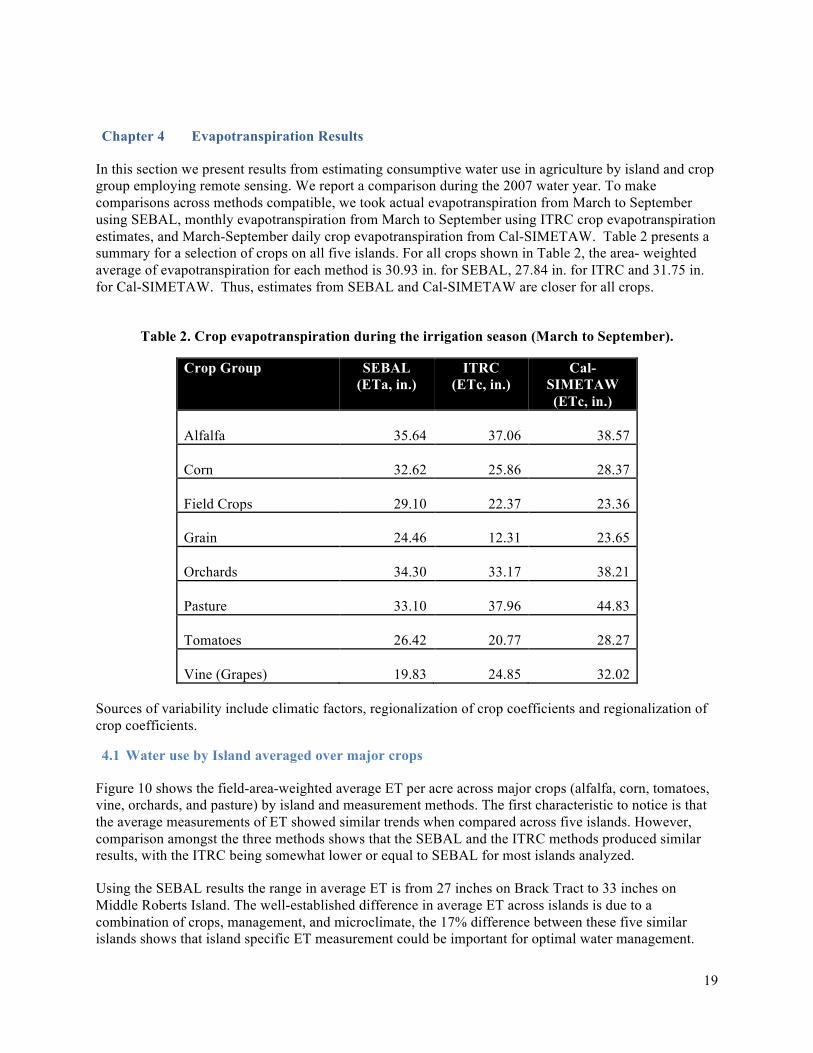
In this section we present results from estimating consumptive water use in agriculture by island and crop group employing remote sensing. We report a comparison during the 2007 water year. To make comparisons across methods compatible, we took actual evapotranspiration from March to September using SEBAL, monthly evapotranspiration from March to September using ITRC crop evapotranspiration estimates, and March-September daily crop evapotranspiration from Cal-SIMETAW. Table 2 presents a summary for a selection of crops on all five islands. For all crops shown in Table 2, the area- weighted average of evapotranspiration for each method is 30.93 in. for SEBAL, 27.84 in. for ITRC and 31.75 in. for Cal-SIMETAW. Thus, estimates from SEBAL and Cal-SIMETAW are closer for all crops.
Table 2. Crop evapotranspiration during the irrigation season (March to September).
Crop Group SEBAL (ETa, in.)
ITRC (ETc, in.)
Cal-SIMETAW (ETc, in.)
Alfalfa 35.64 37.06 38.57
Corn 32.62 25.86 28.37
Field Crops 29.10 22.37 23.36
Grain 24.46 12.31 23.65
Orchards 34.30 33.17 38.21
Pasture 33.10 37.96 44.83
Tomatoes 26.42 20.77 28.27
Vine (Grapes) 19.83 24.85 32.02
Sources of variability include climatic factors, regionalization of crop coefficients and regionalization of crop coefficients.
4.1 Water use by Island averaged over major crops
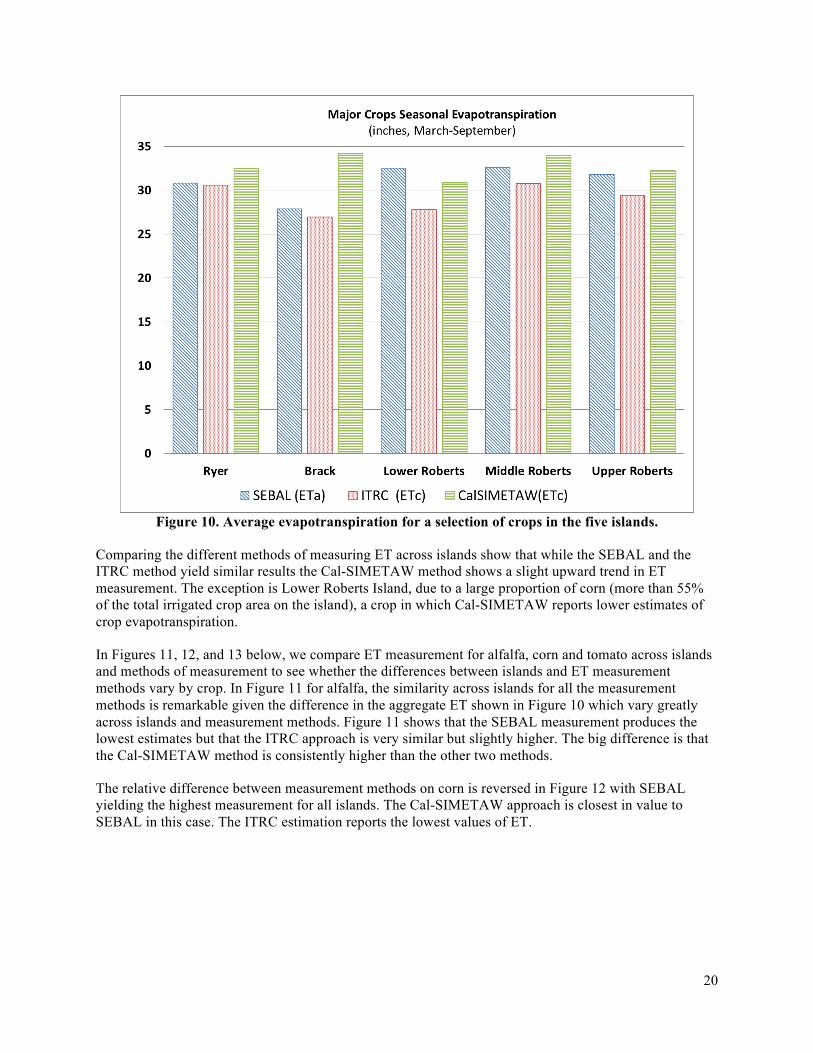
Figure 10 shows the field-area-weighted average ET per acre across major crops (alfalfa, corn, tomatoes, vine, orchards, and pasture) by island and measurement methods. The first characteristic to notice is that the average measurements of ET showed similar trends when compared across five islands. However, comparison amongst the three methods shows that the SEBAL and the ITRC methods produced similar results, with the ITRC being somewhat lower or equal to SEBAL for most islands analyzed.
Using the SEBAL results the range in average ET is from 27 inches on Brack Tract to 33 inches on Middle Roberts Island. The well-established difference in average ET across islands is due to a combination of crops, management, and microclimate, the 17% difference between these five similar islands shows that island specific ET measurement could be important for optimal water management.
20
Figure 10. Average evapotranspiration for a selection of crops in the five islands.
Comparing the different methods of measuring ET across islands show that while the SEBAL and the ITRC method yield similar results the Cal-SIMETAW method shows a slight upward trend in ET measurement. The exception is Lower Roberts Island, due to a large proportion of corn (more than 55% of the total irrigated crop area on the island), a crop in which Cal-SIMETAW reports lower estimates of crop evapotranspiration.
In Figures 11, 12, and 13 below, we compare ET measurement for alfalfa, corn and tomato across islands and methods of measurement to see whether the differences between islands and ET measurement methods vary by crop. In Figure 11 for alfalfa, the similarity across islands for all the measurement methods is remarkable given the difference in the aggregate ET shown in Figure 10 which vary greatly across islands and measurement methods. Figure 11 shows that the SEBAL measurement produces the lowest estimates but that the ITRC approach is very similar but slightly higher. The big difference is that the Cal-SIMETAW method is consistently higher than the other two methods.
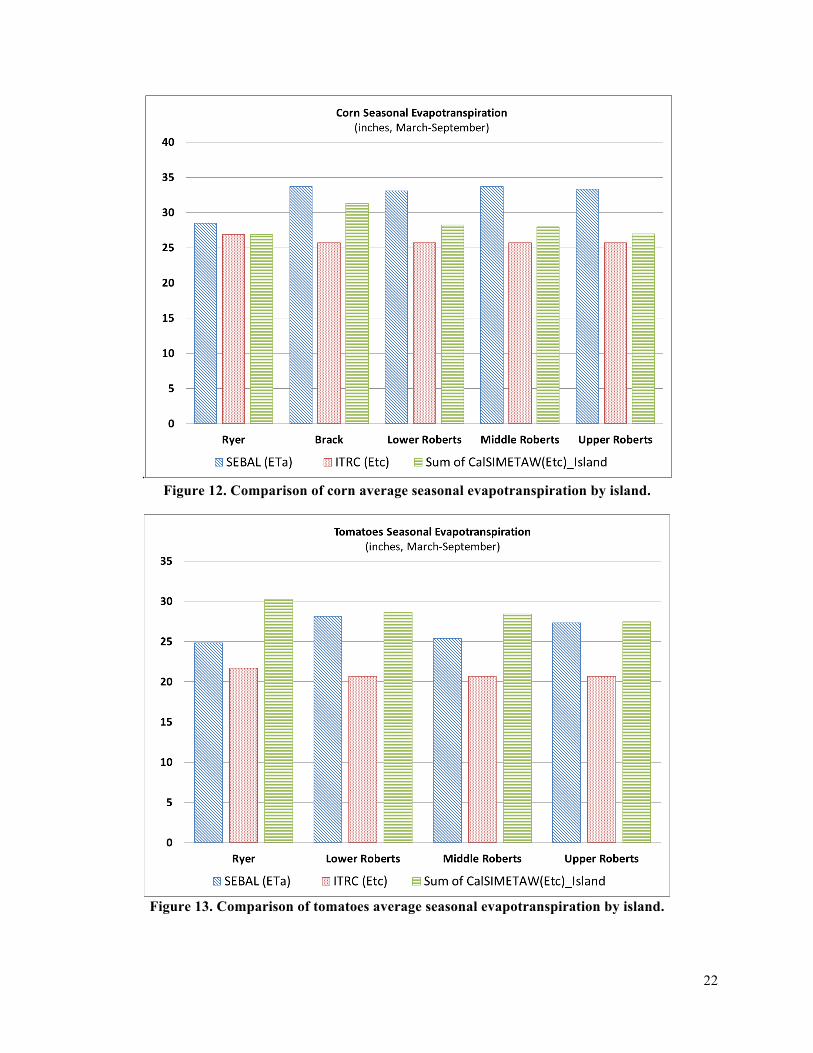
The relative difference between measurement methods on corn is reversed in Figure 12 with SEBAL yielding the highest measurement for all islands. The Cal-SIMETAW approach is closest in value to SEBAL in this case. The ITRC estimation reports the lowest values of ET.

21
Figure 11. Comparison of alfalfa seasonal evapotranspiration by island.
In contrast to Figures 11 and 12, Figure 13 for tomatoes shows a wide variation between methods across islands, but again, SEBAL ET measurements are or higher than ITRC with the Cal-SIMETAW method coming in the highest level. One can only conclude that there is a much wider range of management methods and crop establishment in tomatoes than there is in corn or alfalfa. A second conclusion to be drawn from these crop specific ET measurements across islands is that all three methods are consistent for corn and alfalfa and thus much of the variation across islands can be attributed to variation in cropping patterns. Correct crop identification is thus a very important part of explaining the differences in island water balance for the ITRC and Cal-SIMETAW methods, but as shown, the SEBAL method yields efficient ET estimates without needing to collect costly crop data.
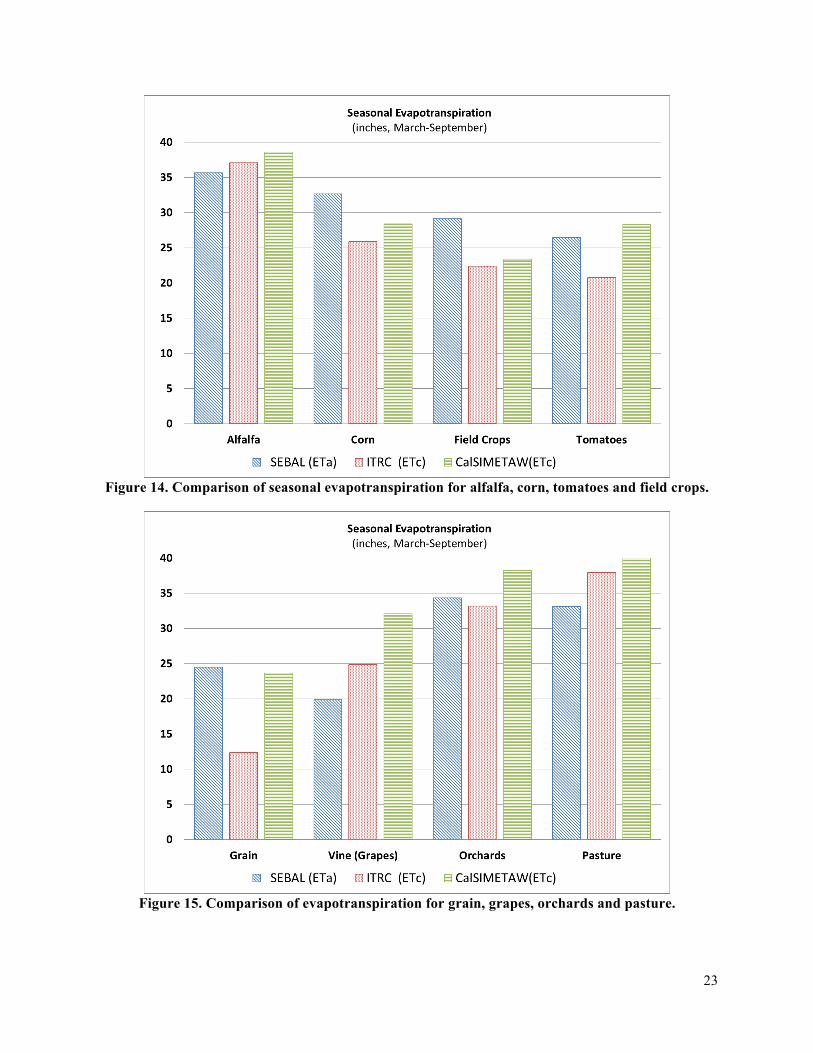
In Figures 14 and 15 we remove the distinction between the five islands by aggregating the ET measures by crop and measurement method. When aggregated across islands the Cal-SIMETAW method seems to produce the highest ET estimates for alfalfa and tomatoes shown in Figure 14, whereas SEBAL produces higher estimates for corn and field crops. Figure 15 which compares grain, grapes, orchards, and pasture shows a much wider variability among the different ET measurement methods with the Cal-SIMETAW method slightly higher than the other two methods except for grain crops in which SEBAL is the highest. Again, from these two figures we can highlight the importance of having both crop and island-specific ET measurement to yield consistent water balance for any given area.
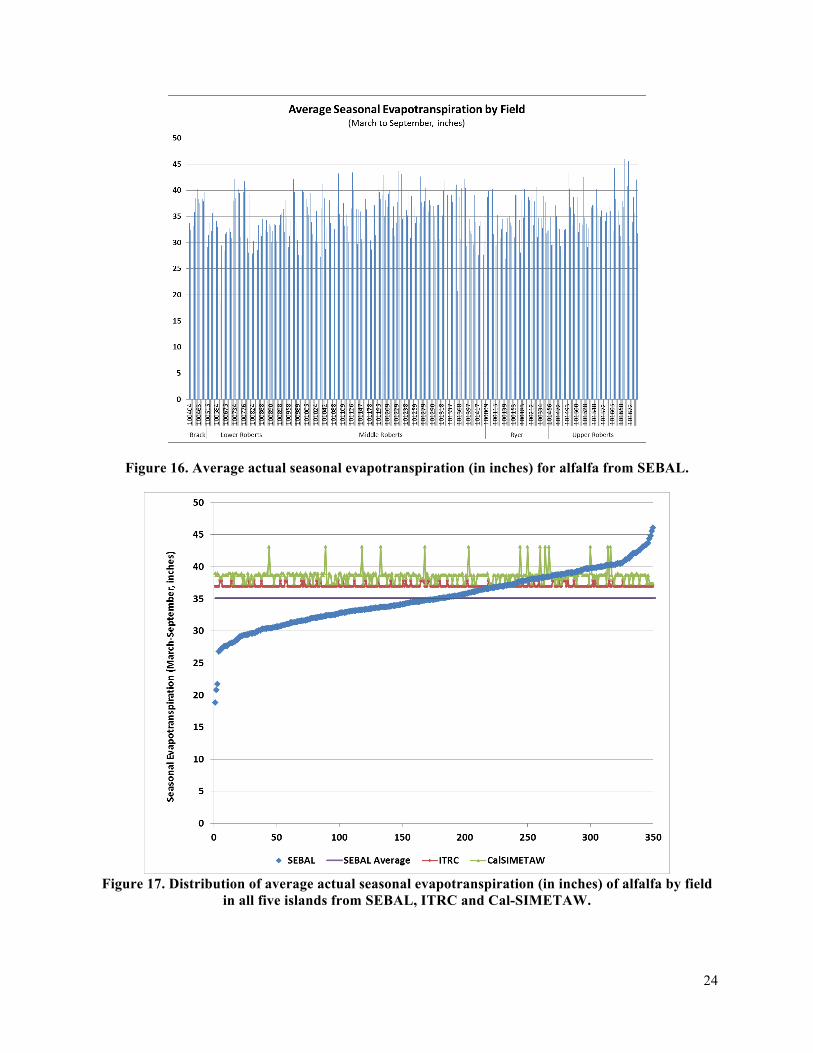
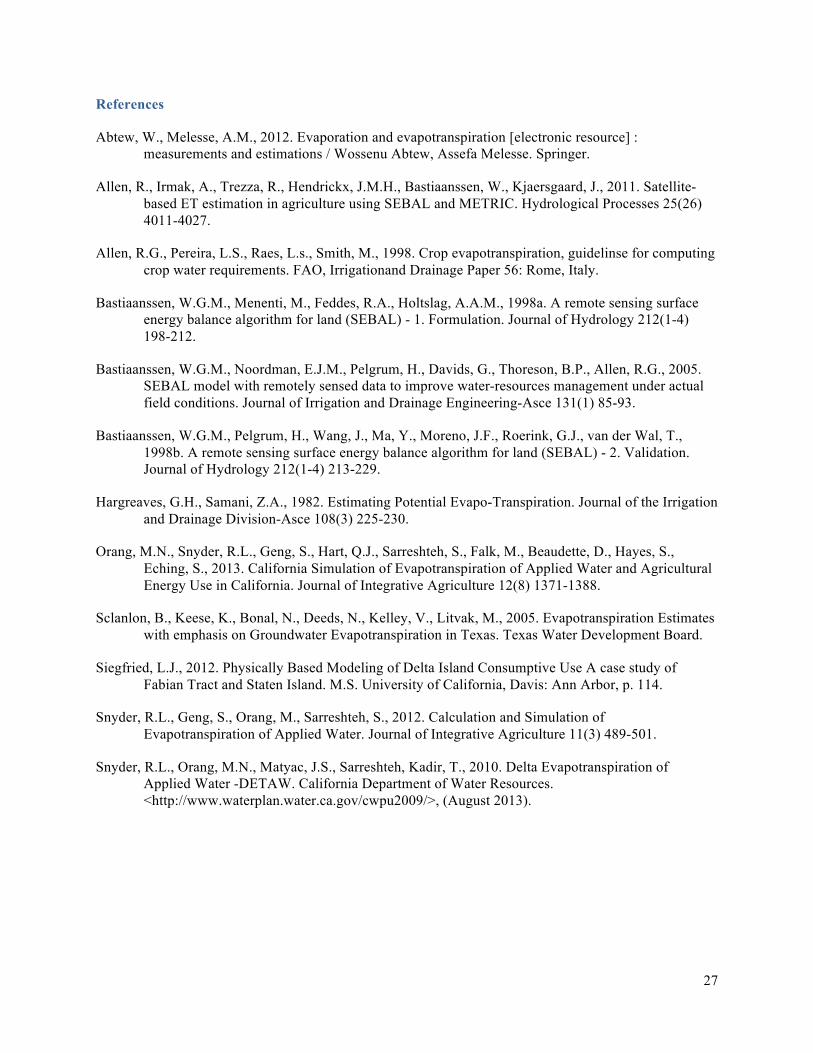
Another aspect to highlight in this analysis is the ability of the SEBAL method to capture variation in the average seasonal actual ET among individual fields. Figure 16 shows a distribution of average seasonal actual ET for alfalfa (one of the most important crops area-wise for the Delta) for about 350 fields, by island. However, there is no apparent pattern for actual ET by island. Likewise, Figure 17 shows a cumulative distribution of the fields for all Delta study areas for all three methods.
22
. Figure 12. Comparison of corn average seasonal evapotranspiration by island.
Figure 13. Comparison of tomatoes average seasonal evapotranspiration by island.
23
Figure 14. Comparison of seasonal evapotranspiration for alfalfa, corn, tomatoes and field crops.
Figure 15. Comparison of evapotranspiration for grain, grapes, orchards and pasture.
24
Figure 16. Average actual seasonal evapotranspiration (in inches) for alfalfa from SEBAL.
Figure 17. Distribution of average actual seasonal evapotranspiration (in inches) of alfalfa by field
in all five islands from SEBAL, ITRC and Cal-SIMETAW.

25
4.2 Discussion and Limitations
Results of this comparison show that for alfalfa, pasture, and vine crops, actual evapotranspiration estimated by SEBAL is lower than ITRC and Cal-SIMETAW calculations during the months of March to September. This shows the ability of SEBAL to account for less applied water during dry years and other water management conditions for some crops.
Some limitations of this comparison are inherent to the methods employed in the analysis. SEBAL estimates are for actual evapotranspiration during the irrigation season from March to October. ITRC provides year-round estimates of ET by crop and zone yet only the same period as SEBAL was reported here. Cal-SIMETAW estimates by crop and island control for effective precipitation, yet only crop evapotranspiration from March to September is analyzed. Both ITRC and Cal-SIMETAW assume well-watered crops, which means that the soil moisture content that can be employed by the plant is enough to fulfill evapotranspiration, or that the soil water depletion does not exceed the yield threshold depletion.
Matching crop groups among methods can also explain some of the large differences in the crop evapotranspiration, especially for grains. Cal-SIMETAW uses grain hay as proxy for the grains crop group, which is grown from March to July. A more detailed matching of crops is possible in cases where enough information exists on the specific land use. It is possible that double cropping of about 1,000 acres in winter crops may account for this difference.
Despite these caveats, we conclude that this case study on five islands has shown that remotely sensed satellite data can accurately and directly measure actual ET by point of diversion, thus providing a more detailed and fully automated alternative to the current ITRC-based spreadsheet method.

26
Chapter 5 Conclusions
This study concludes that evapotranspiration estimates of applied water for crops in the Delta using ITRC-based spreadsheet methods is close to estimates using remote sensing and SEBAL. Conversely, the Cal-SIMETAW customized model proves to be overall closer to SEBAL than the ITRC-based spreadsheet method. However, periodic updates of climatic data to better account for reference evapotranspiration in crops are necessary for Cal-SIMETAW. SEBAL can replace current methods accurately without reference to ET crop signatures. In addition, the SEBAL method can be used to measure water efficiency, crop stress, water balances and differences in management and technology as reflected in ET.
Remotely-sensed evapotranspiration measurements provide an independent and detailed record of actual water use, and as such can provide timely and consistent data sources for a wide range of water management problems. While the system setup costs are not trivial, the system has substantial economies of scale that make a statewide interagency approach attractive.
Future work recommended for the Delta Protection Commission is to complete a comparison for the entire Legal Delta. To improve this comparison more, the use of other models to estimate evapotranspiration in crops, such as DETAW and IDC/IWFM that have a finer resolution than CalSIMETAW and ITRC, would be helpful. Data programs to support land use and irrigation efficiency surveys as well as remote-sensing information in partnership with other state and federal agencies is also encouraged.
Acknowledgements
This research was funded by the Delta Protection Commission. Data including land use, SIMETAW, Cal-SIMETAW, DETAW, IWFM, SEBAL datasets and technical support from the Delta Modeling Office of the California Department of Water Resources and other departments was appreciated. In particular, we thank Tariq Kadir, Lan Liang, Tara Smith, Orang Morteza and Can Dogrul for their invaluable inputs. We also thank Davids Engineering and SEBAL of America for providing technical assistance in interpreting SEBAL estimates provided to us by DWR. Research support from Andrew Bell and Paula Torres from the Center for Watershed Sciences of UC Davis for preparing this report is also acknowledged.
27
References
Abtew, W., Melesse, A.M., 2012. Evaporation and evapotranspiration [electronic resource] : measurements and estimations / Wossenu Abtew, Assefa Melesse. Springer.
Allen, R., Irmak, A., Trezza, R., Hendrickx, J.M.H., Bastiaanssen, W., Kjaersgaard, J., 2011. Satellite-based ET estimation in agriculture using SEBAL and METRIC. Hydrological Processes 25(26) 4011-4027.
Allen, R.G., Pereira, L.S., Raes, L.s., Smith, M., 1998. Crop evapotranspiration, guidelinse for computing crop water requirements. FAO, Irrigationand Drainage Paper 56: Rome, Italy.
Bastiaanssen, W.G.M., Menenti, M., Feddes, R.A., Holtslag, A.A.M., 1998a. A remote sensing surface energy balance algorithm for land (SEBAL) - 1. Formulation. Journal of Hydrology 212(1-4) 198-212.
Bastiaanssen, W.G.M., Noordman, E.J.M., Pelgrum, H., Davids, G., Thoreson, B.P., Allen, R.G., 2005. SEBAL model with remotely sensed data to improve water-resources management under actual field conditions. Journal of Irrigation and Drainage Engineering-Asce 131(1) 85-93.
Bastiaanssen, W.G.M., Pelgrum, H., Wang, J., Ma, Y., Moreno, J.F., Roerink, G.J., van der Wal, T., 1998b. A remote sensing surface energy balance algorithm for land (SEBAL) - 2. Validation. Journal of Hydrology 212(1-4) 213-229.
Hargreaves, G.H., Samani, Z.A., 1982. Estimating Potential Evapo-Transpiration. Journal of the Irrigation and Drainage Division-Asce 108(3) 225-230.
Orang, M.N., Snyder, R.L., Geng, S., Hart, Q.J., Sarreshteh, S., Falk, M., Beaudette, D., Hayes, S., Eching, S., 2013. California Simulation of Evapotranspiration of Applied Water and Agricultural Energy Use in California. Journal of Integrative Agriculture 12(8) 1371-1388.
Sclanlon, B., Keese, K., Bonal, N., Deeds, N., Kelley, V., Litvak, M., 2005. Evapotranspiration Estimates with emphasis on Groundwater Evapotranspiration in Texas. Texas Water Development Board.
Siegfried, L.J., 2012. Physically Based Modeling of Delta Island Consumptive Use A case study of Fabian Tract and Staten Island. M.S. University of California, Davis: Ann Arbor, p. 114.
Snyder, R.L., Geng, S., Orang, M., Sarreshteh, S., 2012. Calculation and Simulation of Evapotranspiration of Applied Water. Journal of Integrative Agriculture 11(3) 489-501.
Snyder, R.L., Orang, M.N., Matyac, J.S., Sarreshteh, Kadir, T., 2010. Delta Evapotranspiration of Applied Water -DETAW. California Department of Water Resources. <http://www.waterplan.water.ca.gov/cwpu2009/>, (August 2013).