comparative study on the physico- chemical...
TRANSCRIPT
COMPARATIVE STUDY ON THE PHYSICO-CHEMICAL CHARACTERISTICS OF SOME OF THE
SOILS OF DIFFERENT REGIONS OFUTTARANCHAL
ThesisSubmitted to the
Kumaun University Nainital
By
RUCHI PANDEY
UNDER THE SUPERVISION OF
PROFESSOR (Mrs.) A. ADHIKARI
Department of Chemistry, D.S.B. Campus
Kumaun University, Nainital
(UTTARAKHAND)
2008
DocumentsPDFComplete
Click Here & UpgradeExpanded Features
Unlimited Pages

ACKNOWLEDGEMENTS
At this great moment of submission of my Ph.D. thesis first of all I shall
express my indebtedness to my supervisor respected Prof. (Mrs.) Alka Adhikari
for her valuable guidance, untiring supervision and continuous encouragement
throughout the course of present work.
I would like to express my deep sense of gratitude and indebtedness to
respected Professor C.S. Mathela ji, Head Department of Chemistry, D.S.B.
Campus, Kumaun University, Nainital for his valuable suggestions and
encouragement.
I am grateful to Prof. S.P.S. Mehta, Department of Chemistry, D.S.B.
Campus, Kumaun University, Nainital, for all necessary help and cooperation. I
am also grateful and obliged to all my teachers and staff members of D.S.B.
Campus, Kumaun University, Nainital for their help, encouragement and
blessings.
I wish to express my thanks to Dr. B.P. Gaur and Dr. H.S. Hasmi, Soil
Testing Laboratory Rudrapur, U.S. Nagar (Uttarakhand) for all the necessary
help and cooperation to me during my research work. I also thank S.K. Sexana
ji, Soil Science Laboratory, G.B. PantUniversity of Agriculture and Technology,
Pantnagar.
I am thankful to Mr. R.D. Bhatt (Advc.) Shri R.P. Sharma (Advc.), Mr.
N.K. Bhatt (Advc.), Mr. K.S. Waldia, Mr. Anmol Agrawal, Mr. K.S. Bisht,
Mr. Lalit Bisht and Vijay Chandra Tewari for their genuine help, cooperation
and encouragement during the entire period of my research work.
DocumentsPDFComplete
Click Here & UpgradeExpanded Features
Unlimited Pages

Thanks are also due to the authorities of G.B. Pant Agriculture and
Technology University, Pantnagar for extending library facilities to me during
the course of my research work.
I am grateful to those eminent scholars, research workers, authors whose
thoughts, ideas and writings have been useful to me for presenting this humble
work. I am also grateful to all other persons for their help whose names I could
not mention here due to lack of space.
No words can adequately express the affection and loving care of my
mother respected Mrs. Indira Pandey ji and my father respected Sri Dinesh
Chandra Pandey (Adv.) whose help, sacrifice and blessings have sustained me
through this difficult and pains taking effort. I shall always keep in mind the
contribution, affection and blessings of my parents throughout my life.
I would like to express deep sense of indebtedness to my brother Mr.
Bharat Pandey, all my friends and wellwishers for their help, cooperation and
encouragement during the course of my research work. I am also grateful to Mr.
M.S. Rana ji for typing and formatting the manuscript so neatly and speedily.
Place: Nainital
Date: / /2008 (Ruchi Pandey)
DocumentsPDFComplete
Click Here & UpgradeExpanded Features
Unlimited Pages

CERTIFICATE
This is to certify that the thesis entitled COMPARATIVE STUDY ON THE
PHYSICO-CHEMICAL CHARACTERISTICS OF SOME OF THE SOILS OF
DIFFERENT REGIONS OF UTTARANCHAL submitted in full requirement for the
Degree of Doctor of Philosophy in Chemistry to the Kumaun University,
Nainital, is based on the original investigations carried out by Ruchi Pandey, M.Sc.,
under my supervision.
It is also certified that this thesis or its contents have not been submitted for
the degree of any other University.
It is further certified that Ruchi Pandey has put in more than two hundred
days of attendance in the department for her laboratory work.
Place: Nainital Prof. Alka Adhikari
Dated: / /2008 Research Supervisor Department of Chemistry D.S.B. Campus, Kumaun University
Nainital – 263 002 (Uttarakhand)
Prof. C.S. Mathela Head,
Department of Chemistry D.S.B. Campus, Kumaun University Nainital – 263 002 (Uttarakhand)
DocumentsPDFComplete
Click Here & UpgradeExpanded Features
Unlimited Pages

CONTENTS
S.No.
CHAPTERNO.
PARTICULARS PAGENO.
1. I INTRODUCTION 1 – 8
2. II A SHORT REVIEW OF LITERATURE 9 – 209
3. III A BRIEF DESCRIPTION OF THE
STUDY AREA
210 – 214
4. IV MATERIALS AND METHODS 215 – 242
5. V OBSERVATION AND RESULTS 243 – 260
6. VI DISCUSSION 261 – 277
7. VII REFERENCES 278 – 310
DocumentsPDFComplete
Click Here & UpgradeExpanded Features
Unlimited Pages

CHAPTER - I
INTRODUCTION
DocumentsPDFComplete
Click Here & UpgradeExpanded Features
Unlimited Pages

1.1 INTRODUCTION
The earthy material in which the plants grow is known as Soil, which has
been derived from the Latin word “Solum”. Soil is also defined as an
independent body in nature with a unique morphology from the surface down to
the parent material as expressed by the sample profiles (Tan; 1995).
Soil can also be defined as: “A dynamic natural body on the surface of
earth, in which plants grow, composed of materials and organic materials and
living forms.”
or
“The collection of natural bodies, occupying parts of the earth’s surface
that support plants, and that have properties due to the integrated effect of
climate and living matter acting upon parent material, as conditioned by relief
over periods of time” (Negi ; 2000).
Soils like a film envelop the surface of our planet. These are the
“Youngest” or rather the most recent formations. The origin of soils, their
position as the boundary between the lithosphere and the biosphere, and their
peculiar structure and composition, which make them so different from other
natural bodies, means that they must be treated as complicated biogeochemical
system (Victorova; 1986).
Soils are created on land surfaces by weathering processes that include
chemical, geological, hydrological, and on the planet earth, biological
DocumentsPDFComplete
Click Here & UpgradeExpanded Features
Unlimited Pages

2
phenomenas. The continual influence of percolating water and the biota produce
a vertical stratification (a soil profile) of the concentration of elements and the
chemical compounds in which they occur. The solid phase of soils is composed
of two broad classifications of compounds: Inorganic (mineral) compounds and
organic matter (Helmke; 2000).
The mechanical or granular composition (texture) of a soil is the number
and size of its mechanical elements or particles after all the compounds holding
them together have been destroyed (Victorova; 1986).
Soil is a dynamic system in which the soil solution is the medium of
physical, chemical and biological processes in soil environments. Soil solution
is in dynamic equilibrium with minerals, organic matter, microorganism, and
soil atmosphere. Thus it is the bottle neck of transformations and transport of
vital and detrimental molecules and ions in the ecosystems (Huang; 2000).
The study of soil is known as the soil science or pedology (pedos means
earth) or edaphology (edaphos means soil). Soil may also be defined as the part
of the earth crust in which humus is present (Shukla and Chandel; 1991).
Soils are divided by texture into the following groups in the American
classification (Victorova; 1986).
(i) Clayey Soils
Clay Very Clayey
Silty Clay
DocumentsPDFComplete
Click Here & UpgradeExpanded Features
Unlimited Pages

3
Silty heavy loam Intermediate Heavy loam
Sandy Clay
(ii) Loamy Soils
Sandy heavy loam Medium loamy
loam
Slightly loamy Sandy loam
(iii) Silty Soils
Silty loam Silty Soil Silty Clay loam
Silt
(iv) Sandy Soils
loamy Sand Sandy Soils
Sand
As per Soil Management Principle “Soil-Fertility Control is possible
where soil testing is practiced” (Cook and Ellis; 1987).
Soil testing makes complete nutrient control a possibility, Fertilizer
experiments are being patterned to determine economically optimum rates of
nutrients application high yields with low production costs per unit are a must in
modern farming.
Farmers of today are different in the failure is more certain and sooner
unless they are obtaining reasonably high yields, improved drainage, many
DocumentsPDFComplete
Click Here & UpgradeExpanded Features
Unlimited Pages

4
improved Cultural practices, better varieties, and control of insects and disease
have helped to set the stage for high yields. As a result, the demand on the soil
has gradually increased. Soil testing lets farmers know how much and what kind
of fertilizer they must apply to be sure of returns from their investments in other
improved practices.
1.2 The proposed work is to be undertaken for the analyse of the soil for its
physical state, its constituents and the nutrients, present in the soil. Different
physico-chemical characteristics of the Khatima region of Uttarakhand State
(formerly known as Uttaranchal since its inception in the year 2000) has be
determined by using standard methods.
The entire study area has been divided into three major regions.
1. Hill Region
2. Bhabar Region
3. Tarai Region
Each of these regions has been sub-divided into specific zones depending
upon the land being used by the farmer of the region for agricultural purposes
the zones have been divided as follows:
1. Hill Region
(i) Bhimtal
(ii) Mehra Gaon
(iii) Khalkwira
DocumentsPDFComplete
Click Here & UpgradeExpanded Features
Unlimited Pages

5
(iv) Nauligarh
2. Bhabar Region
(i) Haldwani
(ii) Gajraula
(iii) Kathgodam
(iv) Kusumkhera
3. Tarai Region
(i) Khatima
(ii) Sitarganj
(iii) Rudrapur
(iv) Pantnagar
The samples were collected periodically from the selected sites at the
same time say around 8.00 a.m. on the day of sampling. Soil samples have been
collected at a depth of 15 cm at the site. Samples have been collected only from
the open places. Sampling dates have been selected in such a way that these
represent the major seasons of the year viz. autumn, winter, spring, dry summer,
and wet summer. Separate sampling calendar has been made for each parameter
to be studied.
Some of the physico-chemical characteristics like temperature, pH and
conductivity have been determined at the spot using a portable soil analysis kit.
Nitrogen has been determined by the Kjeldahl method, and other physico-
DocumentsPDFComplete
Click Here & UpgradeExpanded Features
Unlimited Pages
6
chemical properties, like organic carbon, phosphorous, potassium etc. have been
determined by the standard methods.
The presence of metal ions like, Na+, Cu++, Fe+++ etc. and their
characterization has been done by using Atomic Absorption Spectro-
photometer (A.A.S.).
A comparison of the Physico-Chemical Characteristics of some of the
soils of different regions of the Uttarakhand state has been undertaken by
comparing the results of the present study with the studies done earlier in the
other regions of the state.
The following procedure shall be undertaken for the present study.
1. Collection of the soil samples
Soil samples were collected randomly from a site using soil auger and
carpenter screw auger, Khurpa Knife at the depth of 15-20 cm. All these
samples will be mixed and the mixed sample has been divided into four parts by
the paper quartering method.
2. Analysis of the soil
Analysis of the soil samples have been done under the following steps-
(A) Physical properties
(a) Colour
(b) Odour
(c) Moisture
(d) Temperature
DocumentsPDFComplete
Click Here & UpgradeExpanded Features
Unlimited Pages

7
(e) Bulk Density (B.D.)
(B) Chemical properties
(a) Soil pH
(b) Electrical Conductivity
(c) Cation exchange capacity
(C) Nutrients
(a) Organic Carbon/Organic matter
(b) Metal ions like Na+, Cu++, Fe+++ etc. (by A.A.S.)
(c) Macronutrients (N.P.K.) etc.
(d) Micronutrients (Zn, Cu, Mn)
1.3 Objectives of Present Study
As suggested by Fitts and Nelson (1956), the objectives of the soil
analysis should be:
(i) To group soils into classes for the purpose of suggesting fertilizer and
lime practices.
(ii) To predict the probability of getting a profitable response to the
application of plant nutrients.
(iii) To help evaluate soil productivity.
(iv) To determine specific soil conditions which may be important by addition
of soil amendments or cultural practices.
DocumentsPDFComplete
Click Here & UpgradeExpanded Features
Unlimited Pages

8
The present works have been done in the study area as per objectives
suggested by Fitts & Nelson (1956). The following objectives were also taken
into consideration for the present work.
(i) To study the types of the soil.
(ii) To study the contents of available macronutrients in the soil.
(iii) To study the contents of available micronutrients in the soil.
(iv) To correlate the available soil macro- and micronutrients with properties
of the soil.
(v) To suggest the proper use of the suitable fertilizers for achieving the
maximum yield regularly.
(vi) To compare the results of the present study with earlier work.
With the above mentioned objectives, the analysis of the main soil types
of the Hill region, Bhabar region and Tarai region of Kumaon was attempted
under the following major investigations.
(1) Physical examination of the soil types.
(2) Chemical examination of the soil types.
Standard methods (as describe in chapter IV) were used for determing the
various parameters and for the qualitative as well as quantitative estimation of
the macro-and micronutrients in the soil types. Observation and results have
been reported in Chapter-V, while a discussion has been given in Chapter VI.
References have been given in Chapter VII.
DocumentsPDFComplete
Click Here & UpgradeExpanded Features
Unlimited Pages

CHAPTER - II
A SHORT REVIEW OF
LITERATURE
DocumentsPDFComplete
Click Here & UpgradeExpanded Features
Unlimited Pages

9
2.0 A SHORT REVIEW OF LITERATURE
A short review of the literature on the Soil analysis has been attempted
here, which gives an overview of the work done in this field during the last
three decades.
2.1 ZOU XIAOMING et al., (1992) reported “A new method for
estimating gross phosphorus mineralization and immobilization
rates in soils”. A new method to estimate P transformation rates in
three forest soils and one grassland soil representing an Alfisol, an
Ultisol, and Andisol, and a Mollisol. Three treatments were applied to
each soil in order to separate the processes of mineral P solubilisation,
organic P mineralization, and solution P immobilization. One set of
soils was retained as control, a second set was irradiated with X-rays to
stop microbial immobilization, and a third was irradiated and then
autoclaved, also stop phosphates activity. All three sets of samples were
then incubated with anion exchange resin bags under aerobic
conditions. Differences in resion P among the three treatments were
used to estimate gross P mineralization and immobilization rates.
Autoclaving did not affect resion-extractable P in any of the soils.
Radiation did not alter resin-extractable P in the forest soils but
increased resin-extractable P in the grassland soil. This increase was
corrected in the calculation of potential P transformation rates. Effects
of radiation on phosphatase, activity varied with soils but was within
30% of the original values. Rates of P gross mineralization and
immobilization ranged from 0.6 - 3.8 and 0 - 4.3 mg kg-soil-1 d-1,
respectively, for the four soils. The net rates of solubilization of mineral
P in the grassland soil were 7 – 10 times higher than the rates in forest
soils. Mineralization of organic P contributed from 20-60% of total
DocumentsPDFComplete
Click Here & UpgradeExpanded Features
Unlimited Pages

10
available P in the acid forest soils compared with 6% in the grassland
soil, suggesting that the P mineralization processes are more important
in controlling P availability in these forest ecosystems.
2.2 Lesch S.M. et al. (1992) studied the “Mapping Soil Salinity Using
Calibrated Electromagnetic Measurements”. A statistical modeling
approach is presented that predicts spatial soil salinity patterns from
aboveground electromagnetic induction (EM) readings. In this
approach, EM readings are obtained from a field sampled on a uniform
(centric systematic) grid. A small number of these sample sites are
chosen for soil sampling, based on the observed EM field pattern. The
salinity levels for these soil samples are determined and then the
remaining non-sampled salinity values are predicted from the
corresponding EM readings through a multiple linear regression
equation. Experimental results suggest that this approach will work well
in fields having low to moderate levels of soil textural variability. For
example, 95% of the spatial variability in soil salinity within typical
16.2 ha (40-acre) cotton (Gossypium hirsutum L.) fields could be
accounted for with only 36 soil samples, as opposed to the 200 to 300
soil samples typically required if no EM readings were available. This
approach makes EM readings a more practical and cost-effective tool by
substantially reducing the number of soil samples needed for accurate
mapping of spatial salinity patterns at the field scale.
2.3 Batch L. B. (1992) studied the “Soil water movement in response to
Temperature Gradients: “Exprimental Measurements and Model
Evaluation”. Temperature gradients may have a significant effect on
soil water movement under certain conditions, but inclusion of these
effects adds complexity to the flow analysis. This study was conducted
DocumentsPDFComplete
Click Here & UpgradeExpanded Features
Unlimited Pages

11
to help clarify the significance of nonisothermal water flow, and to
examine theoretical and numerical descriptions of the transport
processes. At initial water contents of 0.00, 0.049, 0.099, 0.151, and
0.282 m3 m-3, isothermal and nonisothermal laboratory experiments
were conducted to provide direct information on soil water movement
in response to temperature gradients. These data were used to evaluate
the numerical simulation model SPLaSHWaTr2, and to examine
calculation of the thermal conductivity, λ(θ), the thermal vapour
diffusivity, the thermal vapour diffusivity, DTV(θ), and the temperature
coefficient of the matric potential, Cψ, based on modifications to a
theory proposed by Philip and de Vries in 1957. A statistically
significant effect of the temperature gradient was found at an initial
water content of 0.151 m3 m-3, which corresponds to a pressure head of
approximately -1.2 m of H2O. No effect of the temperature gradient was
found at an initial water content of 0.00, 0.049, 0.099, or 0.282 m3 m-3.
Under isothermal conditions, the model provided simulated water-
content profiles that were in good agreement with measured profiles.
Under nonisothermal conditions, profiles simulated by the model were
in poor agreement with the measured data, using the original values of
λ(θ), DTV(θ), and Cψ. Sensitivity analysis showed that λ(θ) and DTV(θ)
had a negligible influence on nonisothermal water movement. On the
other hand, Cψ had a significant influence on nonisothermal water
movement. Adjusting Cψ from the original value of -0.0068 K-1 to the
value suggested by Philip and de Vries, -0.00209 K-1, improved the
agreement between simulated and measured water-content profiles,
particularly at an initial water content of 0.282 m3 m-3. With the
adjustment in Cψ, the model simulations were in good agreement with
the measured data, indicating that the Philip and de Vries theory
DocumentsPDFComplete
Click Here & UpgradeExpanded Features
Unlimited Pages

12
provides an adequate description of the nonisothermal transport
processes.
2.4 Sheppard and Thibault (1992) studied the “Desorption and
Extraction of selected Heavy Metals from soils.” The need for proper
disposal of industrial wastes and for remediation methods for soils
contaminated with heavy metals necessitates a better understanding of
the processes involved in mobilizing, transporting, and retaining
elements in surface soils. The objective of this study was to investigate
the desorption in water and efficacy of several traditional extraction
agents in removing Tc, Np, Mo, U, Cr, Pb, Cs, and Th. Selected slices
were taken with depth in acidic sand (Dystrochrept) soil cores that were
spiked for 4 yr. Similarly, Tc, Np, and U were desorbed and extracted
from the clay subsoil of reed /sedge peat cores following a one-season
migration study. Technetium and Mo behaved as anions, and the small
amount of Tc retained was attributed to insoluble organic complexes
and oxides in the sandy soil and carbonates in the clay subsoil. The
retention of Mo was attributed to colloidal Fe(III) oxides and organic
colloids or complexes. Neptunium sorption appears to be dependent on
the variable charge of the soil, making organic matter and pH important
factors. Uranium and Pb were associated with oxides. Cesium and Cr
took part in inorganic reactions that fixed them rigorously to the soil
solids or formed precipitates. The formed organic complexes. Results
suggest that remediation techniques for soils contaminate with Tc, Mo,
and Np could be quite successful using intense leaching with acidified
water. Soils containing U, Pb, and Th may be partially reclaimed by
manipulation of the organic matter or leaching with organic acids;
however, soils contaminated with Cs and Cr would require extensive
chemical treatment.
DocumentsPDFComplete
Click Here & UpgradeExpanded Features
Unlimited Pages

13
2.5 Meek et al. (1992) reported the “Bulk Density of a sandy loam:
Traffic, Tillage, and Irrigation – Methods Effects.” Modern crop
production creates a cycle between soil compaction caused by traffic
and alleviation of this condition by tillage or natural processes such as
freezing and thawing. The objective of this study was to evaluate
important management practices as they relate to changes in bulk
density of a tilled sandy loam soil. Practices evaluated were irrigation
method, time between tillage and traffic, tire pressure and wheel load of
applied traffic, and controlled traffic. Relationships among bulk density,
penetration resistance, and infiltration rate were determined.
Experiments were conducted in the San Joaquin Valley of California, on
a sandy loam soil (Entisol) with an organic-matter content < 1%. After
tillage, settling and trafficking of a soil resulted in rapid changes in its
Bulk Density until a new equilibrium was reached. Tire pressure of 408
kPa and wheel weight of 2724 kg applied at moisture contents near field
capacity resulted in a bulk density of 1.92 Mg m-3, compared with a
value of 1.67 for no traffic. The time interval between tillage and traffic
did not affect final bulk density. Drip irrigation which did not saturate
the soil, resulted in a bulk density of ≈ 0.1 Mg m-3 lower than flood
irrigation, which saturated the soil surface. Wheel traffic in the furrow
resulted in only small changes in the bulk density within the row. When
tillage did not occur between cropping seasons, traffic caused high bulk
densities in the furrow but only small changes in the row. An increase in
bulk density from 1.7 to 1.89 Mg m-3 decreased the infiltration rate by
four times and increased resistance to penetration at the end of the
season by three times. Knowledge of how management practices affect
bulk density can aid growers in reducing recompaction following
tillage.
DocumentsPDFComplete
Click Here & UpgradeExpanded Features
Unlimited Pages
14
2.6 Tietema et al. (1992) reported “Abotic factors regulating nitrogen
transformations in the organic layer of acid forest soils: Moisture
and pH”. A linear relation between gravimetric moisture content and
nitrification was found within the whole studied range of moisture
conditions (10-290% ODW). Net nitrogen mineralization increased
linearly with moisture content up to 140% ODW. At higher moisture
contents, net mineralization was found to be independent of moisture.
Relative nitrification was found to be a linear function of moisture
content. The dependence of CO2 production rates on moisture in the
coniferous litter decreased from low to high moisture availability. Due
to a nearly linear relationship between gravimetric moisture content and
log-(water potential) within the investigated moisture range, the same
type of relationships were found with this latter parameter as well. The
relationship between nitrogen transformations and pH was studied by
means of the addition of different amounts of HCl and NaOH during
short incubation experiments (1 week). Nitrification was found to be a
negative linear function of the H-ion concentration within the range of
0.04 (pH 4.40) and 0.36 (pH 3.45) mmol H-ion L-1. At a higher H-ion
concentration and thus at a lower pH than 3.45, no nitrate was produced
any more. No relationship between net mineralization and pH was
found.
2.7 Sjöström and Qvarfort (1992) studied the “Long-Term, Changes of
Soil Chemistry in Central Sweden.” Analytical chemistry data for
composite samples from the A2, A2/B, B, B/C, and C horizons were
used. The exposed site has a higher exchangeable acidity in the four
upper horizons and a lower base saturation in the A2, A2/B, and B/C
horizons. The content of none extractable metal cations in markedly
lower in the exposed site, and the amount of extractable metal cations is
DocumentsPDFComplete
Click Here & UpgradeExpanded Features
Unlimited Pages

15
larger. This is interpreted as the effect of more intense weathering due
mostly to infiltrate acidic precipitation. The results reveal that long-term
changes of the soil chemistry, including the estimation of metal fluxes,
can be determined by this method.
2.8 Selassie et al. (1992) studied “Saline and Sodic-Saline Soil
Reclamation: First Order Kinetic Model”. A column study was
conducted involving the reclamation of saline and saline-sodic soils.
The amount of water moving through the soils was measured as the
pore volume of drainage. During saline soil reclamation, under saturated
soil moisture flow, the electric conductivity (EC) of the effluent was
defined by a multiple slope, apparent first order kinetic equation. The
data were also described by the parabolic diffusion law equation.
For saline-sodic soil reclamation, under saturates soil moisture flow,
both the decrease in the effluent EC and the sodium adsorption ratio
(SAR), were described by a multiple slope, apparent first order kinetic
equation. The saline-sodic, reclamation under unsaturated soil moisture
flow was also successfully described by a multiple slope first order
kinetic model. Reclamation under an unsaturated moisture regime used
36-40 percent less water than saturated moisture flow. The relation
between the “true” and “practical” SAR using data from both saturated
and unsaturated studied was. SARtrue = 0.02 + 1.085 SAR; r2 = 0.959.
2.9 Kemp et al. (1992) reported “A Simple Model for Predicting Soil
Temperatures in Desert Ecosystems”. The model is based on that of
Parton (Parton, W.J., 1984. Soil Sci. 139: 93-101) and provides
considerable temperature detail with a daily time step: maximum,
minimum, and mean temperature at any depth; hourly temperature
detail if desired. The error in predicted temperatures is about the same
DocumentsPDFComplete
Click Here & UpgradeExpanded Features
Unlimited Pages

16
as those in models that require soil temperature inputs from at least one
depth. This model however, can be used for predicting soil temperature
in arid sites for which there are no soil temperature data or for
predicting soil temperatures under future climates or environmental
conditions.
2.10 Basta and Tabatabai (1992) studied the “Effect of Cropping Systems
on Adsorption of Metals by Soils: II. Effect of pH.” The effect of pH
on adsorption of Cd, Cu, Ni, Pb, and Zn by soils under different
cropping systems was investigated. Plots of metal adsorption vs. pH
(unadjusted) were generated for 24 soils, 12 from each of two long-term
cropping systems. Two soils, one from each site, were selected to study
the metal adsorption over a range of adjusted pH values. Results
showed that differences in metal adsorption were dependent on the
initial heavy-metal concentration. At low concentration, all the added
metals were adsorbed regardless of the solution pH. At high
concentrations, however, metal adsorption by soils was strongly related
to solution pH; metal adsorption increased with increasing solution pH.
A decrease in solution pH with increasing initial metal concentration
was observed for all soils and metals. In general, a decreased in solution
pH for a given amount of metal added followed the sequence: Cu = Pb
> Cb = Ni = Zn. Metal solubility diagrams showed that, in general,
metal adsorption by soils could not be attributed to precipitation.
Although some of the adsorption behaviour of these metals was
consistent with that based on metal hydrolysis, other results showed that
this mechanism could not explain metal adsorption. Metal distribution
coefficients, Kd, decreased sharply with increasing initial metal
concentration and followed the sequence: Pb≥ Cu >> Cd = Ni = Zn.
Also, Kd values were related to solution pH. At high solution part of the
DocumentsPDFComplete
Click Here & UpgradeExpanded Features
Unlimited Pages

17
Pb and Cu adsorption could be explained by adsorption of hydroxo-
complexes from hydrolysis reactions of these metals. Plots of Kd vs.
initial metal concentration suggested that Cd, Ni, and Zn adsorption
could be attributed to ion-exchange reactions.
2.11 Grigal and Ohmann (1992) studied the “Carbon Storage in Upland
Forests of the Lake States”. Carbon storage and dynamics are
receiving increasing attention because of the hypothesized role of CO2
in global climate change. This study was carried out to determine total
C storage in Lake States, forests, including C in biomass, forest floor,
and mineral soil. Over-story trees were measured and samples of both
forest floor and mineral soil (to 1 m) were collected from plots in 169
forest stands across Minnesota, Wisconsin, and Michigan. Five forest
types were represented: balsam fir, Abies balsamea (L.) Mill.; jack pine,
Pinus bankglana Lamb.; red pine, P. resinosa Ait.; aspen, Populus
tremuloides Michx.; and northern hardwoods dominated by sugar
maple, Acer saccharum Marsh. There were no strong geographic trends
in C storage in biomass, forest floor, or mineral soil across the study
area. Storage differed significantly among forest types. Each major C
pool was related to a different set of descriptors. Total C storage, the
sum of all pools, was related to forest type, stand age, available water,
actual evapotranspiration, and soil clay content, explaining about 65%
of the variation. Use of soil and site descriptors did not completely
account for the strong effects of forest type on C storage. Differences in
the size of C pool, as related to time since disturbance and forest type
indicate that C storage in forests of the Lake States can be influenced by
forest management activities. Patterns of C storage in these moist
temperate ecosystems are not as strongly influenced by climatic
variables as in C storage in grasslands to the west.
DocumentsPDFComplete
Click Here & UpgradeExpanded Features
Unlimited Pages

18
2.12 Schnitzer and Kodama (1992) reported the “Interactions between
Organic and Inorganic Components in Particle-Size Fraction
Separated from Four Soils”. Little information is a available in the
literature on the mechanism(s) of interaction of organic matter (OM)
and inorganic crystalline and noncrystalline components in particle-size
fractions. To obtain a better understanding of this subject, five particle-
size fractions, ranging from coarse silts to fine clays, were separated
from two soils from eastern Canada (Armadale and Bainsville) and
from two prairie soils (Melfort and Regina). Each size fraction was
characterized by chemical and mineralogical methods. Humic acids
(HAs), Fulvic acids (FAs), and humins were found to accumulate in size
fractions ranging from medium silts to coarse clays, while alophaties
were concentrated in fractions from medium silts to fine clays. Amino
acids tended to be enriched in clay fractions of the two prairie soils, but
accumulated in the silt fractions separated from the two soils from
eastern Canada. Except for one soil, NH3-N accumulated in the fine silt
and finer fractions, which were rich in expandable phyllosilicates. In
general, amount of OM, aliphatics, and NH3-N tended to accumulate in
fractions rich in noncrystalline inorganic. Noncrystalline inorganic
separated from the two prairie soils were rich in Si, which appeared to
contribute to the preferential accumulation of humin, HA, and neutral
amino acids. On the other hand, noncrystalline components from the
two soils form eastern Canada were rich in Al, which may have been
associated with the accumulation of NH3-N and acidic amino acids in
these soils. The pH-dependent charges of noncrystalline inorganics may
also have contributed to the accumulation of OM.
2.13 Moore et al. (1992) studied “Controls on the Sorption of Dissolved
Organic Carbon by Soils.” Dissolved organic carbon (DOC)
DocumentsPDFComplete
Click Here & UpgradeExpanded Features
Unlimited Pages

19
isotherms were determined for 48 soil samples derived from
Humaquepts, Inceptisols, and Spodosols using a DOC solution derived
from a swamp peat (Hemist). Forty-six of the samples had DOC
sorption adequately represented by the linear initial mass isotherm, with
initial DOC concentrations up to 81 mg L-1. Null-point DOC
concentrations (DOCnp), where there is zero net DOC sorption, ranged
from 6.7 to 85.4 mg L-1, with an average regression coefficient of 0.45.
Distribution coefficients (Kd) averaged 1.00 x 10⁻² m3 kg-1, suggesting
that DOC sorption by soils is of moderate strength compared with
anions such as −−− 343 PO,NO,Cl , and −2
4SO .
DOCnp values were strongly related to contents of soil organic C
(positive) and oxalate-extractable Al and dithionite-ex-tractable Fe
(both negative) using partial regression analysis (R2 =0.41 – 0.61, P <
0.001). A multiple regression with these three variables explained 70%
of the variance in DOCnp. The sorption regression coefficient and
reactive soil pool for DOC were also positively related to soil organic C
content, with an average of 3.2% of the organic C in the soil being part
of the DOC reactive pool.
2.14 Williams and Co-workers (1992) studied the “Comparison of
Methods to Estimate Soil Water Characteristics from Soil Texture,
Bulk Density, and Limited Data.” Regression equations based on soil
texture and bulk density provided poorer estimates of soil water content,
with large errors at some matric potentials, compared with other
approaches examined. Regression model results were improved when
one measured value of soil water content (-1500 kPa) was included as a
variable in the equations, and greatly improved when two (-33 and -1500
kPa) measured values were included. A simple log-log interpolation/
extrapolation approach, based on two measured values at -33 and -1500 kPa,
DocumentsPDFComplete
Click Here & UpgradeExpanded Features
Unlimited Pages

20
provided results similar to the regression model with two known values. The
similar-media scaling approach, utilizing one measured value at -33 kPa,
displayed results similar the log-log method, but the error was slightly
higher. Estimates with the one-parameter model of Gregson, Hector and
McGowan (GHM), based on one known value (-33kPa), was similar to
the log-log interpolation/extrapolation when a required generalized
slope-intercept relatin was calculated for the soils in the study; and the
error was slightly higher when using the generalized relationship found
by GHM for their data. We conclude that the models which
incorporated even one known value of soil water contentmatric potential
relationship were much better than those based on soil texture and bulk
density alone. The simple log-log interpolation/extrapolation and the
one-parameter GHM model provided the best estimates of soil water
content. The scaling method estimates were only slightly worse than the
GHM model estimates. The soil survey data often contain at least one
value of the water characteristic. These point methods should, therefore,
be methods of choice.
2.15 Walters et al. (1992) reported that the “Effects of Soil Aeration,
Legume Residue, and Soil Texture on Transformations of Macro-
and Micronutrients in Soil”. Soil Aeration is an important factor
controlling microbial activity, nutrient availability, and plant root
growth. We investigated the effect of hairy vetch (vicia villosa) addition
to well aerated (60% water-filled pore space (WFPS) and poorly aerated
(90% WFPS) soils of varying texture on transformations of C, N, P, K,
Ca, Mg, S, Zn, Mn, Fe, and Cu for a 30-d period.
Of the total residue C recovered as CO2-C, 84 and 68% evolved in
0 to 10 d and 11 and 19% from 10 to 20 d at 60 and 90% WFPS,
respectively, suggesting rapid decomposition of vetch residue. Of the
DocumentsPDFComplete
Click Here & UpgradeExpanded Features
Unlimited Pages

21
total nutrients added to soil in vetch residue of the total nutrients added
to soil in vetch residue, significant apparent mineralization of N, P, K,
S, and Zn were observed after the initial 20 d of aerobic incubation.
Rapidly decomposing residue enhanced anaerobiosis in poorly aerated soils
resulting in chemical reduction and a severalfold increase DTPA
extractable Mn, Fe, and Cu after 20d. After 30d, reoxidation of these
nutrients resulted in decreased DTPA extractable concentrations. At
90% WFPS, coarse soil texture retarded residue composition, and texture had
a controlling influence on the time required for reoxidation of reduced Fe,
Mn, and Cu in the order of SIC > SiL > SL.
These results imply that incorporation of early decomposable
residue may supply substantial amounts of nutrients to growing plants.
Where soils remain wet for > 10d, residues may create intensive
redacting conditions and a several fold increase in available Fe, Mn, Cu,
and P. Conversely, DTPA extractable Fe, Mn, and Cu can very greatly
within a few weeks depending on soil aeration status, residue
management, time of sampling, and soil texture and may lead to
erroneous indices of nutrient availability to plants.
2.16 Bauer and Black (1992) investigated “Organic Carbon effects on
Available Water capacity of three Soil Textural Groups”. The
objective of this study was to measure the effect of management-
induced changes in soil organic carbon (OC) concentration on soil
characteristics affecting the available water capacity. Four sites each of
moderately coarse (sandy), medium, and moderately fine or fine (fine)
soils were sampled in four increments to 0.457 m within each of two
cropland management system (conventionally cultivated and stubble
mulched) and each of two virgin grassland management systems
(grazed virgin and relict virgin). Measurements of the water
DocumentsPDFComplete
Click Here & UpgradeExpanded Features
Unlimited Pages

22
concentration by weight (Pw) at field capacity (FC) and permanent
wilting point (PWP) were made on disturbed soil samples. Bulk density
decreased with increasing OC concentration. The magnitude of change
was greatest in sandy and least in the medium textured soils. For all
soils combined, a change in sand fraction accounted for about 75% of
the change in Pw at both the FC and the PWP. The change in Pw was
greater at FC than the PWP. A unit change in OC concentration in the
sandy soils caused a greater change in Pw at FC than at the PWP, but in
the medium and fine soils the change in Pw at FC essentially paralleled
the change at the PWP. An increase in OC concentration did not change
the available water capacity in the sandy group and decreased it in the
medium and fine textural groups. Loss of soil productivity induced by
erosion in the northern Great Plains in probably more closely associated
with a decline in nutrients and biological activity than from a change in
available water capacity.
2.17 Johanson and Farmer (1993) reported “Batch versus Column
method for determining distribution of organics between soil and
Water Phases”. Using a low infiltration rate of 2.7 cm day-1 essentially
identical values were obtained by the two methods for the distribution
of napropamide and lindane between the sorbed and solution phases in a
Pachappa sandy loam. Values for KOC of 421 and 1300 L kg-1 were
measured for napropamide and lindane, respectively, at 200C.
Distribution coefficients decreased with increasing temperature. In the
column experiments, similar values for the distribution coefficients
were obtained regardless of whether the amounts of pesticide sorbed
were determined by direct extraction of the soil or by the difference
between quantities added to the columns and the quantities of solute in
the effluent. Both linear and Freundlich isotherm models were used to
DocumentsPDFComplete
Click Here & UpgradeExpanded Features
Unlimited Pages

23
calculate distribution coefficients. The soil column breakthrough curves
were reproducible in duplicate runs for both napropamide and lindane.
When distribution coefficients were estimated using a chemical
retardation factor from the column experiments, the coefficients were
consistently larger than those determined by the batch equilibrium
method.
2.18 Tamari et al. (1993) studied “A Simple Method for Determining Soil
Hydraulic Properties in the Laboratory”. Three methods for the
estimation of the hydraulic properties were used: the reference method,
which requires the pressure head and water content profiles at several
times, and the original and modified Wind methods, which require the
average column water content at several times instead of the water
content profile. Experimental results showed that the hydraulic
properties obtained with the modified Wind method agreed well with
those obtained with the reference method. Simulated data were used to
compare the original and modified Wind methods, and to determine the
effect of added noise on the determination of soil hydraulic properties.
Using the numerical experiments, it was shown that the modified Wind
method provided results slightly better than those of the original Wind
method when the number of tensiometers was greater than three. When
measurement errors were taken into account, estimation of the water
retention curves using the modified Wind method was not very sensitive
to experimental errors, but small uncertainties in tensiometric data
influenced greatly the hydraulic conductivities determined in wet
conditions.
2.19 Moshrefi (1993) studied “A New method of Sampling Soil
Suspension for particle size analysis”. Grain size analysis is
DocumentsPDFComplete
Click Here & UpgradeExpanded Features
Unlimited Pages

24
performed in many soil science laboratories using the pipet method.
However, it is still troublesome and time consuming to sample a
suspension at a particular depth. In this paper a method is presented in
which soil suspensions (clay and silt) were sampled faster and more
easily with a syringe inserted horizontally into the suspension through
septa. The new syringe method was compared with the pipet method.
Both methods were equally accurate but the syringe method has the
advantage of being easier to handle and more time efficient. This makes
it especially suitable for series analysis.
2.20 Amrhein and Co-workers (1993) reported “The Effects of Redox on
MO, U, B, V, and As Solubility in Evaporation Pond Soils”. A
laboratory incubation study was conducted to evaluate the effects of
redox status on the solubility of trace elements in saline sediments and
soils from the San Joaquin valley. The elements U and Mo were
mobilized under oxidizing condition while Fe, Mn, Ni, V, and As were
more soluble under reducing conditions. Reduction and precipitation of
MO, apparently as MOS2, was observed from 1 to 10 days after flooding,
but when reiterated the Mo resolubilized in less than 1 day. The
reductive dissolution of Fe- and Mn-oxyhydroxides released adsorbed
B, which resulted in an increased solution concentration of B. Low
redox conditions in drain water ponds may reduce the solution
concentrations of U, Mo, and Se, thereby reducing their chances of
entering the food chain through algae uptake. However, low redox
conditions favour the solubilization of As and V, which may pose an
alternative threat to wildlife visiting the ponds.
2.21 QIU and ZHU (1993) was studied “Rapid Analysis of Cation
Exchange Properties in Acidic Soils”. The conditions for the
DocumentsPDFComplete
Click Here & UpgradeExpanded Features
Unlimited Pages

25
spectrophotometric determination of exchange acidity with ethyl red in
soil extracts were studied. Results are in reasonable agreement with
those obtained by routine HCl titration after extraction with BaCl2-
triethanolamine. Exchangeable bases in the soil extract can be
determined with atomic absorption spectroscopy or photometrically
using chorophosphonazo III xylidyl blue I, and flamophotometry. After
removal of the extractant, cation exchange capacity can be determined.
2.22 Tariq and Durnford (1993) investigated the “Soil Volumetric
Shrinkage Measurements: A Simple method”. Present methods of
determining soil volume changes have many constraints. They require
the use of hazardous chemicals, take a long time to complete, are not
useful near the wet end of the moisture range, and have limited
accuracy. A new method of soil volumetric shrinkage measurement
using a balloon apparatus is presented. In this method, the soil bulk
volume is determined by measuring the displacement of the soil
specimen wrapped in water with the soil specimen wrapped in a flexible
rubber membrane, an ordinary rubber balloon. The method is very
simple and doesn’t require use of any chemicals. Therefore, it is
environmentally safer than other methods. The volumetric shrinkage
measurements can be completed for the full moisture range in a short
time. The proposed method compares very favourably with the results
of the resion coating method.
2.23 Massman (1993) studied “Periodic Temperature Variations in an
inhomogenous Soil: A Comparison of Approximate and Exact
Analytical Expression”. Comparisons (of the first harmonic) between
exact and two approximate analytical solutions to the one-dimensional
DocumentsPDFComplete
Click Here & UpgradeExpanded Features
Unlimited Pages

26
heat conduction equation for an inhomogeneous soil show that the
approximate analytical solutions are potentially more useful for profiles
of soil thermal properties that exhibit positive or zero concavity than for
those that exhibit negative concavity. Comparisons between the two
approximate analytical solutions also suggest that one solution provides
a much easier method for estimating profiles of soil thermal properties
from soil temperature profiles than does the other. A brief summary of
tree analytical solutions to the one-dimensional heat conduction
equation is also given. Furthermore, some of these extent analytical
solutions are unique to the present study and employ relatively simple
and easily implemented algorithms for their evaluation. For many
applications involving periodic variations in soil temperature, these
algorithms are likely to provide more realistic results than can be
obtained more realistic results than can be obtained by assuming
homogeneous soil properties with their associated “exponentially
decaying” solution for soil temperatures. It is further suggested that the
solutions presented in this work could be used to verify more complex
numerical models of soil heat flow.
2.24 Campbell and Zentner (1993) studied the “Soil Organic Matter as
Influenced by Crop Rotations and Fertilization.” We monitored soil
organic matter in the 0- to 0.15- and 0.15- to 0.3- m depth of a 24-yr
crop rotation experiment conducted on a medium-textured Aridic
Haploboroll in southwestern Saskatchewan. Prior to the study, the land
had been in hard red spring wheat (Triticum aestivum L.)-fallow
rotation for = 50 yr. Only the 0- to 0.15-m segment showed significant
treatment effects. Due to good weather and crop yields in the first 15 yr,
soil organic matter had increased under well-fertilized annually cropped
rotations, and it remained constant under fallow-containing rotations
DocumentsPDFComplete
Click Here & UpgradeExpanded Features
Unlimited Pages

27
and under continuous wheat receiving inadequate N fertilizer. Because
of several dry years in the final 9 yr of the study, all rotations except a
well-fertilized, fallow-winter cereal-wheat system lost organic mater.
Changes in organic matter were directly related to the amount of crop
residues produced by these systems and their ease of eroding. Soil
organic matter was inversely related to apparent N deficit (i.e., N
exposed in grain minus N applied as fertilizer). The fallow-flax (Linum
usitatissimum L.)-wheat rotation receiving N and P fertilizer had the
lowest soil organic matter, partly due to low production of crop residues
by flax, partly to greater leaching of NO3, and partly due to some loss of
flax residues blown form the plots. Soil organic matter in the well-
fertilized fallow-winter cereal-wheat rotation remained constant because
its shorter fallow period reduced soil erosion, and due to its more
efficient use of N, as evidenced by minimal leached NO3-N.
2.25 Mordelet et al. (1993), investigated the “Effects of Tree clumps on
soil characteristics in a humid savanna of West Africa (Lamto,
Coted Ivoire).” Soil texture and field capacity were not significantly
different under tree clumps compared to open grassland. On the other
hand, bulk density was lower under tree clumps, likely due to a greater
soil fauna activity under the trees. The pH, available phosphorus, cation
exchange capacity, total carbon and total nitrogen contents were higher
under tree clumps due to greater organic matter input beneath canopies.
Potential soil respiration and mineral nitrogen accumulation were also
enhanced, indicating a higher potential microbial activity under tree
clumps. Soil water content was slightly lower beneath canopies (from
July to November only between 0 and 10 cm depth) when soil moisture
was above field capacity. During the other months, no significant
difference was measured.
DocumentsPDFComplete
Click Here & UpgradeExpanded Features
Unlimited Pages

28
2.26 Giesler and Lundstrom (1993), studied the “Soil Solution Chemistry:
Effects of Bulking Soil Samples”. This study investigated whether
bulking can affect the chemistry of soil solution extracted by the
centrifuge drainage technique. The short-range variation within a 1-m-
wide pit face was also investigated. Systematic differences were found
between the chemistry of soil solutions taken from bulked and unbaked
soil samples. The soil samples studied were taken on several occasions
from the upper and lower part of a Bs horizon. Samples of soil solution
extracted from replicate bulked soil samples contained significantly
(P ≤ 0.05) larger amounts of Si, Na, Mg, and K as well as significantly
(P ≤ 0.05) smaller amounts of Al and Fe than soil solution from
unbulked samples. Bulking reduced the variation in all solutes
measured, although a variation remained in replicates from the bulked
sample. The variation between individual core samples taken just tens
of centimetres apart can be considerable, although the magnitude of
variation differs depending on the solute studied. The results suggest
that unbulked soil samples may be preferable, especially when Al or Fe
chemistry is studied and a centrifuge drainage technique is used.
2.27 ZHU and Alva (1993) studied the “Differential Adsorption of Trace
Metals by Soils as Influenced by Exchangeable Cations and Ionic
Strength”. The objective of this study was to evaluate the relative
effects of Ca, Mg, and K on the adsorption of Zn and Cu by several
Florida soils under citrus production and to differentiate the specific
cation effects vs. effects of ionic strength on adsorption of Zn and Cu. A
batch-equilibration technique was employed to evaluate the adsorption
of Cu and Zn (added at 10-4 M) in the presence of varying concentration
of Ca or Mg (2.5-15 mmol) or K (5.0-30 mmol). Adsorption of both Cu
DocumentsPDFComplete
Click Here & UpgradeExpanded Features
Unlimited Pages

29
and Zn decreased with an increase in concentrations of either Ca or Mg.
The inhibitory effects of added cations on the metal adsorption was
much greater for Zn than for Cu. Addition of K slightly decreased the
adsorption of Zn but had little effect on Cu. The inhibitory effects of Ca
and Mg on the adsorption of Cu or Zn appear mainly due to competition
for the exchange sites on soil colloids.
2.28 Chiang et al. (1993), studied “Hydraulic properties of Surface Seals
in Georgia Soils.” Few studies have reported measured seal hydraulic
conductivities in soils from the southeast USA. Seven Georgia soils
packed in columns were subjected to simulated rainfall at an intensity of
50 mm h-1. The sandy loam soils were easily disrupted by rainfall. The
calculated seal hydraulic conductivities (Kc) dropped sharply in 10 min
of rain and were less than 10% of the initial saturated hydraulic
conductivity (Ki) after 45 min. The sandy loam soil with low aggregate
statility and Fe content was especially prone to sealing in that Kc
dropped to 4% of Ki after 10 min. The well-structured soil with a clay
texture declined in Kc gradually with time, indicating a high resistance
to rainfall energy. The sandiest soil showed intermediate resistance to
raindrop impact, and Kc levelled off at a high value after 20 min due to
the low clay content. The loamy soil with smectitic clay had the lowest
Ki and showed little change in Kc with time. Relative seal hydraulic
conductivity after 10 or 60 min of rain were good indices differentiating
the relative resistance of these soils to surface sealing. A soil stability
factor, used to characterize the decrease of Kc in an exponential decay
equation, was significantly correlated with water-dispersible clay on a
soil basis.
DocumentsPDFComplete
Click Here & UpgradeExpanded Features
Unlimited Pages

30
2.29 Raven and Hossner (1993) was investigated “Phosphorus Desarption
Quantity- Intensity Relationships in Soils.” Phosphorus desorption
quantity-intensity (Q/I) relationships reveal information about the P
release properties of a soil. This research was carried out to evaluate the
P desorption characteristics of a group of soils of diverse properties and
to compare several empirical models to describe P desorption Q/I
curves. Samples of five soils (Typic Calclustoll, Udic Pellustert, Vertic
Albaqualf, and Aridic Calciustoll surface soils, and Psammentic
Paleudult subsoil) were enriched with five P concentrations (0, 25, 50,
75, and 100 mg P kg-1) and incubated for 31d. Subsamples of each
treated soil sample were equilibrated with different amounts of HCO −
3 -
saturated anion-exchange resin. After 72 h the amount of P sorbed on
the resin (Q) as well as the solution P concentration (I) were
determined. Results from each sub-sample gave a point on the Q/I
curve. The P release capacity of the soils used in this study was
relatively low. In untreated samples, the solution P concentration when
no P was desorbed (Io), an intensity parameter, ranged between < 0.01
and 0.19 mg P L-1, while the maximum desorbed soil P (Qmax), a
quantity parameter, was in the range 4.7 to 21.1 mg P kg-1. The
corresponding P buffering power index, the slope of the Q/I curve at I0,
ranged between 56 and 1703 L kg-1. These Q/I parameters were not
closely related to any evaluated soil property, with the possible
exceptions of CaCO3 content in calcareous soils and clay content. The P
buffering power of a soil apparently depended on the availability of P
sorption sites and their degree of depletion, and was not always directly
related to the ability of a soil to release P. The P release activity of P-
enriched soil depended on the desorbability of the applied P as well as
the native labile soil P. Plots of P buffering power against intensity for a
given soil were not affected by P enrichment. The Q/I curves could be
DocumentsPDFComplete
Click Here & UpgradeExpanded Features
Unlimited Pages

31
best described by a proposed desorption Q/I equation (Q = aI-0.1 + bIn(I
+1)+ c) and the Barrow power function, but the proposed equation followed
the theoretical expected trend. The proposed equation is therefore
recommended to describe P desorption Q/I curves.
2.30 Yaan Cheng and Petty (1993) studied the “Horizontal and Vertical
Movements of Two Expansive Soils in Mississippi”. Expansive soils
create severe problems for road construction and maintenance, building
foundations, and agricultural and industrial operations. Quantification of
soil movement under natural field condition has received little attention
and is not well understood. Horizontal and vertical movements were
measured for 20 mo by surveying rods placed at various depths in field
plots of Typic Chromuderts and Vertic Hapludalfs of the Mississippi
Black land prairie. Vertical soil movement was a function of soil depth,
soil water content, and rainfall. Greatest vertical soil movement
occurred in the upper 50 cm of both soils, with a maximum of 27 mm in
the Vertisol and 24 mm in the Alfisol. Soil swelling occurred in winter
and shrinking occurred in late spring and summer. Horizontal soil
movement was not related to soil depth, but was related to soil water
content and rainfall. Maximum horizontal movement was 36 mm in the
Vertisol and 20 mm in the Alfisol. Horizontal and vertical movements
in expansive soils are reversible, dynamic processes under natural field
conditions. Horizontal movement appears more dynamic than vertical
movement, and in reflects short-term response to precipitation events
followed by drier periods. Vertical movement reflects long-term
precipitation-evapo-transpiration distribution and is probably related to
movement along master slickensides.
DocumentsPDFComplete
Click Here & UpgradeExpanded Features
Unlimited Pages

32
2.31 Osaki (1993) studied the “Carbon-nitrogen interaction model in field
crop production”. Two Carbon-nitrogen interaction models were
developed, one, expressed as DM = DMo exp(CN1 N), was for growth of
Gramineae (rice, wheat, and maize) root crops (potato, sweet potato,
and sugar beet), the other DM = DMo+ CN1, N for Leguminosae
(soybean, field bean, and aduki bean), where, DM is dry weight of plant
at a given time, N is the amount of nitrogen accumulated in plant at a
given time, DMo is the initial amount of dry weight, and CN1 or CN1, is
the carbon-nitrogen index.
The CN1 value changed with the amount of nitrogen absorbed at
the time of harvest (Nh), indicating that the relationship between the
CN1 value and Nh fitted to a hyperbolic curve as follows:
CN1 = 1/(a Nh +b), where, a and b are the coefficients of the equation.
In rice, coefficients a and b were estimated by the Gauss-Newton
method.
2.32 GRANT (1993) investigated “Simulation model of soil compaction
and root growth”. Soil compaction is understood to reduce root growth
by increasing soil resistance to root elongation and by decreasing O2
transport to root surfaces. Although mathematical models have been
proposed for each of these processes, there remains a need for a more
comprehensive model of root growth if the effects of soil compaction on
carbon and nutrient cycling are to be represented in larger ecosystem
simulation models. In the model presented here, root growth simulated
in each horizontal layer of the soil profile is taken to be the lesser of that
enabled by soil strength and that by carbon respiration. Soil strength is
calculated from the bulk modulus of soil elasticity, estimated from bulk
density, water content and organic matter content, and carbon
respiration is estimated from the availability of O2, nutrients and
DocumentsPDFComplete
Click Here & UpgradeExpanded Features
Unlimited Pages

33
reduced carbon in the roots. This model represents an attempt to
integrate the effects on root growth of soil physical characteristics, such
as water content and bulk density, with those of soil chemical
characteristics, such as nutrient and O2 concentrations, and those of
plant biological activity, such as the production of reduced carbon. The
mathematical equations on which the model is based are presented, and
the behaviour of the model is discussed. Further knowledge of how root
branching is controlled will be needed for further model development.
In the accompanying article, this model of root growth is tested against
experimental data recorded in soil different soil bulk densities.
2.33 Whitehead and Raistrick (1993) studied “The volatilization of
ammonia from Cattle urine applied to soils are influenced by soil
properties.” The urine contained 12.0 g N dm-1 and was applied to
small columns of soil at a rate equivalent to 26.5 g N m-2. The soils
were from fields of both grassland and arable cultivation and varied
widely in properties. Ammonia volatilization ranged from 6.8 to 41.3%
of the total urinary N, with a mean value of 26.4%. The soil property
most closely related to the extent of volatilization was cation exchange
capacity (CEC), and this was so whether all 22 soils were considered
together or whether the 14 grassland and 8 arable soils were considered
separately. In general, the higher the CEC the less the amount of
ammonia volatilized. However, for a given value of CEC, volatilization
tended to be greater from grassland than from an arable soil. The pH of
a soil/urine mixture measured after 24 hours was also quite closely
correlated with the amount of ammonia volatilized, but the initial pH
and titratable acidity of soil were poorly correlated with ammonia
volatilization.
DocumentsPDFComplete
Click Here & UpgradeExpanded Features
Unlimited Pages

34
2.34 RON VAZ and co-workers (1993) studied the “Phosphorus fractions
in soil solution: Influence of soil acidity and fertiliser additions.”
The influence of soil acidity and phosphorus fertilization on phosphorus
fractions and dissolved organic carbon (DOC) in soil solution was
quantified experimentally in an iron humus podzol. Soil solution was
isolated by centrifugation from top- and sub-soil samples. Total
dissolved phosphorus (TDP), dissolved reactive phosphorus (DRP),
dissolved organic phosphorus (DOP) and DOC increased as soil pH and
P status increased. DOP was the fraction present at the highest
concentration (0.080 – 0.464 mg P L-1) for the majority of samples.
DOC and DOP concentrations which remained relatively constant down
the soil profile were also highly correlated. Soluble organic P
compounds may make a significant contribution to plant available soil P
particularly for soils with low fertility levels. The relatively high DOP
concentrations (Ca 0.227 mg P L-1) found throughout the soil profile
have important consequences with regards to P leaching and plant
nutrition.
2.35 Zhu and Alva (1993) investigated “Trace metal and cation
Transport in a Sandy Soil with various Amendments.” This study
was conducted to determine the effects of either gypsum, MgSO4, or
K2SO4 on transport of Cu, Zn, Ca, and Mg from a slightly alkaline
sandy soil (top 15-cm layer) using leaching columns. Concentrations of
the above elements were measured in seven leachate fractions, each
representing 0.64 pore volumes. The concentrations of Cu and Zn in the
leachate were greater in the K2SO4-amended than the unamended soil.
Gypsum or MgSO4 amendments significantly decreased the recovery of
Cu and Zn in the leachate, compared with that from the unamended soil;
however, transport of Mg was increased in the gypsum-amended soil;
DocumentsPDFComplete
Click Here & UpgradeExpanded Features
Unlimited Pages

35
however, transport of Mg was increased in the gypsum-amended soil as
a result of cation exchange. The concentration of dissolved organic
carbon (DOC) was highest in the K2SO4-amended soil followed by the
unamended soil and the MgSO4- and gypsum-amended soils. A positive
correlation (r2 = 0.77) was found between the concentrations of Cu or
Zn in the leachate fractions and that of DOC. Since Cu and Zn form
complexes with organic ligands in soil solution, a decrease in transport
of trace metals.
2.36 Quisenberry et al. (1993) studied “A Soil Classification System for
Describing Water and Chemical Transport.” The system is based
primarily on surface texture, clay mineralogy, and nature of soil
structure. We now have developed this system for the more extensive
soil series in South Carolina, and these soils have been grouped into
eight different classes. While variability of some soil properties within a
given class certainly exists, a class is distinct from each of the other
seven classes in water and chemical transport characteristics. A
classification system such as this can help to identify those soil
properties that most affect transport processes and will help to provide
the framework for development of mathematical transport models that
incorporate these same soil properties.
2.37 CHOW and co-workers (1993) investigated “Modification of Subsoil
Characteristics Resulting from Drainage Tile Installation.” Modification
of subsoil characteristics caused by drainage tile installation was
examined on loamy glacial till soils in Nova Scotia and New
Brunswick, Canada. The objectives were to evaluate the effects of
different drain line installation techniques, trenchless vs. trenching, and
system age on subsoil physical characteristics. The area of disturbance
DocumentsPDFComplete
Click Here & UpgradeExpanded Features
Unlimited Pages

36
caused by trenching (both machine and hand dug) tends to be uniformly
30-40 cm wide in the subsoil portion of the profile, whereas a zone of
disturbance 7-17 cm wide was created by the trenchless plow. Although
both methods result in bulk density of the disturbed subsoil being
significantly lower than the undisturbed subsoil, disturbance caused by
trenching exhibited lower bulk density than that of the trenchless plow.
Percent reduction in bulk density did not significantly change over time
periods of up to 30-40 years. Increase in macro porosity of disturbed
subsoils correlated significantly with reduction in bulk density. With
increase in macropores, saturated hydraulic conductivity of the
disturbed subsoil was significantly higher than found originally, except
in newly drained (1 and 2 years) fine-loamy till soils. Saturated
hydraulic conductivity of disturbed subsoils resulting from trenching
was significantly higher than that of the trenchless plow. Although not
always statistically significant, organic carbon content of the disturbed
subsoil was considerably higher than that of the undisturbed. The
difference in organic carbon between the disturbed and the undisturbed
subsoils decreased with increasing time. A significant correlation was
found between the logarithm of the rate of organic carbon
decomposition and average age of installation (r2 = 0.9). This indicates
that the shallow rooted crops being grown (corn and forages) did not, or
could not, possibly because of low pH values, take advantage of the
modified subsoil conditions created since little organic matter from
decaying roots was added to the disturbed soil mass. As a result of
subsoil modifications, surface soil moisture content immediately above
the drain line was lower than the adjacent surface soil.
2.38 Kuiters and Mulder (1993) studied the “Water Soluble Organic
Matter in Forest Soils”. Soil culture experiments were conducted to
DocumentsPDFComplete
Click Here & UpgradeExpanded Features
Unlimited Pages

37
examine the effect of water-soluble organic matter (WSOM), isolated
from the Ah horizon of a forest soil on cation uptake by seedlings of
Agrostis capillaris and Silene dioica. In contrast to the large effects on
soil equilibria, cation uptake was only slightly affected by WSOM.
Solubilized Al, Fe, Cu and Pb, were not found in higher amount neither
in the root nor in the shoot of the test species. Significant effects were
only found for Cd, Mg, Mn and Zn, where uptake was either enhanced
or decreased by WSOM. An experiment with several standard low
molecular weight organic acids affirmed the results obtained with
WSOM and supported the hypothesis that cations are taken up
predominantly in the free ionic form and not as organic complexes.
Results are discussed in relations to the effects often found for fulvic
and humic acids.
2.39 Lefroy et al. (1993) reported the “Changes in soil organic matter
with cropping as measured by organic carbon fractions and 13C
natural isotope abundance.” In soil organic matter with cropping is a
major factor affecting the sustainability of cropping systems. Changes
in total C levels are relatively insensitive as a sustainability measure.
Oxidation with different strength KMnO4 has been shown to be a more
sensitive indicator of change. The relative size of soil C fractions
oxidised by 333 mM KMnO4 delined with cropping, whilst the relative
size of the unoxidised fraction increased. Changes in δ13C ratio have
been used to measure C turnover in systems which include C3 and C4
species.
2.40 Paige and Hillel (1993) reported the “Comparison of three methods
for Assessing Soil Hydraulic properties.” The methods compared are:
the Instantaneous Profile Method, the Guelph Permeameter, and
DocumentsPDFComplete
Click Here & UpgradeExpanded Features
Unlimited Pages

38
laboratory determination using intact soil cores. The saturated
conductivity functions, as well as the moisture retention relationship
when possible, were determined and the results compared with respect
to their ranges of applicability and the respective limitations of each
method. We found close agreement for the moisture retention
relationships determined by the instantaneous determined by the
instantaneous profile method and the soil cores for the ranges of
pressures and moisture contents they have in common. In addition, there
was also close agreement between the K(ψ) relationship measured using
the instantaneous profile method and that predicted using the van
Genuchten and Mualem models. The field saturated conductivity results
determined using the Guelph Permeameter were one to three orders of
magnitude less than the saturated conductivity results determined from
soil cores and those determined by the instantaneous profile method.
The unsaturated K(ψ) relationship using Gardner’s definition of matric
potential and the results from the Guelph permeameter predicted
hydraulic conductivity values three to four orders of magnitude less
then the other two methods at 200 cm of pressure.
2.41 Mc Laughlin and co-workers (1993) studied the “Use of cation/anion
exchange membranes for multi-elements testing of acidic soils.”
They have developed a technique using cation/anion exchange resins
which allows the simultaneous extraction from soil of Ca, Mg, K, Mn,
Al and P. Ions are extracted by shaking soil with resin in distilled water.
The resin is separated from the soil and ions are desorbed from the resin
using an acid/salt solution. Concentrations of ions in solution are then
determined by conventional means. Concentrations of ions extracted by
the resin method were compared with concentrations determined by
commonly-used analytical procedures. Except for Al, concentrations of
DocumentsPDFComplete
Click Here & UpgradeExpanded Features
Unlimited Pages

39
ions extracted by the resin procedures correlated well with conventional
extraction and analytical procedures. The resin membrane method offers
considerable speed and cost advantage over conventional methods.
2.42 Norfleet and co-workers (1993) reported the “Soil Solution
Composition Relative to Mineral Distribution in Blue Ridge
Mountain soil”. Soils with large quantities of gibbsite are normally
associated with tropical climates and very intense weathering. The
abundance of this mineral in the clay fractions of soils in the temperate
climate of the Blue Ridge Mountains raised questions about the soil
environment and possible mineral weathering trends. The composition
of interstitial soil solutions of three highly weathered soils in the
mountains of South Carolina was studied in order to explain contrasting
distributions and prevalence of gibbsite and kaolinite. Extensive
leaching caused by high amounts of rainfall was evidenced from the low
solution ionic strengths and soluble Si content of these soils. The
solubility data suggested gibbsite to be the most stable mineral in
subsurface horizons serving as Al sinks (mineral precipitation), with
kaolinite being more stable in surface horizons. These two minerals
appeared to be in a dynamic equilibrium with hydroxy-interlayered
vermiculite, which is controlled by kinetic gradients imposed by site
characteristics rather than solution chemistry alone. While the solution
composition is consistent with the mineralogical suite of these soils, the
residence time of Al and especially Si appears to be the determining
factor for secondary mineral formations, weathering transformations
and distribution in the soil profile.
2.43 Raj Kumar and co-workers (1994) reported the “Occurrence of
Sodic Soils at Different Geomorphic Locations and Climate in the
DocumentsPDFComplete
Click Here & UpgradeExpanded Features
Unlimited Pages

40
Satluj-Yammuna Divide.” Characteristics of sodic soils do not vary
much with changes in geomorphology and climate of the study area.
These observations do not support the earlier works advocating relief
and climate as the major factor responsible for the formation of sodic
soils. Occurrence of sodic conditions below a normal surface soil in
pedons with lithological discontinuity points towards the parent material
as a factor responsible for the formation of sodic soils in the study area.
Source of salts in sodic soils of north-west India has been linked to
various salts bearing geological formations of sub-Himalayas that have
contributed to the alluvium or the parent material of these soils.
2.44 Jalota et al. (1994) studied the “Evaporate Parameter in Relation to
Soil Texture and Atmospheric Evaporativity to Predict Evaporation
from Bare Soil.” An equation describing effects of soil texture and
evaporativity on evaporation parameter, to be used in square root of
time relation for estimating cumulative evaporation (CE) from soil was
developed. The estimated CE involving the evaporation parameter
computed from the equation matched with the CE data observed by
different workers for varying soil texture and evaporativity.
2.45 Jennifer Donaldson Knoepp and Swank (1994) studied “Long-Term
Soil Chemistry changes in Aggrading Forest Ecosystem.” Assessing
potential long-term forest productivity requires identification of the
processes regulating chemical changes in forest soils. We resample the
litter layer and upper two mineral soil horizons. A and AB/BA, in two
aggrading southern Appalachian watersheds 20 yr after an earlier
sampling. Soils from a mixed-hardwood watershed exhibited a small
but significant decrease in soil pH. Extractable base cation content
DocumentsPDFComplete
Click Here & UpgradeExpanded Features
Unlimited Pages

41
declined substantially in both mineral horizons. Cation content did not
change significantly in the AB/BA soil horizon. Nutrient budgets were
constructed using these soil and litter data plus existing data on
weathering rates, forest productivity, and hydrologic fluxes and
associated chemistry. Decreases in soil base cations and soil pH are
attributed to leaching and to the sequestration of nutrients in biomass.
2.46 Sen et al. (1994) studied “Occurrence and characteristics of some
Kandi Soils in Manipur”. Classical method for identification of clay
cutan or argillic horizon in the field has been a matter of uncertainty till
1987 when ‘Kandi’ concept was introduced into the diagnostic criteria
in Soil Taxonomy for low activity clay (LAC) soils. With this concept,
morphology and soil characteristics of four representative pedons
formed on sedimentary parent material in hilly terrain of Manipur were
studied. All the four soils showed kandic properties and these were
classified as Typic Kanhaplohumult and Typic Kanhapludult.
2.47 Bhattacharyya and co-workers (1994) investigated “Morphology
and classification of Ultisols with Kandic Horizon in North Eastern
Region”. Four Ultisols from north-eastern region of India (Manipur and
Meghalaya) for which no information is available have been classified
according to Soil Taxonomy. The soils are acidic, of low base status and
rich in organic matter in the surface horizons. CEC and ECEC of clay
support the presence of kandic horizon in three pedons. The soils of
Meghalaya appear to be more weathered than those of Manipur.
2.48 Soni et al. (1994) investigated “Effect of Sewage sludge Application
on the Mineralization of Nitrogen in Soils.” The present investigation
was conducted to determine the effect of sludge levels on mineralization
DocumentsPDFComplete
Click Here & UpgradeExpanded Features
Unlimited Pages

42
potential (N0) and rate constant (k) in four different soils. Cumulative N
mineralized increased with increasing incubation period and sludge
application. The magnitude of increase in N mineralized, however, was
not the same with the successive additions of sludge. It was greatest for
the first increment of sludge (0.5%) and subsequently narrowed down
with the further application of sludge. Maximum amount (90 mg kg-1)
of mineralized N was obtained in Karnal soil (Typic Ustochrept) and
lowest amounts (30 mg kg-1) in Balsamand soil (Typic Ustipsamment)
at 4 per cent sludge level. Both soil type and sludge levels significantly
affected the mineralization of sludge organic N. The values for nitrogen
mineralization potential (N0) and rate constant (K) were greater in
sludge treated soils as compared to untreated soils.
2.49 Milap Chand and Dhillon (1994) reported the “Evaluation of various
Soil Test methods for available phosphorous in Reclaimed Sodic
Soils of Punjab.” Ten rapid soil testing procedures for available P were
evaluated. In a greenhouse experiment, wheat grain yield correlated
significantly with P extracted by citric acid, acetic acid, Bray-I, Bray-II,
Egner and Olson’s reagents. Among all the extractants, Olsen’s P with
four hour shaking had the highest correlation coefficient with wheat
grain yield, relative yield, and total P uptake of wheat. The critical level
of Olsen p with four hour shaking below which wheat will respond to P
application was found to be 10 mg P kg-1.
2.50 Bhattacharyya et al. (1994) reported the “Classification of Saline-
Sodic Vertisols in the Coastal Plains of Gujarat”. Morphological and
analytical characteristics of two representative saline-sodic Vertisols in
the humid/subhumid region of coastal plains of Gujarat have been
described. An attempt has also been made to classify such soils bringing
DocumentsPDFComplete
Click Here & UpgradeExpanded Features
Unlimited Pages

43
the important soil characteristics viz. calcareousness, salinity and
sodicity at higher category level in the light of recent modification
suggested by the International Committee on Management of Vertisols
as has been accepted in Soil Taxonomy.
2.51 Bharadwaj and Omanwar (1994) studied “Long Term Effects of
Continuous Rotational Cropping and Fertilization on Crop Yields
and Soil Properties-II. Effects on EC, pH, Organic Matter and
Available Nutrients of Soil.” Continuous cropping without fertilization
leads to the depletion of organic matter, available N, P, K, Fe, Mn, Zn
and Cu, whereas continuous fertilization had beneficial effect on
organic matter and available N, P, and K of the soil. A build up of
available P and K in control plots showed dynamism of these nutrients
in soil. Depletions in DTPA extractable (available) Fe, Mn, Cu and Zn
status of unfertilized as well as fertilized plots indicated these nutrients
were utilized from soil to meet the requirements of crops.
2.52 Bharadwaj and co-workers (1994) studied “Long Term effects of
continuous Rotational cropping and fertilization on crop yields and
Soil properties-III changes in the fractions of N, P and K of the
soil.” Analysis of surface and subsurface soil samples collected from a
long term fertilizer experiment indicated that continuous cropping
without fertilization decreased the N, P and K fractions of soil to a
considerable extent. Well fertilized plots showed an increase in the
factions of these nutrients in soil. The non-distillable acid soluble
nitrogen faction constituted the highest percentage of soil nitrogen. Ca-
P and Fe-P forms were more important than Al-P in rice based cropping
DocumentsPDFComplete
Click Here & UpgradeExpanded Features
Unlimited Pages

44
system. The tendencies of shift from Ca-P to Fe-P and Al-P and from
total K to plant available K were noticed.
2.53 Mathan et al. (1994) investigated “Application of Fertility Capability
Classification Concept in Major Soil Groups of Kamarajar District,
Tamil Nadu.” Twenty one soils, belonging to subgroups Typic
Chromusterts, Typic Ustropepts, Udic Haplustalfs, Typic Haplustalfs,
Vertic Haplustalfs and Tupic Ustorthents were grouped in 8 FCC
(Fertility Capability Classification) units based on type, substrata type
and conditions modifiers. The FCC units will serve as the basis for
conducting fertility related experiments and extrapolation of such
experimental results. The condition modifiers that decide the soil and
fertilizer interactions in the study are ‘d’ (dry condition), ‘b’ (basic
reaction), ‘v’ (vertic characters), ‘m’ (magnesium deficiency), ‘n’
(natric), ‘k’ (potassium deficiency), ‘i’ (Fe-P fixatin) and ‘e’ (low CEC).
2.54 Ladislau Martin Neto et al. (1994) investigated the “Effects of
Cultivation on ESR Spectra of Organic Matter from Soil Size
Fractions of a Mollisol”. Organic matte from different soil size
fractions (<2 µm; 20-50 µm; 50-150 µm, and > 150 µm) was obtained,
using a combination of physical separation and light chemical
treatment, in an Argentine Mollisol. Quantification of semiquinone free
radicals was done using electron spin resonance spectroscopy, taking
into account the organic carbon content of each sample. Values obtained
for fractions less than 50µm in size were significantly higher than
values for fractions greater than 50 µm. Comparison of this data with
C/N ratios suggests that there is an association between fractions where
more humified organic matter occurs and a higher level of semiquinone
DocumentsPDFComplete
Click Here & UpgradeExpanded Features
Unlimited Pages

45
is detected. A 2 to 20µm size fraction was identified as that with the
highest humification degree and one, which undergoes only minor
changes as a result of agricultural practices. Alterations associated with
soil compaction, principally in an A12 horizon in an area cultivated for
80 years, were accompanied by a reduction in the level of semiquinone
free radicals compared with a native grassland area.
2.55 Chandrasekharan and co-workers (1994) was “Studies on Salinity
and Water Content of Soils – Geoelectrical Approach.” Field
investigations curried out using the earth resistivity meter for studying
variations of salinity and water contents of soils in the vadoze zone of
Delhi soils are presented. Variations in the salinity levels have been
interpreted through bulk soil electrical conductivity (ECa measured by
the resistivity meter), electrical conductivity of soil saturation extract
(ECe) and other soil-water parameters. ECa values were also used to
estimate the soil water contents in a soil profile. The spatial variation of
ECa indicates an exponential relation with the corresponding ECe values
and ECa values in a soil profile has curvilinear correlation with soil
water contents. With prior calibration, the resistivity meter can be used
to estimate the soil profile water contents as well as to study the
variation of soil salinity over a larger area. The method is non-
destructive, rapid and gives reproducible results.
2.56 Lebron et al. (1994) studied “Stability of a Calcareous Saline-Sodic
During Reclamation.” General guidelines to reclaim saline or sodic
soils do not adequately condisder variables such as pH and the presence
of organic matter that are known to affect soil stability. Poor structural
stability of sodic, saline-sodic, and high-pH soils adversely influences
crop yields; promotes piping, tunneling, and slope erosion; and can
DocumentsPDFComplete
Click Here & UpgradeExpanded Features
Unlimited Pages

46
accelerate the failure of water conveyance systems. We evaluated six
soil tests, used to measure physico-chemical proprtties, for their
suitability to evaluate the structural stability of a calcareous, saline-
sodic soil under reclamation. The stability tests were wilting point,
plastic limit, coefficient of linear extensibility (COLErod), water
content at 0.03 MPa, liquid limit, and dispersion index. The range of
electrical conductivity (EC) studied was 0.5 to 20 dS m-1, sodium
adsorption ratio (SAR) 0 to 400 (mmol L-1)0.5, and pH 8.4 to 10.5. The
results obtained indicate that the amount of water necessary for a soil to
flow under standard conditions for the liquid limit test decreased an
average of 25% when the EC decreased from 40 to 2 dS m-1. The liquid
limit and EC showed a linear correlation (R2 = 0.785); therefore, the
liquid limit was considered to be an appropriate index to evaluate the
physical properties of a soil under a leaching process.
2.57 “Simulation of Cation Exchange Involving Hydrogen Ion in Soil”
investigated by Kun-Huang Houng (1994). A computer program for
simulating cation exchange in soil was developed and used for
simulating the determination of exchangeable acidity with 1 M KCl and
of hydrolytic acidity with 1M NaOAc. The acidification process
resulting from extraction of an initially base-saturated soil with a dilute
solution of an acid having various dissociation constant may also be
simulated. From the calcuated pH-base saturation relationships for
assumed K-H exchange coefficient (KK-H) varying from 1 x 101 to 1 x
10-6, it is noted that for KK-H values of 1 x 10-n, the inflection point of
the pH-base saturation curve is at the pH value of n. Thus, the
permanent charge sites of mineral soils appeared to have a KK-H value of
1 x 10⁻¹ and greater, while for the pH-dependent charge sites the KK-H
values are smaller than 1 x 10⁻². The acidity extracted by 1 M KCl
DocumentsPDFComplete
Click Here & UpgradeExpanded Features
Unlimited Pages

47
solution corresponded to the H+ on the permanent charge sites, with
KK-H values of 1 x 10⁻² and greater, but it may also include some
portions of H+ bound on exchange sites with KK-H values smaller than
1 x 10⁻². Exchangeable H+ from sites with KK-H smaller than 1 x 10⁻⁵
were practically not displaced by 1 M KCl solution. The use of 1 M
NaOAc instead of KCl could quantitatively displace the H+ held on the
sites with KNa-H values > 1 x 10⁻³ by a single extraction, while those of
1 x 10⁻⁶ and greater may be displaced by repeated extractions.
Calculations with KNa-H values of 1 x 10⁻⁷ did not converge, but
available soil data indicate that the pH-dependent sites of soils have
KNa-H values in the order of 1 x 10⁻⁷. Use of dilute acid solution in place
of KCl or NaOAc solution simulates the acidification process of acid
precipitations.
2.58 Preston and co-workers (1994) investigated the “Using 13C CPMAS
NMR to assess effects of cultivation on the organic matter of
particle size fractions in a grassland soil.” They examined particle
size fractions from the surface horizons of a native untilled grassland
site and an adjacent field cultivated for 65 years in the Peace River
region of British Columbia, Canada. While cultivation resulted in the
loss of approximately 50% of the C and N in the soil, there was little
change in the distribution of particle sizes, in their C/N ratio, and in the
fraction of C found as carbohydrate. Changes in the nature of the
organic C were generally small, but obvious difference was seen in the13C CPMAS NMR spectra of two of the size fractions. Compared with
the native grassland, the sand fraction from the cultivated field had a
lower proportion of 0-alkyl C and a loss of resolution. The clay fraction
from the culttivated field had lower 0-alkyl and higher alkyl C than its
grassland counterpart. Subtraction of linear combination of spectra of
DocumentsPDFComplete
Click Here & UpgradeExpanded Features
Unlimited Pages

48
the whole soil form the two sites showed a 10% increase with
cultivation in the proportion of humified to decomposable organic C.
All of these trends are consistent with a greater degree of decomposition
in the cultivated site. The changes are small and do not suggest a serious
degradation in the quality of the soil organic matter, compared with the
large change in quantity. We also examined factors that might affect the
quality and quantitative reliability of the 13C CPMAS NMR spectra.
Dithionite treatment was not very effective in improving resolution or
fraction of observable C for these samples. The latter was in the range
of 10-30%, largely a result of the association of organic matter with
paramagnetic iron. For this reason, comparison of relative areas must be
interpreted with caution and confined to samples with reasonably
similar contents of C and iron.
2.59 Kohut and Dudas (1994) reported that the ‘Characteristics of Clay
Minerals in Saline Alkaline Soils in Alberts Canda.” A survey of the
the clay mineralogy of surface horizons of 39 salt-affectd soils in
Alberta, Canada, showed that many samples had unusual x-ray
diffraction characteristics in that essentially no basal reflections for
smection minerals were recorded. Four sites were subsequently selected
for detailed mineralogical characterization. Extremely diffuse smectite
diffraction of surface soils and appear to be the result of interaction with
organic matter. After traditional pretreatments to remove organic matter
and carbonates, the clay mineralogy of salt-affected soils was found to
be similar to nonsaline soils. Slight changes were somethimes noted in
the diffraction maxima of the smectite minerals, prossibly indicating
lower crystallinity and layer charge. Tetrahedrally substituted smectites
were not identified, while varibale amounts of high charge smectite or
DocumentsPDFComplete
Click Here & UpgradeExpanded Features
Unlimited Pages

49
vermiculite were detected in most samples. Despite very high ionic
strengths and pH values as high as 10, little or no degradation of clay
minerals appears to be occuring in these soils. Analysis of immiscibly
displaced pore water indicated that the soil solutions were
supersaturated with respect to common phyllosilicates. Relatively low
amount of fine clay, however, indicate that neoformation of clay
minerals is unlikely.
2.60 Xing and Dudas (1994) reported that the “Characterization of Clay
minerals in white clay soils, people’s republic of China.” A widely
distributed white clay soils are major agricultural soils in China. While
some of the chemical, physical, and morphological properties have been
documented for these soils, there is little information available on their
clay mineralogy. The purpose of this study was to conduct a detailed
characterization of the clay mineralogy of white clay soils.
Representative pedons were sampled by horizon and used in the
detailed mineralogical study of these soils. Clay separates were
analyszed by x-ray diffraction methods. Layer charge of 2:1 expandable
phyllosilicates was determined by the n-alkylammonium ion exchange
technique. Elemental composition of clay separates was determined by
inductively coupled plasma atomic emission spectrometry. Vermiculite
and smectites, which have not been recognized before, were identified
in these soils. Other phyllosilicates were mica, kaolinite, and chloritic
intergrades. Vermiculite had a uniform charge distribution of 0.82
molc/O10(OH)2. Layer charge of smectites ranged from 0.36 to 0.47
molc[O10(OH)2]-1 with a mean of 0.41 molc[O10(OH)2]-1. Content of
vermiculite in clay fractions ranged from 150 to 230 g kg-1, mica from
180 to 250 g kg-1, and kaolinite from 310 to 370 g kg-1. The high
contents of kaolinite and mica in A and E horizons may be caused by
DocumentsPDFComplete
Click Here & UpgradeExpanded Features
Unlimited Pages

50
aerosolic dust input and lessivage. Chloritic intergrades are thought to
form from progressive filling of interlayer space of expanding
phyllosilicates during pedogenesis. Smectites may have been derived
from pedogenic weathering of vermiculite in these soils. Systematic
documentation on clay mineralogy of white clay soils provides
fundamental information for agricultural use and management of these
soils.
2.61 Schmidhalter and co-worker (1994) studied “Adsorption of Thiamin
(Vitamin B1) on Soils and Clays”. Recent research suggests that
thiamin applied to soils or coated onto seeds may stimulate plant
growth. The behavior of thiamin in soils has not been investigated.
Therefore, studies were carried out to determine how thiamin hydrochloride
(3-[(4-amino-2-methyl-pyrimidinyl)methyl]-5-(2-hydroxyethyl-4-methylthiazo
-lium chloride hydrochloride) is adsorbed by 17 soils and three clays. The
dominant mechanism in binding of thiamin is thought to be cation
exchange with clay minerals and organic matter. In soils with low to
medium organic matter content, thiamin adsorption occurred primarily
on clay minerals and depended particularly on the amount and
composition of the clay. Adsorption is species dependent (pKa1
[negative logarithm of the first dissociation constant] = 4.85) and takes
place principally in the acidic pH range, probably with position 1′ of the
pyrimidine ring. Adsorption equilibrium is attained in < 30 min.
Adsorption in all soil, and in kaolinite and illite clays, could be
described by a one-surface Langmuir isotherm at initial concentrations
ranging from 16.3 to 995 µmol L-1. Adsorption by smectite in the same
range was log-linearly related to the equilibrium concentration range
from 16.3 to 9890 µ mol L-1 showed that a two-surface Langmuir
DocumentsPDFComplete
Click Here & UpgradeExpanded Features
Unlimited Pages
51
equation more adequately described adsorption in hydroxy-interlayered
vermicultitic and chloritic-illitic soils, whereas a one-surface Langmuir
equation was found to be adequate in mixed layer-smectitic soils. Only
in the case of smectite clays is thiamin allowed to lie in a monolayer
configuration paralled to the basal plane.
2.62 Soil Organic Matter Testing and Labile Carbon Identification by
Carbonaceous Resin Capsules” studied by Johns and Skogley
(1994). The objectives of this study were to apply carbonaceous resin
capsules for measurement of soil organic C (SOC) and for identification
of soluble SOC constitutents. Seven carbonaceous resins, selective for
nonpolar organic adsorbates, were evaluated. The resins were tightly
packed as spherical capsules and placed in saturated soil pastes of 19
Montana Soils. Resin capsules were desorbed with NaOH, CH3OH,
CHCl3, and C6H14. Capsules extracted with the organic solvents were
used in identification by nuclear magnetic resonance and infrared
spectroscopy. Ultrafiltration and atomic absorption spectrophotometry
of trace metals were also used. All resin capsules sorbed measurable
levels of soil labile C (LC). All the resin types provided statistically
significant prediction of SOC. The Ambersorb 564 resin showed the
highest prediction, with a linear relationship between capsule-extracted
LC (NaOH) and SOC of r2= 0.009 (P < 0.0001). Prediction results from
these soils suggested a linear relationship between soluble SOC and
solid-phase SOC, describable as constant partitioning. Labile C was
composed of mostly aliphatics and some aromatics. Carbohydrates,
OH, COOH groups, and metal-organic complexes were present. Most of
the LC was composed of low molecular weight humics (< 1000
daltons). The ability of LC to be desorbed by the more nonpolar
solvents indicated an amphipathic character for some LC constituents.
DocumentsPDFComplete
Click Here & UpgradeExpanded Features
Unlimited Pages
52
The resin capsule methodology showed good testing potential for these
SOC investigations.
2.63 Veldkamp and Weitz (1994) reported the “Uncertainly Analysis of δ13C Method in Soil Organic Matter Studied.” They have performed
an uncertainty analsysis on the calculations in the δ13C method to
evaluate the influence of uncertainty in the input data on the results of
the caluclations. Based on field measurements, we estimated the
frequency distribution of the input data required for the δ13C method
(soil organic carbon, bulk density and δ13C). From these frequency
distributions, 200 randomly chosen data combinations were sampeled,
taking into account their mutual correlations (Monte Carlo sampling).
The data combinations were used to calculate the soil organic C pools in
the forest and pasture and the C loss isnce forest clearing. The
uncertainly in output was described using frequency distributions.
Uncertainty in the output was high, especially for net C loss (ranging
between -79.3 and +63.5 Mg ha-1). An estimation of the C pools within
±10% of the estimated mean at the 90% confidence level required 5
measurements in the forest and 7 in the pasture. Heteroeneity in δ13C
values of soil organic matter was the main reason for the higher sample
number requirement in the pasture, compared to the forest. To estimate
the C loss with the same precision requires 170 measurements in forest
and pasture.
2.64. Shihe Xu and Boyd (1994) reported the “Cation Exchange Chemistry
of Hexadecyltrimethylammonium in a Subsoil Containing Vermiculite.”
Both static and kinetic studied were conducted to probe the inorganic-
HDTMA exchange processes in a subsoil containing vermiculite and to
DocumentsPDFComplete
Click Here & UpgradeExpanded Features
Unlimited Pages

53
determined the chemical stability of the resultant HDTMA-soil
complexes. The HDTMA generally had much higher affinity for the
clay surface than inorganic cations native to soil and thus HDTMA
saturation of soil resulted in a low residual HDTMA concentration in
solution (≈ 10-6 to 10-5 M). Conditions leading to flocculation of soil
clays (e.g., high ionic strength or divalent exchangeable cations)
resulted in inorganic cation entrapment in the interlayers of clays and
decreased cation selectivity coefficients of inorganic-HDTMA
exchange. Under these conditions a portion of HDTMA was adsorbed
inva nonpolar interactions (hydrophobic bonding) resulting in a higher
residual concentration of HDTMA in solution (≈ 10-4 M) and a greater
tendency for HDTMA desorption. The change in electrophoertic
mobility of soil clays and turbidity of soil suspensions as HDTMA
loading increased suggested that HDTMA, if adsorbed via cation
exchange mechanism, caused clay aggregation and tended to distribute
on the internal sites of the aggregates, leaving inorganic cations on
external surfaces. The kinetic study revealed that inorganic-HDTMA
exchange was fast on external surfaces but slow on internal sites of Al-
hydroxy-interlayered vermiculites or flocculated vermiculites where the
inorganic cation entrapment had been found. We concluded that the
most stable HDTMA-soil complexes form at HDTMA loaidng of 0.6 to
0.7 cation-exchange capacity for nonsodic soils.
2.65 Diwakar and Singh (1994) studied the “Characterization of Soils of
Diara Land Occuring in Gangetic Plains of Bihar.” The soils of
Diara land occuring in alluvial fans and flood plains are young and
stratified with AC profiles. They are characterized by light colour, sand
to sandy loam texture, single grain to massive structure, slightly alkaline
DocumentsPDFComplete
Click Here & UpgradeExpanded Features
Unlimited Pages
54
reaction, low CEC and high base saturation. They are found to be highly
siliceous and low in iron and aluminium oxides. The variation in CaO
and K2O contents is attributed to the nature of parent materials. These
soils have very faint and poor pedogenic manifestations as seen in their
morphology. These soils have been classified as Typic Ustifluvents.
2.66 Barber and Diaz (1994) reported the “Maintenance of Yields and
Soil Fertility in Nonmechanized Cropping Systems, Bolivia.” Twelve
cropping systems were investigated in a factorial design, with three summer-
winter crop sequences: ric-peanut (Arachis hypogaea L.), corn (Zea mays
L.)-bean (Phaseolus vulgaris L.) later substituted by cowpea [Vigna
unguiculata (L.) Walp.], and rice-fallow (control); two weed control
treatments: minimal and optinal; and two fertilizer treatments; with and
without 60 kg N ha-1 and 17.5 or 35 kg Pha-1. Crop sequences significantly
increased exchangeable acidity; the rice sequence significantly reduced
exchangeable Ca, and cornbean/cowpea and rice-peanut significantly reduced
exchangeable Mg. Fertilization significantly increased soil P but decreased
Ca. Foliar analysis revealsed N, Mg, and Zn deflciencies in all cropping
systems. Rice yields, unlike corn were significantly increased, by optimal
weeding. Corn yields were dominated by fertilization increased by optimal
weeding. Corn yields were dominated by fertilization, whereas riec yields
were mainly influenced by fertilization in the first and fourth years and by
weeds in the intervening years. Without fertilizer rice-fallow was not
sustainable, and only corn-bean/cowpea was sustainable for 3 yr. With
fertilization, rice-fallow plus optimal weed control and corn-bean/cowpea
with minimal or optimal weeding were sustainable for 3 yr. Additional
fertilizatio and future liming would be necessary for more prolonged
sustainability.
DocumentsPDFComplete
Click Here & UpgradeExpanded Features
Unlimited Pages
55
2.67 Sanchez-Maranon et al. (1995) studied the “Spectroradiometric and
Visual Color Measurements of Disturbed and Undisturbed Soil
Samples.” To standardize the process, and to compare the accurnacy of
the spectroradiometric measurement with the results of visual
determinations, we measured color in natural soil aggregates and in
ground-homogenized samples and represented the results in the CIE
1976 (L*a*b*) color space. Variability in colors in a given aggregate
was evaluated with the parameter <∆E*ab> and was, on average, 10-
fold greater than for ground samples. Grinding and homogenization of
soil materials resulted in significant change in color (18.3 CIELAB
units in average), 89% of this color difference being attributable to an
increase in lightness. Visual measurements of color with standard soil
color charts showed an interobserver variability very similar for
disturbed and undisturbed samples. However, color differences between
the instrumental measurements of soil samples and the average visual
judgements wer 4.41 and 10.19 CIELAB units for disturbed and
undisturbed samples, respectively, with the greatest errors in the
estimation of the L* coordinates in both cases.
2.68 Anthony and co-worker (1995) investigated the “Chamber
Measurement of Soil-Atmosphere Gas Exchange: Linear Vs
Diffusion-Based Flux Models.” They compared linear regression with
a diffusion-based for N2O flux estimation using non-steady-state
chamber gas concentrations from a long-term study of N cycling in a
managed grass pasture on sandy soil in southern Texas. Of 2224
chamber deployments, 449 met criteria established for using the
diffusin-based model, which yielded flux estimates that averaged 54%
larger than linera regression (n =3). Although they represented only
DocumentsPDFComplete
Click Here & UpgradeExpanded Features
Unlimited Pages

56
about 20% of all chamber deployments, this group included most of the
data with greatest influence on the magniture and dynamics of total N2O
exchange at our site; e.g., of the 263 fluese > 10 g N ha-1 d-1, 192 (or
73%) were included. Apparently, application of a linear model to
nonlinear chamber concentration data represents a potentially serious
source of measurement bias that may influence not only summary
statistics for the experiment, but also larger scale budgets based partially
or wholly on those data.
2.69 Polubesova and co-workers (1995) studied the “Surface Charge
Characteristics of Podzolized Soil.” Recently developed method for
the accurate measurement of surface charge components and the points
of zero charge in soils containing both permanent- and variable-charge
constituents were applied to a Haplorthod that is typical of podzolized
soils in North America, Scandinavia, and Russia. Independently
measured values of the density of structural surface charge, net proton
charge, and net adsorbed ion charge were obtained for soil samples
from the E2 and Bhs horizons suspended in LiCl or Li2SO4, solution of
ionic strength 1 or 10 mmol kg-1. Data taken across the pH range 2 to 6
tested successfully for conformity to the law of surface charge balance.
Relationships between the point of zero net proton charge and the point
of zero net charge were consistent with the fact that, at any pH,
increasing ionic strength favoured an increase in the net adsorbed ion
charge, whereas changing from Cl- to SO −24 favored a decrease in the net
adsorbed ion charge. The methodology and charge balance analysis are
applicable to any podzolized soil.
DocumentsPDFComplete
Click Here & UpgradeExpanded Features
Unlimited Pages

57
2.70 Backes and co-workers (1995) studied the “Kinetics of Cadmium
and Cobalt Desorption from Iron and Manganese Oxides.” Oxides
of Fe and Mn in soils are capable of sorbing large amounts of trace
metal ions and can therefore be important in controlling trace metal
concentrations in soil solution, and hence trace metal bioavailability in
soils. There is, however, relatively little information on the rates of
desorption of trace metals from oxide materials or on the factors
affecting desorption rates. The objective of this was to examine the
kinetics of desorption of trace metals from oxide materials or on the
factors affecting desportion reates. The objective of this study was to
examine the kinetics of desorption of Cd and Co from two Fe oxides,
goethite and ferrihydrite, and from two Mn oxides, hausmannite and
cryptomelane. The concentrations of Cd and Co specifically sorbed by
the oxides at pH 6.0 were greater for the Mn oxides than for the Fe
oxides. The metals were also much less readily desorbed from the Mn
than the Fe oxides and, in general, Cd was more readily desorbed than
Co from all four oxides. Increasing the initial sorption period from 1 to
15 wk substantially decreased the proportion of sorbed Cd or Co
subsequently desorbed from goethite, with a similar but much smaller
effect also observed with the Mn oxides. Desorption kinetics for both
Cd and Co were found to be described well be assuming either the
occurrence of two simultaneous first-order desorption reactions, or by a
continous distribution of reaction sites, distributed lognormally with
respect to desorption first-order rate constant. With increasing initial
sorption period, the parameters obtained from fitting either type of
kinetic equation to the experimental data could be interpreted as
indicating a movement of metal ions to sites with slower desorption
reactions.
DocumentsPDFComplete
Click Here & UpgradeExpanded Features
Unlimited Pages

58
2.71 CHAVAN et al. (1995) investigated the “Effect of Forest Tree
Species on Properties of Lateritic Soil.” The Forest tree species in the
ten-year-old plantations at forestry block of Central Experiment Station,
Wakawali did not change the physical properties of the soil under the
canopy, but the effect on the chemical properties of the soil were
conspicuous. The organic carbon, available nitrogen, phosphorus and
potassium increased very markedly in the surface layer. The CEC and
exchangeable cations were also found to increase due to the
decomposition of organic matter added through leaf litter. Calcium was
the dominant among the cations. In general, the soils under the forest
cover showed higher nutrient status.
2.72 John and Abraham (1995) studied the “Microbial Immobilization
and Mineralization of Nutrients during Different Seasons of the
Year.” Representative soil samples were collected from the
experimental plots before, immediately after and 21 days after the
application of treatments. A portion of the soil samples collected after
21 days of incubation under field condition was subjected to chloroform
fumigation, reinoculation, and incubation. All the above soil samples
were analysed and hence quantified the extent of immobilization by soil
microflora and subsequent release through mineralization. The
immobilization and mineralization of organic carbon was maximum
during rainy season in the glucose treated plots registering a net
assimilation of 18.0 to 23.9% and net mineralization of 14.6 to 17.3%
respectively of the total organic carbon content of the soil. Nitrogen also
followed the same trend with net immobilization and mineralization of
214.6 kg N ha-1 and 26.2 to 34.0 kg N ha-1, respectively on the fertilizer
treated plots during rainy season. The immobilization and mineralization of
available phosphorus was highest during summer season with values
DocumentsPDFComplete
Click Here & UpgradeExpanded Features
Unlimited Pages

59
ranging from 4.0 to 16.5 kg P ha-1 and 3.0 to 12.5 kg P ha-1, respectively
in the fertilizer treated plots. In the case of exchangeable potasium, the
net immobilization and mineralization was maximum, during rainy
season in the fertilizer treated plots, which comes to nearly 14 to 84 and
10.5 to 44 kg K ha-1, respectively. The rates of mineralization of
calcium and magnesium followed a random trend about 2 to 15%, 2 to
12% and 5 to 28% and 3 to 15% of the total exchangeable Ca and Mg
are immobilized and mineralized, respectively.
2.73 Sahu and Bala (1995) studied the “Characterization and
Classification of soils on valley plains of middle Andaman Island.”
Five pedons of valley plains of middle Andman Islands were
characterized and classified. Three pedons situated in valley flat plains
had mottles, loam to sandy clay texture with slow permeability and
were moderately acidic to neutral. Two pedons just adjacent to the
valley plains on slightly sloping land and in brackish water marshed
were sandy loam to loam in texture with moderate permeability and
strongly to midly acidic. In all these soils organic carbon content was
generally high in the surface (0.37 – 0.06 g kg-1) and gradually dcreased
with a depth. Exchange acidity was mostly due to exchangeably H+. The
CEC varied from 23.0 to 8.4 cmol (p+) kg-1 and Ca2+ dominated the
exchange complex. Soils of valley plains were classified as Fluventic
Entropepts, Aquic Eutropepts and Aeric Tropaquepts. The other two
soils were classified as Typic Udifluvents.
2.74 Maji and Bandyopadhyay (1995) studied the “Characterization and
Classification of Coastal Soils of various pH Groups in Sundarbans,
West Bengal.” Thirty-four pedons of coastal soils representing an area
DocumentsPDFComplete
Click Here & UpgradeExpanded Features
Unlimited Pages

60
os 15,000 ha of Sundarbans, West Bengal were categories on the basis
of pH variations. Forty per cent of the study area falls in pH range 4-6:
40 per cent in pH range 6-7.5 and the rest 20 per cent in pH range > 7.5.
A representative pedon under each pH category was characterized for
morphological, physical and chemical properties and classified as per
Soil Texonomy.
2.75 Ulf Skyllberg (1995) investigated the “Solution/Soil Ratio and release
of Cations and Acidity from Spodosol Horizons.” The influence of
the s/s ratio on pH, exchangeable acidity, and cations were studied in
soil suspensions of Spodosol O, E, and Bs horizon soil samples in
distilled water, 0.01 M CaCl2, 1.0 M KCl, and 0.5 M CuCl2. An
enhanced s/s ratio resulted in a release of H ions from O and E horizon
soil samples in agreement with a weak acid equilibrium, whereas the Bs
horizon samples showed a higher buffer intensity of pH. A simultaneous
release of organic acids and Al and the fact that samples from the spodic
horizons were close to the point of zero charge indicate a more
complicated pH buffering mechanism in these horizons. The amount of
Al ions released from O and E horizon samples in 1.0 M KCl (Ale) were
simply diluted when the s/s ratio was increased. Therefore, Ale is
suggested to be a quite finite subpool of totally bound Al (Alt; extracted
in 0.5 M CuCl2). A solution of 0.5 M CuCl2 extracted all exchangeable
K+, Na+, Mg+, Mn2+, Fe3+, and Al3+ in O horizon samples, independent
of s/s ratio, wherease the release of Ca2+ was slightly enhanced iwth
increased s/s ratio, whereas the release of Ca2+ was slightly enhanced
with increased s/s ratio. Hydrogen ions exchangeable in 1.0 M KCl (He,
centimoles of charge per kilogram) increased by 17 to 22% in O and E
horizons and by 32 to 33% in Bs horizons when the s/s ratio increased
DocumentsPDFComplete
Click Here & UpgradeExpanded Features
Unlimited Pages

61
from 100 to 150. Consequently, estimated He and CECe pertaining to
different samples can only be accurately compared if they are obtained
at the same s/s ratio or corrected for differences in the s/s ratio by
specific functions for different soil horizons.
2.76 Ben-dor and Banin (1995) studied “Near Infrared analysis as a
rapid method to simultaneously evaluate several soil properties.”
The near infrared analysis (NIRA) approach was studied to examine its
capability for predicting spectral feature soil properties form the
reflectance curves in the near infrared (NIR) regin (1-2.5 µm) of arid
and semiarid soils. High-resolution diffuse reflectance spectra (3113
spectral points) in the NIR regin were recorded for 91 soil samples from
Israel. Six soil properties (clay contnet, specific surface area, cation-
exchange capacity, hygroscopic moisture, carbonate content, and
organic matter content) were measured by routine methods employed in
soil laboratories. An empirical model to predict each property from its
spectral signature was developed by adapting the NIRA technique.
Several data manipulations were used to obtain optimum performance.
The optimum performance of all properties was found to be between 25
and 63 spectral points. Strong support for the NIRA capability was
provided by its ability to examine most of the spectral assignments. A
slight bias was observed for the prediction of both organic matter and
hygroscopic moisture, suggesting that more attention in the prediction
of these constituents is required. It was concluded that NIRA is a
promising method for rapid and nonrestrictive analysis of soil materials,
and further study of the synergism between NIRA and soil materials is
recommended.
DocumentsPDFComplete
Click Here & UpgradeExpanded Features
Unlimited Pages

62
2.77 Jener L. Moraes et al. (1995) investigated the “Soil Carbon Stocks of
the Brazilian Amazon Basin.” They determined Stocks of C and N for
soil under undistrubed vegetation across the Brazilian Amazon Basin
based on 1162 soil profiles of the RADAMBRASIL survey and a
digitized Brazilian soil survey map. Mean basin soil C dnesity was 10.3
kg C m-2. Forty-seven petagrams C and 4.4 Pg N were contaied in the
top 1 m of soil. Forty-five percent of total basin soil C (21 Pg C) and
41% of total soil N (1.8 Pg N) were contained in the top 20 cm across a
≈ 5000000 km2 area. Mean C/N ratio for the basin to a depth of 1 m was
10.7. Because these data represent sites with forest vegetation in the
absence of significant disturbances, they represent a valuable baseline
for evaluating the effects of land-use change on soil C stocks iin the
Amazon Basin.
2.78 Curtin and Smillie (1995) studied the ‘Effects of incubation and pH
on soil solution and exchangeable cation ratios.” The objectives of
this study were to evaluate the effects of liming on the exchage
relationships of the major cations (Ca, Mg, K, and Na) and to determine
the causes of incubation-induced changes in their solution
concentrations. For periods of up to 1 yr, soil solution was extracted
from soils treated in the laboratory with CaCO3 and incubated at
approximately field capacity. Solution samples were also obtained from
field-limed soils (lime applied 17 yr previously) after 1 and 10 wk of
incubation in field-moist condition. The concentrations of cations in
solution increased substantially during incubation. These increases were
balanced by NO −
3 , indicating that the changes in cation solubility were
microbially mediated. In contrast to cation concentrations, cation ratios
(i.e., Mg/Ca, Na adsorption ratio, K adsorption ratio) were little affected
DocumentsPDFComplete
Click Here & UpgradeExpanded Features
Unlimited Pages

63
by incubation. These ratios were directly related to the composition of
the exchange phase and were strongly influenced by liming. Protons
generated by mineralization of organic N during incubation displaced
exchangeable Ca, Mg, K, and Na in ratios that maintained the
equilibrium between solution and exchangeable phases. The results
suggest that a reasonable approximation of soil solution cation can be
obtained from exchangeable cation data.
2.79 Jeffrey S. Kern (1995) reported the “Evaluation of soil water
Retention model based on basic soil physical properties.” The
objective of this study was to evaluate some soil water retantion models
to identify minimum input data requirements. Six models that function
with various combinations of particle-size distribution bulk density (Pb)
and organic matter data were tested using data for nearly 6000 pedons.
The Rawls model, which requires particle-size distribution and organic
matter data, had the lowest overall absolute value of the mean erro (ME)
with 0.020, 0.001, and 0.007 m3 H2O m-3 soil for matric soil water
pressures of -10, -33, and -1500 kPa, respectively. The Saxton model,
which requires particle-size distibution data, had small MEs (0.018 and
0.007 m3 H2O m-3 soil) for -10 and -1500 kPa matric soil water
pressures, and a moderately small ME (0.017 m3 H2O m-3 soil) at – 33 k
Pa. The Vereecken model, which requires ρb particle-size distribution,
and organic matter data, had small MEs (0.016 and 0.009 m3 H2O m-3
soil) at matric soil water pressure of -10 and -33 kPa, with a larger ME
(0.020 m3 H2O m-3 soil) at -1500 kPa. The remaining three models had
relatively large MEs for at least two of the three soil water pressures.
For estimating water-holding capacity only, the Saxton model is
DocumentsPDFComplete
Click Here & UpgradeExpanded Features
Unlimited Pages

64
adequate. The Rawls model is recommended for characterizing the
relationships of water content to matric soil water pressure.
2.80 Homann and co-workers (1995) investigated “Soil Organic Carbon in a
Mountainous, Forested Region: Relation to Site Characteristics.” Soil
Organic C Content (SOC, kilograms C per square meter) and its relation
to site characteristics are important in evaluating current regional,
continental, and global soil C stores and projecting future changes. Data
were compiled for 499 pedons in the largely forested, mountainous
western Oregon region. The SOC of mineral soil ranged from 0.9 to 24
kg C m-2 (mean = 6.5) for 0- to 20-cm depth and 2.3 to 88 kg cm-2
(mean = 15.8) for 0- to 100-cm depth. Variability in each of the three
terms that determine SOC – C concentration, bulk density, and rock
volume – contributed substantially to SOC variation. Regression
analysis of 134 forest pedons indicated that combinations of site
characteristics explained up to 50% of the SOC variability. The SOC
increased with annual termerature, annual precipitation, actual
evapotranspiration, clay, and available water-holding capacity and
decreased with slope. Relations for western Oregon differed
qualitatively and quantitatively from those for other regions and
contrasted with the decrease in SOC associated with increased
temperature in Great Plains grasslands. Of the variability not explained
by regression analysis, one-half may be due to the combined uncertainty
associated with measurements of C concentrations, bulk density, and
rock volume; natural within-site variability; and site-characteristic
measurements. Other unexplained variability is probably due to
potentially important but poorly documented site characterisitics, such
as recent vegetation composition, geomorphic disturbance regime, and
fire history.
DocumentsPDFComplete
Click Here & UpgradeExpanded Features
Unlimited Pages

65
2.81 Mahendran and Mathan (1995) investigated “Relative Importance
of Component Soil Properties on Saturated Hydraulic Conductivity
in Soil.” Saturated Hydraulic Conductivity (Ks) was measured on
undisturbed soil cores collected from 72 horizons of 21 profiles
comprising six soil Sbugroups, viz., Typic Chromusterts, Typic
Ustropept, Udic Haplustalf, Typic Haplustalf, Vertic Haplustalf and
Typic Ustorthents. Relationships were established with effective
porosity (φe), percentage of aggregate stability (AS), disperiosn
coefficient of silt and clay φe, (DCSC) exchangeable sodium percentage
(EsP), clay and organic carbon (OC). Path coefficient analysis
confirmed that the direct influence on the Ks was strongest through φ,
DCSC, AS and ESP. Though clay and OC influenced Ks, their role was
minimal as a direct factor. The major influence of clay and organic
carbon was indirect through AS and φe
2.82 Igwe and co-worker (1995) studied “Physical Properties of Soils of
SouthEastern Nigeria and the Role of Some Aggregating Agents in
Their Stability.” The Topsoils were generally sandy loam to sandy clay
loam, with the clay content increasing with depth. Topsoil bulk
densities were high, varying between 1.34 and 1.55 Mg m-3. Subsoil
bulk densities were also high, with values reaching as high as 1.56 to
1.92 Mg m-3 in some horizons. The correlation between bulk density
and organic matter (OM) was low, but the trend showed an increase in
bulk density with derease in OM content. The values of liquid and
plastic limits were low to modereate. The low correlations between
plastic limit (PL) and the aggregate stability indices indicate that PL is
not a good predictor of the structural stability of these soils. The
influence of OM on the aggregate stability indices was more
DocumentsPDFComplete
Click Here & UpgradeExpanded Features
Unlimited Pages

66
pronounced within than between the soil profiles, implying that the role
of OM as an aggregating agent is soil-dependent. The lowest clay
content was obtained with water as the dispersant. Removal of OM and
carbonates from the soil samples did not produce clay different in
amount from that produced when sodium hexametaphosphate alone was
used. This shows that OM and carbonates play minor roles as clay
aggregating agents in these soils, probably becuase of their low
concentrations. Removal of Fe2O3 and Al2O3 with sodium dithionite-
citrate-bicarbonate (DCB) solution produced the highest concentrations
of clay in all soils. This shows that Fe and Al oxides play the most
important clay-aggregating roles in these soils. Therefore, for more
reliable and reproducible soil particle size analysis, pretreatment for
removal of these sesquioxides is needed.
The correlations between the soil erodibility factor (K) and the
aggregate stability indices were generally low (r < 0.35), implying that
these aggregate stability indices are not reliable for assessing the
erodibility of these soils.
2.83 Rasiah and Biederbeck (1995) studied “Fractal Dimension of Soil
Aggregates: Influence of Bulk Density, Fitting Procedure, and Oily
Waste Sludge in Corporation.” Researchers have used scale-invariant
bulk density, ρ, to estimate values of fractal dimension, D, for soil
aggregate fragmentation. Justification for this assumption has not been
fully explored. The objectives of this study were to compare values of D
obtained using (i) scale-invariant and scale-variant ρ and (ii) linear
(defined D1) and nonlinear (defined Dnl) fitting procedures, and also (iii)
to evaluate the influence of oily waste sludge incorporation on D.
Aggregate ρ and mass-size distribution for a Meota loamy snad treated
with different rates of an oily waste sludge were determined in the
DocumentsPDFComplete
Click Here & UpgradeExpanded Features
Unlimited Pages

67
laboratory. Bulk density of soil aggregates, average size ranging from
0.21 to 9.55 mm, ranged from 1.15 to 1.37 Mg m-3 (R2= 0.91). Fifty-
four values of D were obtained using the sclae-varient or scale-invariant
ρ for D1 or Dnl. Values of D1 ranged from 2.23 to 3.83, and those of Dnl
for 2.07 to 3.15. The values of D obtained using the scale-variant ρ
were always smaller than those obtained using the scale-invariant ρ. A
switch from linear to nonlinear fitting resulted in significantly smaller
values of D (D1 ≥ Dnl). Oily waste sludge incorporation resulted in
marked reductions in D1 (R2 = 0.88) or Dnl (R2 = 0.88). The results show
the values of D obtained using nonlinear fitting and scale-variant ρ are
accurate and smaller than those obtained using nonlinear or linear fitting
or scale-invariant ρ or a combination of the latter three.
2.84 Santini and co-workers (1995) studied “Evalution of a Laboratory
Inverse Method For Determining Unsaturated Hydraulic Properties of a
Soil Under Different Tillage Practices.” The laboratory inverse method
simultaneously determined relationships of water retention, θ(h), and
hydraulic conductivity, k(θ), from an evaporation experiment using a
parameter estimation technique. This method was developed with the
aim of reducing experimental efforts without significantly lowering
accuracy in parameter estimates. A Crank-Nicolson type finite-
difference solution of Richards’ equation was coupled with a nonlinear
optimization problem to estimate unknown parameters in the closed-
form analytical relations employed in this study for describing soil
hydraulic properties.
Comparisons with laboratory-measured saturated hydraulic
conductivity and soil water retention data obtained for a group of soil
cores by a sand-kaolin box apparatus demonstrate the applicability and
DocumentsPDFComplete
Click Here & UpgradeExpanded Features
Unlimited Pages

68
accuracy of the proposed inverse method. Overall, the results of
hydraulic-property characterization for the soil at the experimental farm
reveal no significant differences among tillage treatments. In addition,
as a general rule, a progressive annulment of tillage effects on structure
and hydraulic properties of soil is observed with time.
2.85 Room Singh (1995) investigated “Role of Soil Texture and Plant Age
in Leaf-Water Potential Measured at Different Crop Stages of
Wheat in Mollisols of Tarai.” Measurement of the leaf water potential
(LWP) of wheat grown on six soil series of Pantnagar tarai was done at
different crop stages, soil water condition and day time, in order to
examine its variation and its relationship with these factors. Soils
comprinsing three textural groups recorded different crop yields as well
as LWP. There was a considerable seasonal variation in the LWP
(- 0.25 to -2.13 MPa), decreasing with plant age. The morning LWP
before irrigation was well correlated with that measured after respective
irrigation. Morning and mid-day time LWP were positively correlated
with each other before irrigation. Grain yields highly significant
relationship with the morning time LWP, particularly, at later crop
stages.
2.86 Saha, Das and Mukherjee (1995) reported the “Effect of Decomposition
of Organic Matter on the Activities of Microorganism and Availability
of Nitrogen, Phosphorus and Sulphur in Soil.” Study Organic Matter
namely, berseem straw, bagasse and rice straw, Cassia sophera, Cestrum
diurnum and Ipomoea cornea, augmented significantly aerobic non-
symbiotic nitrogen fixing bacteria, phosphate solubilizing and sulphur
oxidizing microorganisms as well as their activities, viz. nitrogen fixing,
DocumentsPDFComplete
Click Here & UpgradeExpanded Features
Unlimited Pages

69
phosphate solubilizing and thiosulphate oxidizing capacities of the soil
Typic Fluvaquent resulting in greater availability of N, P and S in soil
solution. Among the organic matters, berseem straw was superior to
others in this respect, excepting Ipomoea cornea, which released
maximum amount of available S in soil. Rice straw, on the other hand,
exhibited on immobilization of ammoniacal nitrogen in soil.
2.87 Kumar, Rao and Singh (1995) studied “Forms of Acidity in Some
Acid Inceptisols under Different Land Use in Manipur.” The electro
statically bonded (EB)-H+ and EB-Al3+ aciditics constitued 39.3 and
60.7 per cent of exchangeable acidity while pH dependent and exhange
acidities comprised 92.2 and 7.8 per cent of total acidity, respectively.
Various forms of acidities are significantly related to pH, organic
carbon, exchangeable and extractable Al3+ and exchangeable Ca2+ and
Mg2+. Land use pattern also affect the various forms of acidities
considerably. Shifting cultivation increased all forms of acidities
whereas the terrace cultivation brought them to the lowest magnitude.
2.88 Bala et al. (1995) studied “Effect of Ionic Strength on Phosphate
Adsorption by Soils.” Effect of ionic strength and cation species of the
supporting electolyte on adsorption of phosphate by selected benchmark
soils of Pubjab was studied at 250C. Phosphate adsorption increased
with increase in ionic strenth. At a particular molarity, phosphate
adsorption was higher in the presence of CaCl2 as compared with NaCl.
The adsorption data conformed to Langmuir and Freundlich adsorption
equations. Adsorption maxima and Freundlich constant K increased
with increase in ionic strength.
DocumentsPDFComplete
Click Here & UpgradeExpanded Features
Unlimited Pages

70
2.89 AVASTHE and AVASTHE (1995) reported a “Altitudinal distribution
of Micronutrients in the soil of Sikkim.” Cultivated soils of five
different altitude zones of Sikkim, viz. sub-alpine (> 2700 m), terperate
(2000 – 2700 m), mid-hill temperate (1500 – 2000 m), subtropical (500
– 1500 m) and tropical (300 – 500 m) zone were selected for the study.
The total Zn, Cu, Mn, Fe, B and Mo content of the surface soils varied
widely. About 94 and 85 per cent of the soils could be rated as deficient
in available boron and molybdenum, respectively. Total micronutrients
and DTPA extractable Cu and Mn and hot-water extractable B had a
significant negative correlation with altitude whereas DTP – Zn and Fe
were positively correlated.
2.90 PARDEEP KUMAR, SHARMA AND SHARMA (1995) reported the
“Distrubution of N, P and K in Soan River Valley Soils of Lower
Shiwaliks.” The relationship of soil properties with forms of N, P and
K indicated positive influence of pH and total N and organic carbon and
silt on available N. The total P bore significantly positive relationship
with pH, organic carbon, cation exchange capacity, silt and clay. The
organic carbon and clay contents had positive influence on water
soluble P as well. Total K was positively correlated with organic
carbon. CEC and silt water soluble K with sand and silt.
2.91 HOSUR and DASOG (1995) studied the “Effect of Tree Speices on
Soil Properties.” This papers the reports the influence of tree
plantations (Tectona grandis, Dalbergia sissoo and Acacia catechu) on
properties of red loam soil (Inceptisol) of Dharwad. Plantation of trees
decreased bulk density and pH whereas soil aggregation, organic matter
and exchangeable calcium of the soils increased. The nutrient status of
the soils was very little changed by tree plantations. The nutrient return
DocumentsPDFComplete
Click Here & UpgradeExpanded Features
Unlimited Pages

71
through litter fall followed the order Ca > K > N in D. sissoo and A.
catechu and Ca -> N > K in teak.
2.92 Tiwari, Tiwari and Mishra (1995) reported “Soil Test Methods and
Critical Limits of Potassium in Soil and Plants for Wheat Grown in
Typic Ustochrepts.” Multilocation field experiments were also
conducted on cultivators’ fields to verify the differences in responses to
added K in relation to soil test values and the critical limites of K in soil
established through field and greenhouse experiments. The extraction
capacities of the fourteen extractants were different, being highest for
boiling HNO3 and lowest for 0.01M CaCl2. The quantities of K
desorbed by boiling 1M HNO3 showed highest degree of correlation
with 0.5N acetic acid and lowest with 0.13M HCl. In view of the fact
that responses to added K in soils of varying 1M NH4 OAc (pH 7.0)
status were modified by the 1M HNO3 soluble K content of soils, the
critical limits of K were established taking into consideration both
exchangeable and non-exchangeable K status of the soils. Under
greenhouse condition respnses to K were significant only up to soils
testing medium-high in both exchangeable and non-exchangeable K.
Responses to K under field conditions were significant on soils testing
medium in respect of both exchangeable and non-exchangeable K.
Apparently, the critical limit recorded under field conditions is slightly
lower than of greenhouse conditions. Critical concentration of K in 6-
week-old plants of wheat was 2.7 per cent.
2.93 Singh et al. (1995) described the “Genesis and Taxonomy of Black
Soils from Basalt and Basaltic Alluvium in Rajasthan.” Six typical
pedons representing black soils, two (P1 & P2) developed form basalts
and the other four (P3 to P6) developed from basaltic alluvium in
DocumentsPDFComplete
Click Here & UpgradeExpanded Features
Unlimited Pages

72
Rajasthan were selected for this purpose. Soil colour, was found to be
the function of free iron oxide to clay ratio while vertic properties were
found to be governed by free iron to total iron ratio. The irregualr
distribution of organic carbon and regular depthwise function CaCO3
indicate idfferential pedoturbation with respect to these constituents.
Fe2O3 and MgO content of the soils from basalts were more than the
soils from basaltic alluvium while SiO2, Al2O3 and K2O content showed
a reverse trend. The weathering indices, like lower Al2O3/Fe2O3, CEC,
SiO2/R2O3 and K2O/Na2O molar ratios in clays and CEC of clay/clay
ratios, reflected advanced stage of weathering in basalitc soils compared
with compared with their basaltic alluvial counterpart. CEC/clay ratio
was found to decrease with the increase in Fe2O3 content of clays.
Taxonomically these soils were classified under Chromic Haplusterts
and Typic Haplusterts subgroups of Vertisol soil order.
2.94 Francois Courchesene and co-workers (1995) studied the “Effect of
Air-Drying on the Measurement of Soil pH in Acidic Forest Soil of
Quebec, Canada.” Nine podzoli soil profiles (n = 67 horizons) were
sampled in southern Quebec to evaluate the effects of drying on soil pH
measurements in H2O (pHW) and in 0.01M CaCl2 (pHCA) and to identify
the existence of relationships between pH changes on drying and soil
properties. The precision of pH measurements (global precision of
± 0.035 pH unit) varied, with the poorest precision value (0.10) being
recorded for pHW in field-moist samples of organic horizons (O). For
any soil horizon group (O, E, B, C), the pH change attributable to
drying was always larger in H2O (up to 0.50 pH unit or 130 µmol H+L-1)
than in CaCl2 (up to 0.25 pH unit or 520 µmol H+L-). When expressed
in terms of H+ concentration, the trend is inverted because pHCA values
DocumentsPDFComplete
Click Here & UpgradeExpanded Features
Unlimited Pages

73
are often one pH unit more acidic than pHw vlues for the same horizon.
Drying generally resulted in soil acidification for all horizon types
although both acidification and alkalinization could occur in a given
profile. We found positive and significant relatiosnhips between pH
changes attributable to drying expressed as ∆ H+and organic C and
exchangeable Al for both electrolytes. The relationships were stronger
when soil materials were grouped on a profile basis (average r value =
0.78 and 0.62 for organic C and exchangeable Al, respectively) than
when grouped by horizon type (average r value = 0.39 and 0.49 for
organic C and exchangeable Al, respectively). The DOC concentrations
in both electrolytes and for any given horizon were always higher in dry
than in moist soil samples. Absolute changes in DOC concentrations
were correlated to the absolute magnitude of pH changes upon drying
(0.67 < r < 0.96; α≤ 0.05). However, the relationships between the
magnitude of DOC changes, and the polarity of pH changes upon
drying (∆ H+) varied with the elecrolyte used. In H2O, the decrease in
soil pH is mostly associated with the acidifying effect of an increase in
organic matter solubility after drying. In CaCl2, it is suggested that the
potential reduction of Al availability after soil drying and the
flocculation of organic substances by Ca2+ ions could contribute to the
increase in pH. Characterizing the suite of organic substances present in
individual horizons could also prove very helpful in elucidating the
response of soil pH to drying.
2.95 Michael A. and co-workers (1995) studied the “Factors Affecting the
Surface Tension of Soil Solution and Solutions of Humic Acids.” Humic
and fulvic Acids and other naturally derived and fatty acids are important
constituents of soil solutions and surface waters and groundwater. The
presence of both hydrophilic polar or ionic functional groups and
DocumentsPDFComplete
Click Here & UpgradeExpanded Features
Unlimited Pages

74
hydrophobic structural units on these natural organic compounds can be
expected to promote accumulation at the air-water interface, which would
thereby influence the solution surface tension. This study evaluated the
influence of organic C concentration, pH, and temperature on the surface
tension of soil solutions extracted from forest soil solutions of International
Humic Substances Society (IHSS) reference humic acids. The surface
tensions of the soil solutions were substantially lower than those of IHSS
humic acids at equivalent organic C concentrations and solution conditions.
Differences were also observed in the temperature dependence of surface
tension for the solutions. All solutions exhibited a strong dependence of
surface tension on solution pH. Characerization of the soil solutions and
humic acid solutions by fluorescence and absorption spectroscopy and
titration analysis confirmed that the soil solutions varied markedly form
humic acid solutions.. The soil solutins bore substantially higher acidity and
yielded quanlitatively different fluorescence spectra when compared with the
humic acid solutions equivalent conditions.
2.96 Rao and co-worker (1996) studied the “Predication of Cation
Exchange Capacity from Clay and Organic Carbon of Some
Smectite and Kaolinite-Rich Soils.” Predicting cation exchange
capacity (CEC) from the contents of clay and organic carbon, soils were
grouped into classes on the basis of their clay and organic carbon
contents. In each class, multiple regression equations were worked out
between organic carbon and clay and CEC. Using average CEC,
percentage of organic carbon and clay and partial regression coefficients
of the latter parameters, the relative contribution of clay and organic to
CEC was estimated. The CEC can be predicted with reasonable
accuracy from the content of organic carbon and clay of the two groups
DocumentsPDFComplete
Click Here & UpgradeExpanded Features
Unlimited Pages

75
of soils. Contribution of clay was more to CEC in the smectitics soils,
whereas organic carbon contributed more in the kaolinitic soils.
Irrespective of soils, the contribution of clay or organic carbon to CEC
increased with their contents.
2.97 Singh and Kumar (1996) reported the “Nitrogen mineralization of
legume Residues in soils in relation to their chemical Composition.”
The N mineralization of seven legumes (45-day old) in Hisar sandy
loam (Typic Camborthid) and Karnal loam (typic Ustochrept) soils were
studied under constant temperature (350C) and water (-0.03 MPa)
conditions. Patterns of N mineralization in both the soils from different
legumes were almost similar and followed the first order kinetics. The
nitrogen mineralization potential (N0) of legumes differed significantly
and ranged from 59.8 mg kg-1 for clusterbean to 96.9 mg kg-1 for green
gram. The rate of N mineralization (k) was highest for green gram
(0.199 week-1) and lowest for clusterbean (0.149 week-1). The K values
were significantly affected by lignin to N ratio, lignin plus polyphenol
to N ratio and C:N ratio of legumes. The net amounts of N mineralized
at the end of 56 days of incubation was lowest from clusterbean
amounting to 53 and 55 mg kg-1 and highest from green gram
amounting to 96 and 99 mg kg-1 in Hisar and Karnal soils, respectively.
The order of N mineralization (%) from different legumes was same in
both the soils and followed the sequence: green gram > black gram >
soybean > cowpea > sesbrania > sunnhemp > clusterbean. The
percentage of N mineralized was positively correlated with total N
content and negatively with C:N ratio, lignin to N ratio, polyphenol to N
ratio. However, the best chemical index of N mineralization was found
DocumentsPDFComplete
Click Here & UpgradeExpanded Features
Unlimited Pages

76
to be lignin + polyphenol to N ratio which accounted for 84 per cent of
the variation in the percentage of legume N mineralized.
2.98 Walia and Rao (1996) reported the “Genesis, Characteristics and
Taxonomic Classification of Some Red Soils Bundelkhand Region
of Uttar Pradesh.” The soils are deep very deep, excessively to well
drained, reddish brown to red, mildly acidic, low to medium in CEC,
medium to high in organic carbon with wide textural variations
depending upon parent material and physiography. The soils show high
molar ratios and variations of SiO2/R2O3 are due to parent material. The
depthwise distribution of SiO2 indicates the stablilzation of silica
content under midly acidic pedochemical environment. Flat-topped hill
and monadnock exhibit the development of Bt horizon while soils of
other landforms show Bw horizon. The soils are classified under the
orders of Inceptisiols and Alfisols.
2.99 Patil et al. (1996) studied “Effects of the Fly Ash on Soil Crust
Strength and Crop Yield.” Field Experiments were conducted on
Typic Haplustalf soils to study the utility of fly ash as soil amendment
in reducing the soil crust strength the soil crust strength. Application of
Fly ash @ 20 q ha-1 reduced the crust strength from 2.38 kg cm-2 to 0.98
kg cm-2. This has resulted in higher yields of sunflower (7.6 q ha-1) and
groundnut (31.9 q ha-1) when compared to control. Application of other
amendments, namely, FYM, sand and paddy husk either alone or in
combination with fly ash reduced the unconfined crust strength of soil
significantly. The effect was in the order of paddy husk > fly ash >
FYM > sand = control in two years.
DocumentsPDFComplete
Click Here & UpgradeExpanded Features
Unlimited Pages

77
2.100 Ellerbrek et al. (2005) reported a “Composition of Organic Matter
Fraction for Explaining Wettability of Three Forest Soils”. Soil
organic matter (SOM) as a solid or as a film at mineral surfaces affects
wetting properties in unsaturated soil. Soil organic matter mostly
consists of heterogeneous mixture of components with hydrophilic and
hydrophobic functional groups. This paper analyzes relations of SOM to
soil wettability by considering functional group compositions of
different soluble fractions. Forest soil samples from two loamy and
Cambisol profiles (locations Chorin and Steigerwald) and from a Podzol
(Waldstein) were used to obtain water [SOM(W)] and sodium
pyrophosphate [SOM(PY)] soluble SOM fractions. The hydrophobic
(A) and hyrophilic (B) functional groups of bulk soil SOM and of the
soluble fractions were evaluated using transmission Fourier-transform
infrared (FT-IR) spectroscopy. Advancing liquid-solid contact angles
(CA) were determined by using the capillary rise method. For soil
organic carbon (SOC) contents < 10 g kg-1, wettability increased with
SOC content while it decreased for SOC contents > 10 g kg-1. Although
hydrophilic groups in FT-IR spectra of SOM(W), SOM(PY), and bulk
soil dominated (i.e., A/B ratios between 0.08 and 0.5), soil wettability
was reduced (i.e. CA between 88 and 520). Soil specific relations
between CA and A/B ratios could be obtained after introducing
relatively soil type independent factors, G. As exponential functions of
the SOC/clay relation, the G-factors imitate the effectiveness of
functional groups with respect to wettability. The results suggest that in
addition to SOC content, the SOM composition may improve
explanation of soil wettability if the spatial orientation of SOM
functional groups at the SOM-mineral surface in the presence of
sorption sites and polyvalent cations is considered.
DocumentsPDFComplete
Click Here & UpgradeExpanded Features
Unlimited Pages

78
2.101 Scheidegger and Sparks (1996) studied “A Critical Assessment of
Sorption-Desorption Mechanisms at the Soil Mineral/Water
Interface.” Sorption is one of the most important chemical processes in
soil. It affects the fate and mobility of nutrients and contaminants in
soils and waters greatly. This paper critically reviews the mechanisms
of sorption/desorption phenomena at the mineral/water interface. A
brief discussion of macroscopic, equilibrium approaches for describing
sorption processes is provided. However, emphasis will be placed on
the importance of understanding the rates of sorption/desorption
processes and coupling of kinetic investigations with in-situ
atomic/molecular resolution surface techniques. The use of X-ray
absorption fine structure (XAFS) spectroscopy and scanning force
microscopy (SFM) will be emphasized.
2.102 Lawerence et al. (1996) studied a “Chemical Evaluation of Soil–
Solution in Acid Forest Soils.” A new technique was developed to
compare soil-solution chemistry among red spruce stands in New York,
Vermont, New Hampshire, and Maine. Soil solutions were expelled by
positive air pressure from soil that had been placed in a sealed cyliner.
Before the air pressure was applied, a solution chemically similar to
throughfall was added to the soil to bring it to approximate field
capacity. After the solution sample was expelled, the soil was removed
from the cyliner and chemically analyzed. The method was tested with
homogenized Oa and Bs horizon soils collected from a red spruce stand
in the Adirondack Mountains of New York, a red spruce stand in east-
central Vermont, and a mixed hardwood stand in the Catskill Mountains
of New York. Reproducibility, effects of varying the reaction time
between adding throughfall and expelling soil solution (5-65 minutes)
DocumentsPDFComplete
Click Here & UpgradeExpanded Features
Unlimited Pages

79
and effects of varying the chemical composition of added throughfall,
were evaluated. In general, results showed that (i) the method was
reproducible (coefficients of variation were generally < 15%), (ii)
variations in the length of reaction time did not affect expelled solution
concentrations, and (iii) adding and expelling solution did not cause
detectable changes in soil exchange chemistry. Concentrations of
expelled solutions varied with the concentrations of added throughfall;
the lower the CEC, the more sensitive expelled solution concentrations
were to the chemical concentrations of added throughfall. Addition of a
tracer (NaBr) showed that the expelled solution was a mixture of added
solution and solution that pre-existed in the soil. Comparisons of
expelled solution concentrations with concentrations of soil solutions
collected by zero-tension and tension lysimetry indicated that expelled
solution concentrations were higher than those obtained with either type
of lysimeter, although there was less difference with tension lysimeters
than zero-tension lysimeters. The method used for collection of soil
solution should be taken into consideration whenever soil solution data
are being interpretd.
2.103 Nelson et al. (1996) studied “The Effects of Soil Physical Properties
and Irrigation Method on Denitrification.” Acetylene-inhibition
techniques were used to monitor the effects of soil physical properties,
such as bulk density and crusting, on field denitrification losses under
flood and sprinkle irrigation. In one flood irrigation treatment,
polyacrylamide (PAM) was incorporated at the rate of 650 kg ha-1 into a
clay loam soil to enchance soil aggreage stability. In additional flood
and sprinkle irrigation treatments, PAM was not applied. All treatments
were irrigated on a weekly basis with 5 cm of water. Bulk density, soil
moisture, and soil crusting were 1.2, 1.5, and 19.2 times higher,
DocumentsPDFComplete
Click Here & UpgradeExpanded Features
Unlimited Pages

80
respectively, under flood irrigation than under sprinkle irrigation, and
infiltration rates were 4.7 times lower under flood irrigation. Soil
physical properties of lood-irrigated soils treated with PAM were
similar to sprinkle-irrigated soils. Penetrometers measurements of the
surface of PAM-treated and sprinkle treated soils were not significantly
different and bulk density differences were less than 6%. The poor
physical properties and wetter conditions of the flood-irrigated plots
produced a fourfold increase in total cumulative nitrate losses by
denitrification compared with sprinkle-irrigated plots. In field
experiments, the highest denitrification rates were from flood-irrigated
soils, without PAM, initiated within 24 h after irrigation. Rates
decreased rapidly beyond that time, whereas PAM-treated soils evolved
high amounts of N2O throughout both field and laboratory experiments.
The continuously elevated denitrification activity in PAM-treated soils
is believed to be caused more by increased anaerobic microsite activity
within PAM-stabilized aggregates than by irrigation method.
2.104 Auxtero et al. (1996) reported the “Properties and Related
Management Implications of Major Soils in Bukidnon,
Philippines.” The mineralogy of the various soil horizons has been
determined using X-ray diffraction (XRD), scanning electron
microscopy SEM, and transmission electron microscopy (TEM).
The soils in the steepland and upland areas are classified as
Typic Hapladalfs and Lithic Dystropepts. The floodplain is occupied by
Typic Tropaquepts. The pH of the Ap horizons is moderately acid in
Typic Hapludalfs and Typic Dystropepts and strongly acid in Typic
Tropaquepts. The apparent cation exchange capacity is very high in
DocumentsPDFComplete
Click Here & UpgradeExpanded Features
Unlimited Pages

81
these soils, characterized by low contents of organic carbon and total
nitrogen, a very low available phosphorus and low base status.
XRD analysis showed that gibbsite, quartz, halloysite and
hydroxy interlayered 2:1 minerals are present in the clay fraction of all
soils. TEM showed goethite as acicular crystals extending into pores
like needles and lepidocrocite as highly elongated flakes found
abundant in the sub-soils of Typic Tropaquepts.
Typic Hapludalfs are deep, well-drained soils suitable for upland
cultivation. Use of light implements would help minimize soil
compaction during land preparation, and contour plowing would
alleviate soil erosion hazards on these soils. The coarse-textured Lithic
Dystropepts, which have a coherent underlying hard rock material at 50
cm of the mineral surface, would require proper drainge. A clayey
texture and a massive structure with redoximorphic conditions pose
aeration problems in the Typic Tropaquepts. These soils could best be
utilized for lowland rice cultivation.
2.105 Nayak and co-workers (1996) studied the “Nature of Soil Acidity in
Some Soils of Manipur.” All types of soil acidity are relatively high in
the hill soils than in the alluvial soils due to variations in
physicochemical properties of the soils. High amount of ammonium
acetate (pH 4.8) extractable Al indicates the presence of appreciable
quantity of soluble Al(OH)3 and hydroxyl Al polymers in soils. The
major controlling soil factor on exchange acidity is exchangeable Al3+
and pH-dependent acidity is influenced by organic matter, non-
exchangeable Al and free iron oxides. The exchangeable Al3+ and per
cent aluminium saturation increases with decreasing soil pH and it tends
DocumentsPDFComplete
Click Here & UpgradeExpanded Features
Unlimited Pages

82
to be zero at pH 5.6. The management of such acid soils includes liming
to neutralize exchangeable Al3+ to the tolerance level of crops.
2.106 Elahi et al. (1996) investigated the “Characteristics of Some Soils
Developed on Madhupur Clay in Bangladesh.” Four soil profiles
representing two typical soil series of Madhupur clay in Bangladesh
were studied for some of their morphological, physical and chemical
properties. Formation of these soils apprared to the controlled by the
composition and age of the parent materials, influenced by climate and
relief. All the soils have developed on reddish brown clay of uniform
nature called Madhupur clay. Movement of clay from the summit to the
bottom of the valley indicates that there has been considerable
disperions of clay on wetting by rain water and movement of clay down
the slope along with runoff water. Soil reaction is acidic, the organic
matter and nitrogen content are low, and also base saturation is low.
Highly soluble sodium and potassium have leached out of the catena.
Calcium and magnesium are the dominant cations in the profiles, which
increase with increasing depth. The soils have been classified as
Inceptisols.
2.107 Sharma et al. (1996) investigated a “Characterization and
classification of soils in a Topsequence over basaltic Terrain.” The
soils at elevated topography were shallow to moderately shallow, clayey
to loamy skeletal and yellowish brown, while at lower topography were
deep to very deep, fine to fine loamy and grayish. The influence of
topography was marked on properties like pH, CaCO3, clay content,
vertic properties, CEC and exchangeable cations up to pedon 4,
thereafter; they were subdued by local ephemerals. The soils were
DocumentsPDFComplete
Click Here & UpgradeExpanded Features
Unlimited Pages

83
classified taxonomically in Lithic/Typic Ustorthents, Typic Haplusterts
and Typic Ustifluvents sub-groups and land use plans for the soils
associated with each landform are proposed for their better
management.
2.108 Kumar and co-workers (1996) reported “Estimating Penetration
Resistance from Soil Physical Properties.” Stepwise regression
analysis showed that among one-variable models, only soil depth
explained significantly the variation in cone index. The two-variable
model, soil water content and depth explained 59 per cent variability.
Inclusion of sand and bulk density in the model increased the coefficient
of determination of 61 per cent. With square terms of depth, sand and
bulk density, the model explained 80 per cent of variability in cone
index and most of the points scattered around 1:1 line. Partial
correlation coefficient of depth and soil water content with come index
had almost same magnitude followed by that of sand and bulk density.
2.109 Piccolo and co-workers (1996) investigated the “15N natural
abundance in forest and pasture soils of the Brazilian Amazon
Basin.” Six sites in the state of Rondônia, two sites in Pará and one in
Amazonas were studied. All sites except one were chronosequences and
contained native forest and one or more pastures ranging from 2 to 27
years old. Forest soil δ15N values with depth of 1 m ranged 8‰ to 23‰
and were higher than values typically found in temperate forests. A
general pttern of increasing δ15N vlues with depth near the soil surface
was broadly similar to patterns in other forests but a decrease in δ15N
values in many forest profiles between 20 and 40 cm suggests that
illuviation of 15N-depleted nitrate may influence total soil δ15N values in
DocumentsPDFComplete
Click Here & UpgradeExpanded Features
Unlimited Pages

84
deeper soil where total N concentrations are low. In four
chronosequences in Rondônia, the δ15N values of surface soil from
pasture were lower than in the original forest and δ15N values were
increasingly depleted in older pastures. Inputs of atmospheric N by
dinitrogen fixation could be an important N source in these pastures.
Other pastures in Amazonas and Pará and Rondônia showed no
consistent change from forest values. The extent of fractionation that
leads to 15N enrichment of soils was broadly similar over a wide range
of soil textures and indicated that similar processes control N
fractionation and loss under tropical forest over a broad geographic
region. Forest δ15N profiles were consistent with conceptual models that
explain enrichment of soil δ15N values by selective loss of 14N during
nitrification and denitrification.
2.110 Lovell and Jarvis (1996) investigated the “Effect of urine on soil microbial
biomass methanogenesis, nitrification and denitrification in grassland
soils.” Urine was added under controlled conditions to intact turfs taken from
long-term permanent pasture on clay loam and sandy loam soils in South
West England. Methane exchanges were small (<+/-0.03 µg CH4 m-2 min-1)
and overall absorption equalled or exceeded emission in both soils. On the
clay loam, wetting with water or urine increased soil microbial biomass C
and N contents by about 20% but there was no specific effect of urine. Urine,
however, caused an increase in soil respiration of >50% and the average
increase was greater for cow’s urine (30.8 mg CO2 m-2 min-1) than for an
artificial urine (20.1 mg CO2 m-2 min-1). Emissions of nitric and nitrous
oxides following urine application were substantial (on average 0.36 µg NO-
N and 29 µg N2O-N m-2 min-1) but short lived (< 40 days). This high levels of
ammonium found in the urine treates soils (> 200 mg NH +
4 -N m-2 kg-1) were
DocumentsPDFComplete
Click Here & UpgradeExpanded Features
Unlimited Pages

85
strified to nitrate over a period of 42 days. Qualitative changes in the soil
microbial biomass were evidently not related to biomass size.
2.111 Tang and Thomson (1996) reported the “Effects of solution pH and
bicarbonate on the growth and nodulation of a range of grain legume
species.” Species differed greatly in response to solution pH. For both
N-fertilized and N2-fixing plants, shoot growth of L. culinaris was very
sensitive to low pH (pH < 7), whereas shoot growth of Lupinus
angustifolius L. and Lupinus albus L. was sensitive to higher pH (pH ≥
6). Other species had a broader optimal pH range for growth when
supplied with N, but were generally sensitive to low pH (pH < 7 for C.
arietinum and Vicia sativa L., pH < 6 for P. sativum, Vicia faba L.,
Lathyrus sativus L. and Lathyrus cicera L., and pH < 5 for Vicia
benghalensis L. and Vicia narbonensis L.) when reliant on N2-fixation.
For these other species, symbiotic N2-fixation appeared to be more
sensitive than host plant growth to low pH. This finding was supported
by lower nodule numbers and mass, and lower N concentrations in
shoots of sensitive species at low pH relative to higher pH. For L.
culinaris, nodule numbers and mass were relatively unaffected by pH 5-
8, N concentrations in shoots were high at low pH and plants developed
symptoms relating to H+ toxicity at pH as high as 7. These results
indicate that host plant growth of L. culinaris is more sensitive to low
pH than the Rhizobium symbiosis. For L. albus and L. angustifolius,
both host plant growth and symbiotic N2-fixation appeared to be equally
sensitive to pH ≥ 6. Lupinus pilosus Murr. was more tolerent of high pH
than the other Lupinus species. At pH 4, two genotypes of C. arietinum
had better early nodulation than other species. Vicia ervilia L. nodulated
poorly at all levels of solution pH, indicating that the commercial Group
DocumentsPDFComplete
Click Here & UpgradeExpanded Features
Unlimited Pages

86
E inoculum (Rhizobium leguminosurum bv. Viceae SU303) may not be
effective for this species in solution culture.
Addition of bicarbonate decreased shoot growth, nodulation and
N concentrations in shoots of most species. Early nodulation (nodule
number) of Lathyrus ochrus(L.) DC was not affected by the bicarbonate
treatment.
2.112 Tsuyoshi Myazaki (1996) reported the “Bulk Density Dependence of
Air Entry Suctions and Saturated Hydraulic Conductivities of
Soils.” The bulk density of a soil changes with natural and artificial
processes in a field. The larger the bulk density ρb of the soil, the larger
the air entry suction he and the smaller the hydraulic conductivity Ks.
Although both the Kozeny-Carman equation, based on Poiseuille’s law,
and Campbell’s method, based on a similar media concept (SMC) by
Miller and Miller are able to predict bulk density dependencies of
hydraulic conductivities theoretically, the applicabilities and limitations
of them have been vague. This paper proposes a non-similar media
concept (NSMC) model, composed of a characteristic length for the
solid phase S and for the porephase d, and a shape factor τ of the solid
phase, to predict he and Ks values of a given soil as functions of its ρb.
Bycomparing the NSMC model with the Campbell method and the
Kozeny-Carman equation, it was clariefied experimentally that the
NSMC model is applicable to aggregated soils in the predictions of he
(ρb) and Ks (ρb) as well as to dispersed soils. The shape factor τ was
close to 1 when the soil was dispersed and sandy, whereas it was close
to ρb/ρs, ρs being the density of soil particles, when the soil was
aggregated.
DocumentsPDFComplete
Click Here & UpgradeExpanded Features
Unlimited Pages

87
2.113 KAUSHAL et al. (1996) investigated the “Soil Water Retention
Characteristics of Some Soils under Forests in Temperate Zone of
the Himalayas.” Some soil profiles developed under temperate zone of
Himalayan forest ecosystem, representing Typic Hapludolls and Typic
Udorthents were studied for their water retention characteristics in
relation to different soil properties. Available soil water was very low
and varied with a narrow range. Organic carbon and CEC as well as
water retntion at various suction values were comparatively higher at
lower altitude and on northern aspect. Available water was significantly
and positively influeneced by clay, silt, CEC and organic carbon, while
negatively by sand and bulk density. Most (40-50%) of the available
water retained was released up to 200 kPa matric suction.
2.114 Hudson and co-worker (1996) studied “Unsaturated Hydraulic
Properties from Upward Flow into Soil Cores.” This study developed
a transient upward infiltration procedure for estimating soil hydraulic
properties. The procedure involves pumping a carefully controlled water
flux into the bottom of an initially dry soil core. As the unsaturated core
slowly absorbs water, soil water potentials are measured with
tensiometers, and, optionally, soil water contents are measured with
time domain reflectometry. No porous plates are required for this
unsaturated flow procedure because a flux boundary is used. Applied
fluxes of approximately 0.76 cm d-1 for 60 h to 7.6 cm diam. by 7.6 cm
high cores increased the water content from an initial dry state
(approximately -7500 kPa) to almost saturation. A Levendberg-
Marquardt inverse parameter estimation procedure was combined with a
onedimensional numerical model of the experimental flow system to
estimate the soil hydraulic properties from the collected water potential
DocumentsPDFComplete
Click Here & UpgradeExpanded Features
Unlimited Pages
88
data using five different methods. Parameters in the van Genuchten
water retention relationship and van Genuchten-Mualem or the
Campbell hydraulic conductivity relationships were simulataneously
estimated. The optional water content data was combind with the water
petential data to provide initial estimates of water retention parameters.
The best method (lowest RMSE) that estimated all parameters in the
water retention relationship [φm(φ)] and the hydraulic conductivity
relationhip [K(θ)] produced similar hydraulic property relationships for
four identically packed cores of a loamy fine sand.
2.115 Dulohery and co-workers (1996) studied “Assessing Forest Soil
Disturbance through Biogenic Gas Fluxes.” This study’s objective was to
determine if the gaseous products of aerobic and anaerobic soil biological
activity could reveal harvest-damage effects, even after applying costly
mitigation treatments. Fluxes of CO2, CH4, and N2O across the soil surface
were measured in Ultisols of a Coastal Plain pine flat damaged during
timber harvest, then mitigated by bedding and fertilization (100 kg ha-1 N, P,
and K). Gas fluxes were measured with large static chambers (0.5 by 1.0 m
sampling area) to compensate for high microsite variability and the presence
of coarse debris on the forest floor. Carbon dioxide evolution was a robust
and consistent indicator of residual damage, declining an average of 34% in
planting beds on damaged vs, undamaged soils. For example, in a late
summer reading, efflux of CO2-C from beds installed over former skid trails
was 143 mg m-2 h-1 vs. 258 mg m-2 h-1 from undamaged beds and 231 mg
m-2 h-1 from undisturbed forest floor. Methane and N2O fluxes were
ephemeral and, thus, generally unrealiable as indicators of harvest damage –
though bedding produced scattered high peaks in both. Carbon dioxide was
also the only gas flux that responded significantly to fertilization, with an
DocumentsPDFComplete
Click Here & UpgradeExpanded Features
Unlimited Pages

89
average 26% increase up to 4 mo after fertilization. These results suggest
that suppression of gross soil biological activity by harvest damage was not
restored by intensive mitigation in the next rotation’s establishment phase.
2.116 Neal A. Scott et al. (1996) reported a “Soil Textual Control on
Decomposition and Soil Organic Matter Dynamics.” They examined
the direct and indirect effects of soil texture on litter decomposition and
soil organic matter mineralization during 91-d laboratory incubations.
Treatments included texture (73, 55, and 40% sand), soil water pressure
(-0.012, -0.033, and -0.30 MPa), and nutrient availability (with or
without additional N and P). Wheat litter (Triticum aestivum L.) was
placed on the surface or incorporated into the soil. Soil texture had no
effect on litter decomposition (P ≥ 0.23). Litter decomposition was
fastest for the – 0.012 MPa treatment across all soil types (P < 0.01),
and the difference between water pressure treatments was greatest in the
loam (40% sand) soil. The effects of texture and soil water pressure
could be combined into one variable (percentage water-filled pore
space), which accounted for more of the variability in litter
decomposition and native soil C mineralization than either texture or
soil water pressure alone. Surface-applied litter decomposed
significantly faster than incorporated litter, but the effect was not
consistent across different soils (P = 0.04). Litter addition stimulated the
mineralization of native soil C, the greatest effect occuring when litter
was incorporated into the fine-textured soil.
2.117 Rafael Angulo- Jaramillo et al. (1996) studied and “Measurement of
Hydraulic Properties and Mobile Water Content of a Field Soil.”
The hydraulic conductivity and the sorptivity were obtained using a new
DocumentsPDFComplete
Click Here & UpgradeExpanded Features
Unlimited Pages

90
approach that considers the transient three-dimensional infiltration from
a disk. The measurement of the mobile water content was performed by
adding KCl tracer after P rewetting the soil with water. Results show an
important nonlinearity in both conductivity and sorptivity of the soil
with applied pressure heads. The mobile water content ratio changes
with the applied water pressure, and it was found to be a function of the
effective mean pore size, λm. results show a transition from a capillary-
dominated to a gravity-dominated flow. The soil water flow changes to
a macroporosity flow when the water pressure head increases from -100
to 0 mn, resulting in an abrupt increase in the mobile water content ratio
from 0.11 to 0.37.
2.118 Wang and Wang (1996) reported a “Rapid Estimation of Cation
Exchange Capacities of Soils and Clays with Methylene Blue
Exchange.” Four Methods to determine the cation-exchange capacities
(CEC) of soils and clays were evaluated: (i) conventional NH4-Na
exchange, (ii) methylene blue (MB) capacity with MB acid, (iii) CEC of
tetrasodium pyrophosphate (TSPP), and (iv) MB- water filter paper spot
test titration methods. Eighteen surface soils (0-15 cm) from farm fields
in Taiwan and four reference clays obtained from the Source Clay
Repository (Clay Minerals Society, Columbia, MO) were used in this
work. Under appropriate conditions of concentration, equilibration
period, and flocculation of MB solutions, MB absorption can be used to
determine the CEC of soils and clays. Regression analyses gave R2
values 0.91, 0.99, and 0.74 for MB-acid, MB-TSPP, and MB-water
titration methods, respectively, vs. NH4-Na exchange. The CEC values
of MB-TSPP titration showed a good linear correlation with values
from the NH4-Na exchange method. Thus, the method of MB-TSPP
DocumentsPDFComplete
Click Here & UpgradeExpanded Features
Unlimited Pages

91
filer paper-test titration is recommended for rapid CEC determination in
field test of soils.
2.119 Matschonat and Vogt (1996) studied a “Equilibrium solution
composition and exchange properties of disturbed and undisturbed
soil samples from an acid forest soil.” They investigated exchange
properties and soil solution composition of disturbed and undisturbed
samples of an acid forest soil lacking visible structure. Cation
concentrations in the soil solution resulting from two extraction
procedures and two analytical methods were compared. The effective
cation exchange capacity (CECe) of the undisturbed samples
represented 56-69% of the bulk soil CECe. Base saturation of
undisturbed samples equalled that of disturbed samples for EA, Bhs,
and Bsh horizons, and was highter for the Bw horizon. Contradicting
the results of other authors, soil pore solution obtained by percolating
soil cores under conditions of low water tension offered more
favourable conditions for plant roots when compared to the equilibrium
soil solution of the bulk soil sample in all except the Bsh horizon.
Ca2+/Al3+ molar ratios were higher and fractions of H+ + Al3+ on total
cationic charge were lower in the soil pore solution. These results were
obtained employing soil: solution ratios of about 1:0.5 during the
extraction of soil pore solution, and by determination of free cations.
Other authors used a water extraction with soil: solution ratios up to 1:2
and took total metal for ion concentrations. The combination of the
latter extraction and analytical method in our study, too, led to
unfavourable Ca2+/Al3+ ratio and high fractions of H+ + Al3+.
2.120 Sawhney et al. (1996) studied “Magnitude of Soil Variability in
Morphological and Other Properties across Different Landscapes in
DocumentsPDFComplete
Click Here & UpgradeExpanded Features
Unlimited Pages

92
the Siwalik Hills of Punjab.” Five different landscape elements
(shoulder, toeslope, backslope, footslope and rivulet) in the Siwalik
Hills in semi-arid tract of Punjab have been encountered. A statistical
analysis of horizon thickness determinations showed a consistently wide
range of variability within the different landscape positions as indicated
by high standard deviations and coefficient of variations. The soils
developed on toeslopes showed thicker horizons whereas shoulder slope
showed thinner horizons with minimum solumn thickness. A statistical
calculation showed highest variation amongst clay and silt, organic
matter and calcium carbonate but there was no difference in pH and EC.
2.121 Skyllberg (1996) studied “Small Scale pH buffering in organic
horizons of two boreal coniferous forest stands.” Factors behind the
small-scale variation of pH were examined in O horizons (humus
layers) developed two stands of Picea abies (L.) Karst. (Site F and K)
by combining data on the composition of the cation exchange complex
with data from titrations of corresponding H+-saturated samples.
Cations extractable in 0.5 M CuCl2 (S = cmolc Kg-1 [2Ca + 2Mg + 2 Mn
+K +Na]), aluminium extractable in 1.0 M KCl (Ale = cmolc kg-1 [3Al])
and in 0.5 M CuCl2 (Alorg = cmolc kg-1 [3Al]), as well as pH measured
in 0.01 M CaCl2 (pHCa) were analysed in one-cm-layers of 13 O horizon
cores at each site. Composite samples representing each of the one-cm-
layers at each site, as well as samples with two different levels of Al
saturation at Site K, were H+-saturated and titrated with NaOH to
chosen end points of pHCa = 4.0 and 5.5 in a 0.01 M CaCl2 ionic
medium. The Acid Neutralisation Capacity (ANC) was estimated as the
amount of base needed to increase pHCa of the composite H+-saturated
samples of the mean pHCa of the corresponding natural samples. The
DocumentsPDFComplete
Click Here & UpgradeExpanded Features
Unlimited Pages
93
ANC was found to be similar in magnitude or higher than the amount of
sites binding S + Ale, which suggests that 1.0 M KCl exchangeable Al
ions are nonacidic in acid O horizons. The relative contribution form i)
the capacity of acidic functional groups, ii) their acid strength and iii)
their degree of neutralisation to differences in pHCa between sites,
among cm-layers and between samples with different levels of Al
saturation were estimated from titration curves adjusted to hold two out
of three factors (i, ii and iii) to be constant. The degree of neutralisation
explained most of the differences in pHCa between the tow sites, as well
as between samples with different levels of Al saturation at site K. The
pHCa decreased by depth at site F was, however, partly explained by an
increasing acid strength.
2.122 Baruah and Aylmore (1996) studied “Thermodynamic Evalution of
Cation Exchange Equilibria in Binary and Ternary Systems on a
Sandy Clay Loam Soil.” Cation exchange equillibria involving cation
pairs, Ca2+-Na+, Mg2+-Na+ and Ca2+-Mg2+, in varying cationic ratios at
two electrolyte concentrations (10 and 100 m equiv. L-1) were studied
on a sandy clay loam soil from Narrogin, Western Australia. In
heterovalent systems, there existed a preferential adsorption for divalent
cations (Ca+2 and/or Mg2+) vis-a-vis monovalent cation (Na+), regardless
of solution concentration. This is evident from the position and shape of
the Na+ isotherms as well as from the sign and magnitude of free energy
change (∆ Gr') of exchange reactions. In homovalent systems, the
position of the Mg2+ isotherm indicated a preferential adsorption of
Ca2+. The smaller values of Gapon selectivity coefficient (KG) at
different degrees of Na+ saturation also confirm the selectivity for
divalent cations, irrespective of solution concentration. The surface
activity coefficients (fj), calculated for both heterovalent binary and
DocumentsPDFComplete
Click Here & UpgradeExpanded Features
Unlimited Pages

94
ternary systems further confirm weaker Na-binding on the soil exchange
over a range of ESP values. The disproportionately higher value of fNa
corresponding to lower Na+ saturation is discussed in the light of the
‘tactoid model’. The preferential adsorption of Ca2+ and Mg2+ vis-a-vis,
Na+ for the soil exchange sites was greater, when they competed
separately with Na+, than when all three cations competed together. At
comparable fraction on the soil exchanger (NCa = NMg = 0.17 or 0.33),
the values of fMg were larger than those of fCa. This infers a competitive
edge to Ca2+ over Mg2+ for the soil exchange sites. This is most evident
at low proportions of these cations on the soil exchanger. The predictive
equations developed in this study conform to the recognized exchange
properties for all three cations. It is concluded that, in general, the
behaviour of the ternary exchange system can be predicted with a
reasonable accuracy from data for the relevant binary systems.
2.123 Mondal et al. (1997) studied the “Spectroscopic, Thermal and
Electron Microscopic Investigations on Clay-Humus Complexes.”
From IR spectroscopy and TG analysis, no significant involvement of
the OH groups of the clay minerals in complexation with HA (humic
acids) could be detected. Furthermore, there is no detectable interaction
of the free radicals of HA with Fe3+/Mn2+ in the clay minerals, as seen
by ESR measurements. TEM showed sheet-like forms of free HA in
kaolinite-HA complexes and surface deposits in illite-HA complexes.
Montomorillonite-HA complexes showed extensive coating by HA as
well as a reduction in the size of the clay particles as a consequence of
the braking up of clay platelets by HA.
2.124 Menzies and Gillman (1997) studied a “Chemical Characterization
of Soils of a Tropical Humid Forest Zone: A Methodology.” A
DocumentsPDFComplete
Click Here & UpgradeExpanded Features
Unlimited Pages

95
Methodology based on combination of routinely performed analyses
and investigation of fundamental charge and anion sorption properties
was used to characterize the soils of the humid forest zone of
Cameroon. In general, the soils have about 2 cmol kg-1 permanent
negative charges, with about 1 cmol kg-1 from variable-charge sources
at current soil pH values. Furthermore, they are impoverished with
respect of Ca, Mg, and K, while Al frequently dominates the exchange
complex. Thus, the ability of these soils to retain base cations is more
limited than is suggested by the cation-exchange capacity (CEC).
Therefore we propose the concept of a degradation index (DI) defined
as: DI = 100 (CEC5.5 – sum of basic cations)/CEC5.5, where CEC5.5 is
the CEC measured at pH 5.5. This index encompasses degradation a soil
may have experienced from natural or man-made cause. Extractable
PO4 concentrations are considered very low and the soils have a
moderate to high capacity to fix added PO4. Surface Soil SO4
concentrations are considered marginal to deficient for plant growth,
though adequate reserves of SO4 are held in the subsoil by SO4 sorption.
The approach used demonstrated that the five morphologically different
soil profile classes identified in the zone have similar chemical
characteristics. Thus, the results of experimentation conducted on one of
the soil profile classes will be applicable throughout the zone.
Furthermore, the approach has provided a means of identifying
comparable soil types in other parts of the world and will guide
technology transfer. The analytical methods used in this study are
relatively simple and require no specialized equipment, and are
therefore within the capabilities of many laboratories in the developing
world.
DocumentsPDFComplete
Click Here & UpgradeExpanded Features
Unlimited Pages

96
2.125 Tamgadge (1997) investigated “Soil of Gadchiroli District of
Maharashtra.” Twenty soil series in Gadchiroli district of Maharashtra
have been identified and mapped while conducting the reconnaissance
soil survey. The geology of the area consists of granite, granite-gneiss
and shale. The landform sequence in the area comprises of plateau,
escarpment, pediment, valley bottom and flood plain. They are
classified (Soil Taxonomy) and mapped into 56 soil series associations.
The soils are mostly cultivated to paddy, minor millets and patches are
under dry deciduous mixed forest vegetation. Based on the soil
properties, soil taxonomy, present land use and climatic make up, the
soils have been interpreted for sustainable land uses. The productivity
potential ratings as low, medium and high are suggested.
2.126 Tamgadge (1997) investigated “Soils and Their Production Potential
of Bhandara District Maharashtra State.” Seventeen soil series in
Bhandara District of Maharashtra were identified, and classified
according to Soil Taxonomy while conducting the reconnaissance soil
survey of the area. The geology of the area was complex consisting of
granite gneiss, laterite, shale, feldspathic quartzitic schist, alluvium. The
landform sequence was plateau, escarpment, ridge, ridge slope, valley
bottom, upper piedmont, lower piedmont and flood plain. The soils
were classified as Lithic Ustorthents, Typic Ustorthents, Lithic
Ustochrepts, Typic Ustochrepts, Vertic Ustochrepts, Udic Ustochrepts,
Fluventic Ustochrepts, Udic Haplustalfs, Typic Haplustalfs, Typic
Haplusterts, Chromic Haplusterts and Udic Haplusterts. The soils were
mapped into 35 soil associations. Based on the properties, climate, and
experience gained in the area, the land use and productivity potential of
these soils were suggested, Burkhabodi, Khamtalao, Kochi, Deori,
DocumentsPDFComplete
Click Here & UpgradeExpanded Features
Unlimited Pages
97
Seoni, Lakhandur, Sonegaon soils had low productivity potential;
Karati, Jamnapur, Paraswada, Sawarbandh, Kumbhali, Korambi –
medium productivity potentials and Sakoli, Dholsar, Arjuni soils had
high productivity potentials.
2.127 Sen et al. (1997) studied “Chemical and Electrochemical
Characterization of Some Acid Soils of Assam.” Measurement of
CEC by three different methods was compared; the CEC by sum of
cations and NH4OAC method gave much higher values than effective
CEC. Total potential acidity constituted 34 to 88 per cent of the total
exchange capacity (extractable acidity + cations). Acidity due to
variable charge (pH dependent) contributed 86 to 95 per cent of total
acidity while exchange acidity contributed 5 to 14 per cent only. The
variable charge characteristics were positively related with free oxides
(r = 0.66) and clay content (r = 0.74) of the soils. The zero point charge
(ZPC) varied from 2.4 to 3.2 while surface potential varied between -
82.6 and -206.5 mV. In all the soils, the permanent charge was negative,
indicating thereby that the soils though leached are not extremely
weathered. The clay minerals in association with free sesquioxides and
organic matter contributed towards the development of variable charge.
2.128 Dey and Jain (1997) studied “Mineralization and Nitrification in
Soil Amended with Urea and Enriched Green manures in
Submerged Soil System.” Mineralization pattern of three green
manures, viz. dhaincha, cowpea and guar were evaluated along with the
effect of their enrichment and compared with that of urea in a
submerged soil system. Inorganic N in soil was found to decrease after
42 days after transplanting (DAT) rice. Mineralization of urea amended
DocumentsPDFComplete
Click Here & UpgradeExpanded Features
Unlimited Pages

98
soil was on par with enriched guar. Cumulative mineralization from
green manures followed the order: guar > dhaincha > cowpea. Rate of
mineralization attained peak after 35 DAT. Relationship between net
ammonification and mineralization was found to be significant.
Cumulative mineralization from greenmanures was positively
conrrelated with total N, whereas negative correlation existed with
lignin content and C/N ratio. Lignin was found to be the best predictor
or mineralization, which can explain 80 per cent of total variations.
2.129 Luisella Celi (1997) investigated the “ANALYSIS OF CARBOXYL
GROUPS IN SOIL HUMIC ACIDS BY A WET CHEMICAL METHOD,
FOURIER-TRANSFORM INFRARED SPECTROPHOTOMETRY,
AND SOLUTION-STATE CARBON-13 NUCLEAR MAGNETIC
RESONANCE. A COMPARATIVE STUDY.” Carboxyls are important
functional groups that affect polarity and reactivity in humic acids
(HAs). Carboxyls were analysed in eight soil HAs by three method
based on widely differing principles: (i) wet chemical analysis, (ii)
Fourier-Transform Infrared spectrophotometry (FT-IR), and (iii) liquid-
state 13C Nuclear Magnetic Resonance (13C NMR). The objective was to
uncover the suitability of each of these methods for the analysis of
COOH groups in HAs and the extent to which the three methods agreed
with each other in quantitative measurements of COOH groups in HAs.
In regard to reaction mechanisms, the chemical Ca-acetate method is
based on ion-exchange of H of COOH for Ca of Ca-acetate. From FT-
IR spectra of HAs, COOH groups were determined by totalling
absorbances at 1720-1710 cm-1 (COOH) and 1620-1600 cm-1 (COO-),
whereas from 13C NMR spectra of HAs, COOH groups were computed
by integration of 175-185 ppm area. Good correlations were found
between the three methods although the COOH values computed by 13C
DocumentsPDFComplete
Click Here & UpgradeExpanded Features
Unlimited Pages

99
NMR were higher, as a result of the inclusion of small amounts of
esters, amides, and lactones than those obtained by the other two
methods. Thus, depending on the equipment and facilities available, soil
scientists have a choice of methods that can be used for determining
COOH groups in HAs.
2.130 Sahu and Mishra (1997) studied a “Morphology, Characteristics and
Classification of Soils of an Irrigated River Flood Plain in the Eastern
Coastal Region.” Four pedons of an irrigated river flood plain under
Salandi irrigated command of eastern coastal region were characterized and
classified. Gradual increase of clay and development of structure down the
depth indicated presence of cambic horizon. Fluctuation of water table and
alternate wet and dry condition in an irrigated regime have given rise to
formation of Fe, Mn concretions and lime nodules in the subsurface
horizons. Soils were imperfectly drained, neutral to alkaline and the pH
values increased down the depth. A significant positive correlation was
obtained between clays and CEC (r = 0.92**). Soils were of medium
fertility.
2.131 Walia and Rao (1997) studied a “Characteristics and Classification
of Some Soils of Trans-Yamuna Plain.” Characteristics and elemental
compositions of soils of four pedons representing four landforms of
Banda plain in Bundelkhand region of Uttar Pradesh were studied.
Khraund soils on piedmont plain are well drained, reddish brown, clay
loam, slightly acidic, low in organic carbon, moderately eroded and
classified as Fluventic Ustochrept. Bharatkup pedon on recent dissected
flood plain is somewhat excessively drained, light yellowish brown,
sandy clay loam, highly calcareous with lime kankars, severely eroded
DocumentsPDFComplete
Click Here & UpgradeExpanded Features
Unlimited Pages

100
soils and classified as Typic Ustochrept. Badausa pedon on slightly
undulating flood plain has moderately well drained, dark greyish brown,
clay soils with deep cracks and weak slickensides and classified as Udic
Haplustert. Considerable reduction of CEC and weak are probably the
expression of partial chloritization of smectitic clays. Anuwan soils on
level flood plains are imperfectly drained, greyish brown to olive
brown, silty clay, rich in organic carbon, showing surface cracks and
redoximorphic features, hence, put under Vertic Epiaquepts. The soils
are, in general, siliceous; the variations in SiO2 and total base content
are mostly associated with nature, source and composition of alluvium.
2.132 Singh and Mishra (1997) investigated “Irrigability and Productivity
Classification of Some Typical Soils of Sedentary and Alluvial
Origins.” The soils differed in irrigability classes and the differences
are related to various soil limitations. Both, land and soil irrigability
classes, show alignment with each other in their broader perspective.
Pedons 1, 4, 5 and 6 fall under good productivity class whereas pedon 2
has average and pedon 3 poor productivity. The potential productivity
class is excellent for pedons 4, 5 and 6 whereas good for pedons 1 and 2
but poor for pedon 3. The coefficient of productivity follows the order:
Pedon 6 > Pedon 2 > Pedon 1 > Pedon 5 > Pedon 4 > Pedon 3. These
findings anable database to execute the reliable decision for effective
land use planning and help to resolve the contrast on land surface
significantly for maximizing production.
2.133 Sarma et al. (1997) studied a “Physical Characterization of Soils in
Two Command Areas of Assam.” Physical properties of two soils
(Alfisols and Inceptisols) from two different command areas (Shallow
DocumentsPDFComplete
Click Here & UpgradeExpanded Features
Unlimited Pages
101
Tubewell Command, Alfisols; Deep Tubewell Command, Inceptisols)
in the rain shadow belt under Central Brahmaputra Valley Zone
(CBVZ) of Assam were studied. The bulk density in Alfisols was higher
than Inceptisols and it increased with depth, in both the soils. Soils of
STW command registered very low hydraulic conductivity (Ks) values
while it was moderate to moderately rapid in DTW command. The
surface layer soil of both the command areas contained higher
percentage of aggregates less than 0.25 mm. The soils of STW
command contained higher water content at all the suction ranges as
compared to DTW command. The clay content was the single most
dominant factor influencing the physical attributes of soils and it was
significantly and positively correlated with bulk density, macro-
aggregates, mean weight diameter (MWD), field capacity and
permanent wilting point.
2.134 Madhumita Das and co-workers (1997) studied a “Effect of Major Land
Uses on Soil Characteristics of Alfisols in Meghalaya.” Horticulture land
use pattern ameliorated acid Alfisol by reducing Al-toxicity followed by
dairy farming, while organic matter build-up was highest by the dairy
farming (1.63%) followed by agroforestry (1.6%). Dairy farming was
superior to other systems including pasture and helped in building up of P,
Ca, Mg, K, Zn, Cu and B in the soil profile. Among all, maize-based
cropping was inferior, in correcting soil acidity problems and enhancing
nutrients in soils. Dairy farming or horticulture could be adopted as
alternative to shifting cultivation jhuming on sloping land under mid to low
altitude (980-200 m) situation in Meghalaya.
DocumentsPDFComplete
Click Here & UpgradeExpanded Features
Unlimited Pages

102
2.135 Burle and co-workers (1997) investigated an “Effect of cropping
systems on soil chemical characteristics with emphasis on soil
acidification.” The soil under intensive cultivation and low addition of
crop residues in exposed to erosion and reduction of organic matter.
Increases in soil organic matter, cation exchange capacity (CEC) and
nutrient availability may occur in no-till systems with legumes and with
large additions of organic residues. Nevertheless, some legumes may
increase soil acidification through the carbon and nitrogen cycles. An
experiment was carried out over 10 years, with 10 cropping systems on
a Dark Red Podzolic soil (Paleudult) to evaluate the effect of no-till
cropping systems on soil chemical characteristics. Legume cropping
systems resulted in the greatest soil organic C gain and the highest
ECEC to a depth of 17.5 cm. The increase was greatest at 0 – 2.5 cm
layer. Clover systems resulted in the highest soil acidification at 2.5 –
7.5 and 7.5 – 17.5 cm depths. The rate of soil pH decrease at 2.5 – 7.5
cm depth under clover + Spergula/maize system was 0.1 unit year-1.
Differences in soil acidification affected soil ECEC. Soil exchangeable
cation data indicate that nitrate leaching increased soil acidification.
Maize yields were greatest in legume systems due to increased N
supply.
2.136 Jain et al. (1997) studied the “Carbon to Organic Matter Ratios for
Soils in Rocky Mountain Coniferous Forests.” Vegetation type, soils,
climate, and conversion ratios influence estimates of terrestrial C. Our
objectives were to (i) determine carbon to organic matter (C/OM) ratio
for brown cubical rotten wood, litter, surface humus, soil wood, and
mineral soils; (ii) evaluate the validity of using 0.58 and 0.50 ratios for
estimating C in mineral and organic soil components, respectively; and
DocumentsPDFComplete
Click Here & UpgradeExpanded Features
Unlimited Pages

103
(iii) determine if C/OM relationships were applicable across broad
geographic areas. The study sites were located from the southern to
northern Rocky Mountains. They differed in vegetation, soil parent
material, and climate. The C/OM regression slopes we developed for
organic components were quite consistent and relatively constant across
vegetation types ranging from 0.43 to 0.51 and were similar to the 0.50
traditional ratio. The C/OM regression slopes for mineral soils ranged
from 0.16 to 0.48 depending on vegetation type. These slopes were
lower than the 0.58 ratio often applied. The reliability of simple ratios
when used in estimating C as a function of organic matter is often
overestimated. Error and bias can be introduced into C estimates when
using simple ratios. This study refined C/OM regressions for mineral
soils and provided regressions for organic soil components. Information
developed in this study can be applied to improve regional and global C
assessments.
2.137 Khan and co-workers (1997) reported a “Fertility Status and
Productivity Potential of Some Benchmark Soils of Bangladesh.”
Five soil profiles representing five major soil series from the floodplains
of Bangladesh have been studied to evaluate their fertility status. The
nutrient contents of these soils have been reported. With respect to
nutrient status, the soils are classed as fertile with reasonably high
production potentiality, which is renewed every year because of
siltation during the monsoon season.
2.138 Ananthanarayana and Ravi Kumar (1997) studied the “Characterization
of Soil Acidity and Lime Requirement of Soils in the Agroclimatic Zones
of Hassan District of Karnataka.” In Hassan, 16 per cent of the total
DocumentsPDFComplete
Click Here & UpgradeExpanded Features
Unlimited Pages

104
cultivated are is acidic. Majority of the soils under study were sandy
loam with low cation exchange capacity. The nature of acidity in these
soils is pH-dependent. Extent of calcium saturation ranged from 5.3 to
26.4 per cent and aluminium saturation ranged from 11.6 to 39.4 per
cent. Lime additions based on exchangeable calcium method correlated
with soil physicochemical properties.
2.139 Kornecki et al. (1997) studied the “DETERMINATION OF CATIONIC
AND ANIONIC SURFACTANT CONCENTRATIONS IN SOIL.”
Research within this field often requires determination of anionic and
cationic surfactant concentrations in soil. This paper details a study
through which simple and effective extraction procedures were
established for use in conjunction with two different surfactant chemical
analysis methods. Surfactant extraction is accomplished in two steps.
First, a sodium chloride solution is used to reduce electrostatic
soil/surfactant attractions and precipitation, and second, acetone is
added to minimize hydrophobic adsorption. The extractant solution was
diluted, followed by colorimetric chemical analysis using a
spectrophotometer. The extraction effectiveness of these procedures
was found to be near 100% for both cationic and anionic surfactants.
2.140 Yi-Ju Chien et al. (1997) studied “GEOSTATISTICAL ANALYSIS OF
SOIL PROPERTIES OF MID-WEST TAIWAN SOILS.” In this
kriging and cokriging methods were applied to estimate the spatial
distribution of soil properties from available large-scale survey data of
Taiwan. The data were derived from soils in a 10-km2 area divided into
250 m X 250 m node intervals. The soil properties examined included
the extractable P, Ca, Mg, and Fe contents, the sum of exchangeable
DocumentsPDFComplete
Click Here & UpgradeExpanded Features
Unlimited Pages

105
bases (SEB), % sand, % silt, and % clay. The sum of exchangeable
bases and particle-size distribution were regarded as the primary and
auxiliary variables, respectively, in the cokriging procedure. The ratio
of nugget to total variation was about 57 to 80%, indicating that the
spatial correlation of the tested soil properties at the large scale was
moderately (cross-) dependent. The estimated spatial distributions of the
soil properties by kriging, under the decreasing sampling densities, all
correlated significantly (P < 0.1%) with those obtained from original
data. Furthermore, with the over-sampled particle-size distribution, the
overall estimation of SEC quality by cokriging was superior to that by
kriging. The results suggested that by Kriging and cokriging the existing
sampling density could be decreased under the large-scale sampling
interval by nearly half and that sufficient spatial information about the
soil properties could still be retained. The information obtained could be
used to improve the long-term sampling design of soil surveys in
Taiwan. It also may be useful for identifying the appropriate sampling
densities for these for these scales of soil surveys.
2.141 J.N. Shaw et al. (1997) studied a “MORPHOLOGIC AND HYDRAULIC
PROPERTIES OF SOILS WITH WATER RESTRICTIVE HORIZONS
IN THE GEORGIA COASTAL PLAIN.” Objectives included characterzing
the morphological and hydraulic properties of major horizons in soils with
plinthite, determining the extent of preferential flow, and relating
flow/transport parameters derived form breakthrough curve analyses to
morphological properties. These soils have developed from Miocene aged
sediments and are classified in fine-loamy, siliceous, thermic families of
Plinthaquic, Aquic, Arenic Plinthic, Plinthic, and Typic kandiudults.
Morphological evidence indicates that BC horizons are restrictive to vertical
DocumentsPDFComplete
Click Here & UpgradeExpanded Features
Unlimited Pages

106
percolation of drainage water. Methylend blue by staining, Ksat and
breakthrough curves (analyzed by two regin/MIM using CXTFIT) were
measured on 15-cm-diameter undisturbed cores to determine the effects
of argillic horizons, argillic horizons with plinthite, and subjacent BC
horizons on hydraulic properties of the soils. Ksat for seven sampled
pedons averaged 1.6 x 10⁻², 1.1 x 10⁻², and 3.8 x 10⁻³ mm s-1 for Bt, Btv,
and BC horizons, respectively. Dye staining and model output (MIM)
indicates a greater degree of preferential flow with depth and
subsequent less mobile area contributing to water flow. Analyses of the
flowpaths indicate water is translocated in regions with relaively higher
prorsity that also contain a higher proportion of coarser pores.
Micrographs indicate that flowpaths are associated with bio-pores and
areas of better aggregation in the Bt horizons and structural voids in the
BC horizons. BC horizons in these soils are less permeable beacuse of
increased clay content, differences in pore characteristics, and less
cross-sectional area contributing to flow.
2.142 Hans-Roff Schulten and Schnitzer (1997) investigated a “Chemical
Model Stractures for Soil Organic Matter and Soils.” A hypothesis
for the three-dimensional structure of soil organic matter (SOM) and
whole soil, based on an improved humic acid (HA) model that resulted
from comprehensive investigations combining geochemical, colloid-
chemical, electron-microscopical, IR, 13C-NMR, and X-ray specto-
scopic as well as agricultural and ecological data with analytical
pyrolysis, is proposed. Direct, temperature-programmed pyrolysis in the
ion-source of the mass spectrometer combined with soft inonization in
very high electric fields (Py-FIMS) and Curie-point pyrolysis-gas
chromatography/mass spectrometry (Py-GC/MS) were the main thermal
analytical methods employed. Molecular modeling and geeometry
DocumentsPDFComplete
Click Here & UpgradeExpanded Features
Unlimited Pages

107
optimization of SOM complexes and soil particles was performed using
molecular mechanics and dynamics calculations in order to optimixe the
structural geometry and to determine low energy conformations. Atomic
and molecular space requirements, voids, inter- and intramolecular
hydrogen bonds and water and metal cation interactions were evaluated.
First investigations of quantitative structure-activity relationship
(QSAR) properties were made to correlate molecular structures with
soil properties such as mass, surface area, volume, partial charges
(electronegativity), polarizability, refractivity, hydophbicity, and
hydration energy. Important characteristics of SOM such as surface
activity, cation exchange copacity, binding and trapping of biological
and anthropogenic substances, soil stabilization, and nutrient supply can
by illustrated by these models.
2.143 Asadu, Diels, and Vanlauwa (1997) reported “A COMPARISON OF THE
CONTRIBUTIONS OF CLAY, SILT AND ORGANIC MATTER TO
THE EFFECTIVE CEC OF SOILS OF SUBSAHAVAN AFRICA.” The
contributions of clay, silt, and organic matter (OM) to the effective
cation exchange capacity (ECEC) of soils in subSaharan Africa were
examined using data from more than 2131 soil samples collected from
Cote d’Ivoire, Nigeria, Tanzania, and Uganda. The data were
partitioned into highland humid (HLH), lowland humid (LLH),
subhumid (SH), nonhumid (NH), low altitude (LA), mid altitude (MA),
0-20-cm depth (D1), and 20-40-cm depth (D2) following preliminary
analysis.
The soils of each zone are generally low in ECEC and OM and
low to medium in clay and silt contents, and all exhibited wide
variations both within and across the zones. In most of the zones, ECEC
DocumentsPDFComplete
Click Here & UpgradeExpanded Features
Unlimited Pages

108
correlated significantly with all three variables. In the NH zone,
however, clay exhibited a nonsignificant correlation with ECEC, and
silt showed similar characteristics with ECEC in the SH zone. The
absolute CEC of clay was highest in the HLH zone, where it made a
relative contribution (RC) of 67% to the ECEC. The highest RC of silt
(37%) was obtained in the NH zone, where the CEC of silt was also
highest. Generally, the RC of OM was either as high as or higher than
the combined contributions of clay and silt of ECEC, except in the SH
and LA zones. For the entire subregion, OM alone could account for
about 60% of the mean ECEC of the soil. This demonstrates the overall
importance of OM in maintaining the nutrient reserve in tropical areas.
The overall variations in ECEC attributable to the three variable could
range from 56% in the SH zone to 95% in the LLH zone.
2.144 Khan et al. (1997) studied a “Total and DTPA-Extractable Fe, Mn,
Cu and Zn Contents in Some Soils of Bangladesh.” Thirty soil
samples representing different parent materials of Bangladesh were
studied for the distribution of total and DTPA-extractable zinc, copper,
manganese and iron in the surface horizons. Total content of
micronutrients in these soils was moderate to high and their content
decreased from the younger to the older soils. But the total quantity of
the above nutrients showed little variation in soils developed on similar
parent materials. On the basis of DTPA-extractable micronutrients, zinc
deficiency was widespread (13 out of 30 soils) in these soils, whereas
the quantities of iron, manganese and copper were adequate. The
DTPA-extractable zinc, copper, manganese and iron showed high
correlations with their total amounts, indicating a genetic relationship of
these soils with zinc, copper, manganese and iron.
DocumentsPDFComplete
Click Here & UpgradeExpanded Features
Unlimited Pages

109
2.145 Sharma and co-worker (1997) studied a “Characterization,
Classification and Landscape Relationships of Inceptisols in North-
West India.” Morphological, physical, chemical and mineralogical
characteristics of Inceptisols occurring on five dominant landscape
positions viz. footslopes, toeslopes, interdunal areas, alluvial plain and
microdepressions in the Punjab state in north-west India have been
studied. In udic region the soils developed on footslopes are non-
calcareous and those on teoeslopes are calcareous. These soils are
classified as Dystric Eutrochrepts and Typic Eutrochrepts. In ustic
moisture region (less hot zone) the soils of Siwaliks are calcareous and
are classified as Fluventic Ustochrepts are adjoining to this in piedmont
plain soils are classified as Typic Ustochrepts. In the ustic region (more
hot zone), the soils developed in interdunal areas show weakly
developed cambic horizon and are classified as Typic Ustochrepts. The
soils developed on alluvial plains have variable calcium carbonate
content and relatively well developed cambic horizon. These soils are
classified as Typic Ustochrepts. Some of the soils developed on slightly
lower topographic positions are alkaline in nature (ESP > 40%) and are
classified as Natric Ustochrepts. Fine textured soils developed on
alluvial plains in the old flood-plain areas show the development of
strong angular blocky structure with pressure faces and slickensides.
These are classified as Vertic Ustochrepts. All the soils have mixed
mineralogy and hyperthermic temperature regime. The morphological,
physical and chemical properties and land use limitations of these soils
as discussed.
2.146 Patil, Veeramallappa and Hebbara (1997) studied “Suplhate
Retantion as Influenced by pH and Soil Constituents in Some
Major Soil Groups of Karnataka.” Sulphate retention studied with
DocumentsPDFComplete
Click Here & UpgradeExpanded Features
Unlimited Pages

110
two pairs of Vertisols (pH-independent) and three pairs of Alfisols (pH-
dependent) were carried out at the Agricultural Research Station,
Gangavati. The soils had a range of properties in respect of pH, organic
matter and free iron oxides. Adsorption of sulphate by Vertisols
remained largely independent equilibrium pH and solution
concentration and was purely desorption. The negative values of
distribution coefficient (Kd) and Freundlich’s ‘k’ as a measure of
adsorbability and ‘n’ as a measure of energies of adsorption indicated
that soils carried predominantly pH-independent charges. Alfisols
representing variable clarges recorded desorption (Ranebennur) at lower
equilibrium concentration and higher pH value of the solution. All the
soils, both surface and subsurface recorded a net loss in adsorption due
to removal of organic matter and free iron oxides. Further, a decrease in
adsorption was indicated by ‘Kd’ and Freundlich’s ‘k’ and ‘n’ values
apart from marginal reduction in PZC.
2.147 Randhawa and Singh (1997) reported a “Distribution of Manganese
Fractions in Alluvium-Derived Soils in Different Agro-climatic
Zones of Punjab.” In the soils from the four major agro-climatic
regions of Punjab, viz., undulating, central, western and flood-plain
regions, total and DTPA-extractable Mn in these soils ranged from 200
to 550 and 2.6 to 9.9 mg kg-1 soil with average values of 373 and 5.1 mg
kg-1 soil, respectively. A sequential fractionation showed that Mn-
exchangeable, weakly adsorbed, moderately adsorbed, strongly
adsorbed, associated with organic matter, occluded and bound by
carbonates/acid soluble minerals were in very low proportion while
most of the total Mn (35.3 to 84.9%) was in the residual fraction. The
chemical pools of Mn were positively correlated with major soil
properties.
DocumentsPDFComplete
Click Here & UpgradeExpanded Features
Unlimited Pages

111
2.148 Beyer et al. (1997) studied a “Soil organic matter of suggested
horizons in relic arnithogenic soils of coastal continental Antarctica
(Casey Station, Wilkes land) in comparision with that of Spodic Soil
horizons in Germany.” The SOM investigations were carried out by
means of wet chemical SOM analyses and carbon-13 and nitrogen-15
nuclear magnetic resonance (NMR) spectroscopy. The purpose is to
compare these data with those obtained from spodic horizons formed
under temperate climate conditions. This comparison should provide the
first information concerning the possibility of podzolization in
Antarctica. In contrast to the spodic horizons in Germany, the SOM of
the antarctic soils in characterized by a high percentage of amino
derivates from proteins, polysaccharides, urates, and chitin, resulting in
a mean C–to–N ratio of 10 and a high content of carboxyl carbon units,
which probably derived from amino and other organic acids. The 15N-
NMR spectrum of penguin guano suggests the presence of uric acid (2,
6, 8-trioxypurine). Our data suggest that migration of organic acids, not-
humified carbohydrates, and N-containing moieties from the topsoil
moving into the spodic horizons of the ornithogenic soils affect the
podzolizatio process. In the SOM of the German Podzols, N-compounds
and not-humified carbohydrates were of minor importance the SOM
translocation processes.
2.149 Ji r( í S(
imunek, Martinus and Genuchten (1997) studied
“ESTIMATING UNSATURATED SOIL HYDRAULIC PROPERTIES
FORM MULTIPLE TENSION DISC INFILTROMETER DATA.” In
this paper they analyze the possibility of using cumulative infiltration
rates obtained at several consecutive tensions for the purpose of
estimating soil hydraulc parameters. We also investigate whether
DocumentsPDFComplete
Click Here & UpgradeExpanded Features
Unlimited Pages

112
additional, easily obtainable information improves identifiability of the
unknown parameters. The study is carried out using numberically
generated data. The uniqueness problem was analyzed by studying the
behavior of response surfaces in the optimized parameter planes. Our
parameter estimation procedure combines the Levenberg-Marquardt
nonlinear parameter optimization method with a quasi three-
dimensional numerical model, HYDRUS-2D, which solves the variable-
saturated flow equation. We found that the combination of multiple
tension cumulative infiltration data with measured values of the initial
and final water contents yielded unique solutions of the inverse problem
for the unknown parameters.
2.150 Malik et al. (1997) studied “A Simple field method to determine soil
dispersiveness.” Dispersion experiments for different soils were carried
out in a distance-marked test tube (1.2 cm i.d., and 16 cm length) using
1.5g of oven dry soil and 15mL of water. The falling distance of the
dispersion fromt (z) was observd as a function of time (t). The linear
relationship between z and t for all soils verified the applicability of
Stokes’s law in the initial distance (z ≤ 8 cm). Dispersiveness was
defined as the inverse of the falling velocity of the dispersion front in
water, Vw. The latter was related quantitatively to peneration coefficient
λw (λw = 0.513 V 338.0w ) and hydraulic conductivity, Ks (Ks = 0.001 V 582.0
w ).
The disigned dispersiveness method is simple and practical; preparation
of sample, handling of instruments, and measurements of z and t are are
easy and convenient and require less technological input.
Reproducibility is very high (CV < 10%), and the method is highly
sensitive becasue its range of variation in falling velociy over different
soils is two orders higher thatn that of penetration coefficient. The
DocumentsPDFComplete
Click Here & UpgradeExpanded Features
Unlimited Pages

113
method is intended for field use. Under field situations, volume (1 cm3)
may be substituted for weight (1.5 g oven dry) of soil, which keeps the
variation within the experimental errors.
Falling velocity (V) and penetration coefficient (λ) increased in a
0.1N CaCl2 solution compared with distilled water in all soils except
sand. Effect of the height of suspension on dispersiveness was found to
be positive, whereas the diameter of the sedimentation cylinder had no
significant effect.
2.151 T. Olesen et al. (1997) investigated a “Modeling diffusion and
Reaction in Soils: V. Nitrogen Transformations in Organic Manure-
Amended Soil.” Measurements of nitrogen transformation with high
temporal and spatial resolution are needed to better understand and
predict nitrogen losses from manure-amended soil. Centimeter-scale
measurements of nitrogen transport and transformations were caried out
in a soil-manure modelsystem corresponding to direct injection of liquid
manure into soil. Influence of manure type (cattle or pig manure), initial
soil-water, and soil-nitrate conent were investigated. The manure type
was the dominating factor with respect to both the initial redistribution
of water and solutes and the subsequent nitrogen transformation
processes. The liquid transport from the pig manure into the soil was
rapid and extensive compared with the catle manure. In both systems,
the initial water transport created a low-nitrate zone at the manure-soil
interface, possibly limiting denitrification that was found to be
insignificant. Nitrification was inhibited initially in the cattl manure
systems with high NH +4 and DOC concentrations. A small N
immobilization during the first 2 days of incubation, followed by a net
mineralization, was seen in all experiments. An Inverse Diffusion-
DocumentsPDFComplete
Click Here & UpgradeExpanded Features
Unlimited Pages

114
Reaction Model (IDRAM) was used to calculate spatial and temporal
variations in net nitrate production rates after the intial water transport
had ceased. Good agreement was found between IDRM-calculated net
nitrate production rates and measured nitrification rates. The net nitrate
production rates were higher in the pig manure than in the cattle manure
systems in the first 8 to 10 days, but they then decreased rapidly as a
result of NH +4 limitation in the pig manure system. Unlike the
frequently used mass balance considerations, the IDRAM includes the
effects of diffusion and, therefore, seems promising for high resolution
analyses of solute transformation processes.
2.152 Andrew P. Low and co-worker (1997) studied a “Effects of soil
osmotic Potential on, Nitrification, ammonification, N-Assimilation,
and Nitrous oxide production.” They used a 15N isotopic dilution
method to evaluate the effects of sΨ on gross rates of nitrification,
ammonification, NH +4 assimilation, and NO −
3 assimilation, and net rates
of nitrous oxide production in a Penoyer sandy loam at field capacity.
To avoid creasting specific ion toxicities that normally do not occur in
this soil, we used a chemical equilibrium model to predict how solute
concentrations in the soil solution change during evapo-concentration;
then we used solutions containing these mixtures of solutes to create
individual sΨ treatments. A nitrification potential assay was also perfoemed
to determine the effect of sΨ on nitrification rates at high substrate
concentrations. In soil slurries with elevated NH +4 concentration (1110 µm),
nitrification rates declined exponentially with reduced sΨ (increased salt
concentration); however, in soil samples incubated at field capacity without
added NH +4 (9.7 µm, or 2 mg N Kg-1), the gross nitrification rate was
DocumentsPDFComplete
Click Here & UpgradeExpanded Features
Unlimited Pages

115
independent of sΨ . The differential response between slurries and soil at field
capacity was attributed to differences in NH +4 concentrations, and indicated
that the effects of sΨ were secondary to NH +4 concentrations in controlling
nitrification rates. Nitrification rates in slurries declined more when a single
salt (K2SO4) was used than when the mixture of salts that more closely
approximated the solute composition predicted to occur in the field was used
to lower sΨ . This suppgests that nitrifying bacteria are capable of adapting to
specific ion toxicities. Gross rates of ammonification declined expontially
with decreased sΨ between o and -500 kPa but were independent of sΨ at
potentials of -500 to -1750 kPa. Rates of microbial assimilation of NO −3
exceeded NH +4 assimilation by a factor of 4, indicating that under NH +
4
limited conditions substantial NO −3 assimilation can occur. Microbial
assimilation of both NH +4 and NO −
3 declined exponentially with
decreased sΨ , and were insignificant at < -1500 kPa sΨ . Because NO −3
assimilation declined more rapidly than gross nitrification, net
nitrification rates actually increased with declining sΨ . Rates of nitrous
oxide (N2O) production were also inversely correlated with sΨ . Our
results indicate that in previous studies, measurement of net rates, use of
inappropriate salts, and addition of substrate may have resulted in over
estimation of the adverse effects of low sΨ on rates of N-transformations.
2.153 A. Rahman Barzegar and co-workers (1997) studied “Organic
Matter, Sodicity, and Clay Type: Influence on Soil Aggregation.”
This study was to examine the role of organic matter in aggregation and
clay dispersion in soils with different levels of sodicity. Prepared soils
with 15% clay (smectitic or illitic) and natural soil aggregates (from a
smectitic clay soil [Pellustert] with 25 g kg-1 organic Carbon C and a
DocumentsPDFComplete
Click Here & UpgradeExpanded Features
Unlimited Pages

116
pair of illitic loams [Rhodoxeralfs] with 15 and 29 g kg-1 organic C)
were equilibrated with solutions having sodium adsorption ratios (SAR)
of 0, 5, 15 and 30. Pea (Pisum sativum L.) straw was added at 50 g kg-1
to the prepared soils, which were then incubated. Changes in
aggregation during incubation were similar irrespective of clay type.
After 7 d incubation with no added straw at SAR 0 and 30, the amounts
of spontaneously dispersible clay were 5.9 and 23.7 g kg-1 soil, and
mechanically dispersible clay was 11.9 and 23.3 g kg-1 soil.
Macroaggregation (> 250 µm) was 125 and 41 g kg-1 soil at SAR 0 and
30. After 67 incubation with pea straw, spontaneously dispersible clay
contents were 2.1 and 5.4 g kg-1, mechanically dispersible clay contents
were 9.0 and 17.7 g kg-1 soil, and macroaggregation was 533 and 416 g
kg-1 soil at SAR 0 and 30. The effects of sodicity and organic matter on
structural stability of the natural soil aggregates were similar to those in
the prepared soils, but macroaggregation was less, and the smectitic
clay soil was more sensitive to sodicity than the illitic loams. This work
showed that organic matter has at least at great a role in aggregation in
sodic soils as in non-sodic soils.
2.154 Jennifer D. Knoepp and Wayn T. Swank (1997) reported a “Forest
Management Effects on Surface Soil Carbon and Nitrogen.” Chanes
in surface soil C and N can result from forest management practices and
may provide an index of impacts on long-term site productivity. Soil C
and N were measured over time for five watersheds in the southern
Appalachians: two aggrading hardwood forests, one south-and one
north-facing, undisturbed since the 1920s; a white pine (Pinus strobus
L.) plantation planted in 1956; and two regenerateing hardwood forests,
a whole-tree harvest in 1980, and a commercial sawlog harvest in 1977.
DocumentsPDFComplete
Click Here & UpgradeExpanded Features
Unlimited Pages

117
soils on harvested watersheds were sampled before and for ≈ 15 yr after
harvest. Surface soil C concentration on the undisturbed watersheds
varied significantly among sample years. Concentrations fluctuated on
the sourth-facing and decreased on the north-facing watershed. The
pattern for total N was similar. Total N decreased significantly on the
north-facing but was stable on the south-facing watershed. In the white
pine plantation, C increased while N concentrations decreased during
the 20-yr period. Soil C and N concentrations generally declined the
first year following whole-tree harvest. Fourteen years after cutting, C
remained stable, while N was greater compared with reference
watershed soils. The commercial sawlog harvest resulted in large
increases in surface soil C and N concentrations immediately after
cutting. Carbon levels remaind elected 17 yr following cutting. Our data
suggest that the forest management practices examined do not result in
long-term decreases in soil C and N.
2.155 Francois Courchesne and George R. Gobran (1997) studied a
“Minerlogical Variations of Bulk and Rhizosphere Soil form a
Norway Spruce Stand.” The mineralogy of clay-sized particles of both
fractions was determined by x-ray diffraction (XRD) and normalized
with respect to quartz (I/IQZ). Amorphous solid phases were estimated
by extracting Fe and Al with acid-ammonium oxalate (Al0, Fe0).
Mineral abundance (I/IQZ) near roots differed consistently form that in
the bulk soil. The rhizosphere contained significantly lower amounts of
amphiboles and expandable phyllosilicates (α = 0.10) relative to the
bulk soil. This trend was paralleled by a systematic increase in Al0 and
fe0 (α = 0.10) at the root-soil interface. Lower amounts of plagioclase
were also seen in the rhizosphere samples from five of the six horizons,
DocumentsPDFComplete
Click Here & UpgradeExpanded Features
Unlimited Pages

118
but the difference from the bulk soil was not significant when all
horizons were integrated in the comparison. No rhizosphere effect was
detected for K-feldspars. This study provides converging results that
emphasize the pedogenic significance of the rhizosphere zone and the
role of roots as dynamic weathering agents.
2.156 Nanda, Mishra and Bhatta (1997) studied “Soil Classification and
Soil and land Suitability for Irrigation in Kuanria Irrigation
Project.” In the culturable command area (CCA) of 200 ha in the head
reach of left main canal of Kuanria irrigation project, Dasapalla, in the
district of Nayaragh, Orissa, four soil series, viz. Sariganda 1 loam
(Udic Ustochrept), Sariganda 2 clay loam (Udic Ustochrept), Neliguda
sandy loam (Typic Haplustalf) and Patharpunja loamy sand (Aquic
Ustifluvent) were identified. Based on fifteen characteristics pertaining
to soil, topography and drainage conditions under subhumid climate the
above soils were classified into four soil and land irrigability sub-
classes. Shallw water table, imperfect drainage, low available water
capacity and milk alkalinity are some of the limiting factors for
sustainable use of irrigation water.
2.157 Lalita M. Arya and co-worker (1998) studied a “FIELD MEASURE-
MENT OF THE SATURATED HYDRAULIC CONDUCTIVITY OF A
MACROPOROUS SOIL WITH UNSTABLE SUBSOIL STRACT-
URE.” A field method for measuring saturated hydraulic conductivity,
Ks, was developed to characterize water flow in highly-weathered soils
of Sitiung, Indonesia. Soil of this area is known to absorb large volumes
of rain-water rapidly. However, Ks data obtained on soil cores do not
corroborate field-observed rapid infiltration rates. In the filed method,
DocumentsPDFComplete
Click Here & UpgradeExpanded Features
Unlimited Pages

119
constant rate irrigation was applied to a field plot, delineated to a depth
of 120 cm, and bordered on the surface to contain a depth of ponded
water. The rate of irrigation was sufficient to maintain the ponding
depth at a constant level as well as cause water to overflow from the
ponded surface. The difference between the steady-state irrigation and
overflow rates was considered to be the instantaneous flux and was
assumed applicable to all depths. Simultaneous tensiometric
measurements of pressure head as a function of depth provided the
hydraulic gradients needed for calculation of Ks using Darcy’s law.
Hydraulic gradients deviated considerably from unity, and soil
saturation did not exceed 92% of porosity. Laboratory-measured Ks
values for the stable structured topsoil agreed well with the field data.
However, those for the subsoil were 2 to 3 orders of magnitude lower
than the field-measured values. The susceptibility of the subsoil to
compaction during core extraction and slaking when in contact with free
water appeared to be responsible for the highly reduced rates of flow in
the laboratory samples. The subsoils pore structure was preserved only
as long as it was overlain by the stable structured topsoil. Results
suggest that measurements of water flow on small soil cores may, in
some cases, be of questionable value. The field method provided
accurate in situ data on plot-size areas. The field plot method used in
this study causes minimal disturbance of the soil while the effects of
sample confinement and overburden are represented fully in the
measurements.
2.158 Bhaskar and Nagaraju (1998) reported a “Characterization of Some
Salt-Affected Soil occurring in the Chitravathi River Basin of
Andhra Pradesh.” The pedological characteristics of some salt-
affected soils occurring in piedmont slopes and in basin floors of
DocumentsPDFComplete
Click Here & UpgradeExpanded Features
Unlimited Pages
120
sedimentary rock formations in Chitravati river basin in Andhra Pradesh
were studied. The soils of piedmont slopes have brown to light gray
matrix with subangular to angular blocky aggregates in B horizon
whereas soils of basin floors have grayish brown to very dark gray
matrix with angular to prismatic structure. The textural change in soils
of piedmont slopes shows high degree of variability in vertical
distribution of sand and silt contents and yielded high sand/ silt ratio.
The high degree of sodicity in these soils is due to presence of sodium
carbonate and bicarbonate and resulted in high pH conditions. The soils
on piedmont slopes are classified as Vertic Ustopepts and Fluventic
Ustropepts and soils on basin floors as Sodic Haplusterts.
2.159 Galbraith and Bryant (1998) studied “A FUNCTIONAL
ANALYSIS OF SOIL TAXONOMY IN RELATION TO EXPERT
SYSTEM TECHNIQUES.” They studied the functional logic and
query processes employed by Soil Taxonomy to identify soil individuals
and compared the methods with those used in other natural object
classification systems. Numerical and classical identification methods
and program features found in recent computer programs were
evaluated for use with Soil Taxonomy. The keys in Soils Taxonomy are
purely phenetic in nature and single-access in approach. In the absence
of rule- and value confidence-weighting factors, the rules must be
encoded without sequence modification to preserve the decision logic.
Decisions in Soil Taxonomy query a large, often incomplete, and
sometimes faulty data set, requiring error-checking of data and the
addition of expert rules to the encoded decisions to prevent indecision.
Soil Taxonomy check within the soil individual for the presence or
absence of spatial and nonspatial differentiae, specific property values,
or other qualifications. Soil Taxonomy is suitable as the subject of an
DocumentsPDFComplete
Click Here & UpgradeExpanded Features
Unlimited Pages

121
object-oriented expert system and planning has begun on development
of an automated prototype for the Histosol, Andisol, Spodosol, and
Oxisol soil orders. Expert system features coupled with additional
models and algorithms can be used to improve the use and user-
friendliness of Soil Taxonomy.
2.160 Banerjee et al. (1998) studied an “Estimation of Soil Salinity at IARI
Farm by Inductive Electro-Magnetic Technique.” The main
advantages of this technique are: rapidity and non-requirement of
sample and sample preparation. IEM investigations were carried out at
the farm of IARI, New Delhi. Results indicated that the bulk soil
electrical conductivity (ECa) values, computed from IEM survey data,
were compared with those measured by the conventional method [EC
(1:2 soil: water ratio)] to understand the feasibility of IEM-meter for
estimating bulk soil EC values. No effects of soil moisture content, clay
content and soil temperature on ECa were observed. Predictive
equations for estimation of bulk soil EC (termed as ECpr) values were
subsequently developed and verified from independent observations.
The predictive equations were found to be quite different from those
reported by Rhoades and others. Finally, the spatial and temporal
variations of ECpr were studied to have the present status of soil salinity
at the IARI farm.
2.161 Dipak Sarkar & Abhijit Haldar (1998) studied “A Comparison of
Different Methods for pH Determination in Soils of West Bengal.”
Soil pH was determined in water 0.01M CaCl2 and 0.1 M KCl at 1:2,
1:2:5 and 1:5 soil: solution ratio and were found to be correlated over a
wide range. The regression equations obtained in fairly large number
soils of West Bengal under certain rigid laboratory conditions were
DocumentsPDFComplete
Click Here & UpgradeExpanded Features
Unlimited Pages

122
similar to those obtained in comparative studies from Britain (Davies
1971). The regression equation obtained for 0.01M CaCl2 versus water
medium was found to be pHCa= 1.05 pHw = 0.77 and is valid strictly
for non-saline, net negatively charged soils. In general, the release of
H+ [cmol (p+) kg-1] ions was linearly related to increased diluation ratio.
Moreover soil/solution-shaking time in excess of few hours is
undesirable as there was fluctuation in pH with time, as stability was not
attained. Reversal in trend of pH-dilution curve was noted at lower soil
solution-dilution ratio if sufficient reaction time was allowed.
2.162 Jogendra Kumar and Room Singh (1998) studied “Phosphorus
Adsorption and Relese Characteristics of Some Soils in Tarai and
Bhabar Regions of Uttar Pradesh.” A plot culture study was
conducted phosphorus adsorption and release characteristics of two soil
each from tarai (Mollosils) and bhabar (Entisols) regions of Uttar
Pradesh. Langmuir constants of P sorption capacity (b) and P affinity
(k) ranged from 110.2 to 142.2 mg kg-1 and 0.43 to 1.31 L mg-1,
*respectively. The cumulative release of P had high level positive
relationship with the supply parameter (r = 0.968***), irrespective of
the level of P. Tarai soils with slightly lower pH, clay content and CEC
than the Bhabar soils, did not differ appreciably in respect of
adsorption, desorption and supply parameter of P, owing to their similar
mineralogical make-up.
2.163 Bhattacharyya et al. (1998) investigated “Soil Formation as
Influenced by Geomorphic Processes in the Brahmaputra Flood
Plains of Assam.” Different geomorphic feature were identified on the
Brahmaputra flood plains. These features such as levees, back swamps,
DocumentsPDFComplete
Click Here & UpgradeExpanded Features
Unlimited Pages

123
meander scroll and oxbow lakes were formed through the depositional
processes of lateral and vertical accretion. Three representative soil
series formed on different geomorphic features are described with
respect to their morphological, physical and chemical properties and
classified taxonomically. Due to continuous shifting of course of the
Brahmaputra river and its tributaries, genetic development in any of the
soil is not conspicuous. Observations also indicated that in the
Brahmaputra valley, the geomorphic processes of erosion and accretion
are more active than pedogenic processes of soil formation.
2.164 Singh and co-workers (1998) studied a “Genesis of Some Soils of
Goa.” Five pedons widely occurring in Goa were studied for their and
classification. Clay/Fe2O3 ratio, degree of hydration and organic carbon
content alone or in combination contributed significantly towards the
expression of soil colour. Higher Al2O3/Fe2O3 at the surface and lower
in the subsurface provided confirmatory evidence of clay translocation.
Clay/Fe2O3 registered similar trend of distribution as indicated by clay
up to the Argillic horizon suggesting their combined movement pH
potential was governed by relative amount of Fe2O3 and SiO2. The soils
from ferruginous quartzite were richest in sesquioxide content followed
by the soils from phyllites and schistose rocks. The silica content
established the reverse trend of distribution as shown by sesquioxide.
These were classified in Ultic Haplustalfs, Ultic Rhodustalfs and Oxic
Dystropepts subgroups.
2.165 Sidhu and co-workers (1998) studied “Elemental and Mineralogical
Composition of Coarse Fractions of Some Soils of Aravallies-
Yamuna River Transect in North-West India.” In general, all the
DocumentsPDFComplete
Click Here & UpgradeExpanded Features
Unlimited Pages

124
elements (except SiO2) increased with decrease in particle size fraction.
The soils are relatively rich in alkali and alkaline earth elements
indicating moderate degree of weathering of their source minerals. The
soils developed on hills and upper piedmont plains are originated from
garnetiferrous mica-schist rich parent materials of Aravallies. The soils
on active flood plain originated from the alluvium of Yamuna are rich
in amphiboles and pyroxene. The soils on lower piedomont plain and on
old flood plain were of intermixed parent materials of two distinct
physiographic setting.
2.166 Singh et al. (1998) studied “Mineralogy of Some Important Soils of
Sona Basin.” In the old alluvial soils representing Dulhingaon, Agiaon,
Kapsandi and Suhiya series (Psammentic/ Udic Haplustalfs and Typic
Haplusterts) which have developed on alluvium derived from the rocks
like granite-gneiss, basalt, quartzite, etc., the clay minerals seem to be
geogenic and pedogenic. The dominance of kaolinite in upland soils of
Dulhingaon series may be due to their acidic and well drained
environment, while illite in the soils of Agiaon series is due to high K
content. Mica and hydrous mica are found to be derived from feldspars.
A portion of kaolinite seems to be inherited from the parent material.
Some of orthoclase feldspars appear to have weathered to kaolinite. The
formation of smectite appears to be under basic environment, impeded
drainage and water logging.
2.167 Kumaraswamy and Co-workers (1998) reported a “Cumulative
Effects of Continuous Cropping and Manuring of Sugarcane on
Organic Matter and NPK Status of the Soil.” Continuous cropping
with different manure-fertilizer schedules for 29 years had no marked
DocumentsPDFComplete
Click Here & UpgradeExpanded Features
Unlimited Pages

125
change on EC and pH of the soil. Organic C content had increased
markedly, particularly in the surface layer soil in the treatments that
received pressmud for every corp of sugarcane. There was no
appreciable build up of N and K in the soil inspite of application of
these nutrients to each crop over the years. There was a significant build
up of P in the soil in treatments receiving, P every years. Available P
status was appreciably higher in treatments receiving pressmud than in
treatments without pressmud.
2.168 Santhy et al. (1998) studied a “Long Term Fertilizer Experiments-
Status of N, P and K Fractions in Soil.” A study was taken up in the
existing Long Term Fertilizer Experiment in Tamil Nadu Agricultural
University, Coimbatore, conducted since 1972 to know the status and
content of various macronutrient fractions and their effects on crop
yield, uptake and nutrient availability in the soil. Exchangeable NH4-N
and NO3-N were significantly increased by incremental additions of N.
Inclusion of FYM along with inorganic fertilizers, had a positive effect
on the build up of all the organic N fractions. There was a build up in
total-P content and it was maximum with 150 per cent NPK
applications. N-alone application drastically reduced the concentration
of available P. The Ca-P constituted the dominant inorganic P form.
Available K revealed a negative balance due to continous with a
decrease of 22 per cent from the initial level. Lattice K constituted a
dominant fraction of K and water soluble K proved to be the deciding
factor in predicting yield variations.
2.169 Walia and co-workers (1998) reported a “Profile Distribution of
Various Forms of Nitrogen and C/N Ratio in Some Landforms of
DocumentsPDFComplete
Click Here & UpgradeExpanded Features
Unlimited Pages

126
Bundelkhand Region of Uttar Pradesh.” Total N was positively
correlated with organic carbon content of soils of different landforms
but did not follow consistent pattern of distribution within the profile in
majority of the soils due to leaching of N and fluvial characteristics.
Mineral N (NH +
4 , NO −
3 ) accounted for 0.6 to 4.2 per cent of total N,
which was dominated by NH4-N and its distribution in the profile varied
with profile characteristics and age of landform. Some soils have nearly
same available N content despite large variations in organic carbon and
total N, which may be attributed to variation in other factors in soils
such as C/N ratio of organic matter, texture, mineralogy and bulk
density which probably brought about similar N mineralization rates. In
alluvial landforms the pattern is not clear but Vertisols containing
smectitic clays showed lowest per cent of available N of its total N in
comparison to soils of other landforms. The C/N ratio of surface soils
varied from 8 to 13.5 and decreased from hills to plains.
2.170 Clough et al. (1998) studied a “Fate of 15N labelled urine on four soil
types.” A field lysimeter experiment was conducted onver a 406 day to
determine the effect of different soil typs on the fate of synthetic urinary
nitrogen (N). Soil types included a sandy loam, silty loam, silty loam,
clay and peat. Synthetic urine was applied at 1000 kg N ha-1, during a
winter season, to inctact soil cores in lysimeters. Leaching losses,
nitrous oxide (N2O) emissions, and plant uptake of N were monitores,
with soil 15N content determined upon destructive sampling of the
lysimeters. Plant uptake of urine-N ranged from 21.6 to 31.4%. Soil
type influenced timing and fomr of inorganic-N leaching. Macropore
flow occurred in the structured silt and clay soils resulting in the
leaching of urea. Ammonium (NH +
4 -N), nitrite (NO −
2 -N) and nitrate
DocumentsPDFComplete
Click Here & UpgradeExpanded Features
Unlimited Pages

127
(NO −
3 -N) all occurred in the leachates with maximum concentrations,
varying with soil type and ranging from 2.3-31.4µg NH +
4 -N mL-1, 2.4-
35.6 µg NO −
2 -N mL-1, and 62-102 µg NO −
3 -N mL-1, respectively.
Leachates from the peat and clay soils contained high concentrations of
NO −
2 -N. Gaseous losses of N2O were low (< 2% of N applied) over a
112 day measurement period. An associated experiment showed the
ratio of N2-N: N2O-N ranged from 6.2 to 33.2. Unrecovered 15N was
presumed to have been lost predominantly as gaseous N2. It is
postulated that the high levels of NO −
2 -N could have contributed to
chemodenitrification mechanisms in the peat soil.
2.171 Laboski (1998) studied a “Soil strength and water content influences
on corn root distribution in a sandy soil.” Since root distribution
influences crop water and nutrient absorption, it is essential to identify
factors limiting root growth. The objective of this study was to
determine the factor(s) limiting corn-rooting depth on an irrigated fine
sand soil. Bulk density, saturated hudraulic conductivity, and soil water
retention were measured on undisturbed soil cores. Corn root
distribution assessed at tasseling over a 3-yr period showed an average
of 94% of total root length within the upper 0.60 m of soil with 85% in
the upper 0.30 m of soil. Mechanical impedance was estimated with a
cone penetrometer on two dates with differing water contents. Cone
penetrometer measurements greater than 3 MPa indicated mechanical
impedance in soil layer extending from 0.15 to 0.35 m deep. Penetration
resistance decreased as soil water content increased. However, soil
water contents greater than field capacity was required to decrease
penetration resistance below the 3 MPa thresholds. Such water saturated
conditions only occurred for short periods immediately after
DocumentsPDFComplete
Click Here & UpgradeExpanded Features
Unlimited Pages

128
precipitation or irrigation events, thus roots usually encountered
restrictive soil strengths. The soils layer from 0.15 to 0.60 m had high
bulk density, 1.57 Mg m-3. This compacted soil layer, with slower
saturated hydraulic conductivities (121 to 138 mm hr-1), held more
water than the soil above or below it and reduced water movement
through the soil profile. Crop water use occurred to a depth of
approximately 0.75 m. In conclusion, a compacted soil layer confined
roots almost entirely to the top 0.60 m of soil because it had high soil
strength and bulk density. The compacted layer, in turn, retained more
water for crop use.
2.172 Pareek and co-worker (1998) studied an “Adsorption /Desorption
Behaviour of Selenium in Alluvial Soils of Punjab.” Laboratory
studied were conducted to investigate the adsorption/ desorption
behaviour in alluvial soils of seleniferous and non-seleniferous regions
of Punjab. Adsorption of Se by different soils from the equilibration
solutions containing 1 to 100 µg mL-1 could be described by Langmuir
and Freundlich equations for the entire range of concentration used in
the study. Adsorption maximum was highest for Barwa soil (460.8 µ g
g-1) from seleniferous region, whereas, binding energy was more for
Gurdaspur soil (0.207 mL g-1) from non-seleniferous region. Significant
positive relationship existed between adsorption maximum and cation
exchange capacity (r = 0.930*) as well as clay (r = 0.986**) content of
soils. The amount of Se desorbed in KCl (water-soluble) was relatively
higher than desorbed in KH2PO4 (exchangeable) in all the soils except
Gurdaspur soil. On an average, water-soluble and exchangeable Se
together constituted 78.7 to 95.6 per cent of total adsorbed Se on all the
soils.
DocumentsPDFComplete
Click Here & UpgradeExpanded Features
Unlimited Pages

129
2.173 Wander, Bidart and Aref (1998) reported a “Tillage Impacts on
Depth Distribution of Total and Particulate Organic Matter in
Three Illinois Soils”. The benefits of no-tillage (NT) particles to soil
matter (SOM) were inconsistent in fine-textured, poorly drained soils.
Tillage impacts on SOM were investigated in central Illinois, assuming
particulate organic matter (POM) would accumulate where SOM
aggraded. Soils were collected in 1994 and 1995 from a trial established
in 1985 at Perry and Monmouth (somewhat poorly drained Aquic
Argiudoll silt loam), and DeKalb (a poorly drained Typic Haplaquoll
silty clay loam). In general, NT practices increased SOM-C and POM-C
contents 25 and 70% compared with conventional till (CT) at the soil
surface (0-5 cm). This was at the expense of C at depth (5-17.5 cm),
which decreased by 4 and 18%, respectively. Tillage effects varied
among sites. No-till increased SOM C and POM C more than 30 and
100%, respectively, in the top 5 cm of the two silt loams. In the silty
clay loam, NT reduced SOM C 14% in the 5- to 17.5-cm depth and
POM C more than 20% in the 5- to 30-cm depth. Bulk density was
greater under NT than CT at the DeKalb (0-17.5 cm) and Monmouth
sites (0-5 cm). No-till only increased C and N sequestration, assessed on
an equivalent mass basis, at Monmouth. Accumulation of POM in the
surface depth of the NT silt loams may have improved soil quality in
those erosion-prone soils. Reduced POM contents in the NT silt clay
loam reflect SOM degradation. The high clay and organic matter
content and low bulk density of the DeKalb soil may have contributed
to the atypical effect of NT practices on SOM at that site.
2.174 Shang and Tiessen (1998) studied “Organic Matter Stabilization in
Two Semiarid Tropical Soils: Size, Density and Magnetic
Separations.” Soil organic matter (SOM) in many tropical soils is less
DocumentsPDFComplete
Click Here & UpgradeExpanded Features
Unlimited Pages

130
stable than that of temperate soils, in part due to faster decomposition
processes in the tropics, but possibly also due to different mechanisms
of organomineral stabilization. We studied the mineral associations of
SOM in the surface horizons of two semiarid tropical soils (an Oxisol
and an Alfisol) using particle-size, density, and magnetic separations.
The inorganic phases of fractionated materials were examined using
chemical extraction and x-ray diffraction. Organic matter associated
with the sand fraction accounted for 21 to 30% of soil C, mostly as
coarse, floating material. This coarse material was more abundant in the
Alfisol. One-half the organic C of both soils was associated with the
silt-sized fraction, which contained a substantial portion of micro-
aggregates resistant to sonication. Carbon in silt-sized aggregates was
mainly stabilized by association with poorly crystalline oxides and by
aggregation with crystalline oxides and clays. The C as light matter
(<1.8 g cm-3) liberated from silt-size micro aggregates by successive
sonication treatments accounted for ≈ 23% of total soil C for both soils.
The SOM in the < 1.8 g cm-3 fraction seemed younger and less
decomposed than the organic materials in the temperate soil fractions
with similar density and equivalent sizes. In clays, C was concentrated
in fractions of intermediate magnetic susceptibility, whereas both the
highly magnetic fraction of predominantly well-crystallized Fe and the
nonmagnetic fraction were C poor. The study points to the important
role of particle size and crystallinity of Fe oxides and micro aggregation
between oxides, organic matter, and other minerals in stabilizing
tropical soil organic matter.
2.175 McCarty et al. (1998) studied “Short-term Changes in Soil Carbon
and Nitrogen Pools during Tillage Management Transition.” It is
well established that distribution of organic C and N within a soil
DocumentsPDFComplete
Click Here & UpgradeExpanded Features
Unlimited Pages

131
profile is substantially influenced by long-term conversion of soil from
plow-tillage management, but little is known about the short-term
changes in the character of soil organic matter during transition between
these two soil management systems. To characterize the changes in
composition of organic C and N pools in soil during tillage transition,
we measured total N, organic C, active N, biomass N, and biomass C at
depth intervals of 0 to 2.5, 2.5 to 5, 5 to 12.5, and 12.5 to 20 cm within
the profile of soil during the first 3 yr in the transition from plow tillage
to no tillage. The results obtained showed that transformation of a soil
profile from that typical of plow tillage management to one
characteristic of no tillage occurred rapidly within a 3-yr period of
transition. In this time period, stratification of organic matter in the
profile progressed significantly toward that which occurs after 20 yr of
no-tillage treatment. For example, substantial increases in total N
(30%), organic C (38%), biomass N (87%), and biomass C (33%) were
detected in the top layer of no-tillage soil along with corresponding
decreases of 6%, 7%, 35%, and 15% of those respective components in
the bottom layer. With transition, the biomass C, biomass N, and active
N pools increased more rapidly in the upper soil profile than did the
total pools of C and N. Although the characteristic profile of no-tillage
soil developed quickly during tillage transition, evidence was equivocal
for any significant increase in organic matter content within the first 3-
yr after conversion to no-tillage management.
2.176 Drury et al. (1998) studied a “Long-Term Effects of Fertilization and
Rotation on Denitrification and Soil Carbon.” This laboratory study
explored the effect of long-term (35 yr) fertilization and crop rotation on
soil organic C and denitrification capacity at different depths of a
Brookston clay loam soil (fine-loamy, mixed, mesic Typic Argiaquoll).
DocumentsPDFComplete
Click Here & UpgradeExpanded Features
Unlimited Pages

132
We related denitrification capacity to soil biochemical (CO2 production,
organic C, microbial biomass C, soluble organic C) and soil structural
properties. Denitrification capacity was determined as the increase in
N2O that occurred when NO −
3 -amended soils were incubated
anaerobically in the presence of acetylene. Treatments included
fertilized and nonfertilized plots of continuous corn (Zea mays L.),
continuous bluegrass (Poa pratensis L.), and rotation corn (corn-oat
[Avena sativa L.]-alfalfa [Medicago sativa L.]-alfalfa). Soils from an
adjacent mixed deciduous woodlot were also sampled. Soils from the
woodlot had higher denitrification capacities than the continuous or
rotation corn treatments. Among the agricultural treatments, the soil
under bluegrass had the greatest denitrification capacity followed by the
soil under corn rotation, with the continuous corn having the lowest
capacity. Long-term fertilization resulted in 35% higher denitrification
capacity and 65% higher CO2 production than nonfertilized soils.
Denitrification capacity across all depths in the agricultural soils was
correlated with CO2 production (r2= 0.76), microbial biomass C (r2 =
0.60), and organic C (r2 = 0.54); however, the relationship between
denitrification capacity and soil structure was not as strong (r2 = 0.28).
2.177 Page-Dumroese et al. (1999) studied a “Comparison of Methods for
Determining Bulk Densities of Rocky Forest Soils.” Measurement of
forest soil bulk density is often hampered by coarse fragments. In this
study, five methods to determine total and fine bulk density and coarse-
fragment content of a rocky forest soil in western Montana were
evaluated. Two methods of core sampling (small and large diameter
cylinders), two methods of soil excavation and volume determination
(water and polyurethane foam), and a nuclear source moisture gauge
DocumentsPDFComplete
Click Here & UpgradeExpanded Features
Unlimited Pages

133
were tested at two depths (0-10 cm and 10-20 cm) on a soil with a 35%
slope and 45% rock content. In the surface 10 cm, total and fine soil
bulk density values were greatest from the nuclear gauge. The two
excavation techniques gave similar results. Volumetric rock-fragment
content calculations using the small diameter cylinder were significantly
lower than those using the other methods. At the 10- to 20-cm depth, all
methods except the large diameter cylinder gave comparable results for
total soil bulk density. The small diameter core method gave the highest
estimate of fine bulk density at this depth.
2.178 Johannisson and co-worker (1999) studied “Retention of Nitrogen
by a Nitrogen-Loaded Scotch Pine Forest.” The studied N retention
in a Scotch pine (Pinus sylvestris L.) forest that had received two
decades of annual additions of N as NH4NO3 at four rates (N0-N3,
equivalent to 0, 36, 72 and 108 kg N ha-1 yr-1), with and without
supplementary additions of P and K. The highest N treatment (N3) was
suspended three years before this study. Leaching of inorganic N was
measured beneath lysimeters with and without living tree roots inside
them, and the fate of 15N injected into the more layer was traced by
sampling understory vegetation, soil to 20-cm depth, and leachates.
Leaching of inorganic N increased with increasing N dose and was
dominated by NO −
3 on plots to which N had been added. In the
suspended N3 treatment, leaching of N was lower than in the N2
treatment. The presence of tree roots greatly reduced leaching of N. The
occurrence of labelled NO3 under lysimeters to which labelled NH +
4 had
been added showed that nitrification was important n treatment N2, but
not in NI, suggesting that additions of > 30 kg N ha-1 yr-1 are needed to
induce larger net nitrification at this site. Our data showed (i) that trees
DocumentsPDFComplete
Click Here & UpgradeExpanded Features
Unlimited Pages

134
were an important sink for N, (ii) that additions of P and K had a
marginal positive effect on N retention, and (iii) that leaching from
previously N-loaded forest rapidly decreased when the N load was
removed.
2.179 Kodesová et al. (1999) studied the “ESTIMATION OF SOIL
HYDRAULIC PROPERTIES WITH THE CONE PERMEAMETER:
FIELD STUDIES.” The cone permeameter was designed to inject water
into the soil under known pressure. The cumulative inflow volume and
pressure heads measured with tensiometer rings at two locations above
the water source are recorded in time. The observed data sets are
analyzed using an inverse modeling method to predict the soil hydraulic
properties. The device was field tested for the first time in two types of
sandy soil. Tests were always conducted with two sequentially applied
pressure heads of different magnitudes for different experimental runs.
After the water source was shut off, tensiometer measurements were
continued to monitor the redistribution of water in the soil. To study the
impact of one on two steps of applied pressure head on estimates of
wetting soil hydraulic properties, we carried out numerical inversions
for data from the injection (wetting) part of experiment, first with only
one supply pressure head and then with two supply pressure heads. For
selected tests we analyzed data from the entire experiment to investigate
hysteresis of the soil hydraulic properties. The resulting soil hydraulic
properties correspond well with those obtained with standard
techniques.
2.180 Baoshan Xing and Zhengqi Chen (1999) studied “SPECTROSCOPIC
EVIDENCE FOR CONDENSED DOMAINS IN SOIL ORGANIC
DocumentsPDFComplete
Click Here & UpgradeExpanded Features
Unlimited Pages

135
MATTER.” This paper was to provide some spectroscopic evidence of
condensed domains in SOM. Six humic acids (HA) extracted from
different depths of a single soil profile were analyzed using X-ray
diffraction (XRD) and solid-state 13C nuclear magnetic resonance
(NMR) with cross-polarization (CP) and magic angle spinning (MAS)
techniques. The XRD results showed a strong peak at 0.35 nm for the
condensed aromatic structure of the HA from mineral horizons and a
dominant peak at 0.43 nm for less tightly packed side chains of the HA
from surface organic horizons. The 13C CP/MAS NMR results indicated
further that HA becomes more aromatic from surface organic to mineral
horizons. This increase of aromatic structure in HA was confirmed by
the increase of nonprotonated carbon signals at 130 ppm using a
dipolar-dephasing technique and by the increase of atomic C/H and C/O
ratios. These spectroscopic and elemental data corroborate further the
dual-mode model for the sorption of HOC in SOM.
2.181 Robert D. Hall (1999) studied “A COMPARISON OF SURFACE SOILS
AND BURIED SOILS: FACTORS OF SOIL DEVELOPMENT.” There
are at least as many soils (really types of soil) in the Sangamon Soil
(used here in a stratigraphic sense) as there are in the complex of
surface soils on today’s landscape. The Sangamon Soil soils formed in
parent material similar to the parent material of the surface soils, and the
variation in soil drainage was probably similar too. In buried soils, soil
drainage is inferred from color and from interpretations of the positions
of the buried soils on the paleolandscape. The sedimentological
properties of the parent materials aid greatly in the interpretation of
paleolandscapes.
DocumentsPDFComplete
Click Here & UpgradeExpanded Features
Unlimited Pages

136
By placing all soils in four drainage classes and comparing soil
characteristics within and between classes, and by paying attention to
parent material variations and the possibly different times of
development of soils, differences in soil drainage and parent material
seem to be more important in explaining differences in soil
characteristics within the buried soils than within the surface soils. The
buried soils have characteristics that indicate more extensive
pedogenesis than the surface soils. This difference is believed to be a
reflection of the duration of pedogenesis, with the buried soils having a
longer formation period by a factor of about 4.5.
2.182 J.M. Arocena and P. Sanborn (1999) studied a “Mineralogy and
genesis of selected soils and their implications for forest
management in central and northeastern British Columbia.” The
sampled of nine pedons developed on till (Bobtail, Lucille Mountain,
Skulow Lake, Log Lake, Topley, and Kiskatinaw), glaciofluvial
(Bowron), and glaciolacustrine (Aleza Lake 1, 2) deposits. The Skulow
Lake pedon is distinctive in the occurrence of talc, while the Lucille
Mountain pedon has the only clay fraction in which kaolinite is absent.
Other pedons on till contain mica, kaolinite, chlorite, smectite, and
vermiculite. The Bowron pedon has mica, kalinite, and chlorite, while
the Aleza lake pedons have mica, kaolinite, chlorite, and 2:1 expanding
minerals. In pedons with low amount of 2:1 expanding clays in the C
horizon, mica and chlorite appear to degrade into 2:1 expanding clays,
while in pedons with C horizons containing 2:1 expanding clays, mica
and chlorite seem stable and the formation of hydroxyl-interlayered
clays in the predominant process. Podzolization and lessivage are major
pedogenic processes, while redoximorphic processes are observed in
DocumentsPDFComplete
Click Here & UpgradeExpanded Features
Unlimited Pages

137
some pedons with illuvial Bt horizons. Significant soil compaction
hazards are presented by the medium and fine soil surface texture.
Although clay-rich Bt horizons may benefit soil nutrient regimes,
conservation of nutrient-rich forest floors is important, given the low S
contents in mineral soils. High contents of feldspars in these soils
provide a large reserve of nutrients such as Ca and K.
2.183 Pennock et al. (1999) studied “Effects of soil redistribution on Soil
properties in a cultivated Solonetzic-Chernozemic landscape of
southwestern Saskatchewan.” Their research site in southwestern
Saskatchewan a clear landscape-scale pattern of soil distribution
occurred. Regosolic and thin Chernozemic soils were associated with
the long, gentle (2-5%) slopes and solonetzic – Influenced soil were
associated with higher catchment area foot slope and depressional
positions. High rates of soil loss occurred throughout the landscape-
overall a net soil loss of 31 Mg ha yr-1 was calculated using 137Cs
redistribution techniques. No net depositional sites were observed in the
45 sampling points in the landscape, suggesting that the site was
dominated by wind erosion. The high rates of loss were consistent with
very low levels of soil organic carbon storage (37 to 46 Mg ha-1 to 45
cm) at all slope positions in the landscape and with the occurrence of
sub-soil features in the plough layer. The Solonetzic-influenced soils
occupy 38% of the site and have high sodium adsorption ratios (from 18
to 38 in the B horizon) and high soil resistance values as determined
with a penetrometer. For the Solonetz and Solodized Solonetz soils
these growth-limiting properties occur immediately below the 10-cm
plough layer and many constitute a largely irreversible decrease in their
productive capacity.
DocumentsPDFComplete
Click Here & UpgradeExpanded Features
Unlimited Pages

138
2.184 Sun and co-worker (1999) investigated “The effect of soil electrical
conductivity on moisture determination using time-domain
reflectometry in sandy soil.” A series of laboratory experiments was
conducted, in order to systematically explore the effect of soil electrical
conductivity on soil moisture determination using time domain
reflectometry (TDR). A Moisture Point MP-917 soil moisture
instrument (E.S.I. Environmental Sensors Inc., Victoria, BC, Canada)
was used to measure propagation time (time delay) of a step function
along a probe imbedded in fine sand with different moisture and
salinity. The volumetric soil water content was independently
determined using a balance. With the help of the diode-switching
technique, MP-917 could detect the reflection from the end of the probe
as the electrical conductivity of saturated soil extract (ECe) increased to
15.29 dS m-1. However, the relationship between volumetric soil water
content and propagation time expressed as T/Tair (the ratio of
propagation time in soil to that in air over the same distance) deviated
from a linear relationship as the conductivity exceeded 3.72 dS m-1. At
the same water content, the time delay in a saline soil was longer than
that in a non-saline soil. This leads to an over-estimation of volumetric
soil water content when the linear calibration was applied. A
logarithmic relationship between volumetric soil water content and
T/Tair has been developed and this relation includes soil electrical
conductivity as a parameter. With this new calibration, it is possible to
precisely determine the volumetric water content of highly saline soil
using TDR.
2.185 Amponsah et al. (1999) investigated “Soil sampling size estimates for
soils under teak (Tectona grandis Linn. F) plantations and natural
forests in Ashanti Region, Ghana.” Site selected for this study were in
DocumentsPDFComplete
Click Here & UpgradeExpanded Features
Unlimited Pages

139
the moist semideciduous forest zone and had nearly identical
physiographic characteristic. A simple random sampling procedure was
used to obtain soil samples at each site. In each of three natural forest
stands and three teak plantation, 16 soil pits were examined and soil
samples from the 0- to 20-cm (major rooting depth) and 20- to 40-cm
depths were analysed for selected chemical and physical properties. In
the 0- to 20-cm depth, coefficients of variation varied from 8% (pH) to
72% (available P), and in the 20- to 40-cm depth from 16% (pH) to
116% (available P) under teak plantations. Similarly, in the 0- t0 20-cm
depth coefficients of variation varied from 11% (pH) to 40%
(exchangeable K) and in the 20- to 40-cm depth from 10% (bulk
density) to 86% (available P) under natural forests. Under both cover
types, more samples were required to estimate means at ± 10%
allowable error with a confidence level of 95% for chemical properties
than for physical properties.
2.186 Rodney Bennett et al. (1999) studied a “Salinity and sodicity of
irrigated Solonetzic and Chernozemic soils in east-central Alberta.”
Two of the study sites consisted mainly of soils classified as Solodized
Solnetz, with at least 70% in the Solonetzic order. Two chernozemic
sites were almost exclusively Chernozemic soils. A significant increase
in soil salinity occurred in the A horizon at one solonetzic site and at
both chernozemic sites and in the B horizon of one chernozemic sites.
Mean electrical conductivity (ECe) in these horizons for all irrigation
treatments was less than or equal to 1dS m-1. Soil sodicity also increased
significantly in the A horizon at one solonetzic site, and in the A and B
horizons of both chernozemic sites. The mean sodium adsorption ratio
(SAR) of the A horizon at this solonetzic site was 2.9, 4.8, 4.4 and 5.0
for the control, low, medium and high irrigation treatments,
DocumentsPDFComplete
Click Here & UpgradeExpanded Features
Unlimited Pages

140
respectively. The SAR in the A horizon at the chernozemic sites was
less than 2.6 for all the irrigation treatments. Increases in soil salinity
and sodicity were attributed to the chemistry and amount of irrigation
water used at each site. Salinization and sodification in addition to the
changes associated with the quality and quantity of irrigation water
were not evident at any of the sites. The two-cut yield of alfalfa from
the solonetzic sites in the third year of growth was about 25% less than
from the chernozemic sites and was below the acceptable yield range
for irrigated alfalfa in southern Alberta. Our results confirm existing
land classification standards in Alberta that exclude solonetzic
landscapes from irrigation development where more than about 30% of
the soils have an SAR value greater than 12 in any soil horizon within
1 m of the surface.
2.187 Elberling and Jakobsen (1999) studied a “Soil solution pH
measurements using in-line chambers with tension lysimeters.” The
in-line method was designed to eliminate atmospheric contact with soil
solutions prior to pH measurements. The time-dependent pH error was
quantified based on laboratory experiments with soil solution under
controlled temperatures and CO2 partial pressures. Equilibrium
speciation modelling was used to predict pH values observed in the field
and in the laboratory and the model was found to reproduce the
observations well. We conclude that traditional pH measurements on
extracted soil solutions in the pH range from 5 to 7 are not appropriate
for detailed pH measurements due to errors associated with CO2
degassing. In-line measurements provide more accurate measurement
necessary for detailed studies on soil acidification dynamics.
DocumentsPDFComplete
Click Here & UpgradeExpanded Features
Unlimited Pages

141
2.188 Oorts and co-worker (2004) studied “A New Method for the
Simultaneous Measurement of pH-Dependent Cation Exchange
Capacity and pH Buffering Capacity.” The pH dependent cation
exchange capacity (CEC) and pH buffering capacity (pH BC) are two
crucial properties in soil fertility management of variable charge soils.
However, they are rarely measured, since most of the existing methods
are cumbersome and time-consuming. We propose a new method, based
on the silver-thiourea (AgTU) method, for the simultaneous
measurement of pH dependent CEC and the pH BC. In general, this
method consists of first increasing the pH of the soil to about pH 7 and
then gradually acidifying the soil by titrating with HNO3, while
measuring pH and CEC after each equilibration. This way, both CEC at
different pH values and the pH BC are measured on the same sample,
without the multiple washing steps needed in other procedures. Various
aspects of the proposed method were tested and the results obtained
were compared with the ion adsorption method. The modified AgTU
method obtains field relevant results and is suitable for the routine
analysis of large numbers of samples.
2.189 Ghose and Kothandaraman (1999) determined a “COMPARISON OF
METHODS FOR DETERMINATION OF ORGANIC PHOSPHORUS
IN SOILS OF TAMIL NADU.” Organic phosphorus content of soils was
estimated by three different methods viz., alkali extraction (Mehta et al.,
1954); resin acetyl acetone method (Hong and Yammne, 1980) and
ignition method (Saunders and Williams, 1955). The extractability
power of different methods as judged by ‘t’ test indicated the superiority
of alkali extraction compared to other two aforesaid methods
irrespective of variation in organic-C status. The extraction use
efficiency of alkali method was comparable to resin acetyl acetone
DocumentsPDFComplete
Click Here & UpgradeExpanded Features
Unlimited Pages

142
method and superior to ignition method under acidic pH range, while it
was found to be the best in neutral and alkaline soil samples.
2.190 Hussain, Olson and Ebelhar (1999) was determined “Long-Term
Tillage Effects on Soil Chemical Properties and Organic Matter
Fraction.” Change in frequency and intensity of tillage practices alters
the soil properties, distribution of nutrients, and soil organic matter in
the soil profile. We hypothesized that 8 yr of no-till (NT), chisel plow
(CP), and moldboard plow (MP) treatments would affect chemical
properties and organic matter of eroded soil. The corn (Zea mays L.)-
soybean [Glycine max (L.) Merr.] rotation study was established in tall
fescue (Festuca arundinacea L.) sod on a previously eroded,
moderately well-drained, Grantsburg (Fine-silty, mixed, mesic
Oxyaquic Fragiudalf) soil in southern Illinois. In the eight year, soil pH,
exchangeable Ca, and Bray P-1 were greater in NT than in CP and MP
in the 0- to 5-cm soil depth. In the 0- to 5-cm soil depth, exchangeable
K and Mg were greater with the CP than with the NT and MP. In the 5-
to 15-cm soil depth, exchangeable Ca and Mg were greater in the MP
and CP than in NT, due to mixing. Soil pH and P were greater for CP
than MP and NT in the 5- to 15-cm layer. Exchangeable K in the 5- to
15-cm soil depth was greater in the MP than CP and NT. In the 0- to 5-
cm soil depth, NT, CP, and MP had 38, 35, and 31% of their total C as
particulate organic matter (POM), respectively. After 8 yr, CP and MP
had less total organic C than NT in the 0- to 5-cm depth. In the 0- to 5-
cm soil depth, CP and MP had less POM C than NT. The greater
reduction of organic C in the POM fraction than in whole soil showed
that POM was the most tillage-sensitive fraction of organic matter.
After 8 yr of study, the water-stable aggregates in the 0- to 5-cm soil
depth of MP and CP was reduced compared with NT. The effects of
DocumentsPDFComplete
Click Here & UpgradeExpanded Features
Unlimited Pages

143
tillage treatment and associated soil erosion either resulted in different
findings from tillage treatments on uneroded soil or affected the trend
and magnitude of the soil property differences between treatments. For
the 10-yr period prior to the establishment of the tillage experiment the
site was managed as hayland. At the end of 8 yr, the NT maintained or
improved nutrient retention and aggregate stability in the 0- to 5- cm
layer compared with MP and CP.
2.191 Puri, Jaipurkar and Bajpai (1999) studied a “INFLUENCE OF
SOIL FERTILITY STATUS AND APPLICATION OF PRIMARY
NUTRIENTS (NPK) ON CHEMICAL COMPOSITION AND OIL
CONTENT OF MUSTARD (Brassica Juncea Linn.), GROWN IN
VERTISOLS”. Significant influence of varying degree of soil fertility
status on nutrient concentration (N and P) and oil content in seed was
noted. Relative mean concentrations of major nutrients (%) were in the
following order: N(2.1) > K(0.76) > P(0.62) > Ca (0.566) > Mg(0.225)
> S(0.218). The removal of major nutrients was significantly affected
by fertilization. The N and P contents in seed, total removal of nutrients
(N, P, K), seed yield and oil content were significantly affected by level
of fertilisation (N, P, K). The highest seed yield (16.8 kg ha-1) and oil
content (39.72%) were noted in the treatment 100:40: 20 kg N, P, K
ha-1. Significant negative correlation coefficient of oil content with
protein content (r = -0.2663*), with yield (r = 0.4292), seed S content (r
= 0.3242*) and seed Mg content (r = 0.2732*) were obtained.
2.192 J. Ingwersen et al. (1999) studied a “Barometric Process Separation:
New Method for Quantifying Nitrification, Denitrification, and
Nitrous Oxide Sources in Soils.” A method (Barometric Process,
DocumentsPDFComplete
Click Here & UpgradeExpanded Features
Unlimited Pages

144
BaPS) was developed for the quantification of gross nitrification rates
and denitrification rates in oxic soil using intact soil cores incubated in
an isothermal gas tight system. Gross nitrifications rates and
denitrification rates are derived from measurements of changes (i) in air
pressure within the closed system, which are primarily the result of the
activities of nitrification (pressure decrease), denitrification (pressure
increase), and respiration (pressure neutral), and (ii) of O2 and CO2
concentrations in the system. Besides these biological processes, the
contribution of physicochemical dissolution of produced CO2 in soil
water to the pressure changes observed is to be considered. The method
allows collection of additional information about the contribution of
nitrification and denitrification to N2O emission from soil, provided
simultaneous measurements of N2O emission are performed.
Furthermore, BaPs can be used to quantify the percentage of N2O lost
from nitrification. The advantage of BaPS is that disturbance of the soil
system is minimized compared with other methods such as the use of
gaseous inhibitors (e.g. acetylene) or application of 15N compounds to
the soil. We present the theoretical considerations of BaPS, results for
nitrification rates, denitrification rates, and identification of soil N2O
sources in a well-aerated coniferous forest soil using BaPS. The
suitability of BaPS as a method for determination of gross nitrification
is demonstrated by validation experiments using the 15N-pool dilution
technique.
2.193 C. Wayne Honeycutt (1999) studied a “Nitrogen Mineralization from
Soil Organic Matter and Crop Residues: Field Validation of
Laboratory Predictions.” This study was conducted to assess the
utility of microplot cylinders with mixed-bed exchange resins for
DocumentsPDFComplete
Click Here & UpgradeExpanded Features
Unlimited Pages

145
monitoring field N mineralization, to compare laboratory predictions
with field measurements of N mineralization, and to determine the
impact of using ground (≤ 1 mm) crop residues in the laboratory to
predict N mineralization of unground (≤ 25 mm) residues in the field.
Nitrogen mineralization from soil organic matter and hairy vetch (Vicia
villosa Roth) residues was followed in the laboratory at 15, 20, and 250C with 0, 2150, 4300, and 6450 kg vetch ha-1 equivalent loading rates
of ≤ 1 mm particle-size residue. Ground and unground residues were
added to microplot cylinders at loading rates equivalent to 0, 4028, and
5010 kg vetch ha-1 and installed in potato (Solanum tuberosum L.
Norwis) crop rows in two growing seasons. Nitrogen mineralization
from soil organic matter under field conditions was overestimated by
laboratory predictions; however, field measurements of N
mineralization from both ground and unground vetch residues were
closely predicted by a complementary laboratory study. These data
indicate vetch residue N mineralization under these modified field
conditions (i.e., microplot cylinders) can be predicted from laboratory
studies that use ground residues, constant temperatures, and variable
residue quantities. This finding may advance our ability to model and
account for residue N mineralization when developing N management
recommendations.
2.194 Roger E. Smith (1999) investigated a “TECHNICAL NOTE: RAPID
MEASUREMENT OF SOIL SORPTIVITY.” A simple and fast
method is described for measuring surface soil sorptivity, S. Rather than
measure the progress of infiltration flux for a long initial period, the
cumulative infiltration is measured in the early stage in which the
gravity effect is negligible. The theory behind the method is sound and
DocumentsPDFComplete
Click Here & UpgradeExpanded Features
Unlimited Pages

146
simple, and measurements may be taken in only a few minutes using a
small single ring. It is applicable to find S for both ponded and flux
surface boundary conditions.
2.195 Schwarz et al. (1999) investigated a “Heavy Metal Release from Soils
in Batch pHstat Experiments.” In Sovakia H+ input soils is increasing
because alkaline dust emissions have been reduced since 1990. Our
objectives were to examine (i) the metal release in H+ buffer reactions
of Slovak soils and (ii) the impact of the proton buffering on heavy
metal partitioning. We used 10 soils (pH 7.4 − 3.6) in a batch pHstat
experiment. Released ions were adsorbed to an ion-exchange resin,
while pH was kept constant. After reaction times of 10 min, 30 min, 1,
2, 4, 24, 48, and 96 h, soil and ion-exchange resin were separated and
ions were extracted from the resin. After o, 4, and 96 h, we determined
metal concentration in seven fractions. On average, the total release
after 96 h (in percentage of the total concentration) decreased in the
order: Cd (74) > Pb (59) > Cu (29) > Zn (22) > Ni (17) > Cr (3.1), while
the initial release rate into solution decreased in the order: Cd >Zn > Ni
> Cu > Pb > Cr. After 48h, only the Cr release rate was lower than that
of Cd. Particularly in less acid soils, Pb, Cu, Zn and Cd released by the
dissolution of oxides were adsorbed onto the soil matrix, explaining the
slower decrease of the Pb and Cu release rates. The percentages of
weakly bound heavy metals decreased more markedly during the
titration than those of metals bound to Fe oxides. Increased H+ inputs
into Slovak soils will cause enhanced metal release into soil solution.
2.196 Poudel and West (1999) investigated a “Soil Development and
Fertility Characteristics of a Volcanic Slope in Mindanao, the
DocumentsPDFComplete
Click Here & UpgradeExpanded Features
Unlimited Pages

147
Philippines.” Thirteen pedons representing the mountains, the upper
footslopes, the lower footslopes, and the alluvial terraces of a volcanic
slope in Mindanao, the Philippines were studied to understand
relationships between the degree of soil development and fertility
characteristics. Soils in the upper and the lower footslopes were Oxisols
as were soils in the alluvial terraces, while those in the mountains were
Ultisols and Inceptisols. Presence of “amorphous components”, such as
allophone and imogolite, in all the pedons studied was indicates by a >
9.4 soil pH in NaF. Halloysite, gibbsite, goethite, hematite, and
cristoballite were more common minerals in the clay fraction. Surface
layers of all the pedons were slightly acidic and pH increased by depth.
Phosphate sorption maxima ranged from 6944 to 14208 µg P g-1, and it
was closely associated with oxalate-extractable Al (Al0) and clay
content. Inceptisols had higher phosphate sorption maxima than
Oxisols. Soil samples representing the mountains showed the lowest
level of both the available K and the potential buffering capacity for K
(PBCK), while the upper footslopes had the highest level of available K.
The PBCK values were lower for Inceptisols than for Oxisols, and they
were found to be positively correlated with soil pH. There was a large
difference between the cation-exchange capacity (CEC) and the
effective cation-exchange capacity (ECEC), an indication of a large pH-
dependent charge. Mountain soils showed lower base saturation than
soils representing the upper footslopes, the lower footslopes, and the
alluvial terraces.
2.197 Mahiev et al. (1999) studied a “Statistical Analysis of Published
Carbon-13 CPMAS NMR Spectra of Soil Organic Matter.” They
have collected solid-state 13C nuclear magnetic resonance (NMR) data
from the published literature (76 papers) and from our own results on
DocumentsPDFComplete
Click Here & UpgradeExpanded Features
Unlimited Pages

148
311 whole soils, physical fractions (25 clay-, 43 silt-, and 52 sand-size
fractions) and chemical extracts (208 humic and 66 fulvic acids). Our
purpose was to see whether a comprehensive analysis of data on >300
soils that ranged in organic C content from 0.42 to 53.9% would show
any universal influence of management practice on the chemical
composition of soil organic matter (SOM). The relative abundance of
functional groups was calculated for the following chemical shift
regions: 0-50 ppm (alkyls), 50-110 ppm (O-alkyls), 110-160 ppm
(aromatics), and 160-200 ppm (carbonyls). There was a remarkable
similarity between all soils with respect to the distribution of different
forms of C despite the wide range of land use (arable, grassland,
uncultivated, forest), climate (from tropical rainforest to tundra),
cropping practice, fertilizer or manure application, and the different
spectrometer characteristics and experimental conditions used.
Functional groups in whole soils were always in the same abundance
order despite the generally wide proportion range: O-alkyls (a mean of
45% of the spectrum, increasing with C content), followed by alkyls
(mean 25%), aromatics (mean 20%), and finally carbonyls (mean 10%,
decreasing with soil C content). Humic and fulvic acids contained much
smaller proportions of O-alkyls than whole soils (means of 26%). Clay-
size fractions were the most different from whole soils, being more
aliphatic (+8%). Sand-size fractions generally gave very similar results
to whole soils.
2.198 Page-Dumroese et al. (1999) reported a “Comparison of Methods for
Determining Bulk Densities of Rocky Forest Soils.” In this study,
five methods to determine total and fine bulk density and coarse-
fragment content of a rocky forest soil in western Montana were
evaluated. Two methods of core sampling (small and large diameter
DocumentsPDFComplete
Click Here & UpgradeExpanded Features
Unlimited Pages

149
cylinders), two methods of soil excavation and volume determination
(water and polyurethane foam), and a nuclear source moisture gauge
were tested at two depths (0-10 cm and 10-20 cm) on a soil with a 35%
slope and 45% rock content. In the surface 10 cm, total and fine soil
bulk density values were greatest form the nuclear gauge. The two
excavation techniques gave similar results. Volumetric rock-fragment
content calculations using the small diameter cylinder were significantly
lower than those using the other methods. At the 10- to 20-cm depth, all
methods except the large diameter cylinder gave comparable results for
total soil bulk density. The small diameter core method gave the highest
estimate of fine bulk density at this depth. All methods are easy to use.
Soil excavation using the polyurethane foam for volume determinations
is the simplest method and has low standard errors.
2.199 Bouma, Droogers and Peters (1999) were “Defining the ‘Ideal’ Soil
Structure in Surface Soil of a Typic Fluvaquent in the
Natherlands.” This paper explores a proactive approach in which
measurement of basic soil characteristics on a series of standardized
structure samples and exploratory simulation modeling are used to
define an “ideal” structure, using plant growth and nutrient-use
efficiency as indicators. Management practices to realize such an
“ideal” structure remain to be designed by others. Quantitative
indicators for the “ideal” structure in the 0- to 30-cm surface soil of a
loamy, mixed, mesic Typic Fluvaquent (a prime agricultural soil in the
Netherlands) were based on simulated yields and associated nitrate
leaching. Simulations considered water supply capacity, occurrence of
bypass flow and internal catchment, loeaching of nitrates as a function
of fertilization scenarios, accessibility of water to roots, and
trafficability in spring. Exploratory simulations, using a validated model
DocumentsPDFComplete
Click Here & UpgradeExpanded Features
Unlimited Pages

150
for a period of 30 yr to express temporal variability for a complete soil
profile with varying topsoil structures, showed a structure consisting of
0.5-cm aggregates and a bulk density of 1.6 g cm-3 to be “ideal” for the
agricultural land use being considered.
2.200 Seybold et al. (1999) was studied “Soil Resilience a fundamental
component of Soil Quality.” The concept of soil resilience in
combination with resistance is presented as an important component of
soil quality, a key element of sustainability. Factors that affect soil
resilience and resistance are soil type and vegetation, climate, land use,
scale, and disturbance regime. Maintenance of recovery mechanisms
after a disturbance is critical for system recovery. Three approaches for
assessing soil resilience are presented: (i) directly measuring recovery
after a disturbance, (ii) quantifying the integrity of recovery
mechanisms after a disturbance, and (iii) measuring properties that
serve as indicators of those recovery mechanisms. Research is needed in
the development of indicators or quantitative measures of the ability of
soils to recover from specific disturbances.
2.201 Carlos Manoel Pedro Vaz et al. (1999) studied a “SOIL PARTICLE
SIZE FRACTIONS DETERMINED GAMMA-RAY ATTENUATION.”
A new procedure is presented to determine the soil particle size more
quickly than the original procedure of gamma-ray attenuation. Instead
of measuring a complete PSD curve, the cumulated percentage of
particles in only two positions of the sedimentation container are
measured for specific sedimentation times related to the limits of sand/
silt (50 µm) and silt/clay (2 µm). Because this new procedure allows the
particle size fractions of 10 soil sample to be determined in
DocumentsPDFComplete
Click Here & UpgradeExpanded Features
Unlimited Pages

151
approximately 1 hour, as many as 80 samples can be analyzed in 1 day.
Triplicate soil samples of different textures were each analyzed with the
new gamma procedure and the pipette method. Although the average
standard deviation of all particle size fractions for the gamma procedure
was greater (1.6%) than that for the pipette method (0.7%), the new
procedure appears to be an acceptable method for analyzing soil texture.
The larger deviations are due mainly to the statistical behaviour of
gamma ray emission. The new gamma method yielded an acceptable
linear correlation with the pipette method (r2 = 0.976) for all particle
size fractions.
We propose that the new procedure should be used routinely for
particle size analysis. Its advantages are associated with automation of
the analysis, decreasing time and work for handling samples (sieving,
collecting, weighing, drying, measuring temperature) and minimum
influence of the operator expertise.
2.201 Yasushi Mori et al. (1999) studied “DISCRIMINATING THE
INFLUENCE OF SOIL TEXTURE AND MANAGEMENT-INDUCED
CHANGES IN MACROPORE FLOW USING SOFT X-RAYS.” Soft
X-rays radiography, a non-destructive technique, was employed to
examine macropore flow characteristics in soils of different
management: paddy, upland field, and forest. A constant-head saturated
hydraulic conductivity experiment was conducted using the soft X-ray
apparatus. A contrast medium, CH2I2, was applied as a tracer to obtain
contrast images of macropore flow. The visualization efficiency has
been increased by the low-energy system that enables high-contrast
images to be obtained as a result of a wider range of mass attenuation
coefficients. CH2I2 has a larger attenuation coefficient than bulk soil and
has a kinematic viscosity similar to water. It was introduced dropwise to
DocumentsPDFComplete
Click Here & UpgradeExpanded Features
Unlimited Pages

152
allow movement with the water flow. Macropore flow was captured
using a soft X-ray TV camera, whereas flow paths were photographed
on X-ray films. Light duralumin, was used for the sample holder instead
of the conventionally used stainless steel in order not to cancel the
efficiency induced by the constrast medium. We found that the highest
resolution obtained was 42.3 µm. This corresponded well to the
calculated value of 30 µm at an energy level of 60 to 70 keV. The
resultant images showed that only about 30% of potentially available
macropores conducted water flow. Macropore flow paths were affected
by land management: straight isolated cylindrical paths in paddy field
soils; a network of tortuous isolated cylindrical paths in paddy field
soils; a network of tortuous paths in upland field soils; and round cloudy
interaggregate paths in forest soils. Macropore flow velocity was
estimated from CH2I2 movement. Because the flow area was restricted
to a small number of macropores, the Reynolds number of flow ranged
from 51.6 to 88.6. The flow was in a transition region from laminar to
turbulent flow. Under actual conditions of macropore flow, the
assumption of laminar flow was not realized. Both structural and
dynamic analyses of macropore flow explained the flow characteristics
successfully.
2.203 Guoshu Yuan and Baoshan Xing (1999) investigated a “Site-Energy
distribution analysis of organic Chemical sorption by Soil Organic
Matter.” Sorption of several hydrophobic organic compounds by
selected soils, and their humic substance fractions as well, was
examined using batch equilibration methods. The results could not be
explained by the well known partitioning mechanism alone, but were
consistent with the dual mode sorption model for soil organic matter
DocumentsPDFComplete
Click Here & UpgradeExpanded Features
Unlimited Pages

153
(SOM) in which both solid-phase dissolution and hole-filling
mechanisms take place. The heterogeneous nature of the natural
sorbents was demonstrated by site-energy distributions derived from the
common Freundlich model. The site-energy distribution analysis is
useful for examining and understanding the energetic characteristics of
a sorbent. This analysis lends further support for the dual-mode model
of sorption of SOM.
2.204 Roger S. Swift (1996) studied a “MACROMOLECULAR PROPERTIES
OF SOIL HUMIC SUBSTANCES: FACT, FICTION, AND OPINION.”
This is followed by an analysis of the strengths and weaknesses of size-
exclusion chromatography (SEC) techniques that is central to the
studies under consideration. Emphasis is places on the importance of
overcoming interferences, attributable largely to charge and sorption
effects, in order to achieve meaningful applications of SEC. An
overview is given of the results obtained by SEC and ultracentrifugation
studies of a carefully fractionated collection of humic acid samples. The
development of the proposal of the flexible, random-coil model of the
macromolecular conformation of HS in solution based on this work is
described. This is followed by a review of the evidence put forward in
support of the ‘self-associating aggregate’ hypothesis of molecular
structure, and emphasis is placed on areas of concern that question the
validity of this model. Aspects of the work that require investigation
and verification are identified, and proposals are made for the further
studies required.
2.205 Leinweber et al. (1999) reported a “NEW EVIDENCE FOR THE
MOLECULAR COMPOSITION OF SOIL ORGANIC MATTER IN
DocumentsPDFComplete
Click Here & UpgradeExpanded Features
Unlimited Pages

154
VERTISOLS.” The distribution of soil organic matter (SOM) in
particle-size fractions and the molecular composition of SOM were
investigated for five FAO/UNESCO reference Vertisols. Throughout
the soil profiles, more than 80% of SOM was associated with clay-size
fractions. The remaining proportions were distributed in silt (mean:
155) and sand (mean < 1%). The uniform depth distribution of organic
carbon (Corg) and total nitrogen (Nt) in size fractions distinguished the
Vertisols from other major soil groups. The composition of SOM in the
surface horizons was studied by solid-state 13C nuclear magnetic
resonance (13C-NMR) spectroscopy, analytical pyrolysis, and wet
chemical analyses of organic N forms. The 13C-NMR spectra showed
low signal-to-noise ratios and indicated the predominance of alkyl C in
four of the samples. In contrast to the general low extractability of SOM
in Vertisols, unexpectedly large proportion of C and N (61-95%) could
be pyrolyzed and analyzed by field-ionization mass spectrometry (Py-
FIMS) and Curie-point gas chromatography/mass spectrometry (Py-
GC/MS). Signals of nitrogen-containing compounds were pronounced
in the FI mass spectra, and carbohydrates also contributed significantly
to the total ion intensity (TII). Quantitative evaluation showed that the
large proportions of heterocyclic N-containing compounds and peptides
(up to 20% of TII) distinguished these Vertisols from Regosols,
Cambisols, Podzols, Chernozems, and Histosols, which were analyzed
by Py-FIMS. Derivatives of pyrrole and pyridine as well as aromatic
nitriles were observed in the GC/mass spectra of all samples. Hydrolysis
and fractionation of organic N forms yielded large proportions of
hydrolyzable N (84-98% of total N) and NH3-N (32-53% of total N),
adding further evidence to the importance of N-containing molecules in
Vertisols. These results suggest that recent concepts regarding the
molecular composition of SOM in Vertisols should be revised because
DocumentsPDFComplete
Click Here & UpgradeExpanded Features
Unlimited Pages

155
they overemphasize long-chain aliphatics and neglect aromatic and
aliphatic N-containing molecules, which were unequivocally identified
by analytical pyrolysis.
2.206 Rochelte et al. (1999) was studied “Separating Soil Respiration into
Plant and Soil Components Using Analyses of the Natural
Abundance of Carbon-13.” In this study, we (i) used measurements of
the 13C value of soil CO2 to separate total soil respiration (Rt) into
subcomponents Rrh and Rs in a maize (Zea mays L.) field under
undisturbed conditions and (ii) compared these Rrh estimates with
values obtained using the root-exclusion approach. The maximum
contribution of Rrh to total respiration was 45%, observed in August.
Estimates of Rrh increased from zero 30 d after planting to 2 g CO2-C
m-2 d-1 70d after planting, remained relatively constant at that level in
August, and then decreased until the end of the growing season. The
total C losses as Rrh were 17% of the crop net assimilation. Estimates of
Rs gradually declined from 3.3 g CO2-C m-2 d-1 in late June to 1.4 g
CO2-C m-2 d-1 at the end of the season. Losses of soil C represented ≈
6% of total soil C. Variable values of δ13C of the soil CO2 in the control
plot after Day 250 made the technique less reliable late in the season.
However, several observations indicated that the approach has potential
to provide quantitative estimates of Rrh and Rs. First, the seasonal
pattern of the Rrh estimates coincides with that of the plant growth and
physiological activity. Second, the cumulated Rrh across the growing
season agreed well with published data obtained using 14C labelling
techniques. Third, in the maize plot, variation in the estimated Rs was
closely correlated with changes in soil temperature with Q10 of 1.99 (r2
= 0.87). Finally, the estimates of Rrh obtained using the isotopic
DocumentsPDFComplete
Click Here & UpgradeExpanded Features
Unlimited Pages

156
approach agreed well with those obtained using the root exclusion
technique.
2.207 Rafael Celis and William C. Koskinen (1999) was reported a
“Characterization of Pesticide Desorption form Soil by the Isotopic
Exchange Technique.” Isotopic exchange method to characterize the
irreversibility of the sorption-desorption process of the insecticide
imidaclopri-urea(1-[6-chloro-3-pyridinyl)-methyl]-N-alt2imidazolidini-
mine) and its degradation product imidacloprid urea (1-[(6-chlora-3-
pyridinyl)methyl]-2-imidazolidinone) on a silty clay loam (SiCL) soil,
and that of the metabolite imidacloprid –guanidine (1-[6-Chloro-3-
Pyridinyl)methyl]-4,5-dihydro-1H-imidazol-2-amine) on a loamy sand
(LS) soil. The exchange between 12C-pesticide molecules and 14C-
labeled pesticide molecules in soil suspensions preequilibrated for 24 h
was monitored and indicated that a fraction of the sorbed chemicals was
resistant to desorption. A two-compartment model was applied to
describe the experimental sorption data points of the sorption isotherms
as the sum of a reversible component and a nondesorbable, irreversible
component. The quantitative estimation of the irreversible and
reversible components of sorption experimentally derived from isotopic
exchange experiments, indicated degree of irreversibility (percentage
irreversibly bound) in the order: imidacloprid-SiCL soil (6-32%) <
imidacloprid urea-SiCL soil (15-23%) < imidacloprid guanidine-LS soil
(32-51%), with greater irreversibility at lower pesticide concentration.
Increasing the preequilibration time and decreasing pH in the
imidacloprid-SiCL soil system resulted in increased sorption
irreversibility. The irreversible component of sorption determined by
the isotopic exchange technique also allowed accurate prediction of the
DocumentsPDFComplete
Click Here & UpgradeExpanded Features
Unlimited Pages

157
sorption-desorption hysteretic behavior during successive desorption
cycles for all three soil-pesticide systems studied. The isotopic
exchange technique appears to be a suitable method to quantitatively
characterize pesticide desorption from soil, allowing-prediction of
hysteresis during sorption-desorption experiments.
2.207 Mahapatra and co-workers was reported a “Assessment of
degradation status of Jammu and Kashmir Soils for their
Amelioration.” The study reveals that soil degradation problems are
mainly due to water erosion, wind erosion and partly due to flooding
and water logging. About 31 per cent area of the state is under various
forms of degradation and about 57 per cent is unfit for agriculture due to
rock outcrops, ice caps and glaciers. The rest of the area (about 12 per
cent) constitutes arable lands, stable under natural conditions and
through human interventions. The ameliorative measures to arrest
further degradation of soils have been suggested.
2.209 Chefetz et al. (2000) was determined the “Characterization of Organic
Matter in Soils by Thermochemolysis Using Tetramethyl-ammonium
Hydroxide (TMAH)”. Tetramethylammonium hydroxide (TMAH)
thermochemolysisgas chromatography/mass spectrometry (GC/MS) was
employed to study the chemical structure of soil organic matter sampled from
a soil plot in which corn (Zea mays L) was farmed continuously for 15 yr.
The chromatograms exhibited peaks related to compounds derived from
lignin, fatty acid methyl ester (FAMEs), non-lignin aromatic structures, and
heterocylic N compounds. The dominant lignin-derived peaks in the TMAH
thermochemolysis-GC/MS chromatograms were mainly derivatives of p-
hydroxyphenyl and guaiacyl structures, suggesting a non-woody (grass)
DocumentsPDFComplete
Click Here & UpgradeExpanded Features
Unlimited Pages

158
lignin type. With depth, the ratio of syringyl to guaiacyl compounds (S/G)
decreased, suggesting a preferential degradation of the syringyl units by
microorganisms. Fatty acid methyl esters of varying C-chain length (C7 to
C27) were identified in the soil chromatograms. Both TMAH-GC/MS and13C-NMR (nuclear magnetic resonance) data suggested a relative increase of
long chain fatty acids with soil depth (or degree of humification), suggesting
a refractory nature for these compounds. The heterocyclin N compounds
yielded from the TMAH thermochemolysis were mainly pryroles, pyridines,
and pyrroles. In addition, low levels of methylated amino acids
(phenylalanine, leucine, and valine) were detected. The presence of the amino
acids in the bottom layer of the soil suggests a preservation mechanism. The
change identified in the chemical components provide clues as to the nature
of the humification processes in the soil profile and also yield information on
the nature of the sources of soil organic matter.
2.210 Zhao, Gray and Toth (2000) studied “Influence of Soil Texture on
Snowmelt infiltration into Frozen Soils.” Field data collected on
frozen, unsaturated agricultural soils of the Canadian Prairies during
snow ablation demonstrate: (a) poor association between the amounts of
infiltration of meltwater released by the seasonal snowcover and soil
texture, and (b) small differences in cumulative amounts among soils of
widely different textures. A physics-based numerical simulation of heat
and mass transfers with phase changes in frozen soils is used to study
the mechanics of the infiltration process in representative clay, silty clay
loam, silt loam and sandy loam soils. The results of the simulations
show that the differences among cumulative snowmelt infiltration into
clay, silty clay loam and silt loam soils after 24h of continuous
infiltration are small. Infiltration into a lighter-textured sandy loam after
DocumentsPDFComplete
Click Here & UpgradeExpanded Features
Unlimited Pages

159
24 h was on average 23% higher than in the other three soils with most
of the increase occurring in the first 5 h of the simulation.
2.211 Tamgadge and co-worker (2000) investigated “Assessment of Soil
Degradation Status in Madhya Pradesh.” The soil degradation status
in Madhya Pradesh was assessed for its kind, degree, extent and
serverity and mapped into 55 soil degradation units. It is found that 59.1
per cent of the total geographical area (TGA) is degraded by various
factors and processes. The soil degradation in the state is mainly due to
water erosion, specifically loss of topsoil (Wt) and terrain deformation
(Wd), which amounts to 55.66 per cent. Besides, water erosion in
association or complexed with chemical/salinity/waterlogging and
flooding have been also found to be responsible for the process. The
degradation is largely intensive as 44.6 and 11.6 per cent of the area of
the state falls under high and very high severity classes, respectively.
2.212 X.Y. Dai and co-workers (2000) studied “Characterization of Soil
Organic Matter Fractions of Tundra Soils in Arctic Alaska by
Carbon-13 Nuclear Magnetic Resonance Spectroscopy.” Soil
organic matter (SOM) was extracted with 0.1 M NaOH resulting in an
extractable fraction (EF) and a nonextractable fraction (humin). The
SOM of the EF was separated into six fractions: humic acid (HA),
fulvic acid (FA), low-molecular-weight acids (LMA), low-molecular-
weight neutrals (LMN), hydrophobic neutrals (HON) and hydrophilic
neutrals (HIN). Liquid-state and solid-state 13C nuclear magnetic
resonance (NMR) were applied to characterize the EF and the humin as
well as the whole soils, respectively. The distribution of C species was
calculated on the basis of relative integrated peak area. The liquid-state
DocumentsPDFComplete
Click Here & UpgradeExpanded Features
Unlimited Pages

160
13C NMR spectra of the extractable organic fraction demonstrated that
O-alkyl C was concentrated in the low-molecular weight fraction such
as LMN and LMA, while the aromatic unsaturated C was
predominantly in the HA and FA. The solid-state 13C MNR of the whole
soils showed that the Site 2 soil (Oe and O/A horizons) contained more
O-alkyl C and less alkyl C content than the Site 1 (Oal and Oa2) and 3
(Cf horizon) soils; the Site 3 Cf horizon exhibited spectra similar to
those of the Site 1 soil, supporting the theory that organic matter in the
Cf horizon could originate in the Oa horizon and was translocated by
cryoturbation. Spectra of the humin, which make up 53 to 76% of total
C, exhibited trends similar to those of the whole soils. Humin appeared
to possess greater alkyl C and less O-alkyl C content that whole soil;
aromatic, carboxyl carbonyl C contents seemed the same. Although
cross-polarization, magic angle spinning (CPMAS) 13C NMR spectra
intensities are nonquantitative, the spectral differences between humin
and HAs and FAs indicated significant differences in their composition.
The humin contained much higher alkyl C and lower aromatic-
unsaturated as well as carboxyl-carbonyl C than the HA and FA. The
results suggested that the humin fraction was different chemically from
the HA and FA. It consisted of a large proportion of paraffinic carbons
that may derive from algal or microbial sources.
2.213 Singh et al. (2001) studied “Estimating Soil Hydraulic Properties
Using Field Drippers.” A field dripper method is proposed to estimate
the soil hydraulic properties based on unsaturated hydraulic
conductivity function of Gardner (1958). In this method, water is
applied at a constant rate to a point on relatively level and dry soil using
field drippers, which create a ponded zone. For low dripper discharges a
hemispherical saturated soil geometry is most common. The area of
DocumentsPDFComplete
Click Here & UpgradeExpanded Features
Unlimited Pages

161
saturated zone increases with time and approaches a constant circular
area quickly. Steady state solution of two-dimensional soil water flows
in homogenous and isotropic soil is developed and applied for
estimating unsaturated hydraulic conductivity function, which is of
great importance in drip design. Other hydraulic parameter ‘α’ (an
empirical constant, which is relative measure of capillary and gravity)
can also be determined based on assumed relationship. It is a reliable,
quick and practicable field method. A comparison of hydraulic
parameters (Ks andα) measured and estimated by other methods for
three soils show good agreement with field dripper method. In sandy
loam soil, the proposed dripper method gives 10.5, 2.7 and 1.8 per cent
higher Vs values over inverse auger hole, cylinder infiltrometer and
cavity methods, respectively. In silty clay loam soil Ks values obtained
by cylinder infiltrometer and inverse auger hole methods are 12.1 and
55.8 per cent lower than field dripper method. In loam soil, the values
of Ks obtained by dripper and cavity method have close agreement. The
values of ‘α’ estimated by field dripper method was within the range of
values obtained by other workers, but was higher than the values
obtained from different laboratory methods, i.e. Diffusivity method,
steady state method and data generated by empirical equations.
2.214 Dipak Sarkar et al. (2002) reported the “Characteristics and
Classification of Soils of Loktak Catchment Area of Manipur for
Sustainable Land Use Planning.” Typical pedons representing major
landforms of Loktak catchment area of Manipur viz. very steep high hill
slope, steep high hill slope, steep medium hill slope, moderately steep
medium hill slope, moderately sloping food hill slope and very gently
sloping plain, developed from shale and occurring at different
DocumentsPDFComplete
Click Here & UpgradeExpanded Features
Unlimited Pages

162
elevations under varying landuse were studied for their morphological
and chemical characteristics and classified. Soils were deep, moderate
to slightly acidic (pH 4.6 − 5.4) in the surface, rich in organic carbon,
low to medium in exchange capacities with higher clay and low base
status in the subsurface horizon. Soils were high in available nitrogen,
medium to high in available potassium and low in available phosphorus.
Available iron and manganese were high, Cu and Zn were low
particularly in subsurface horizon. The BaCl2-TEA acidity was several
times more than KCl acidity. Translocation of clay and iron oxide was
prominent. High soil acidity associated with aluminium toxicity and
gravely substratum were the main limitations in these soils. Soils were
classified as Humic Dystrudepts, Humic Hapludults, Typic
Haplohumults, Typic Palehumults and Aquic Haplohumults. On the
basis of the major soil constraints, suitable landuse plan has been
suggested.
2.215 Desharnais and Lewis (2002) studied a “Electrochemical Water
Splitting at Bipolar Interfaces of Ion Exchange Membranes and
Soils.” This phenomenon, termed accelerated water splitting, is well
known in industry where BPMs are designed for electro synthesis of
acids and bases. In this work, it is hypothesized that (i) accelerated
water splitting can also take place at the bipolar interface between ion
exchange membranes (IEMs) and the ion exchange surfaces of soils,
and (ii) electro osmosis plays a key role. If the IEM has an electrostatic
charge opposite in sign to the predominant charge on the soil colloidal
particles, the interface is, in effect, bipolar. If an external electric field is
then applied, conditions can give rise to accelerated water splitting.
Laboratory experiments performed on various mixtures of Ottawa sand,
DocumentsPDFComplete
Click Here & UpgradeExpanded Features
Unlimited Pages

163
bentonite, talc, and anion exchange resin indicate that accelerated water
splitting occurs when the free pore solution in the low permeable soil
moves away from the bipolar interfaces due to electroosmosis, thus
causing an unsaturated zone at these interfaces. Accelerated water
splitting then initiates at these interfaces since there are not enough
counter ions in contact with the IEMs to maintain an ionin current. Very
little cation exchange capacity (CEC), anion exchange capacity (AEC),
or clay is needed for water splitting to occur at a bipolar IEM and soil
interface.
2.216 Amelung et al. (2002) studied “ORGANIC CARBON AT SOIL
PARTICLE SURFACES – EVIDENCE FROM X-RAY PHOTO-
ELECTRON SPECTROSCOPY AND SURFACE ABRASION.” The
XPS was applied to micro-aggregates of the A horizon of a Typic
Haplustoll (< 20-µm equivalent diameter, > 53-µm maximum real diameter)
and to the fine-earth fraction (< 2 mm) of the Bs horizon of a Typic
Haplorthod. Carbon and N, as well as Si (both samples), Ca
(Haplustoll), and Al (Haplorthod) were detected. Removing the particle
surface layer (< 50 nm) by bombarding with Ar+ resulted in a strong
reduction of the signals of C and N, while those attributed to inorganic
components increased relatively. Consequently, in both soils, organic
matter was concentrated at the surface of soil aggregates. We conclude
that Ar+ sputtering followed by XPS analysis is a useful tool in
identifying the accumulation of elements at the surface of soil particles.
2.217 Picone and co-worker (2002) reported “A Rapid Method to Estimate
Potentially Mineralizable Nitrogen in Soil.” An experiment was
conducted to determine the effects of reaction time, soil/reagent, and
DocumentsPDFComplete
Click Here & UpgradeExpanded Features
Unlimited Pages

164
soil/water ratios on the gas pressure generated by the method. Based on
this experiment, 5g of soil, 5 mL of deionized water, 0.3 g Ca(ClO)2,
and a reaction time of 25 min were selected as optimum conditions. The
method was evaluated with 60 Cecil (fine, kaolinitic, thermic Typic
Kanhapludults) sandy loam samples ranging in organic C from 4 to 16 g
C kg-1. Nitrogen mineralized in 24 d and soil microbial biomass C
(SMBC) were measured and related to the Ca(ClO)2 method and to two
other rapid method, the flush of CO2 during 3 d following rewetting of a
dry soil, and the NH4-N extractable with hot 2 M KCl. The Ca(ClO)2
method (mmol kg-1) was strongly correlated with net N mineralized in
24 d (r = 0.77) and with microbial biomass C (r = 0.90). The method
was also correlated with the flush of CO2 during 3 d following rewetting
of dried soil (r = 0.85) and with the NH4-N extractable with hot 2 M
KCl (r = 0.86). These results indicate that the Ca(ClO)2 method may be
useful to make rapid estimates of mineralizable N and microbial
biomass C in soil. Additional work is needed to investigate the nature of
the compounds oxidized by the method.
2.218 Teotia, Ghosh and Srivastava (2002) studied “A New Anion
Exchange Resin Method for Sulphate-Sulphur Extraction in
Mollisols of Nainital.” A new method for S-extraction was tried using
strong basic anion exchange resin (Amberlite IRA-400) on seventeen
Mollisol soil samples. A four-hour shaking, keeping 1: 1 soil: resin ratio
was found optimum. Of all the methods compared the resin method had
the highest S-extractability from soil. The values ranged from 4.4 to
30.3 mg kg-1 for Morgan’s reagent, 4.4 to 28.1 for NH4OAc-HOAc, 1.9
to 21.3 for 0.15% CaCl2, 3.1 to 28.1 for Olsen’s reagent, and 3.1 to 22.5
mg kg-1 for MCP (500 mg P L-1), with mean values of 13.7, 12.3, 10.6,
13.6 and 10.3 mg S kg-1, respectively. Two procedures based on anion
DocumentsPDFComplete
Click Here & UpgradeExpanded Features
Unlimited Pages

165
exchange resin method yielded much higher values, ranging from 48.8
to 65.5 and 50.5 to 70.4 mg S kg-1 without and with H2O2 treatment,
with mean values of 57.5 and 59.1 mg S kg-1 respectively. Resin
extractable-S was highly correlated with the S content extracted by all
other extractants under study.
2.219 Chefetz et al. (2002) reported the “Structural Components of Humic
Acids as Determined by Chemical Modifications and Carbon-13
NMR, Pyrolysis-, and Thermochomolysis-Gas Chromatograpy/
Mass Spectrometry.” The chemical structure of humic acids (HAs)
extracted from a grassland surface soil and peat were studied using
bleaching (NaClO2 oxidation) and acid hydrolysis (6 M HCl) in
combination with advanced analytical techniques: solid-state 13C
nuclear magnetic resonance (NMR), pyrolysis-gas chromatography/
mass spectrometry (GC/Ms), and tetramethylammonium hydroxide
(TMAH) thermochemolysis-GC/MS. The purpose of the chemical
treatments was to remove known structural fragments from the HA to
study the building blocks and components of the macromolecule.
Bleaching the peat HA resulted in an attack on the lignin structures
leading to a significant reduction in the C-substituted and O-substituted
aromatic C peaks (128 and 150 ppm) in the 13C NMR spectrum.
However, the bleached soil HA still contained residual aromatic C,
suggesting that part of its aromaticity had originated from aromatic
structures resistant to bleaching, possibly black C (charcoal). The
pyrolysates of the bleached HAs contained mainly alkanes and alkenes
(C8 to C29), whereas TMAH thermochemolysis yielded a homologous
series of long-chain fatty acid methyl esters (FAMs) (C8 to C32) and
dicarboxylic acid dimethyl esters (DAMES). The data are comparable
DocumentsPDFComplete
Click Here & UpgradeExpanded Features
Unlimited Pages

166
with those obtained from pyrolysis and thermochemolysis of plant
cuticular materials, and therefore suggest that cuticular residues are an
integral part of the HA macromolecule. The acid hydrolysis treatment
removed esters, amides, carbohydrates, and some of the N-containing
compounds from the HAs. This study demonstrates the effectiveness of
bleaching and hydrolysis treatments together with advanced analytical
techniques for characterization of aliphatic, lignin-derived (LG) and
nonhydrolyzable N-containing structures associated with the HA
macromolecule.
2.220 Joosse and McBride (2002) studied the “Assessing physical quality of
plastic soils of differing mineralogy and pre-stress history using
mechanical parameters I. Saturated compression tests.” This study
was conducted to determine: (i) if existing pedotransfer function
developed for sourthwestern Ontario soils could be used outside this
physiographic region, and (ii) if key mechanical parameters were
sensitive to a range of land use conditions that are likely to influence
soil structural quality. Soil profiles were sampled in natural (forested or
grassland), agricultural and pipeline workspace areas (land use variable)
located in south-western Ontario, eastern Ontario, Alberta and Texas
(mineralogy variable). Slurry consolidation and uniaxial compression
tests were conducted on remoulded and structurally intact samples, the
resulting void ratio-log stress [e(logσ')] data were fitted to linear or
nonlinear model equations, respectively, and several key mechanical
parameters were derived. The effective stresses at the liquid and plastic
limits could not be adequately estimated for soils with smectitic
mineralogy using existing pedotransfer functions because of the absence
of a significant relationship with organic carbon content. The difference
DocumentsPDFComplete
Click Here & UpgradeExpanded Features
Unlimited Pages

167
between void ratio intercepts for remoulded and structurally intact soils
(e*lkPa – e0) was found to be a suitable indicator of physical soil quality
because of the convergence of remoulded and structured compression
lines in e(logσ') co-ordinates. Severely over consolidated soils were
identified when the (e*lkPa – e0) variable exceeded 0.40.
2.221 Martin and co-worker (2002) studied “Determination of soil organic
Carbon and nitrogen at the filed level using near-infrared
spectroscopy.” This study explored the use of near-infrared
spectroscope (NIRS) for the rapid analysis of organic C (Corg) and
organic N (Norg) in the A horizon of soil within a single field. Soil was
sampled throughout a field in Manitoba, Canada to capture soil
variability associated with topography. The soil samples were oven-
dried and treated with acid to remove carbonates, after which C and N
were determined by dry combustion. In this study, portions of the dried
soil samples not treated with acid were scanned with a near-infrared
scanning spectrophotometer between 1100 and 2500 nm. Correlating
the spectral and the chemical analytical data using multiple linear
regression or principal component analysis/partial least squares
regression gave useful correlations of Corg. Over the range of 0-40 mg
g-1 Corg, NIR-predicted values explained 75-78% of the variance in the
chemical results. Results were improved to 80% for calibrations
developed for the 0-20 mg g-1 organic C range. Useful results were not
obtained for Norg although the literature shows that total N in soil is
predictable using NIRS. It is likely that the acid treatment altered the
composition of the samples in an inconsistent manner such that the
chemically analyzed samples and those scanned by NIRS were different
from each other in Norg concentration or composition. Extrapolation of
DocumentsPDFComplete
Click Here & UpgradeExpanded Features
Unlimited Pages

168
these Corg results to the landscape scale implies that NIRS has potential
to be a suitable method for mapping C for the purpose of monitoring C
sequestration.
2.222 Seena et al. (2002) studied the “Cation Exchange in Laterite Soils –
A Critical Assessment Based on Net Ionic Equilibrium (NIE).” An
extensive study of exchange properties of surface and subsurface soil
samples of the main campus of Kerala Agricultural University,
Vellanikkara, covering a total of 914 samples was conducted. The 0.1
M BaCl2 extractable exchangeable ions, CEC and the relative factor(s)
in terms of ionic ratios of monovalent (K+ and Na+) ions to the divalent
and/or trivalent ions, computed based on ratio law were subjected to
regression analysis in an attempt to predict the contents of the
exchangeable ions. In the case of exchangeable K and Na, the ratios
[K/(Ca+Mg+Mn+Fe)1/2+(Al)1/3] and [Na/(Ca+Mg+Mn+Fe)1/2+(Al)1/3],
respectively, could predict 60 to 70 per cent of the variation in the
content of these ions in the exchange fraction, while CEC could explain
only 12.4 to 14.7 per cent and percent base saturation (PBS) only 10%
of the variability.
2.223 Faz Cano et al. (2002) studied the “13C CP/MAS-NMR spectra of
organic matter as influenced by vegetation, climate and soil
characteristics in soils from Murcia, Spain.” The objective of this
work was to establish the distribution of functional groups in organic-C
from these soils using 13C CP/MAS-NMR spectroscopy and to
investigate the influence of vegetation, climatic conditions, soil
parameters, parent material, and soil order on these functional groups.
No statistically significant variability in the distribution of organic-C
DocumentsPDFComplete
Click Here & UpgradeExpanded Features
Unlimited Pages

169
groups was found as a result of the influence of either soil order or
parent material. The content of O-alkyl-C in the soil under the Rhamno-
Quercetum plant community was higher (95% probability) than in the
soils under the Paronychio-Sideritidetum plant community. Soils
located in the mesomediterranean climatic zone displayed a higher
content of O-alkyl-C and a lower content of aromatic-C compared to the
soils located in the thermomediterranean zone. These differences were
statistically significant at 955 of probability. Vegetation and climatic
conditions appear to play a major role in the OM decomposition
processes in this region. Statistically significant and positive
correlations were found between alkyl-C and both cation exchange
capacity (CEC) and clay content indicating the recalcitrant nature of
these organic compounds.
2.224 Pankhurst and co-workers (2002) reported that “Microbiological and
chemical properties of soil associated with macropores at different
depths in a red-duplex soil in NSW Australia.” Some agricultural
soils in South Eastern Australia with duplex profiles have subsoils with
high bulk density, which may limit root penetration, water uptake and
crop yield. In these soils, a large proportion (up to 80%) of plant roots
may be preferentially located within the macropores or in the soil within
1-10 mm of the macropores, a zone defined as the macropore sheath
(MPS). The chemical and microbiological properties of MPS soil
manually dissected from a 1-3 mm wide region surrounding the
macropores was compared with that of adjacent bulk soil ( > 10 mm
from macropores) at 4 soil depths (0-20 cm, 20-40 cm, 40-60 cm and
60-80 cm). Compared to the bulk soil, the MPS soil had higher organic
C, total N, bicarbonate-extractable P, Ca+, Cu, Fe and Mn and
supported higher populations of bacteria, fungi, actinomycetes,
DocumentsPDFComplete
Click Here & UpgradeExpanded Features
Unlimited Pages

170
Pseudomonas spp., Bacillus spp., cellulolytic bacteria, cellulolytic
fungi, nitrifying bacteria and the root pathogen Pythium. In addition,
analysis of carbon substrate utilization patterns showed the microbial
community associated with the MPS soil to have higher metabolic
activity and greater functional diversity than the microbial community
associated with the bulk soil at all soil depths. Phospholipid fatty acids
associated with bacteria and fungi were also shown to be present in
higher relative amount in the MPS soil compared to the bulk soil.
Whilst populations of microbial functional group in the MPS and the
bulk soil declined with increasing soil depth, the differentiation between
the two soils in microbiological properties occurred at all soil depths.
Soil aggregates (0.5 mm diameter) associated with plant roots located
within macropores were found to support a microbial community that
was quantitatively and functionally different to that in the MPS soil and
the bulk soil at all soil depths.
2.225 J. Six and co-workers (2002) reported “Stabilization mechanisms of
soil organic matter: Implications for C-saturation of soils.” Method
of quantification and characteristics of three SOM pools defined as
protected are discussed. Soil organic matter can be: (i) Physically
stabilized, or protected from decomposition, through microaggregation,
or (2) intimate association with silt and clay particles, and (3) can be
biochemically stabilized through the formation of recalcitrant SOM
compounds. In addition to behaviour of each SOM pool, we discuss
implications of changes in land management on processes by which
SOM compounds undergo protection and release. The characteristics
and responses to changes in land use or land management are described
for the light fraction (LF) and particulate organic matter (POM). We
defined the LF and POM not occluded within microaggregates (53-250
DocumentsPDFComplete
Click Here & UpgradeExpanded Features
Unlimited Pages
171
µm sized aggregates as unprotected. Our conclusions are illustrated in a
new conceptual SOM model that differs from most SOM models in that
the model state variables are measurable SOM pools. We suggest that
physiochemical characteristics inherent to soils define the maximum
protective capacity of these pools, which limits increases in SOM (i.e. C
sequestration) with increased organic residue inputs.
2.226 Bekele et al. (2003) studied “COMPARATIVE EVALUATION OF
SPATIAL PREDICTION METHODS IN A FIELD EXPERIMENT
FOR MAPPING SOIL POTASSIUM.” For the predication of soil
potassium (K), we evaluated the performance of the inverse distance
weight of powers 1, 2, and 3, ordinary kriging, cokriging, multiple
linear regressions assuming independent error, and multiple linear
regression with auto correlated error structure. Two forms of ordinary
kriging were evaluated: kriging the residuals from tend surface
regression (geographic location only as predicators) and Kriging the
residuals from a regression of K on geographic location and other soil
property predictors (soil pH and apparent electrical conductivity, ECa).
The autocorrelated error model as implemented in the Statistical
Analysis System (SAS) mixed linear model was employed to adjust for
autocorrelated error structure in the regression models used for
prediction. For cokriging, either soil ECa or soil pH was used as a
secondary soil property to predict K. The root mean square error
(RMSE) and mean error (ME) calculated from an independent
validation data set (n = 68) were used as comparison criteria. The best
result was obtained with the methods that incorporated geographic
locations, other soil property predictors, and the correlated error
structure. This investigation demonstrated the flexibility of the
DocumentsPDFComplete
Click Here & UpgradeExpanded Features
Unlimited Pages

172
regression-based autocorrelated error model for spatial prediction
compared with other methods.
2.227 M. Camps Arbestain et al. (2003) studied “RHIZOSPHERE
CHEMISTRY IN ACID FOREST SOILS THAT DIFFER IN THEIR
DEGREE OF AL-SATURATION OF ORGANIC MATTER.” The
objective of this research was to study the rhizoshpere of tree species of acid
forest soils derived from amphibolite (AMP) and granite (GR) rocks, so
that the influence of the type of pedogenesis (generated by these
materials) on its chemistry could be established. Umbric A1 horizons
were sampled in three AMP soils (Lithic Hapludands, Andic
Dystrudept), under orak, pine, and eucalyptus stands, and in three
nearby GR soils (Typic Dystrudepts) under identicals stands. The A1
GR horizons had a lower pH (4.2 vs 4.6), and greater aqueous solulble
Al (0.40 vs 0.60 mmol kg-1) and NH4Cl-extractable Al contents (6.8 vs
2.6 cmolc kg-1) than the A1 AMP horizons. Mean values of sodium
pyrophosphate extractable-Al (Alp) and ammonium oxalate extractable-
Al (Al0) in the A1 AMP horizons were 12.0 and 16.2 g kg-1,
respectively, and the molar ration between Alp and sodium
pyrophosphate extractable-C (Cp) ranged between 0.1 and 0.2. Mean
values of Alp, Alo, and Alp/Cp in the A1 GR horizons were significantly
(P < 0.05) smaller (5.2 g kg-1, 5.3 g kg-1, and 0.06, respectively). In the
A1 GR horizons, we observed a lower pH (significant at P < 0.05) in the
rhizoshpher than in the bulk soils, a pattern, which was not observed in
the A1 AMP horizons. The balance of nutritive cations and anions
between rhizosphere and bulk soils did not explain the patterns of ph
change. Based on the relationships found among organic acids, soil pH,
and Alp/Cp, we propose that, in the Al GR horizons, where organic
DocumentsPDFComplete
Click Here & UpgradeExpanded Features
Unlimited Pages
173
matter is Al-undersaturated, the increased organic acidity produced in
the rhizosphere cannot be completely buffered by Al alkalinity, whereas
in the AMP soils, where mineral amorphous Al coexists with Al-humus
complexes, organic compounds become stabilized with reactive Al
surface, maintaining organic acidity al low levels, even in the
rhizosphere (whenever the stabilization capacity of these surfaces is not
exceeded). Our results imply that both variations in organic matter
content and the degree of metal saturation of the organic matter need to
be considered when investigating the causes behind changes in soil pH
in the rhizosphere of acid forest soils.
2.228 Maruyama et al. (2003) was reported “Direct observation of soil
water movement through soil macropores using soft x-raysand
stereographing.” Water movement in soil was observed directrly and
recorded on videotape using soft X-ray technology with a liquid
contrast agent and on continuous phots. The movement of soil water
occurred in an Andosol sample, and quantitative analyses were carried
out by image processing. The results shown here are:
(1) The fluids flowing in tubular macro pores connected with each
other. The flow showed spatial motion in which the tubular pores
were sometimes swollen. Soil water moved into smapp lores like a
volcanic explosion and also moved, worm-like, according to the
shape of the tubular pores. Soil water movement occurred only in
some tubular pores. In most cases, soil water was not detected in
the pores.
(2) The spatial structures of macropores shown in three-dimensional
graphics were drawn from stereo-radiographs, based on the
observation of the spatial contribution of soil pore structures and
the calculation of their actural length and tortuousity.
DocumentsPDFComplete
Click Here & UpgradeExpanded Features
Unlimited Pages

174
(3) Applying Darcy’s law, various permeabilities (K2, K3, K4) of the
soil were calculated using the diameters of the dominant
macropores and actual velocities. The permeability was compared
with the permeability (K1) tested independently by the constant
head method. Differences among K1, K2, K3 and K4 were not
significant.
(4) The validity of Darcy’s law was tested using the constant head tank
at different heads and samples. Results show that the validity of
Darcy’s law was not confirmed.
(5) The Reynolds was calculated using the actual diameter of the
tubular pores and velocities of the agent measured by the
stereograph obtained by the video. The flow seemed to be
transitional between laminar and turbulent.
2.229 Schmalz Britta and co-worker (2003) was “ANALYSIS OF
UNSATURATED WATER FLOW IN A LARGE SAND TANK.”
This study was initiated to acquire experimental data about the water
flow characteristics of sandy soils to serve as a base for numerical
analysis. Specific objectives were to clarify the effects of (i) the invoked
procedure for estimating the soil hydraulic parameters and (ii) using
increasingly refined spatial definitions of the hydraulic properties on
simulated two-dimensional water content and flow velocity distributions.
Water flow in and drainage from a large sand tank (approximately
5 x 3 m2 at the base, 6 x 5.6 m2 at the top) was investigated using soil
hydrologic and geophysical methods. Numerical analyses of variably
saturated flow along a two-dimensional cross-section were carried out
in attempts to describe the heterogeneous flow fields using the Richards
equation-based HYDRUS-2D code. The unsaturated soil hydraulic
DocumentsPDFComplete
Click Here & UpgradeExpanded Features
Unlimited Pages

175
properties were describes using van Genuchten-Mualem type
expressions. Information from both in situ and laboratory measurements
was employed to obtain parameter estimates.
The observed variability in discharge rate with time was
reproduced best when an average water retention curve was used and
the saturated water content was set equal to the porosity, whereas
cumulative outflow was predicted best when all van Genuchten
hydraulic parameters were fitted to the retention data.
2.230 Turner et al. (2003) studied a “Phosphorus-31 Nuclear Magnetic
Resonance Spectral Assignments of Phosphorus Compounds in Soil
NaOH-EDTA Extracts.” They report solution 31P NMR chemical
shifts of model P compounds, including inorganic phosphates,
orthophosphate monoesters and diesters, phosphonates, and organic
polyphosphates, determined in a standardized soil P extractant (0.25 M
NaOH and 0.05 M EDTA). Signals from nucleic acids (DNA – 0.37
ppm, RNA 0.54 ppm) and phospholipids (phosphatidyl choline 0.78
ppm, phosphatidyl serine 1.57 ppm, phosphatidyl ethanolamine 1.75
ppm) could be differentiated in the orthosphospate diester region, and
were identified in a sample of cultured soil bacteria. Inorganic and
organic polyphosphate could be differentiated by the presence of a
signal at -9 ppm from the α phosphate of organic polyphosphates. Some
orthophosphate diesters, notably RNA and phosphatidylcholine,
degraded rapidly to orthophosphate monoesters in NaOH-EDTA
although DNA, other phospholipids, and orthophosphate monoesters
were more stable. Changes in probe temperature had a marked influence
on signal intensities and the relative magnitude of signals from
orthophosphate monoesters and inorganic orthophosphate, and we
DocumentsPDFComplete
Click Here & UpgradeExpanded Features
Unlimited Pages

176
suggest that solution 31P NMR spectroscopy of soil extracts he
performed at 20 0C.
2.231 Nannipieri and co-worker (2003) studied “Microbial Diversity and
Soil functions.” A better understanding of the relations between
microbial diversity and soil functions requires not only the use of more
accurate assays for taxonomically and functionally characterizing DNA
and RNA extracted from soil, but also high-resolution techniques with
which to detect inactive and active microbial cells in the soil matrix.
Soil seems to be characterized by a redundancy of functions; for
example, no relationship has been shown to exist between microbial
diversity and decomposition of organic matter. Generally, a reduction in
any group of species has little effect on overall processes in soil because
other microorganisms can take on its function.
The determination of the composition of microbial communities
in soil is not necessary for a better quantification of nutrient
transformations. The holistic approach, based on the division of the
systems in pools and the measurement of fluxes linking these pools, is
the most efficient. The determination of microbial C, N, P and S
contents by fumigation techniques has allowed a better quantification of
nutrient dynamics in soil. However, further advances require
determining new pools, such as active microbial biomass, also with
molecular techniques. Recently investigators have separated 13C- and12C-DNA, both extracted from soil treated with a 13C source, by density-
gradient centrifugation. This technique should allow us to calculate the
active microbial C pool by multiplying the ratio between labelled and
total DNA by the microbial biomass C content of soil.
DocumentsPDFComplete
Click Here & UpgradeExpanded Features
Unlimited Pages

177
2.232 Ludwig and Kölbl (2003) studied a “MODELING CATION
EXCHANGE IN AN UNDISTURBED SUBSOIL AT DIFFERENT
FLUX RATES.” Undistured samples of a Luvisol subsoil that differed
in their hydraulic conductivities (k1: 4 to 6 cm d-1; k2: 20 to 21 cm d-1;
k3: 42 to 59 d-1) were leached under saturated conditions with 4, 20,
102, and 205 mM BaCl2 at a hydraulic gradient of 6.5, and the Darcy
velocities were q1 (270 to 360 mm d-1), q2 (1280 to 1360 mm d-1) and
q3 (2730 to 3830 mm d-1). Objectives were to investiate how different
flux rates affect the amount of desorbed cations in an undistrued soil
when percolated with BaCl2 solutions of different concentrations and
whether ion concentrations in the percolates can be predicted. The
model PHREEQC was used for the calculation of one-dimensional
transport, inorganic complexation, and multiple cation exchange, and
the program UCODE was used for the parameter optimization. The best
prediction performance of ion concentration and the sum of cations
desorbed at q1 (73% satisfactory or good predictions) was obtained
when the parameters were 0.6 cm (dispersivity λ), 0.74 (fraction of
mobile water fθ), 3.4e-5 s-1 (mass transfer coefficient α), and 0.91
(proportion of cation exchange capacity in contact with the mobile water
fCEC-m). At q2, the optimum performance (71% satisfactory or good
predictions) was achieved with α = 6.2e-4 s-1 and fCEC-m = 5.8. At q3, the
optimum parameters were α = 6.8e-4 s-1 and fCEC-m = 0.38, which
resulted in 58% satisfactory or good predictions. This study suggests
that α increases with increasing pore water velocity and that fCEC-m
decreases with increasing hydraulic conductivity.
2.233 Harris (2003) studied of the “Measurement of the soil microbial
community for estimating the success of restoration.” Recent
DocumentsPDFComplete
Click Here & UpgradeExpanded Features
Unlimited Pages

178
research has shown quantitatively how by measuring the soil microbial
community we can assess degradation ahd the effects of management
designed to reverse it. The size, composition and activity of the soil
microbial community convincingly distinguish between systems, and
between the impacts of management strategies upon them.
Measurements of these characteristics of the microbial community
provide invaluable information for restoring degraded land and are
ready for routine use. Specifically, profiles of phospholipids fatty acid
contents, and substrate induced respiratory responses to different carbon
substrates, will yield significant data upon which management decisions
may be based.
2.234 Van Hees et al. (2003) studied a “Impact of estomycorrhizas on the
concentration and biodegradation of simple organic acids in a forest
soil.” They have investigated one set of factors, namely the impact of
ectomycorrhizal (Paxillus involutus) and non-mycorrhizal Picea abies
seedlings and humic acid on the concentration and dynamics of organic
acids in soil solution. We did so over 10 months in laboratory columns
containing soil from the E horizon of a sandy forest soil. Several organic
acids were identified in the solution extracted from the root zone
including oxalic, citric, malonic, succinic, acetic, formic and latic acids
at concentrations ranging from < 0.1 to 2.3 µM. Both plants and
ectomycorrhizas had significant effects on the concentration of organic
acids in soil solution. In contrast, omitting P from the irrigation water
appeared to have little effect on the concentrations. The microbial
mineralization kinetics of oxalate conformed well to a single Michaelis-
Menten equation. Further, the soil with the mycorrhizas had a
significantly faster mineralization of oxalic acid over a wide
concentration range than did the soil without ectomycorrhizas and
DocumentsPDFComplete
Click Here & UpgradeExpanded Features
Unlimited Pages

179
without plants. We conclude that the oxalate flux through the soil with
both trees and mycorrhizas is much faster than in evident from
measurements of solution concentration at steady state. Humic acid had
little effect on the organic acids or dynamics in the soil solution. Oxalic
acid concentrations in the soil solution were correlated with hyphal
length, rate of microbial mineralization, soil respiration, and shoot to
root weight ratio. We conclude that both mycorrhizas and plants have a
large impact on organic acid cycling in forest soils.
2.235 Kinraide (2003) was studied a “Toxicity factors in acidic forest soils:
attempts to evaluate separately the toxic effects of excessive Al3+ and
H+ and insufficient Ca2+ and Mg2+ upon root elongation.” Activities
of ions in the soil solutions and at the surfaces of root-cell plasma
membranes were computed with electrostatic models. Activities of Al3+
in solutions ({Al3+}) peaked at ph 4.1, and Al3+ activities at the surface
of the plasma membrane ({Al3+}0) achieved a broad maximum between
pH 4.1 and 4.8; thus, Al3+ intoxication is likely to be more severe in
soils at pH 4.1 than in more acidic ones. Intoxication (assessed by root
elongation) correlated somewhat ambiguously with ion activities, but
Al3+ -and H+ -induced depletion of Ca2+ and Mg2+, or both, from the cell
surface appears to play a role in toxicity. By contrast, experiments in
solution culture, where intercorrelation among {Al3+}, {H+}, and {Ca2+}
could be avoided, clearly demonstrated the following extrinsic and
intrinsic effects.
1. The ions Al3+ and H+ are intrinsic toxicants.
2. They are also extrinsic toxicants because of electrostatic
displacement of Ca2+ from the surface of the plasma membrane.
DocumentsPDFComplete
Click Here & UpgradeExpanded Features
Unlimited Pages

180
3. They are extrinsic ameliorants because each electro statically
displaces the other from the surface of the plasma membrane.
4. The ion Ca2+ is an extrinsic ameliorant because of the
electronstatic displacement of Al3+ and H+ from the surface of
the plasma membrane.
5. It is an intrinsic ameliorant of intrinsic H+ toxicity, but not
intrinsic Al3+ toxicity.
6. It meets an intrinsic requirement.
7. The ion Mg2+ resembles Ca2+ in item 4 but not items 5 and 6 in
short-term cultures.
In acidic soils, resembles Ca2+ may prevent H+ from becoming
an intrinsic toxisic (item 3) and may induce an insufficiency of Ca2+ and
Mg2+ (item 2). These findings have implications for the mechanisms by
which woodland plants tolerate very acidic soils.
2.236 Smernik and Oades (2003) studied a “Spin accounting and
RESTORE –two new methods to improve quantitation in solid-state13C NMR analysis of soil organic matter.” They have developed two
new techniques to overcome these problems. The first, spin accounting,
enables accurate gauging of how quantitative a spectrum is likely to be.
The result is expressed as the percentage of potential NMR signal that
can be accounted for (Cobs). Spin accounting improves on the
established spin counting technique by correcting for rapid T1ρH
relaxation and inefficient cross-polarization. Spin accounting identifies
three components: one that is well represented in CP spectra, one that is
under-represented in CP spectra due to rapid T1ρH relaxation and one
that is under-represented in CP spectra due to inefficient cross-
polarization. Spin accounting identifies three components: one that is
DocumentsPDFComplete
Click Here & UpgradeExpanded Features
Unlimited Pages

181
well represented in CP spectra, one that is under-represented in CP
spectra due to rapid T1ρH relaxation, and one that is under-represented in
CP spectra due to inefficient cross-polarization. For a range of eight de-
ashed soils, Cobs was in the range 83-106%, indicating that virtually all
potential signal could be accounted for after correcting for rapid T1ρH
relaxation and inefficient cross-polarization. The second new technique,
RESTORE (REstoration of Spectra via TCH and T One Rho (T1ρH)
Editing), generates subspectra for the essentially a corrected CP
spectrum. The RESTORE subspectra is essentially a corelated CP
spectrum. The RESTORE spectra of all eight soils more closely
resembled the corresponding, and presumably quantitative, Bloch decay
spectra than did the CP spectra. RESTORE identifies the types of
structures underestimated by CP, and the cause of their underestimation.
2.237 Mbila et al. (2003) studied a “MORPHOLOGICAL AND CHEMICAL
PROPERTIES OF SELECTED SLUDGE-AMENDED NIGERIAN
SOILS.” This study was conducted to investiage the morphological and
chemical properties os sludge-amended soils after about 37 years of sludge
application. Two soils on a 5-ha sewage farm and a soil at a nearby,
unamended site were selected for the study. Soil at all three sites would have
been mapped and classified in the same soil series before application of
seqage sludge. The unamended soil was a fine-loamy, kaolinitic,
isohyperthermic Rhodic Kandiustult. Compared with the unamended soil, the
sludge-amended soils had better aggregation in the surface horizon, greater
total soil C and N, and higher levels of exchangeable bases. After 37 years of
seqage sludge amendment, a higher base saturation percentage in the
subsurface horizons of one sludgeamended soil led to its classification as an
Alfisol instead of an Ultisol.
DocumentsPDFComplete
Click Here & UpgradeExpanded Features
Unlimited Pages

182
2.238 Gerin et al. (2003) studied a “Surface analysis of soil material by X-
rays photoelectron spectroscopy.” The surfaces was systematically
enriched in carbon, sometimes up to 1000 times, indicating that the soil
particle surfaces are coated with organic substances, even in horizons
where the bulk organic content is less than 0.1 g kg-1. The distribution of
carbon in the various oxidation states was 0.569 ± 0.008 C[0], 0.275 ± 0.004
C[+1], 0.089 ± 0.003 C[+2] and 0.066 ± 0.002 C[+3] for most horizons (mean ±
standard error, 69 data). Only Andosol surface horizons systematically had
surface organic matter in a more oxidized state. After correcting the
results for the presence of organic coatings, we found that Si was
generally depleted and Al enriched at the surface of soil particles, while
Fe was either depleted or enriched depending and Al enriched at the
surface of soil particles, while Fe was either depleted or enriched
depending on the sample considered. However, the coating of the
coarser soil particles by the finer ones and their differential composition
explained this observation and limits the interest XPS for characterizing
the surface enrichment of inorganic elements in crude soil samples.
These limitations should be considered when interpreting XPS results in
future work. Nevertheless, XPS can analyse the adsorbed organic matter
and its functional composition of carbon without the need for any
chemical or physical extraction that might alter the structure and
composition of the organic molecules.
2.239 Cosenza, Guerin and Tabbagh (2003) reported a “Relationship
between thermal conductivity and water content of soils using
numerical modelling.” Using a numerical modelling approach, we have
shown that the microscopic arrangement of water influences the relation
between λ and θ. Simulated values for n ranging form 0.4 to 0.6, λs
DocumentsPDFComplete
Click Here & UpgradeExpanded Features
Unlimited Pages

183
ranging from 2 to 5 W m-1 K-1 and θ from 0.1 to 0.4 can be fitted by a
simple linear formula that takes into account n, λs and θ. The results
given by this formula and by the quadratic parallel (QP) model widely
used in physical property studies are in satisfactory agreement with
published data both for saturated rocks and for unsaturated soils.
Consequently, the linear formula and the QP model can be used as
practical and efficient tools to investigate the effects of water content
and porosity on the thermal conductivity of the soil and hence to
optimize the design of thermal in situ techniques for monitoring water
content.
2.261 Garnier et al. (2003) reported the “Modelling carbon and nitrogen
dynamics in a bare soil with and without straw incorporation.” They
tested carbon and nitrogen dynamics by measuring C mineralization rates,
the rates of gross immobilization and mineralization of N (using 15N
tracing), and inorganic pools of N in the soil profile during 1 year in a
bare soil with or without addition of wheat straw. Most of the model
parameters were determined in independent experiments. We estimated
the biological parameters from incubation experiments in the laboratory.
The simulated results were in good agreement with experimental data,
particularly for gross N rates. Hypotheses concerning the pathway of
microbial assimilation and the dependence of decomposition on the size
of the biomass were tested. The simulated net N immobilization due to
addition to straw (8000 kg dry matter ha-1) reached a maximum of 64 kg
N ha-1 after 2 months, whereas the observed value was 66 kg N ha-1. The
model indicated that after 13 months the incorporation of straw had
reduced the net amount of nitrogen mineralized by 13% and the amount
of leached nitrate by 27%. The sensitivity analysis to the depth of straw
DocumentsPDFComplete
Click Here & UpgradeExpanded Features
Unlimited Pages

184
incorporation indicated that the deeper was the incorporation the less
was the leaching and the mineralization of nitrogen.
2.262 Pachepsky and Rawls (2003) reported a “Soil structure and
pedotransfer functions.” Two case studies are presented. Data from the
US National Pedon Characterization database are used to estimate soil
water retention from categorical field-determined structural and textural
classes. Regression-tree estimates have the same accuracy as those from
textural class as determined in the laboratory. Grade of structure appears
to be a strong predictor of water retention at – 33 kPa and – 1500 kPa.
Data from the UNSODA database are used to compare field and
laboratory soil water retention. The field-measured retention is
significantly less than that measured in the laboratory for soils with a
sand content of less than 50%. This could be explained by Rieu and
Sposito’s theory of scaling of soil structure. Our results suggest a close
relationship between structure observed at the soil horizon scale and
structure at finer scales affecting water retention of soil clods. Finally
we indicate research needs, including (i) quantitative characterization of
the field soil structure, (ii) an across-scale modelling of soil structure of
use fine-scale data for coarse-scale PTFs, (iii) the need to understand the
effects of soil structure on the performance of various method available
to measure soil hydraulic properties, and (iv) further studies of ways of
use soil-landscape relationships to estimate variations of soil hydraulic
properties across large areas of land.
2.263 Kaiser and Guggenberger (2003) studied a “Mineral surfaces and
soil organic matter.” Sorption of organic matter reduced the SSA,
depending on the amount sorbed and type of mineral. The reduction in
DocumentsPDFComplete
Click Here & UpgradeExpanded Features
Unlimited Pages

185
SSA decreased at large organic matter loadings. The SSA of the mineral
soils was positively related to the content of Fe oxyhydroxides and
negatively related to the content of organic C. The strong reduction in
SSA at small loadings was due primarily to the decrease in the
micropores to which N2 was accessible. This suggests preferential
sorption of organic matter at reactive sites in or at the mouths of
micropores during the initial sorption and attachment to less reactive
sites at increasing loadings. The exponential decrease of the heat of gas
adsorption with the surface lading points also to a filling or clogging of
micropores at early stages of organic matter accumulation. Desorption
induced a small recovery of the total SSA but not of the micropore
surface area.
Destruction of organic matter increased the SSA of all soil
samples. The SSA of the uncovered mineral matrix related strongly to
the amounts of Fe oxyhydroxides and the clay. Normalized the C
removed, the increase in SSA was small in topsoils and illuvial horizons
of Podzols rich in C and large for the subsoils containing little C. This
suggests that micropores preferentially associate with organic matter,
especially at small loadings. The coverage of the surface of the soil
mineral matrix as calculated from the SSA before and after destruction
of organic matter was correlated only with depth, and the relation
appeared to be linear.
2.264 Poulsen et al. (2003) studied “Estimating saturated hydraulic
conductively and air permebility from Soil. Physical Properties
Using State Analysis.” In this study, three modeling approaches were
used to identify the dependence of saturated hydraulic conductivity (KS)
and air permeability at -100 cm H2O soil water potential (ka100) on soil
physical properties in undisturbed soil: (i) Multiple regression, (ii)
DocumentsPDFComplete
Click Here & UpgradeExpanded Features
Unlimited Pages

186
ARIMA (autoregressive integrated moving average) modeling, and (iii)
State-space modeling. In addition to actual soil property values, ARIMA
and state-space models account for effects of spatial correlation in soil
properties. Measured data along two 70-m-long transects at a 20-year
old constructed field were used. Multiple regression and ARIMA
models yielded similar prediction accuracy, whereas state-space models
generally gave significantly higher accuracy. State-space modeling
suggested Ks at a given location could be predicted using nearby values
of Ks, Ka100 and air-filled porosity at -100 cm H2O soil-water potential
(ε100). Similarly, ka100 could be predicted from nearby values of Ka100 and
ε100. Including soil total porosity in the state-space modeling did not
improve prediction accurary. Thus, macro-porosity (ε100) was the key
porosity parameter for predicting both Ks and Ka100 in undisturbed soil.
2.265 Nissen et al. (2003) studied a “TIME DOMAIN REFLECTOMETRY
DEVELOPMENTS IN SOIL SCIENCE: I. UNBALANCED TWO-ROD
PROBE SPATIAL SENSITIVITY AND SAMPLING VOLUME.” In this
study, a two-rod probe without a balun (unbalanced) was exposed to a rising
air-water interface, creating a sharp dielectric permittivity boundary within the
sample volume of the probe. The probes were horizontal, but they were
located within a vertical plane, i.e., one rod was placed above the other. A
shorting diode technique was used to improve the location of the end
reflection on the TDR trances. Two experiments were carried out differing
only in the connection of the coaxial cable to the probe rods. In one
experiment, the conductor was connected to the lower rod and the shield was
connected to the upper rod. In the second experiment these connections were
reversed. Using a numerical model, the relative dielectric permittivity (K)
responses of two-rod balanced and unbalanced TDR probes were predicted as
DocumentsPDFComplete
Click Here & UpgradeExpanded Features
Unlimited Pages

187
a function of the fluid interface height. The measured and modeled responses
of the unbalanced two-rod probe matched perfectly, and there was no
observed increase in the spatial sensitivity of the probe adjacent to either rod.
Furthermore, the modelled probe responses as well as the sample areas for the
balanced and unbalanced probe configurations were identical. Based on these
results, we suggest that baluns be omitted from two-rod TDR probe designs.
2.266 Nissen, Ferré, and Moldrup (2003) studied a “TIME DOMAIN
REFLECTOMETRY DEVELOPMENT IN SOIL SCIENCE: II. COAXIAL
FLOW CELL FOR MEASURING EFFLUENT ELECTRICAL
CONDUCTIVITY.” To determine the presence of heterogeneous solute
transport effectively, there is a need for a device to monitor the EC boundary
conditions. In this study, a simple and easy-to-make coaxial flow cell is
designed and tested for this purpose. The flow cell is made primarily of cheap,
prefabricated, and readily available components, and the construction requires
only a hacksaw and some welding skills. The idea is to make the effluent from
a solute transport experiment pass through the coaxial flow cell, thereby
obtaining a measure of the effluent EC. In addition to providing detailed
information on the solute transport through the entire sample of porous
medium, it will also detect, for example, bypass flow. A solute transport
experiment was carried out in PVC pipe packed with coarse silica and under
saturated conditions to calibrate the flow cell and to demonstrate its potential
use. Step input breakthrough and breakdown functions were created using tap
water and KCl solution. Highly detailed measurements of EC in the effluent
were obtained, from which solute transport parameters can easily be inferred.
2.267 John J. Kelly (2003) studied a “MOLECULAR TECHNIQUES FOR
THE ANALYSIS OF SOIL MICROBIAL PROCESSES:
DocumentsPDFComplete
Click Here & UpgradeExpanded Features
Unlimited Pages

188
FUNCTIONAL GENE ANALYSIS AND THE UTILITY OF DNA
MICROARRAYS.” Recent research has revealed the tremendous diversity of
microorganisms responsible for catalyzing a variety of soil processes.
Such functional redundancy within soil microbial communities may
have significant impacts on process rates and ecosystem stability.
Therefore, the analysis of functional diversity and its dynamics in the
environment is essential for understanding the biogeochemistry in soil
systems. Until recently, methodological limitation hindered
investigation of the relationship between microbial diversity and soil
processes. Over the last decade, innovative molecular approaches to the
study of natural microbial communities and the functional genes
responsible for biogeochemical processes have given us new insight into
this relationship. One new approach, DNA microarray analysis,
promises to be especially useful for the analysis of these functional
genes.
2.268 Fiedler and Kalbitz (2003) studied a “CONCENTRATIONS AND
PROPERTIES OF DISSOLVED ORGANIC MATTER IN FOREST
SOILS AS AFFECTED BY THE REDOX REGIME.” They estimated the
influence of redox conditions on DOM dynamics in the field, sampling
soil solutions at different depths of three soils (Humic and Histic
Gleysol, Chromic Cambisol) along a soil catena in the cool-humid Black
Forest (Germany) over a period of 2 years. We measured dissolved
organic carbon (DOC) and determined the specific absorbance at 280
nm and two humification indices derived from fluorescence spectra to
describe the aromaticity and complexity of DOM. Redox potential (Eh)
was monitored continuously in situ. In the forest floor, DOC
concentrations ranged independent of soil organic matter content and
redox regime between 40 and 60 mg C L-1. DOC concentrations in all
DocumentsPDFComplete
Click Here & UpgradeExpanded Features
Unlimited Pages

189
soils decreased with depth, accompanied by a decrease in DOM
aromaticity and complexity. In the mineral subsoil, DOC concentrations,
aromaticity, and DOM complexity were smallest in the aerobic soil
(Chromic Cambisol; Eh > 500 mV) and largest in the most anaerobic
soil (Histic Gleysol; Eh < 100 mV). Large DOM retention in the aerobic
soil could be related to high contents of Fe oxides, highlighting their
importance for DOM adsorption. Despite significantly reduced DOM
retention under anaerobic conditions, it remains relatively large because
the main (DOM) adsorbents changed from Fe oxides under oxic
conditions to clay minerals, which were about 100 times more abundant
under anaerobic conditions than Fe oxides. We found indications that
biodegradation of DOM contributes more to DOM retention under
anaerobic conditions, and we conclude that large DOM fluxes from
anaerobic forest soils are the result of limited DOM adsorption in the
subsoil rather than large DOM release from the topsoil.
2.269 Chaplot et al. (2003) studied a “SOIL SPATIAL DISTRIBUTION
IN THE ARMORICAN MASSIF, WESTERN FRANCE: EFFECT
OF SOIL-FORMING FACTORS.” This study aimed to quantify the
relationship between soil spatial distribution and the soil-forming factors
of geology, topography, climate, and tectonic regime in order to predict
soil spatial distribution over a wide region (30,000 km2). The Armorican
Massif (western France), a complex basement of Proterozoic and
Paleozoic rocks affected by recent tectonic activity and characterized by
variations in topography and climate, was chosen as the study site.
Detailed soil maps (1:25, 000) were used to describe soil spatial
distribution along transects. An ANOVA performed on 314 transects
showed a high correlation between the occurrence of soils with
particular features (namely redoximorphic, leached, glossic, and albic)
DocumentsPDFComplete
Click Here & UpgradeExpanded Features
Unlimited Pages

190
and geological substrate, uplift ratio, mean slope gradient, and net
rainfall. No such correlation was found with fluvic soils. These soil-
forming factors seem to act through saprolite quality and erosion
processes, which in turn control the development of soil features. A
quantification of the relationship between soil features and soil-forming
factors was performed by regression analysis in order to allow further
prediction of the soil spatial distribution over the entire Armorican
Massif. These results revealed and quantified the hitherto unrecognized
role of tectonism on soil distribution and its relative importance in
respect to other soil-forming factors.
2.2610 Arriaga and Lowery (2003) was a “SOIL PHYSICAL PROPERTIES
AND CROP PRODUCTIVITY OF AN ERODED SOIL AMENDED
WITH CATTLE MANURE.” A study was established to determine the
effects of soil erosion and long-term manure applications on selected
soil physical properties and corn (Zea mays L.) production. After 10
years of annual manure applications, soil core samples were collected in
7.6-cm increments at three depths, 0 to 7.6, 15 to 22.6, and 30 to 37.6
cm, to determine soil bulk density (ρb), hydraulic conductivity of
saturated soil (Ks), and water retention. Bulk density and Ks increased
slightly with erosion level. Water retention did not change in the surface
7.6 cm, but it did decrease with increasing erosion level at deeper
depths. Long-term application of manure decreased ρb by 10%, whereas
Ks was doubled in the top 7.6 cm of soil. Manure increased soil-water
retention capacity and decreased differences in water retention between
erosion levels, especially at low suctions (0 to 20 kPa). Soil carbon
content correlated well with water retention and ρb. Corn grain yields in
1997, 1998, and 1999 were 15, 6, and 14% less, respectively, in the
DocumentsPDFComplete
Click Here & UpgradeExpanded Features
Unlimited Pages

191
severe than in the slight erosion phase. Long-term manure additions
increased corn grain yields by 19% in 1998 and by 25% in 1999.
Increased yield from naure additions was likely related to an
enhancement in water retention. Results from this study show that long-
term manure application is a possible management alternative for
restoring the physical properties and crop productivity of eroded soil.
2.250 Franklin et al. (2003) was studied the “ELEMENTAL CONCENTRATIONS
IN SOILS OF SOUTH CAROLINA.” They determined the concentrations
of 25 elements in soils typical of the Southeast Atlantic Coastal Plain,
Piedmont, and Blue Ridge at 50 sites in South Carolina. Our purpose
was to gather baseline data on the elemental content of soils for use in
dealing with land application of wastes and other environmental issues
involving metal content in soils. Concentrations of more than one-half
of the elements were higher in the Blue Ridge and Piedmont soils than
in those in the Carolina Sandhills, Upper Coastal Plain, or Lower
Coastal Plain. Concentrations of Al, Ba, Be, Cd, Co, Cr, Fe, K, Li, Mn,
Na, Ni, Rb, S, Sb, Sc, V, and Zn were correlated positively with clay
content. Selenium and were correlated negatively with clay content.
Several of these elements (Al, Ba, Fe, K, Mn, Mn, Ni, S, Se, V, and Zn)
were correlated positively with soil pH, but correlation coefficients were
generally less than for correlations with clay content. Land use,
according to cropping history, was not a significant factor affecting
elemental concentrations. Sites that had been cropped to cotton or
pastures for long periods of time had slightly higher concentrations of
As and Cu, respectively, but differences were of little consequence. Soil
Ni concentrations were higher at forest sites compared with all other
sites, which may have been due to more effective biogeochemical
recycling at forest sites resulting in higher soil retention. We found no
DocumentsPDFComplete
Click Here & UpgradeExpanded Features
Unlimited Pages

192
evidence that soil at the 0-15-cm depth was enriched with any elements.
Concentrations with in the 0-15-cm depth were no different than those
with in the 15-30-cm depth, indicating that any enrichment that may
have occurred because of anthropogenic activities had become
distributed throughout the 30-cm depth as a result of tillage and natural
processes. The maximum value and geometric mean of Cd
concentrations were considerably greater than values reported in two
other surveys of U.S. soils. Some sites in all of the land resource and
land use categories had concentrations of As and Cd that translated into
soil loads exceeding 30% of the cumulative pollutant load limits cites in
the USEPA 503 regulations.
2.251 Norfleet et al. (2003) studied “SOIL QUALITY AND ITS RELATIONSHIP
TO PEDOLOGY.” In this regard, soil quality can be considered part of
the science of pedology. Significant differences in selected near-surface
soil properties and subsequent interpretations as influenced by land use
are illustrative of the need to collect data reflecting use-dependent or
dynamic soil properties. Inherent or use-invariant properties dictate the
limits to which dynamic properties range. As pedologists begin to
explore these relationships, a dynamic soil properties database should be
developed as a companion to the database of use-invariant properties
used currently for classification, mapping, and interpretation.
2.252 Shukla and co-worker (2003) was studied the “LAND USE AND
MANAGEMENT IMPACTS ON STRUCTURE AND INFILTRATION
CHARACTERISTICS OF SOILS IN THE NORTH APPALACHIAN
REGION OF OHIO.” The five treatments were no-till without manure
(NTWM), no-till with manure (NTM), no-till corn (Zee mays)-soybean
DocumentsPDFComplete
Click Here & UpgradeExpanded Features
Unlimited Pages

193
(Glycine max) rotation (NTCSR), conventional tillage (CT), and
meadow (M). Treatments significantly influenced water infiltration
characteristics, soil bulk density (ρb), aggregation, and mean weight
diameter (MWD). The maximum cumulative infiltration after 3 h (I) of
109.3 ± 29.0 cm (average of 9 measurements at 3 landscape positions)
was measured for the NTM treatment and the lowest 27.7 ± 21.0 cm
(average of 3 measurements at shoulder slope or S) for the CT
treatment. The infiltration rate at 5 min (i5), steady state infiltration rate
after 3 h (ic) and filed capacity water content 24 h after the infiltration
(FC) were higher in NTM (1.5 cm min-1, 0.4 cm min-1, and 0.35 gg-1,
respectively) than other treatments. The least values of i5, ic and FC (0.4
cm min-1, 0.18 cm min-1, and 0.22 gg-1, respectively) were observed for
the CT treatment. Saturated hydraulic conductivity (Ks) measured on
soil cores was the highest for the NTM (0.29 cm min-1) for 0 to 10 cm
and NTCSR (0.24 cm min-1) for 10 to 20 cm depth. The ρb (1.52 g cm-3
for 0 to 10 cm and 1.62 g m-3 for 10 to 20 cm depth) was the lowest and
water stable aggregates (WSA) were the highest (WSA of 89% and
63%) for both depths for the NTM treatment. The ρb was much higher
for the CT (1.75 g cm-3 for 0 to 10 cm depth) and NTWM (1.77 g cm-3
for 10 to 20 cm depth) than NTM, NTCSR and M treatments for either
depth. The landscape positions did not have a significant influence on
soil physical and water transmission properties nor on total biomass.
The manuring treatment improved soil aggregation and water
transmission properties.
2.253 Liu and Chen (2004) was studied the “SOIL CHARACTERISTICS
AND CLAY MINERALOGY OF TWO SUBALPINE FOREST
SPODOSOLS WITH CLAY ACCUMULATION IN TAIWAN.” The
objectives of this were to investigate the soil characteristics, weathering
DocumentsPDFComplete
Click Here & UpgradeExpanded Features
Unlimited Pages

194
patterns of clay mineralogy, and genesis of the two Spodosols with clay
accumulation in the Chunta Mountain region of central Taiwan. We
have also proposed modiciation of the description of Spodosols in Soil
Taxonomy. Soil characteristics, clay distribution, low soil pH, and very
low base saturation percentage caused by strongly leaching processes
indicate those podzolization and clay illuviations are the pedogenic
processes in the study area. The subsurface horizons of the two
Spodosols meet the chemical criteria of the spodic horizon defined in
Soil Taxonomy, which suggest that translocation of spodic materials has
occurred. The value of organic carbon and Fep/Feo or Alp/Alo ratio
reaches a profile maximum in the spodic horizon, which suggests that
the spodic horizon was formed predominantly by the illuviation of
organo-melallic complaxes. Soluble organic matter leached with the soil
solutions along the soil pores from the upper horizons to the spodic
horizon. The spodic horizon in characterized by many black and other
dark pellets of organic matter. The clay mineralogy of the A and albic
horizons is dominated by illite, vermiculite and vermiculite-illite
interstatified minerals (VI), but the Bhs horizons contain mainly
vermiculite and hodroxy-interlayer vermiculite (HIV). The clay
mineralogy of the eluvial horizons differs somewhat from that in the
illuvial horizons as a result of moderate weathering. The weathering
sequence of clay minerals in these two loamy Spodosols is: illite →
vermiculite (or VI) → HIV. According to the USDA Soil Taxonomy,
the two pedons with clay accumulation can be classified as a Typic
Haplohumod and a Typic Haplorthod.
2.254 A. Thangasamy and co-worker (2004) studied “Clay Mineralogy of
Soils in the Sivagiri Micro-watershed of Chittoor District, Andhra
Pradesh.” The clay film invariably exhibited the characteristic peaks of
DocumentsPDFComplete
Click Here & UpgradeExpanded Features
Unlimited Pages

195
smectite, kaolinite and mica. Semi-quantitative estimates of clay
fractions based on relative areas under corresponding peaks indicated
that the pedons 1, 2, 3, 5, 6, 7, and 8 are dominated by smectite followed
by kaolinite and mica whereas pedons 4 and 9 are dominated by
kaolinite followed by considerable amounts of smectite and mica.
Feldspar and quartz are present in traces. However, use and management
of these soils for agricultural production require an understanding of
their clay mineralogy.
2.255 A.K. Guber, Pachepsky and Levkovsky (2004) studied a “MASS-
SIZE SCALING IN SOIL AGGREGATES AS AFFECTED BY
AGGREGATE WATER CONTENT AND SOIL COMPACTION.”
Information about soil structure can also be derived from examining the
aggregate mass or density of aggregate size. There have been several
reports indicating that the density-size relationships in air-dry aggregates
follow predictions of a model assuming aggregates to be mass fractals. It
was demonstrated recantly that such model is applicable to wet
aggregates if parameters of this model are assumed to be linear
functions of gravimetric water contents. The objective of this study was
to evaluate sensitivity of fractal parameters to soil compaction caused by
wheel traffic. Irrigated and non-irrigated plots were laid out at silty clay
Greyzem under fallow, and treatments of one tractor pass and three
tractor passes were applied. The volume of individual aggregates for
four depths in the plow layer was measured by kerosene method at air-
dry water content, at two intermediate water contents between saturation
and air-dry, and at saturation. The mass fractal model fitted data in a
satisfactory manner within the range of water contents from air-dry to
saturation with a R2 of 0.99. Both the slope and the intercept of the
dependence of fractal dimension and reference aggregate mass o water
DocumentsPDFComplete
Click Here & UpgradeExpanded Features
Unlimited Pages

196
content were more sensitive to compaction than to soil bulk density and
aggregate size distributions. Parameters of fractal scaling showed
promise for diagnosing compaction in studied soil.
2.256 Krishnan and co-worker (2004) was studied “Land, Soil and Land
Use of Lakshadweep Coral Island.” Ten soil series identified on the
basis of soil morphological, physical and chemical properties were
spatially delineated. The soils are generally deep, excessively drained,
alkaline in reaction and poor in water holding capacity. Coarse
fragments, shallow rooting depth and poor drainage conditions were
observed in limited areas. The soils, in general, are deficient in plant
nutrient element viz. K, Me, Mn, and Zn. In absence of viable sources of
irrigation water, rainfed coconut plantation inter-cropped with vegetable
and fruit crops seems to be the only land use option. Alternate uses of
problem areas are suggested.
2.257 Hassan and co-workers (2004) was the “DEPENDENCE OF THE DEGREE
OF LINEAR POLARIZATION IN SCATTERED VISIBLE LIGHT ON
SOIL TEXTURAL FRACTIONS.” Determination of soil textures in the
laboratory using traditional methods is labor and time intensive. A quick
and relatively easy method was developed to achieve this purpose using
light polarization. Preliminary measurements based on Stokes
polarimetry were made to examine the feasibility of estimating soil
texture by measuring the degree of linear polarization (P) in light
scattered by surface layer (0-30 cm) samples. Samples were collected at
18 locations along a transect from Alexandria to Sidi Barrani on the
north-western coast of Egypt. These samples represent a broad range of
soil types and textures. The results from this study show that the soil
textural fractions (% sand, % silt, and % clay) were linearly related to P
DocumentsPDFComplete
Click Here & UpgradeExpanded Features
Unlimited Pages

197
in the scattered visible light. For a given particle size fraction, the
relationship was especially strong for a preferred wavelength. The best-
fitted regression lines (R2 > 0.99) were % sand = 66.53 – 64.10 P for
470 nm, % silt = 10.35 + 40.65 P for 420 nm, and % clay = 4.92 + 44.44
P for 410 nm. These findings indicate that there is potential for
development of a laboratory procedure to rapidly determine the texture
of soil samples.
2.258 Dolui and Maity (2004) was studied the “Nature of Soil Acidity in
Relation to Different Forms of Iron and Aluminium of Some
Alfisols of West Bangal.” Acid soils of West Bangal, belonging to the
order Alfisols, were studied to characterize the nature of acidity in
relation to different forms of iron and aluminium. The mean contents of
iron and aluminium, extracted by various extracting reagents, were
found to be in the following descending order: Dithionite > oxalate >
pyrophosphate >KCl > ammonium acetate. The electrostatically bonded
EB-H+ and EB-Al3+ acidities constituted 32 and 68%, respectively of
exchangeable acidity while EB-H+, EB-Al3+, exchangeable and pH-
dependent acidities comprises 7, 15, 22 and 78%, respectively of total
potential acidity. Correlation between different forms of acidity and Fe
and Al in soils suggested that the effects of different forms of Al was
more dominant, which directly participate in the formation of different
forms of acidity.
2.259 Zeng-Yie Hseu and co-workers (2004) studied the
“TRANSITIONAL SOIL CHARACTERISTICS OF ULTISOLS
AND SPODOSOLS IN THE FOREST OF TAIWAN.” Soil analysis,
including field description, physical and chemical analyses, and micro
morphological studies, was used to study the soils. The soil colors are
DocumentsPDFComplete
Click Here & UpgradeExpanded Features
Unlimited Pages
198
close to 7.5YR 5/6 in all subsurface horizons with different degrees of
spodic material accumulation. Various clay coatings and pellet-like
aggreagates were found in all subsurface horizons, which satisfied the
morphological and chemical criteria for a spodic horizon (Bhs) as
defined in Soil Taxonomy. The illuvial clay coatings have relatively
weak birefringence but are masked by organo-metallic complexes.
Spodosols were found locally to have a thick organic layer, which may
intensity the podzolization process. We hypothesized that Fe and Al
were chelated by organic matter in the surface portion of the pedon to
form organo-metallic complexes. The translocation of clay occurred
before the illuviation of organo-metallic complexes in the subsurface
horizons during soil development. The slow accumulation of organic-
metallic complexes in the Bhs horizons within the 50 cm depth is
attributed to fine texture and less porosity. The soils derived from two
pedogenic process to show the transitional status between Ultisols and
Spodosols that the argillic horizon is overlain by the spodic horizon.
2.260 Patel et al. (2004) reported the “Heavy Metal Content of Different
Effluents and their Relative Availability in Soils Irrigated with
Effluent Waters around Major Industrial Cities of Gujarat.” The
soil, plant, effluents and well-water samples collected were analysed for
the relevant parameters. The COD value of effluents from Ankleshwar
site was extremely high, while the BOD values were within the saft limit
in all the cases. The effluents from Ankleshwar site were the most
polluted with respect to different elements viz. Fe, Cu, Mn, Cd, Ni, Co
and Cr. The dissolved oxygen was observed only in well-water and not
in effluents. The results of relative availability of trace and heavy metals
indicated that Cu, Pb, Zn and Cd were the most available elements in
different soils. However, the soils continuously irrigated with effluents
DocumentsPDFComplete
Click Here & UpgradeExpanded Features
Unlimited Pages

199
showed the highest Cu availability and Mn, Cu, Cd and Ni moderately
available, while Fe and Cr indicated low availability.
2.261 Sharma et al. (2004) studied the “Characterization of Cultivated
Soils of Neogal Watershed in North-West Himalayas and their
Suitability for Major Crops.” Six typical pedons representing
cultivated soils of Neogal watershed in North-West Himalayas occurring
on river terraces and hill slopes viz. Baun, Talinu, Phata, Gopalpur,
Bhattu and Mahadev were studied for their morphological
characteristics and physico-chemical properties and suitability for
locally preferred crops. The soils are acidic in reaction, non-calcareous,
coarse to fine loamy in particle size class, mixed in mineralogy and
medium and medium to very deep and have thermic soil terperature and
udic soil moisture regimes. The soil texture, pH (1:2.5), organic carbon,
CEC, base saturation, water retention at 33 and 1500 kPa ranged from
loamy sand to clay loam, 5.2 to 6.2, 3.2 to 9.5 g kg-1, 4.9 to 14.3 cmol
(p+) kg-1, 46 to 77%, 4.2 to 31.2% and 2.6 to 16.8%, respectively.
Taxonomically, the soils on moderately sloping hill slopes and gently
sloping streams side (Baun and Phata) belong to Typic Udorthents and
Typic Udipsamments and those on gently to moderately sloping river
terraces.
2.262 Madumita Das (2004) was studied “Alliance among Hydro-physical
and Physico-chemical Properties of Soil.” Estimation of water
retention characteristics, penetrability, weighted mean diffusivity and
cation exchange capacity (CEC) of soil is difficult though imperative to
characterize any soil and study the soil water relation. Therefore, with
the measured values of clay, organic and humus carbon, pore space,
DocumentsPDFComplete
Click Here & UpgradeExpanded Features
Unlimited Pages

200
coarse sand, soil volume expansion, pH, saturated hydraulic
conductivity and absolute specific gravity of twelve different soils,
linear, quadratic and logarithmic regressions were evaluated separately
in different relevant combinations for determining the above properties.
Validation of relations reveals that linear and quadratic regressions with
known values of clay, organic carbon and pore space/ soil volume
expansion determine the wilting point successfully, while quadratic
relation was only found suitable to determine the field capacity of soil.
Quadratic equation developed from clay and pore space per cent with
organic/ humus carbon can be used to determine available water
capacity and penetrability of soil. However, the CEC of soil, derived
from all regression functions developed on clay content, organic carbon,
and soil volume expansion / pH, was found in good agreement with the
actual value. The study thus provides some easy alternatives to be
utilized appropriately with the actual value. The study thus provides
some easy alternatives to be utilized appropriately for precise evaluation
of important hydro-physical and physico-chemical soil properties.
2.263 Lama, Mallick and Sanyal (2004) studies of “Solute Transport and
Retention in Some Soils of West Bengal.” Solute transport involving
passage of aqueous electrolytes, namely KCl, K2SO4 and MgCl2 in
vertical columns of soils from four locations, namely Baruipur,
Gayeshpur, Kalimpong and Matimahal at two different compactions
levels has been studied. The experimental data were analysed to obtain
the hydraulic conductivity, solute accumulation and breakthrough curves
for the aqueous electrolytes in the given soils. The hydraulic
conductivity of the aqueous electrolytes through the soils decreased with
the increase in compaction. Baruipur soil having high clay and organic
DocumentsPDFComplete
Click Here & UpgradeExpanded Features
Unlimited Pages

201
matter contents gave distinctly lower values of hydraulic conductivity
for K2SO4 than those for KCl. The values of solute accumulation
parameter ‘r’ for Baruipur and Gayeshpur soils were greater than those
for other soils for each solute over the entire permeation period. This
may be due to the presence of smectitic and illitic clay minerals having
high specific surface area. The value of ‘r’ in all the soils was greater for
the passage of aqueous potassium salts as compared to aqueous MgCl2.
This may have arisen from the presence in these soils of considerable
amounts of illitic minerals having a high degree of specificity for
retaining K+ ions. The sigmoid shape of the breakthrough curves (BTCs)
for the electrolytes indicated hydrodynamic dispersion. The shifting of
the BTCs to the left of the inflexion point suggested the preferential
flow of solute in the large pores. The shift was minimum for the
Matimahal soil having lowest clay and organic matter contents. On the
other hand, the shifting was greater for Kalimpong soil than for Baruipur
soil despite the fact that the former had lower clay and organic matter
contents, possibly due to greater size of aggregates in the former.
2.264 Dianquing Lu and co-worker (2004) studied the “EFFECT OF
CHANGING BULK DENSITY DURING WATER DESORPTION
MEASUREMENT OF SOIL HYDRAULIC PROPERTIES.” The
objective of this study was to investigate bulk density changes during
water desorption measurement and the effects of these changes on soil
hydraulic properties. Soil water characteristic curves were measured by
a pressure plate technique for five soils with textures ranging from silt
loam to clay loam. Bulk densities of the soils were determined at all
equilibrium pressure values during the water desorption measurements.
Measured water characteristic curves for the soils were described by the
DocumentsPDFComplete
Click Here & UpgradeExpanded Features
Unlimited Pages

202
Brooks and Corey model. Measured water characteristic curves with
changing bulk density were compared with those derived from using
four characteristic bulk densities – assigned, packing, averaged, and
optimal – for five soils. Results showed that there were measerable
changes in bulk density during the pressure plates tests for the four
characteristic bulk densities, the differences between fitted Brooks and
Corey soil water characteristics curves and those derived from measured
bulk density data at each pressure were the smallest for the optimal bulk
density. The optimal bulk densities were associated with a pressure of
about 0.7m. For each soil, estimated hydraulic conductivities and water
diffusivities were smaller for the larger characteristic bulk density
values.
2.265 Bhattacharya and co-worker (2004) studied the “Effect of Long-term
Manuring on Soil Organic Carbon, Bulk Density and Water
Retention Characteristics under Soyabean-Wheat Cropping
Sequence in North-Western Himalayas.” The dyanamics of soil
characteristics was studied in an on going long term fertility experiment
since kharif 1973 at Hawalbagh, Uttaranchal with 6 treatments (viz. NP,
NK, NPK, N+FYM, NPK+FYM and Control) comprised of
recommended levels of N, P, K and FYM @ 10 Mg ha-1. The manure
and fertilizers were given in soybean crop every year and wheat crop
was grown on residual fertility. Depthwise (0-15, 15-30 and 30-45 cm)
soil samples and undisturbed soil cores from all the treatments were
studied for oxidizable and non-oxidizable organic carbon (OC), bulk
density (BD), soil-water retention and available water capacity. Both
oxidizable and non-oxidizable soil OC contents of the soil were higher
in FYM treated plots at the first two depths (1.31 and 10.44 g C kg-1 in
DocumentsPDFComplete
Click Here & UpgradeExpanded Features
Unlimited Pages

203
0-15 cm; 1.87 and 8.44 g C kg-1 in 15-30 cm, respectively for
NPK+FYM treatment) and were significantly higher than all other
treatments. The BD was minimum in NPK+FYM treatment in all the
depths (1.24, 1.24 and 1.25 Mg m-2, respectively) and it had a negative
correlation with OC content. It has also been found that decrease in BD
per unit increase in non-oxidisable OC content over initial soil was more
than decrease in BD per unit increase in oxidizable OC content. Water
retention on volumetric basis decreases with increasing depth and
suction within a particular treatment, the highest water retention was
found in FYM combined treatments. Available water capacity was
maximum in N+FYM and NPK+FYM treatments and showed a
decreasing trend with depth. The N+FYM treatment has a net gain of
2.85 cm (per 45 cm soil layer) of available water over control in 29
years while NPK+FYM treatment has the gain of 3.45 cm.
2.266 Jena and co-worker (2004) studied the “Transport of Nitrogen
Contained in Urea Super Granules Placed in Flooded Rice Soils.” A
field experiment was conducted during 1995 to study the transport of N
species originating from 1g urea super granules (USG) point-placed in
the rice root zone at 0.025 and 0.05 m soil depth. Veolcity of urea-N at
0.20 m soil depth was higher than that of NH +
4 -N. The velocity of water
was lower than urea-N and NH +
4 -N. Nitrogen in the form of urea N and
NH +
4 -N to the extent of 20-55% of applied USG-N was detected in soil
solution collected at 0.20 m soil depth. Downward movement of NH +
4 -N
was higher than upward diffusion from the point of placement of USG.
No NO −
3 -N was detected in the soil solution. Manual placement of USG
at 0.05 m soil depth increased both grain and straw yield significantly
over surface application of prilled urea at same N dose. On the other
DocumentsPDFComplete
Click Here & UpgradeExpanded Features
Unlimited Pages

204
hand, grain yield due to mechanical application of USG was at par with
that of yield due to the application of USG manurally. Mechanical
placement of USG at 0.05 m soil depth in flooded rice soil will be cost-
effective and economical without much reduction in yield.
2.267 Brye and West (2005) studied “GRASSLAND MANAGEMENT
EFFECTS ON SOIL SURFACE PROPERTIES IN THE OZARK
HIGHLANDS.” The objective of this study was to characterize the
effects of prairie conversion to agricultural grasslands on soil properties
in the Ozark Highlands of northwest Arkansas. Three native prairie sites
were identified with adjacent grazed or hayed grasslands on silt-loam
soils. Four prairie-agricultural grassland comparisons were made for this
study, with each comparison occurring on the same soil-mapping unit.
Conversion of native prairie to grazing and hay harvesting created
significantly (P < 0.05) higher bulk density, soil pH, and extractable P,
Mg, and Mn within the top 10 cm. There was a significantly (P < 0.2)
larger difference in electrical conductivity, extractable K, Na, and Fe,
but a significantly smaller difference in total N and C and organic matter
concentration, in the top 10 cm between prairie-grazed and prairie-
ungrazed land use combinations. Overall, soil surface properties of
agricultural grasslands in the Ozark Highlands were similar to those of
native on disturbed prairie, indicating that either negligible responses
occurred following conversion, parameters recovered to original
equilibrium levels, or the magnitudes of agricultural inputs following
conversion were too low to change equilibrium levels substantially.
2.268 Olness and Archer (2005) studied the “EFFECT OF ORGANIC
CARBON ON AVAILABLE WATER IN SOIL.” A model of water-
holding characteristics of soil is needed to develop a systematic method
DocumentsPDFComplete
Click Here & UpgradeExpanded Features
Unlimited Pages

205
for determining the value of organic C in soil. In the United States,
available water-holding capacity (AWC) in soil is that water retained in
soil between field capacity and the permanent wilting point; these limits
are approximated by that water retined between two energy limits: -
1500 matrix potential (hygroscopic and micropore water) and about -33
k Pa matrix potential (capillary rise). The General Energy Model for
Limited Systems (GEMLS) was used to describe the effects of clay, silt,
and organic C content and silt content. The data from each subset were
plotted as a function of soil clay content. Because of an apparent matrix
transition effect, two complementary GEMLS functions were used to
describe the -33 kPa and -1500 kPa water content as a function of soil
clay, silt, and organic C content. The model used six parameters (two
function coefficients, two energy coefficients, and two critical clay
contents), and required an initial manual fit of the models to the data
subsets (about 100 ± 20 observations). Criteria for acceptance were
uniform and homogenous distribution of the model residuals, absence of
a detectable trend in the residual distribution, zero error sum, and
maximal R2. The primary energy coefficients were correlated with silt
content. After the initial manual fit, the data were subjected to analysis
using the SAS PROC MODEL procedure and a variable energy
coefficient. Subsequent analyses indicated a complex relationship
between the energy coefficients and the soil organic C content. A 1%
increase in soil organic carbon causes a 2 to > 5% increase in soil AWC
depending on the soil texture.
2.269 Solomon et al. (2005) studied a “Carbon K-Edge NEXAFS and
FTIR-ATR Spectroscopic Investigation of Organic Carbon
Speciation in Soils.” They used C (1s) near-edge x-ray absorption fine
DocumentsPDFComplete
Click Here & UpgradeExpanded Features
Unlimited Pages

206
structure (NEXAFS) and synchrotron-based Fourier transform infrared-
attenuated total reflectance (FTIR-ATR) spectroscopy to speciate C and
investigate the influence of land use on the composition of SOM in the
humic substances extracted from clay and silt fractions. Soil samples
were collected from natural forest, tea and Cupressus plantations and
cultivated fields in Ethiopia. Carbon K-edge spectra revealed multiple C
(1s) electron transitions in the fine structure of C NEXAFS region (284-
290 eV) indicating the presence of aromatic-C, phenolic-C, aliphatic-C,
carboxylic-C, and O-alkyl-C in the humic substances. It also exhibited
good selectivity, where specific energy regions correspond to C in
discrete functional groups. However, regions of slight overlap between
1s-3p/σ* transition of aliphatic-C and 1s-π* transition of carboxylic-C
may not be excluded. Fourier transform infrared-attenuated total
reflectance spectroscopy showed larger proportions of aromatic-C
(25.5%, 21.9%) and asymmetric and symmetric aliphatic-C (19.7%,
15.2%) groups in the silt than in clay, respectively. However, smaller
proportion of polysaccharides (19.3%, 11.5%) was obtained from the silt
compared with clay. The proportions of phenols (20.7%, 20.4%),
aliphatic deformation of CH2 or CH3 (13.1%, 14.5%), and carboxylic
(9.8%, 8.3%) groups were of similar magnitude in both fractions. The
proportion of polysaccharides decreased in the order: natural forests >
plantations > cultivated fields, while recalcitrant aromatic-C increased in
the order: natural forest < plantation < cultivation.
2.270 Brouder, Hofmann and Morris (2005) were reported the “Mapping
Soil pH: Accuracy of Common Soil Sampling strategies and
Estimation Techniques”. Our objective was to compare the accuracy of
spatially continuous pH and lime requirement (LR) maps derived from
DocumentsPDFComplete
Click Here & UpgradeExpanded Features
Unlimited Pages

207
commercially used approaches to sampling and LR prediction at
unsampled locations. We evaluated point (P) sampling on 0.1-, 0.4-, and
1.0-ha grids and area composite (AC) sampling by 1-ha grids, soil type
(ST), and whole field (WF). Inverse distance (ID) weighting and
ordinary kriging were applied to water pH and LR data from 11 fields.
Modeling of semivariance identified range parameters of ≤ 100 m. For
intensive P sampling (0.1- or 0.4-ha grids), kriging was occasionally
more accurate than ID weighting but mean absolute error (MAE)
differences were small (≤ 0.01 pH units and ≤ 0.13 Mg lime ha-1),
suggesting little practical consequence to prediction method selection.
One-hectare point data were too sparse to produce variograms and
applying ID weighting to these data found only small advantages over
WF compositing. Lime use was either unaltered or minimally reduced
(10%) by 1-ha P as compared with WF compositing. When compared
with WF composites, map prediction efficiencies (PEs) based on mean
square error (MSE) analysis ranged from 7 to 51, -13 to 40 and -6 to
54% for ST compositing, 1- and 0.4-ha P sampling, respectively. These
results suggest ST compositing remains viable and cost-effect for pH
management, especially where ancillary information exists to verify
distinct soil series boundaries.
2.271 Sorensen and Dalsgaard (2005) studied “Determination of Clay and
Other Soil Properties by Near Infrared Spectoscopy.” The feasibility
of using near infrared (NIR) spectroscopy for rapid non-destructive
prediction of clay and other soil properties was investigated. Soil from
all regions of Denmark was used to develop universal NIR
spectroscopic calibrations. Samples were packed in a rectangular
sample cell with a surface area of 60 cm2 and the cell was moved
during measurements using a transport module. Reflectance was
DocumentsPDFComplete
Click Here & UpgradeExpanded Features
Unlimited Pages

208
measured in the 400- to 2500-nm range and instrument calibration was
performed by partial least square (PLS) regression. The accuracy and
robustness of NIR equations for determination of clay was dependent on
the calibrated concentration range, the spectral regions used for
calibrations and the spectral pre-treatment procedure. The optimal
narrow range calibration for clay (1-26% clay) gave predication errors
of 1.7 to 1.9% while the prediction error for the optimal broad range
calibration (3-74% clay) was estimated as 3.4%. The estimated true
accuracy was 1.5 to 1.7% (1-26% clay). By comparison, the
reproducibility standard deviation of the reference method was 1.3%.
For C, silt and sand, the prediction erros were 0.42, 4.6, and 5.5%
respectively. The ratios between analyte variation range standard
deviation and prdidtion error were 3.1 (1-26% clay), 4.7 (3-74% clay),
2.4 (C), 2.0 (silt), and 2.4 (sand). The results demonstrate that NIR
spectroscopy is a potential technique for rapid and cost-effective
determination of clay in a soil. The technique may also be useful in
prediction of other particle-size fractions. The investigated technique
was less suitable for determination of total C in Danish soil samples.
2.272 C.E. Allen (2005) was studied a “Physical and Chemical
Characteristics of Soils Forming on Boulder Tops, Kärkevagge,
Swedan.” However, these studies have overlooked soils that are
forming on the uppermost surface of the boulders that give Kärkevagge
its name, “Valley of the Boulders.” The physical and chemical
characteristics of the soils forming on boulder tops are therefore
examined herein. Soil samples were collected from 20 large boulder
tops and analysed according to standard procedures. The boulder-top
soils were weakly developed, < 27-cm deep, coarse-textured, weak-
structured, and well-drained. There was minimal horizonation. Physical
DocumentsPDFComplete
Click Here & UpgradeExpanded Features
Unlimited Pages

209
characteristics of the boulder-top soils are comparable with the alpine
soils in the region. Soil reactions were very acidic, with low base
saturation and low cation exchange capacity (CEC). Chemical
characteristics are similar to soils in the rest of the watershed, whereby
extractable Ca > Mg > K > Na in the soils, albeit the values are
substantially lower overall in the boulder-top soils than for the rest of
the Kärkevagge. Although the boulder top soils were weakly developed,
there was incipient pedogenesis as exemplified by the presence of
pedogenic Fe. The boulder-top soils were classified as loamy-skeletal,
micaceous, acid Lithic Cryothents. Results illustrated that, like the rest
of Kärkevagge, chemical weathering is an important contributing
process in boulder-top soil formation, and that the boulder-tops provided
a unique opportunity to evaluate incipient pedogenesis in an arctic-
alpine setting.
DocumentsPDFComplete
Click Here & UpgradeExpanded Features
Unlimited Pages

CHAPTER III
A BRIEF DESCRIPTION
OF THE STUDY AREA
DocumentsPDFComplete
Click Here & UpgradeExpanded Features
Unlimited Pages

210
3.1 DESCRIPTION OF THE STUDY AREA
The study area selected for the present work is situated in the
Kumaon region of the Uttarakhand state (formerly known as
Uttaranchal state) of India. The total are of Uttarakhand state is 53,484
sq. km. Tibet, China and Nepal countries touch the boundaries of
Uttarakhand state. In India, Himanchal Pradesh, Haryana and Uttar
Pradesh are the three main neighbouring states of Uttarakhand state.
There are thirteen districts in this state. Based on the situation of these
districts, the approach by road and convenience in administrative
implementations the Uttarakhand state has been divided into two
regions/divisions namely Kumaon and Garhwal devisions. Kumaon
region is situated between 28043'24" to 31027'5" North latitude and
77034'27" to 81002'22" East longitude. The location of the Uttarakhand
state has been shown in Fig. 3.1.
The entire study area has been divided into various sites depending
upon the criteria given below:
(i) The site represents the agricultural fields/areas of a specified portion of
the land used or likely to be used by the farmers.
(ii) The sites are separate and different from each other in terms of distance
as well as Physical/Chemical properties of the soils as evidenced by the
preliminary examinations.
The three major regions selected for the present study have been
described as follows:
(1) Hill Region
Four sites were selected from Hill region. Fig. 3 represents the
sites, which describe the location of the study area:
DocumentsPDFComplete
Click Here & UpgradeExpanded Features
Unlimited Pages

211
(i) Site No.1: Bhimtal: This site is close to Bhimtal and situated on the
Bhowali road. The land is mostly covered by green grass.
(ii) Site No. 2: Maharagaon: This site is about 5 km far from Bhimtal on the
Bhimtal-Bhowali road. The land is mainly used for agriculture. Fertilizers
are used according to the requirements of crops.
(iii) Site No. 3: Khalkwira: This site is situated in the east of Bhowali town
and is about 2 km far from Bhowali. There are orchards of plums
(a famous fruit of Uttarakhand) around this site.
(iv) Site No. 4: Nauligarh: This site is about 3 km far from Bhowali on the
Bhimtal-Bhowali road on the western side.
(2) Bhabar Region
Four sites were selected from Bhabar region. Fig. 3 represents the
sites, which describe the location of the study area:
(i) Site N0. 5: Haldwani: This site is close to Haldwani proper near Dhan-
mill on Haldwani-Rampur road. It is mainly used for agricultural
purposes as it is connected by canals for irrigation purposes.
(ii) Site No. 6: Gajraula: This site is about 9 km. from Haldwani on the
Haldwani-Kaladhungi road. It is also used basically for agricultural
purposes.
(iii) Site No. 7: Kathgodam: This site is near Kathgodam railway station on
Kathgodam-Nainital road. The main soil of this site is directly or
DocumentsPDFComplete
Click Here & UpgradeExpanded Features
Unlimited Pages

212
indirectly affected by the falling leaves as it provides “humus” to the
land.
(iv) Site No. 8: Kusumkhera: This site is about 3 km far from Haldwani on
the South-west direction. The land is mainly used for agricultural
purposes.
(3) Tarai Region
The study ares of the Tarai-region has been selected from Khatima,
Sitarganj, Rudrapur and Pantnagar cites/towns of the Udham Singh Nagar
district of Uttarakhand state. Five sites from Khatima area and two sites
each from the Sitargang, Rudrapur and Pant Nagar areas were selected for
the present work.
Fig. 4 to Fig. 6 represents the location of the sites of the study area
in this region.
(A) Khatima: The study area of Khatima was divided into five sites for the
present study.
(i) Khatima (Banusa) (Site -1 ⇒ S1)
This site is situated at about 9 km away in the western part of
Khatima Block. The site is about 2-3 km along the main road. This site is
one of the main agricultural areas of Khatima region.
(ii) Khatima (Jhankat) (Site -2 ⇒ S2)
The site is about 8 km away from Khatima Tehsil on the western
part of Khatima. It is a barren land and its adjoining land is mainly used
for agricultural purposes.
DocumentsPDFComplete
Click Here & UpgradeExpanded Features
Unlimited Pages

213
(iii) Khatima (Amaun) (Site -3 ⇒ S3)
The site is about 2 km far from Khatima Tehsil along Tanakpur
road in the northern direction of Khatima. The study area is lying barren
since a long period.
(iv) Khatima (Chakerpur) (Site -4 ⇒ S4)
The site is about 7 km far from Khatima Tehsil in the northern
direction. The population density is very low in this area. As it is
surrounded by the forest, it is rich in “humus”.
(iv) Khatima (City) (Site -5 ⇒ S5)
The site is close to the Khatima Tehsil and the adjoining
playground of the area. Therefore this site is also lying barren since a
long period. This site may have the larger impact of the urban population,
animals and other ecological factors.
(B) Sitarganj: The Sitarganj area was divided into two sites for present work.
The two sites of this area are as follows:
(i) Sitarganj - 1 (Site -6 ⇒ S6)
This site is present on Sitarganj by pass road. It is an agricultural
land on which mainly seasonal crops are grown.
(ii) Sitarganj - 2 (Site -7 ⇒ S7)
This site is close to Sitarganj town. It is an agricultural land and
people dump their garbage on the land near this site.
DocumentsPDFComplete
Click Here & UpgradeExpanded Features
Unlimited Pages

214
(C) Rudrapur: Two sites were selected from Rudrapur.
(i) Rudrapur -1 (Site -8 ⇒ S8)
This site is about 3.5 km before Rudrapur on Rudrapur-Haldwani
road. The land is mainly used for agricultural purposes. The soil of this
land is affected by ecological factors.
(ii) Rudrapur -2 (Site -9 ⇒ S9)
The site is about 1 km far from Rudrapur Bus-stand.
(D) Pantnagar: Two sites were selected from the Pantnagar area for this
study
(i) Pantnagar-1 (Site -10 ⇒ S10)
This site is about 3 km from Pantnagar on Haldi-Rudrapur road.
This site is agricultural land on which some guava trees are also grown.
This site is surrounded by mango and guava trees.
(ii) Pantnagar-2 (Site -11 ⇒ S11)
This site is about 6 km far from Pantnagar on Rudrapur road. This
site is near the main road.
DocumentsPDFComplete
Click Here & UpgradeExpanded Features
Unlimited Pages

CHAPTER IV
MATERIALS AND
METHODS
DocumentsPDFComplete
Click Here & UpgradeExpanded Features
Unlimited Pages

215
4.1 CHEMICAL AND REAGENTS
The following chemicals and reagents were used in the present work:
S.No. Name of the Chemicals/Reagents Specifications
1. Acetic Acid (glacial) AR Grade
2. Boric Acid AR Grade
3. Calcium Carbonate AR Grade
4. Copper Sulphate AR Grade
5. Diphenyl Amine AR Grade
6. Bromo-Cresol-Green AR Grade
7. Hydrochloric Acid (Con.) AR Grade
8. Sulphuric Acid AR Grade
9. Ortho Phosphoric Acid AR Grade
10. Sodium Hydroxide AR Grade
11. Sodium Acetate AR Grade
12. Sodium Fluoride AR Grade
13. Sodium Chloride AR Grade
14. Sodium Bicarbonate AR Grade
15. Ammonium Hydroxide AR Grade
16. Ammonium Fluoride AR Grade
17. Ammonium Molybdate AR Grade
18. Potassium Dichromate AR Grade
19. Potassium Sulphate AR Grade
20. Potassium Chloride AR Grade
21. Ferrous Ammonium Sulphate AR Grade
22. Zinc Sulphate AR Grade
23. Manganese Sulphate AR Grade
DocumentsPDFComplete
Click Here & UpgradeExpanded Features
Unlimited Pages

216
24. Methyl Red (Indicator) AR Grade
25. Activated Charcoal (Darco G-60) AR Grade
26. Methanol AR Grade
27 Ammonium Acetate AR Grade
28. Selenium Metal AR Grade
29. Ethyl Alcohol (95%) Rectified AR Grade
30. Stannous Chloride AR Grade
31. Nitric Acid BDH
32. Phenolphthalein BDH
4.2 APPARATUS/ EQUIPMENTS USED
The following apparatus/equipments were used in the present study:
S.No. Name of the Equipments/Apparatus Specifications
1. Digital pH meter (Microprocessor based) Systronics µ pH-362
2. Magnetic Stirrer Tempo
3. Auto titrator Systronics-351
4. Conductivity meter (Digital Microprocessor based) Systronics-306
5. Centrifuge with Centrifuge tube Remi 4C
6. Shaker Electrical Toshiba
7. Water bath Sonar
8. Flame Photometer with (Na, K, and Ca) filters Systronics Mediflame
9. Hot air oven (small) RTSE
10. Atomic Absorption spectrophotometer Cameto 201
11. Grinding mortar Toshiba
12. Micro Kjeldahl apparatus Toshiba
DocumentsPDFComplete
Click Here & UpgradeExpanded Features
Unlimited Pages

217
13. Digestion block (with auto cut device) Toshiba
14. U.V.-VIS 119 (computer based) Systronics 119
15. Triple Distillation Assembly NPL
16. Separating funnel Pyrex Glass
17. Electrical balance (Single Pan) Verbal 200 Super
18. Pestal Mortar Toshiba Fishr type
19. Volumetic flask Pyrex Glass
4.3 PREPARATION OF THE REAGENTS
1. Ammonium acetate solution (1.0N) CH3OONH4
154.0g Ammonium acetate was dissolved in 1.8L of distilled water in
2L volumetric flask. The pH was adjusted approximately at 7.0 with dilute
ammonium hydroxide or acetic acid which ever was required and final volume
was made up to 2L. This was stored in Pyrex bottle. 1.0N Ammonium acetate
solution was also prepared by the following method:
57 mL glacial acetic acid and 59 mL of conc. ammonium hydroxide
were taken in a 1L volumetric flask. 900 mL of distilled water were added to
dilute it. pH was adjusted at 7.0 by adding more NH4OH or CH3COOH as per
requirement and final volume was made to 1L by distilled water. This solution
was stored in a polypropylene bottle.
2. Ammonium Molybdate Solution [(NH4)6Mo7O24.4H2O]
40.0g of ammonium molybdate ((NH4)6Mo7O24.4H2O) were dissolved in
1 L of distilled water to prepare this solution.
DocumentsPDFComplete
Click Here & UpgradeExpanded Features
Unlimited Pages

218
3. L-Ascorbic Acid Solution
52.8g of L-ascorbic acid (C6H8O6) were dissolved in 1000 mL of
distilled water.
4. Sodium Acetate Solution (1.0N) CH3COONa
136.0g of sodium acetateTrihydrate was dissolved [CH3COONa.3H2O]
in distilled water and diluted to 1L in a volumetric flask. The pH of this solution
was 8.2 – 8.3 approximately in a 2L volumetric flask.
5. Mixed Indicator
1.0 g of Bromo-cresol-green and 0.2 g of methyl red were dissolved in
100 mL of 95% Ethanol. The pH was adjusted at 4.2 (drak green) with NaOH.
6. Standard Calcium Carbonate (CaCO3) solution (0.01N)
0.5g of pure Calcium Carbonate was dissolved in 10 mL of
approximately 3NHCl and the solution was diluted to 1L.
7. 0.5N Sodium Bicarbonate (NaHCO3) or Olsen’s Extraction Solution
84.0g of NaHCO3 were dissolved in 2L of distilled water, which was
mixed up throughly, and the pH was adjusted with dilute HCl or NaOH at 8.5 as
per requirement.
8. Potassium Dichromate (1.0 N) (K2Cr2O7)
Oven dry 49.04 g of K2Cr2O7 were dissolved in distilled water. Final
volume was made up to 1L using distilled water.
DocumentsPDFComplete
Click Here & UpgradeExpanded Features
Unlimited Pages

219
9. Ferrous Ammonium Sulphate (0.5N)
196.0 g of ferrous ammonium sulphate were dissolved in 800 mL of
distilled water. 20 mL of Conc. H2SO4 were added to this solution and final
volume was made to 1 litre.
10. 4% Boric acid solution
20.0 g of Boric acid crystals were dissolved in 400 mL of distilled water
and the volume was made up to 500 ml in a volumetric flask.
11. Diphenyl Amine Indicator
0.5 g of Diphenyl Amine was dissolved in the mixture of 20 mL of
water and 100 mL of Conc. H2SO4.
12. Digestion Mixture
200.0g of K2SO4, 20.0 g of CuSO4.5H2O and 2.0 g of Selenium metal
were mixed thoroughly but very carefully because Selenium (Se) is very toxic
in nature.
13. Standard Stock P-Solution
0.439 g oven dry Potassium dihydrogen orthophosphate (KH2PO4) were
dissolved in 500 mL of distilled water. 25 mL of 7N H2SO4 of were added and
the volume was made up to 1L with distilled water, which gives 100 ppm
standard stock solution of P (100 µg L-1). Out of the above solution 1 mL, 2 mL,
and 5 mL volumetric flask separately and the volume was made upto 100 mL in
DocumentsPDFComplete
Click Here & UpgradeExpanded Features
Unlimited Pages

220
each case. These were the working standards of P of 1, 2 and 5 ppm
respectively.
14. Murphy-Riley Colour Developing Solution
It was formed by mixing of 250.0 mL of 2.5 M H2SO4, 75 mL of
Ammonium Molybadate solution, 50 mL of L-ascorbic acid solution, 25 mL of
antimony potassium tartrate solution and finally 100 mL of distilled water. All
above solution mixed over a magnetic stirrer in 500 mL of volumetric flask.
15. Bary and Kurtz Extracting Solution
11.1 g of NH4F were dissolved in 100 mL of distilled water. 1L of
distilled water, containing 20 mL of conc. HCl, was added in the above solution
and finally it was diluted up to 10 L. This solution was stored for a long time in
a polyethylene bottle.
16. Antimony Potassium Tartrate Solution
2.908 g of Antimony Potassium Tartrate [K(SbO)C44O6.1/2H2O] were
dissolved in 1000 mL of distilled water to prepare this solution.
17. Standard KCl Solution
1.908g oven dry KCl were dissolved in distilled water and volume was
made up to 1L, which gave 100 ppm stock solution. 100 mL of this solution was
taken in a 1 L volumetric flask and volume was made up to 1L with a 1.0 N
ammonium acetate solution which gave 100 ppm working standards were made
from the above solution after pipetting out 0.5, 10, 20 mL of the stock solution
DocumentsPDFComplete
Click Here & UpgradeExpanded Features
Unlimited Pages

221
in 100 mL volumetric flasks diluted with 1.0 N ammonium acetate solution in
each case.
18. Standard NaCl Solution
5.845g of oven dry NaCl were dissolved in 1.0N ammonium acetate and
the final volume was made upto 1L in a 1L volumetric flask. It was 100 milli
equivalents/L solution of Sodium Chloride (NaCl). Working standards of this
solution were prepared by taking 1, 2.5 and 5 mL of the above solution in 100
mL volumetric flasks and final volume was made up to 100 mL by further
addition of 1.0N ammonium acetate solution in each case.
19. Extracting Solution for Micronutrients
0.005M DTPA, 0.01 M CaCl2-2H2O and 0.1 M TEA (Triethanolamine)
adjusted to pH 7.3. Dissolved 1.967g DTPA and 13.3 mL TEA in deionized or
glass distilled water. Add 1.47g CaCl2.2H2O or glass distilled water taken in one
liter volumetric flask and add the DTPA TEA mixture to it and make final
volume to about 900 mL adjust pH to 7.3 using 1N.HCl. To make the final
volume to one liter and mixed thoroughly.
20. Stock Standard Solution of Microelements
The Standard Solution of different micronutrient cation are prepared
preferably by using their foil or wire (AR Grade). Dissolve 0.1g of the foil in
dilute HCl (1+1) and make the volume to one liter with deionized water to
obtain 100 µg/mL (i.e. mg/L or ppm) solution of every micronutrient cation.
Alternatively, analytical grade salts can be used to prepare Stock
Standard Solution of different micronutrients. The quantity of the salt to be
DocumentsPDFComplete
Click Here & UpgradeExpanded Features
Unlimited Pages

222
dissolved its chemical formula, and concentration of receptive stock solution in
given below.
S.
No.
Element Atomic
Wt.
Salt to be used Con. of
Stock
Quantity (g) to be dissolved
in 1L of Solution
1. Zn 65.38 ZnSO4.7H2O 100 0.4398
2. Fe 55.85 FeSO4.7H2O or
FeSO4(NH4)2.6H2O
100 0.4946
3. Cu 63.54 CuSO4.5H2O 100 0.3928
4. Mn 54.94 MnSO4.H2O 100 0.3076
The amount of salt as given above was dissolved in a small volume of
water fillowed by shaking after adding about 5 mL of 1.5 sulphuric acids. The
contents were than diluted to one liter with deionized or glass distilled water.
Working Standard Solutions
(i) Zinc (Zn): Transfer 10 mL of Stock Standard solution of 100 mL
volumetric flask and dilute up to the mark with DTPA extracting solution
to have a Stock Solution of (10 µg Zn/mL) to a series of 100 ml
volumetric flasks and each diluted each to the mark with DTPA
extracting solution. This will give Standard Solution having zinc
concentration 0, 0.1, 0.2, 0.4, 0.6 and 0.8 (µg/mL) (ppm).
(ii) Iron (Fe): Transfer 0, 1, 2, 4, 6 and 8 mL of Stock Solution (100 µg Fe
ml or 100 ppm Fe) were transfer to a series to 100 mL volumetric flasks
and diluted each to the make with DTPA extracting solution. This will
give standard solution having iron concentration of 0, 1, 2, 4, 6, and 8
µg/mL (ppm).
DocumentsPDFComplete
Click Here & UpgradeExpanded Features
Unlimited Pages
223
(iii) Copper (Cu): Transfer 0, 1, 2, 4, 6 and 8 mL of Stock Solution
containing 100 µg Cu/mL (100 mL Cu) were transferred to a 100 mL
volumetric flask and each was diluted to the mark with DTPA extracting
solution. It gave Standard Solution having Cu concentration 0, 1, 2, 4, 6
and 8 µg /mL (ppm).
(iv) Manganese (Mn): Transfer 0, 1, 2, 4, 6 and 8 mL of Stock Solution
containing (100 µg/mL or 100 ppm Mn) were transferred to a series of
100 mL volumetric flask and each was diluted to the mark with DTPA
extracting solutions. The standard solution thus prepared have the Mn
concentration 0, 1, 2, 4, 6 and 8 µg /mL (ppm).
21. Preparation of Standard Solution of NaOH
A standard solution of NaOH of desired concentration cannot be
prepared by direct weighing. An Indirect method, using a primary standard is
adopted for prepared a standard solution of NaOH of desired concentration.
Primary Standard
The solutions of a substance, which can be prepared accurately by direct
weighing, are known as “Primary Standards”. Substances which hydrolyse or
ionise in water are not suitable for making a “Primary Standard” in water by
direct weighing Oxalic acid is generally used to make a “Primary Standard” of
desired concentrations using water as a solvent.
eg. Preparation of 1.0N NaOH solution
(I) An Oxalic acid “Primary Standard” of a suitable concentration is
prepared in 100 mL is prepared in measuring flask by direct weighing
DocumentsPDFComplete
Click Here & UpgradeExpanded Features
Unlimited Pages

224
using distilled or conductivity water, e.g. in the present case N/10 Oxalic
acid solution would serve the purpose. For making N/10 Oxalic acid (250
mL) 1.575 g of Oxalic acid were dissolved in a 250 mL measureing flask
using distilled water.
(II) NaOH solution approximately twice of the desired concentration is made
by direct quick weighing, using a glazed paper or watch glass.
e.g. If the 2.0N NaOH solution (250 mL) is required, 4N NaOH solution
is prepared in a 250 mL measuring flask by direct weighing i.e. using the
relation:
ENV 40 x 2 x 250 W= = = 20 g
1000 1000
20g of NaOH pallets are dissolved by approximately quick
weighing, using a glazed paper or a watch glass; rider was not used for
approximate weighing. It NaOH is not weighed quickly it will absorb
water from atmosphere, as NaOH is hygroscopic.
(III) This NaOH solution of tritrated N/10 Oxalic acid primary standard taking
1 to 5 mL of Oxalic acid solution as per suitability phenolphthalein was
used as the indicator suppose the normality of this NaOH solution is
found 3.98 N (It is ensured that this concentration is roughly two times or
more than the desired concentration of NaOH to be prepared.
(IV) This required volume of this NaOH (3.98N) is calculated to prepare 2N
NaOH (250 mL) as follows:
N1V1 = N2V2
3.98 x V1 = 2.0 x 250
DocumentsPDFComplete
Click Here & UpgradeExpanded Features
Unlimited Pages
225
2.0 x 250 V1 = = 125.62 mL = 125.6 mL (say) 3.98
(V) 125.6 mL of 3.98N NaOH which was prepared via step (iii) are taken in a
250 mL measuring flask and the volume is made upto the mark by
gradual addition of distilled/conductivity water. These contents are mixed
thoroughly. This solution should be 2.0N NaOH (250 mL). This NaOH
solution so obtained is standardized by titrating 5 mL of this solution
against N/10 oxalic acid using phenolphthalein as indicator. If the NaOH
solution is exactly 2.0N, the desired solution is ready. If the normality of
the NaOH solution after standardardization differs from 2.0N, whatever is
the normality of this NaOH solution should only be taken to be correct
e.g., if it is 2.01N or 1.98N, the NaOH solution is 2.01N or 1.98 N as the
case may be.
Note: Standard solutions of NaOH of different concentrations and the
Standard solution of KOH can also be prepared by the same
procedure.
22. Preparation of a Standard Solution of HCl e.g. Preparation of 1.0N
HCl (250 mL):
(i) A standard solution of NaOH of desired concentration (say 2.0N) is
prepared as described above.
(ii) 1 mL of the Stock Solution of HCl is titrated against the Standard
Solution of NaOH, using phenolphthalein as indicator. Suppose the
normality of the Stock Solution of HCl is N1. The required volume of this
HCl to calculated to prepare 250 mL of 1.0N HCl as follows:
Since,
DocumentsPDFComplete
Click Here & UpgradeExpanded Features
Unlimited Pages

226
N1V1 = N2V2
N1V1 = 1.0 x 250
1.0 x 250 V1 = = Y mL (Suppose.) N1
Y mL of the stock solution of normality N1 are taken in a 250 mL
measuring flask and the volume is made upto mark using distilled
/conductivity water. This should be required 1.0 N HCl. This HCl
solution is standardized using a standard solution of NaOH. The exact
normality of this HCl solution will be the correct normality of the HCl
solution.
Note: Standard solution of different concentrations of HCl and the
Standard Solution of desired Concentration of H2SO4, HNO3 etc. can
also be prepared by the above procedure.
4.4 SOIL SAMPLING
According to Cline (1945), the accurate description of the soil
properties is possible only if the following conditions are fulfilled:
(i) The gross sample accurately represents the whole soil from which it
was taken.
(ii) The sub samples analysed represent the gross sample accurately.
(iii) No changes occur in the gross and sub samples prior to analysis.
(iv) The analysis determines a true value of the soil characteristic under
investigation.
In view of the above the representative soil in the study area was
therefore selected vide the following three phases:
1. Selection of the sites.
2. Selection of the representative soil.
DocumentsPDFComplete
Click Here & UpgradeExpanded Features
Unlimited Pages

227
3. Collection of the soil samples.
1. Selection of the sites
In soil analysis of any region region selection of the sites is the most
important part of the study.
2. Selection of the representative soil
The validity of the soil as a true representative as whole depends upon
the following critieria (Tan; 1995):
(a) The degree of the homogeneity of the sampling volume
The less homogeneous the sampling volume, the greater will be the
sampling error.
(b) Method of sampling
Samples can be collected from a pit with or without exposing the soil
profile or they may be drawn from road banks. They can be taken with a auger.
Samples obtained from soil profile may be better representatives than auger
samples.
(c) The Number of sampling units contributing to the gross samples
The use of several sampling units instead of only one sampling unit may
yield a gross sample providing a closer approximation of the soil. Several small
sampling units, each drawn from a homogeneous part of the pedon yield a better
representation of the whole soil than does a single large sample.
DocumentsPDFComplete
Click Here & UpgradeExpanded Features
Unlimited Pages

228
(iii) Collection of the soil samples
The soil samples were collected by the compositing method.
Compositing is the mixing of sample units to form a single sample, which is
used for Chemical Analysis (Tan; 1995). This method offers the advantage of
increased accuracy through the use of large numbers of sampling units per
sample. In compositing, the fundamental assumption is that analysis of the
composited sample yields a valid estimate of the mean, which would be
obtained by averaging the result of analysis from each of the sampling units
contributing to the composite. (Cline; 1944) indicated that this assumption is
valid only if:
1. The sampling volume represents a homogenous population.
2. Equal amount of each sampling unit contribute to the sub-sample
analysed.
3. No changes should have taken place in the composite and sub-
samples prior to analysis that would affect the analytical results, and
4. An unbiased estimate of the mean is the only objective.
The common procedure in composting is to take a number of
individual sampling units (slices or cores) (Tan; 1945). The number of
sampling units to make one composite sample ranges from 4 to 16. As a
general rule, the total area represented by one composite sample should
not exceed 1 ha (100 m x 100 m), unless the field under investigation is
reasonably homogenous in characteristics or the field can be treated as a
single unit in terms of treatments and cropping sequences.
4.4.1 Mechanics of Sampling
DocumentsPDFComplete
Click Here & UpgradeExpanded Features
Unlimited Pages

229
The soil samples were collected randomely from the selected sites
using soil auger, Carpenter scraw auger, Khurpa and knife. The sample
was collected by cutting a V shaped slice to the proper depth of about 15-
20 cm. The centre of the sample was then cut, lifted with the help of a
knife and was collected in a plastic bag to carry to the laboratory.
4.4.2 Time of Sampling
The samples were collected periodically from the selected sites at
the same time say around 8.00 a.m. on a selected day. Sampling dates
were slected in such a way that these represent the major seasons of the
year viz., autum, winter, spring, dry summer and wet summer. Separate
sampling calendar was made for each parameter to be studied.
4.4.3 Size of the Sample
The size of the sample can be distinguished (Tan; 1995) as follows:
(i) The size /quantity of samples
(ii) The number of the samples
The size of the sample or the size of the sampling unit to be drawn
depends upon three factors:
(a) Coarseness of the material
(b) Objectives of the analysis
(c) The desired accuracy
About 500 mL approximate volume (Half kg) of or particular soil sample
was collected every time.
DocumentsPDFComplete
Click Here & UpgradeExpanded Features
Unlimited Pages
230
4.4.4 Sample Preparation
After the collection of the gross samples, precaution was taken to avoid
further chemical reactions. The soil samples were dried for 24 to 48 h in shade
and were changed into powder. After this samples were preserved in plastic
bags. Each soil sample prepared as above was analysed in the laboratory as
early as possible to avoid adsorption of NH3, SO2, SO3 gases in the laboratory.
4.4.5 Grinding and Sieving
Large soil aggregates were crushed by hand into smaller one and were
further reduced by grinding Grinding Mortar (Toshiba). Grinding provides a
maximum surface area for physical and chemical reactions and reduces the
heterogeneity.
Grinding was followed by sieving for which 0.5, 2.0 mm sieve was
used.
4.4.6 Reduction of the sample size
The sample size was reduced by the Paper Quartering Method. The
soil samples were mixed uniformly. The soil samples were spread over a sheet
of paper, which was divided into four equal parts. 2 and 3 parts were collected
and mixed thoroughly while 1 and 4 parts were discarded. This process was
repeated several times, till approximately ½ kg of the soil remains and right size
of the sample was obtained.
DocumentsPDFComplete
Click Here & UpgradeExpanded Features
Unlimited Pages

231
Fig. 1. Reducing sample size by “Quartering Method”
4.5 SOIL ANALYSIS
Analysis of the soil was carried out under the following two major
categories:
(a) Physical examination
(b) Chemical examination
4.5.1 Physical Examination
Physical examination of the soil sample was done for the following:
(i) Soil Colour
Soil has colour perhaps is the most obvious characteristic of soil at the
first sight. It was used in is differentiating soils of a site from another site. Soil
colour was noted for each sample as it was observed by naked eye at the site.
(ii) Soil temperature
1Discard
2Mix
3Mix
4Discard
DocumentsPDFComplete
Click Here & UpgradeExpanded Features
Unlimited Pages

232
Solar ratidation is the principle source of heat and losses are due to
radiation and convection. The main source of the soil temperature is solar
radiation. The soil temperature is also affects by decomposition of dead organic
matter and forest cover. Soil temperature also depends upon the atmospheric air,
temperature and moisture content of the soil.
Soil temperature was determined for a given sample immediately after it
was collected, with the help of a simple thermometer.
(iii) Soil Water
About 5 to 10 g of the soil sample was placed in a pre-weighed stoppered
100 mL conical flask. The sample was weighed immediately nearest to 0.1 mg.
The flask containing the soil sample was then kept in an oven at 105 0C to
1100C for 24 hrs for drying. The flask was then allowed to cool in a desicator.
The flask was weighted again nearest to 0.1 mg. The amount of water lost
which is the water content of the sample, was calculated as follows:
Water Lost = Mass of the Moist Soil- Mass of the Soil dried in the oven
Suppose,
The mass of the flask = W1g
The mass of flask + Soil before drying = W2g
The mass of flask + Soil after drying = W3g
The mass of the soil before drying = (W2 –W1)g = Xg (suppose)
The mass of the soil after drying = (W3 –W1)g = Yg (suppose)
Amount of H2O lost = (X – Y) g = Zg (suppose)
Z x 100Dry mass percentage of H2O= % Yand, Z x 100Wet mass percentage of H2O= % X
DocumentsPDFComplete
Click Here & UpgradeExpanded Features
Unlimited Pages

233
The dry mass percentage is used in soil science and soil chemistry,
while wet mass percentage is used in the botanical sciences and finds, its
practical application in agriculture, horticulture and nurseries (Tan; 1995).
(iv) Soil TextureS.
No.Experience Type Texture Class
1. Very gritty, does not form balls, does not strain finger Very light Sand
2. Very gritty, forms ball but very easily broken stain
finger slightly.
Light Loamy Sand
3. Moderately gritty, forms fairly firm ball which is easily
broken, definitely stains finger
- Sandy Loam
4. Moderately sticky, slightly gritty feel forms
moderately hard ball when dry, stains, ribbons out on
squeezing but the ribbon breaks easily
Heavy Clay Loam
5. Same as above but very smooth, shows flucking on
ribbon surface, similar to still loam
Heavy Silt Clay Loam
6. Very sticky feel, forms ball which when dry can not be
crushed by fingers, stains heavily, squeezes out at right
moisture in to long (2-5 cm) ribbon
Very heavy Clay
7. Neither very gritty nor very smooth, forms firm ball
but does not ribbon, stains finger appreciably
Medium Loam
8. Smooth or sticky, butterly feel, forms firm ball, stains
and has a slight tendency to ribbon with flasky surface
- Silt Loam
(v) Bulk Density (BD)
Soil Bulk density (BD) is defined as the oven dry weight of soil per unit
of its Bulk volume. The bulk volume comprises volume of soil solids and of
pore spaces. The density is expressed in the unit of gm/cm3 or mg/m3.
Soil was filled in a pre-weighed 100 mL graduated cylinder and the soil
was made compact by tapping the bottom of the cylinder about 10 times with
the help of palm. Soil was added further by following the tapping process till a
DocumentsPDFComplete
Click Here & UpgradeExpanded Features
Unlimited Pages
234
tapped soil-volume of 100 mL was obtained the cylinder containing the soil was
kept in an oven for 24h and was weighed after cooling in a dissector.
Calculation:
Oven dry mass of soil Bulk density = mg/ m3
100
4.5.2 Chemical Examination
The chemical examination of the soil samples of all the sites was done
for the following:
(i) pH of the Soil
The acidity, neutrality or alkalinity of a soil is measured in terms of
hydrogen ion concentration of the Soil-Water system. Hydrogen ions are
important for plant growth.
20g air-dry soil and 40 mL distilled water were shaken on a rotary
shaker (Toshiba) for 10 to 15 minutes. This gave the 1:2 soil water suspensions.
The Microprocessor based pH meter (Systronics, µ pH 362) was calibrated
using buffer solutions pH = 4 and pH = 7.9. The pH of the soil samples was
then determined the above digital pH-meter.
(ii) Electrical Conductivity
Electrical Conductivity is important in order to determine the
concentration of soluble salts present in the soil suspension.
20 g of air-dry soil and 40 mL of distilled water were shaken on a rotary
skaker (Toshiba) for 10 to 15 minutes. After this solution was filtered through
Whatman filter paper No. 1 and a clear solution was obtained. The Electrical
DocumentsPDFComplete
Click Here & UpgradeExpanded Features
Unlimited Pages

235
Conductivity of the clear solution thus obtained was then determined using a
Microprocessor based digital Conductivity Meter (Systronics – 306).
(iii) Cation Exchange Capaciy (CEC)
The capacity of negatively charged clay and organic matter to adsorb
cations by simple physical, attractive force is called the Cation Exchange
Capacity (CEC) of a soil. Which is quantitative measure of all Cation adsorbed
on the surface of the soil colloids. Cation exchange capacity of the soil sample
determined in N-ammonium acetate (CH3COONH4) extract.
The soil sample was washed 4-5 times by ethanol (C2H5OH, 95%).
Finally the sample was treated with 1.0 N ammonium acetate solution (4 times;
25 mL each time). Every time it was centrifuged and supernatant liquid was
decanted in a 100 mL volumetric flask. This way the sodium ions came in
volumetric flask, replaced by ammonium ions. This liquid thus obtained was
thus diluted up to 100 mL and sodium concentration was determined by flame
photometer after necessary setting.
Calculation:
CEC in milli equivalents per 100 g
Sodium concentration in milli equivalents per L x 10 = Mass of soil sample in g
(iv) Organic Carbon and Organic Matter
The organic matter content of soil is estimated from the organic carbon,
determined by using Titrimetric determination (Walkely and Black, 1934)
DocumentsPDFComplete
Click Here & UpgradeExpanded Features
Unlimited Pages

236
method. The method is also known as “Wet-digestion method” involves a
rapid titration procedure for the estimation of organic Carbon content of soil.
Carbon in on K2Cr2O7 followed by back titration, against a standard solution of
ferrous ammonium sulphate.
Reations Oxidation of Carbon
2[ K2Cr2O7 + 4H2SO4 K2SO4 + Cr2(SO4)3 + 4H2O + 3O]
3 C + 6 O 3 CO2
2K2Cr2O7 + 8H2SO4 + 3C 2K2SO4 + 2 Cr2(SO4)3 + 8H2O + 3CO2
Titration Procedure
2FeSO4.(NH4)2.SO4.12H2O +H2SO4 + O 2(NH4)2SO4 + Fe2(SO4)3 + 13H2O
1g soil was taken in a 500 mL conical flask. 10 mL of 1N K2Cr2O7
solution was mixed and shaken. Then, added 20 mL of con. H2SO4 and swirl the
flask 2 or 3 minute, allow the flask to cool for 30 minutes. Poured 200 mL of
distilled water, 10 mL of H3PO4 (85%) or 0.5 gm of NaF and 1 mL (10 drops
approximately) of diphenyl amine indictor were than added and swirled to mix
well. The soultion was titrated with 0.5N Ferrous Ammonium Sulphate
solution on Auto-Tritrator (Systronics-351) till the colour changed from blue
violet to green. A blank solution made as described above (without soil sample)
was titrated and the same process was repeated for all the soil samples.
Calculation:
(B-T) x 0.10 x 0.003 x 100% C of organic = B x mass of the soil sampleWhere,B = Titre value for the blank solution.
DocumentsPDFComplete
Click Here & UpgradeExpanded Features
Unlimited Pages

237
T = Titre value with the solution containing the soil sample
% of organic Matter = % Organic Carbon x 1.724
(v) Available Phosphorus
Two most commonly used methods are known for determination of
available Phosphorus in soil.
(a) Bray and Kurtz method for acidic soil (Bray and Kurtz, 1945)
5.0 g of air dry soil was taken in a beaker and 50 mL of Bray extracting
solution (1: 10 soil to solution ratio) were added to it. The beaker was placed in
rotatory shaker for 5 – 10 minutes. Then the solution was filtered through
Whatman filter No. 42. The filtrate should be clear.
5 mL aliquot of the extract was taken in 25 mL volumetric flask 7.5 mL
of 0.8 N Boric acid were added to it to avoid fluoride interference. To the above
solution 20 mL of distilled water and 4 mL of Murphy-Riley (1962) colour
producing solution were added.
A blank and all soil samples were prepared by the above procedure. The
readings were taken on an UV-VIS spectrophotometer (Computerized
Systronics – 119).
Calculation:
A x Volume of the extradent in mL x 2.24Bray’s P (Kg/ha)= Volume of the aliquot in mL x mass of the soil in g
Where,
A = Conc. of P as read from the standard curve.
DocumentsPDFComplete
Click Here & UpgradeExpanded Features
Unlimited Pages

238
(b) Olsen’s Method
Neutral and alkaline soil is treated by this method. 2.5 g of air dry soil
sample and 50 mL Olsen solution (0.5 M NaHCO3, pH 8.5) in a beaker of 100
mL. This is 1: 20 soil is solution ratio. Add a pinch of Darco-G-60 charcoal.
The beaker was placed in a rotatory shaker for 30 minutes. All samples and
blank were run simultaneously. All the extracts were filtered through Whatman
filter paper No. 42. A clear filter was thus obtained.
10 mL aliquot of the extract were pipetted out in a 50 mL volumetric
flask, 10 mL of distilled water were added in this aliquot where in one drop of
P-nitrophenol indicator was also added. The contents were then acidified up to
pH = 0.5 by adding 2.5 M H2SO4 drop wise till the colour disappears. 8 mL of
the Murphy-Riley (1962) solution were added to the above solution and final
volume was made up to 50 mL by adding distilled water. A blue colour was
obtained. The optical density of this blue colour was determined on an UV-VIS
spectrophotometer (Systronics – 119 computerized) at 660 mm.
Calculation:
A x Volume of the extractant in mLAvailable P (Kg/ha) = Volume of the aliquot in mL x mass of the soil in g
(vi) Exchangeable Potassium
The exchangeable potassium is usually determined in normal neutral
ammonium acetate (CH3COONH4) extract of soil.
5.0 g air dry soil was taken in a centrifuge tube and add to it 25 mL of
neutral normal N CH3COONa. Shake the contents of the conical flask on a
DocumentsPDFComplete
Click Here & UpgradeExpanded Features
Unlimited Pages

239
electric shaker for 5 minute and filter. Feed the filtrate into the atomizer of the
Flame photometer, 100 of which has been set with 40 ppm K-solution and note
the reading. Locate this reading on the standard curve, which will give the K-
concentration in the extract. From this concentration measurement, the amount
of K in the sample was calculated.
Calculation:
A x 100 x 2.24Exchangeable Potassium (Kg/ha) = 5
Where,
A = Concentration (ppm) as read from the standard curve.
The same procedure used for the estimation of K was also used for the
estimation of Na and Ca using proper filters of Na and Ca.
(vii) Micronutrients Available Metallic Ions (Zn, Cu, Fe, Mn)
Lindsay and Norvell (1978) gave the method commonly used for
determining the available micronutrients in soil sample which consists of use of
DTPA (Diethylene triamine penta acetic acid) as an extractant which has
been widely accepted for the simultaneous extraction of micronutrient cations
viz. Zinc (Zn), Copper (Cu), Iron (Fe), Manganese (Mn) in neutral and alkaline
soils. The extract is determined on an Atomic Absorption spectrophotometer
(AAS). DTPA as a chelating agent combine with free metal ions in the solution
to form soluble complexes. Stability constant for the simultaneous complexing
of Zn, Cu, Mn and Fe shows DTPA as a most suitable extractant. Excessive
dissolution of CaCO3, which may release occluded micronutrients that are not
available for plant particularly in calcareous soils, misleads the results. To avoid
this, the extractant is buffered in a lightly alkaline pH range and included
soluble Ca+2.
DocumentsPDFComplete
Click Here & UpgradeExpanded Features
Unlimited Pages

240
Triethanolamine (TEA) is used as buffer because it burns cleanly
during atomization. At the selected pH of 7.3, three fourth of TEA is
protonated (HTEA).
Which exchange with Ca+2 and some Mg+2 from the soil exchange sites.
This increases the concentration of Calcium ions (Ca+2) by two to three fold and
help in suppressing the dissolution of CaCO3 in calcareous soils. The DTPA has
a capacity to complex each of the micronutrients cations as 10 times of its
atomic weight. The capacity ranges from 550-650 mg kg-1 depending on the
micronutrient cation.
Weight 10 g of soil sample and add 20 mL of the extractant DTPA
solution added to it. The flask was shake continuously for 2 hours preferably on
a horizontal shaker, and filter through Whatman filter paper No. 42. The filtrate
was then analysed for Zn, Cu, Fe and Mn with an atomic absorption
spectrophotometer. One blank solution also analysed as followed above method.
Calculation:
The amount of the given micronutrient is then calculated as below.
Wt. of soil taken = 10 g.
Volume of DTPA extractant added = 20 mL
Dilution = 20/10 = 2 times
Absorbance shown by the AAS = T
Concentration of the heavy metal as read from the standard curve against T = C
µg/mL
Content of the micronutrient Cation in the Soil sample = C x 2 mg/Kg or ppm
DocumentsPDFComplete
Click Here & UpgradeExpanded Features
Unlimited Pages

241
(viii) Available Sulphur
Sulphur was estimated turbimetrically using a spectrophotometer at 340
nm. In this method, Calcium Chloride dehydrate (CaCl2.2H2O) 0.15% solution
which was prepared by dissolving 1.5 g of CaCl2.2H2O in about 700 mL
distilled water and the volume was made up to 1L by adding distilled water, was
used as one of the reagents.
5.0 g dry soils were passed through a 10 mesh sieve in a 500 mL conical
flask and add 50 mL of 0.15% CaCl2.2H2O solution. Shake for 30 minutes and
filter through Whatman filter paper No. 42 filter paper. 10 mL of the above
extract were taken in a 150 mL conical flask and 20 mL of water were added to
it so that the total volume of the solution was 30 mL. 2.5 mL of stabalizing
solution and 0.2g of BaCl2 crystals were added to the above solution. The
contents were shaken for 1 to 3 minutes. The turbidity was measured on a
spectrophotometer at 340-nm. Standard plots were drawn between S
concentration in standard solution and spectrophotometer readings. The
concentration of S in the extracts was determined using the standard plots.
Calculation:
S in extract (Mg/L) x Volume of extract (mL)SO4-S (Mg/Kg) = Volume of extract (mL) x Oven dry soil (g)
(ix) Total Nitrogen (by Kjeldahl Method)
Nitrogen (N) is one of the major nutrients required for the nutritents of
plants. The total amount of N present in soil nearly 95 – 99% is in the organic
from and 1 – 5% in the inorganic forms a ammonion and nitrates. The
“Kjeldahl Method” of conversion of N into [(NH4)2SO4].
500 mg (80 mesh) oven dry soil samples were taken in the digestion
tube, 5 ml conc. H2SO4 and 1 – 2 g catalyst were added into the tube. The
DocumentsPDFComplete
Click Here & UpgradeExpanded Features
Unlimited Pages

242
digestion tube was than placed in digestion unit (Digestion unit with fume hood-
Toshiba) or block and heated to boiling until green Heating time was very long
and temperature at that time was very high. After complete digestion, the
digestion tubes were allowed to cool for 5 – 10 minutes outside the block and
then 20 mL of distilled water was used to dilute the contents. Finally the volume
was made up 50 mL.
Distillation and Titration
Distillation was done in the Kjeldahl apparatus (Micro Kjeldahl
apparatus – Borosil). 10 mL digest (aliquot) were placed in steam chamber of
Kjeldahl apparatus with 10 mL of 2N NaOH. A 50 mL conical flask containing
10 mL of H3BO3, a few drops of mixed indicator, which was placed under the
condenser, steam of the distillation apparatus. The liberated NH +
4 –N, liberated
by distillation of the digest with 2N NaOH was absorbed in unstabilization
H3BO3 in the form of ammonium borate. The contents were titrated against
standard 0.01 N HCl by Auto-Titrator (Systronics – 351).
Calculation:
(T–B) x Molarity of Standard HCl x 1.401Total Nitrogen % = Mass of Soil Sample (g)Where,
T = Volume of Standard HCl for titration of the soil sample.
B = Volume of Standard HCl for titration of the blank solution.
The blank solution mentioned here was prepared as described without
the soil sample.
DocumentsPDFComplete
Click Here & UpgradeExpanded Features
Unlimited Pages

CHAPTER V
OBSERVATION AND
RESULTS
DocumentsPDFComplete
Click Here & UpgradeExpanded Features
Unlimited Pages

243
5.1 The present work was initially undertaken for the analysis of the soil
types of Hill region and Bhabar region due to the easy approach to the
sites. Another reason to start the work in these regions was that there is
comparatively lesser impact of human and animal activities. The results
have been reported in Table 5.1.
A survey of the recent literature and the work done in the recent
past Chhabra (1993), Kaur (1995), Raghwvansh (2002), Shiveshwer
Pratap Singh (2002), and Trilochan (2004) reveals that the Hill region
as well as the Bhabar region of Uttarakhand state have been studied
recently, with special reference to the Physical and Chemical analysis of
the soil-types of these regions.
A comparison of the results of the present study Table 5.1 with the
work done earlier indicates that the results of the present study are in
agreement with the earlier studies upto a large extent. No remarkable
difference between the present study and the earlier studies was
found. It was therefore not necessary to further extend the present
work for the analysis of the soil types in the Hill region as well as in
the Bhabar region of Uttarakhand state.
The analysis of the soil types in the present study was therefore
undertaken for the Tarai region of Uttarkhand state, with the objective to
obtain the relevent and desired information regarding soil types of the
Tarai region. The results obtained in the present study will not only be of
theoritical importance but will also be of genuine use to all the farmers as
well as the Scientists/ Research Scholars interested in this field.
DocumentsPDFComplete
Click Here & UpgradeExpanded Features
Unlimited Pages

244
Table 5.1: Physico-Chemical properties of the soils of the Hill and Bhabar regions.Year: 2006
Site Name/ Physical and
Chemical properties
(Average values)
Bhimtal
Site No. 1
Mahara Gaon
Site No. 2
Khalkwira
Site No. 3
Nauligarh
Site No. 4
Haldwani
Site No. 5
Gajraula
Site No. 6
Kathgodam
Site No. 7
Kusum-Khera
Site No.8
1. Soil Colour Black Brown Black Brown Light Brown Brown Dark Black Dark Brown Grey
2. Soil water 30.1 25.2 22.1 20.2 40.9 60.0 40.9 38.2
3. Soil Temperature 16 18 15 14 18 25 16 17
4. Bulk Density 1.70 1.60 1.25 1.20 1.3 1.3 1.4 1.6
5. Soil Texture loam Silty loam loam loam Silty clay Silty loam Silty loam Silty loam
6. pH 6.62 6.96 6.74 6.81 6.68 6.70 6.88 6.00
7. E.C. (ds/m) 0.275 0.538 0.605 0.39 0.21 0.18 0.15 0.17
8. C.E.C. (milleq/100 g) 18.2 16.1 14.0 15.0 13.0 8.20 12.6 14.26
9. % of O.C. 1.26 1.42 0.91 1.09 0.46 0.18 0.50 0.41
10. % of O.M. 2.18 2.45 1.57 1.88 0.796 0.311 0.259 0.710
11. P (Kg/ha) 65 70 65 72 51 60 65 62
12. K (Kg/ha) 0.22 0.29 0.30 0.25 0.15 0.24 0.17 0.18
13. Na (ppm) 0.18 0.22 0.24 0.20 0.14 0.16 0.11 0.21
14. Zn (ppm) 2.45 1.35 1.54 2.11 1.61 1.71 0.97 1.61
15. Cu (ppm) 3.42 2.05 2.95 3.52 2.37 3.43 1.94 1.25
16. Fe (ppm) 38.7 26.7 31.83 26.57 110.84 187.1 103.46 101.2
17. Mn (ppm). 31.48 18.34 32.05 27.00 33.83 67.17 41.38 51.2
DocumentsPDFComplete
Click Here & UpgradeExpanded Features
Unlimited Pages

245
5.2 The observation and the results of present work carried out on the main
soil – types of the Tarai region for all the sites as described in Chapter 3
of Kumaon (Uttarakhand) are reported in Table 5.2.1 to 5.2.15.
5.2.1. Soil Colour
The soil colour was noted as it was observed. The observations
have been reported in Table 5.2
Table 5.2.1. Colour of the soil of the Tarai region of Uttarakhand.
Year: 2006
S. No. Site Name Site No. Soil Colour
1. Khatima (Banusa) S1 Blackish yellow
2. Khatima (Jhanket) S2 Light yellow
3. Khatima (Amaun) S3 Yellow
4. Khatima (Chakerpur) S4 Dark Brown
5. Khatima (City) S5 Brown Red
6. Sitarganj-1 S6 Brownish
7. Sitarganj-2 S7 Brownish
8. Rudrapur-1 S8 Dark greyish Brown
9. Rudrapur-2 S9 Blackish
10. Pantnagar-1 S10 Dark greyish Brown
11. Pantnagar-2 S11 Dark grey
5.2.2. Soil Water
Soil water was determined by the methodology described in Chapter-IV
for each of the samples of selected sites and the results have been reported in
Table 5.2.2.
DocumentsPDFComplete
Click Here & UpgradeExpanded Features
Unlimited Pages

246
Table 5.2.2. Soil water (Dry mass percentage of H2O) of the Tarai region of Uttarakhand.
Year: 2006Dry mass percentage of H2O
MonthsS.
No.Site Name Site
No.
Jan. Feb. Mar. Apr. May. Jun. Jul. Aug. Sep. Oct. Nov. Dec.
1. Khatima (Banusa) S1 7.7 13.12 8.69 7.75 11.11 21.95 13.63 11.11 8.69 11.60 10.13 9.64
2. Khatima (Jhanket) S2 10.13 13.12 8.69 4.60 8.69 16.27 19.04 4.16 13.63 12.10 11.60 9.64
3. Khatima (Amaun) S3 5.04 10.13 9.64 4.16 6.38 13.63 11.11 13.63 16.27 16.27 12.61 6.83
4. Khatima (Chakerpur) S4 4.16 6.38 5.93 3.30 6.38 16.27 21.95 19.04 16.27 18.48 13.12 8.69
5. Khatima (City) S5 7.29 5.93 6.38 2.06 11.11 21.95 13.63 13.63 13.63 16.82 15.20 12.60
6. Sitarganj-1 S6 7.75 11.11 9.17 8.69 11.11 16.27 11.11 11.11 11.11 16.82 8.69 9.64
7. Sitarganj-2 S7 8.06 7.75 7.75 3.73 6.38 19.00 14.67 13.63 13.63 10.13 9.64 8.69
8. Rudrapur-1 S8 5.88 8.22 5.48 5.48 8.69 21.95 16.27 19.04 11.11 9.64 10.13 5.93
9. Rudrapur-2 S9 6.83 5.04 9.17 1.62 8.69 16.27 16.27 13.63 12.00 13.63 11.00 11.60
10. Pantnagar-1 S10 9.17 13.63 13.63 7.75 11.11 19.04 16.27 13.63 13.63 17.37 17.00 12.61
11. Pantnagar-2 S11 7.29 8.69 8.22 4.60 8.69 19.04 16.27 11.11 11.11 10.13 11.21 9.64
DocumentsPDFComplete
Click Here & UpgradeExpanded Features
Unlimited Pages

247
5.2.3. Soil Temperature
The Soil Temperature was recorded for each of the selected sites for all the months of the calender year 2006 i.e.,
from January 2006 to December 2006. The results have been given in Table 5.2.3.
Table 5.2.3. Temperature of the Soil of Tarai region Uttarakhand. Year: 2006
Temperature (0C)Months
S.No.
Site Name SiteNo.
Jan. Feb. Mar. Apr. May. Jun. Jul. Aug. Sep. Oct. Nov. Dec.
1. Khatima (Banusa) S1 12 19 20 24 33 28 29 28 33 32 26 23
2. Khatima (Jhanket) S2 13 18 19 28 34 26 28 29 30 34 29 24
3. Khatima (Amaun) S3 14 18 18 26 29 27 31 31 32 31 27 23
4. Khatima (Chakerpur) S4 14 17 19 28 32 28 29 30 32 31 25 21
5. Khatima (City) S5 11 17 19 24 30 28 31 30 31 33 27 23
6. Sitarganj-1 S6 10 16 18 29 35 27 30 31 31 32 25 25
7. Sitarganj-2 S7 10 16.5 19 28 29 27.5 30 30 30 30 26 25
8. Rudrapur-1 S8 10 16 18 29 37 32 30 34 31 32 25 22
9. Rudrapur-2 S9 15 18 20 26 42 38 30 28 33 27 25 21
10. Pantnagar-1 S10 12 19 19 25 31 28 28 28 29 26 25 23
11. Pantnagar-2 S11 13 16 18 25 33 27 28 29 31 28 23 20
DocumentsPDFComplete
Click Here & UpgradeExpanded Features
Unlimited Pages

248
5.2.4. Bulk Density
Bulk densties of the soil samples was determined as described in chapter-IV and the results have been given in
Table 5.2.4.
Table 5.2.4. Bulk densities of the soils of Tarai region of Uttarakhand. Year: 2006
Bulk Density (mg m-2)Months
S. No. Site Name SiteNo.
Jan. Feb. Mar. Apr. May. Jun. Jul. Aug. Sep. Oct. Nov. Dec.
1. Khatima (Banusa) S1 1.20 1.10 1.20 0.83 1.10 1.20 1.18 1.25 1.24 1.19 1.22 1.28
2. Khatima (Jhanket) S2 1.18 1.18 1.18 1.18 1.05 1.15 1.22 1.25 1.25 1.28 1.28 1.20
3. Khatima (Amaun) S3 1.24 1.23 1.22 1.22 1.20 1.25 1.19 1.45 1.33 1.29 1.26 1.20
4. Khatima (Chakerpur) S4 1.26 1.20 1.20 1.20 1.10 1.25 1.41 1.25 1.23 1.24 1.18 1.18
5. Khatima (City) S5 1.32 1.30 1.22 1.22 1.25 1.30 1.22 1.20 1.29 1.27 1.30 1.34
6. Sitarganj-1 S6 1.24 1.22 1.15 1.15 1.52 1.20 1.20 1.23 1.27 1.18 1.22 1.18
7. Sitarganj-2 S7 1.30 1.20 1.18 1.19 1.20 1.20 1.18 1.19 1.27 1.26 1.24 1.24
8. Rudrapur-1 S8 1.20 1.20 1.23 1.24 1.10 1.20 1.37 1.25 1.23 1.25 1.20 1.26
9. Rudrapur-2 S9 1.26 1.23 1.20 1.22 1.05 1.25 1.32 1.25 1.16 1.20 1.20 1.20
10. Pantnagar-1 S10 1.26 1.25 1.25 1.31 1.37 1.38 1.40 1.41 1.44 1.33 1.25 1.20
11. Pantnagar-2 S11 1.22 1.18 1.15 1.18 1.10 1.25 1.12 1.15 1.29 1.27 1.25 1.20
DocumentsPDFComplete
Click Here & UpgradeExpanded Features
Unlimited Pages

249
5.2.5. Soil Texture
Soil texture was determined as described in chapter IV and the results
have been given in Table 5.2.5.
Table 5.2.5. Texture of the soils of Tarai region of Uttarakhand.
Year : 2006
S. No. Site Name Site No. Soil Texture
1. Khatima (Banusa) S1 Sandy loam
2. Khatima (Jhanket) S2 Silty clay loam
3. Khatima (Amaun) S3 Silty clay loam
4. Khatima (Chakerpur) S4 Silty loam
5. Khatima (City) S5 Silty clay loam
6. Sitarganj-1 S6 Silty clay loam
7. Sitarganj-2 S7 Silty clay loam
8. Rudrapur-1 S8 Silty clay loam
9. Rudrapur-2 S9 Silty clay loam
10. Pantnagar-1 S10 Loam
11. Pantnagar-2 S11 Silty clay loam
DocumentsPDFComplete
Click Here & UpgradeExpanded Features
Unlimited Pages

250
5.2.6. pH of the Soil
pH of the soil samples was determined by the microprocessor based pH meter (Model: Sytronics µ-pH-362). The pH
of the soils of each of the sites selected have been given in Table 5.2.6.
Table 5.2.6. pH of the soils of Taria region of Uttarakhand.
Year: 2006
pHMonths
S. No. Site Name SiteNo.
Jan. Feb. Mar. Apr. May. Jun. Jul. Aug. Sep. Oct. Nov. Dec.
1. Khatima (Banusa) S1 6.9 7.1 7.0 7.1 7.0 7.6 7.8 7.5 7.2 7.3 7.5 7.4
2. Khatima (Jhanket) S2 6.6 6.8 6.8 6.8 6.9 7.0 7.6 7.5 7.0 7.1 7.1 7.2
3. Khatima (Amaun) S3 6.9 7.2 7.0 6.9 7.3 7.4 7.5 7.5 7.4 7.6 7.6 7.5
4. Khatima (Chakerpur) S4 6.7 7.0 6.8 6.8 7.0 7.5 7.5 7.5 7.4 7.5 7.4 7.2
5. Khatima (City) S5 7.1 7.0 7.4 7.5 7.4 7.5 7.5 7.3 7.2 7.2 7.4 7.4
6. Sitarganj-1 S6 7.1 7.2 7.1 7.1 7.2 7.2 7.5 7.5 7.3 7.9 7.4 7.4
7. Sitarganj-2 S7 7.0 7.2 7.1 7.0 7.1 7.2 7.5 7.2 7.0 6.9 7.1 7.1
8. Rudrapur-1 S8 7.0 7.1 6.9 6.8 6.9 7.5 7.7 6.9 7.0 7.1 7.2 7.3
9. Rudrapur-2 S9 6.6 6.9 7.3 7.4 7.5 7.4 7.5 7.4 7.5 7.5 7.4 7.2
10. Pantnagar-1 S10 7.0 7.2 7.5 7.6 7.1 7.2 7.4 7.6 7.5 7.3 7.5 7.4
11. Pantnagar-2 S11 7.3 6.9 6.9 7.1 7.0 7.9 7.4 7.5 7.6 7.8 7.1 7.3
DocumentsPDFComplete
Click Here & UpgradeExpanded Features
Unlimited Pages

251
5.2.7. Electrical Conductivity C.E.C. of the Soil
The Electrical Conductivity of the soil types determined by the digital conductivity meter (Model: Systronics-306)
results have been reported in Table 5.2.7.
Table 5.2.7. Electrical Conductivity of the soils of Taria region of Uttarakhand.
Year: 2006
Electrical Conductivity (ds/m)Months
S.No.
Site Name SiteNo.
Jan. Feb. Mar. Apr. May. Jun. Jul. Aug. Sep. Oct. Nov. Dec.
1. Khatima (Banusa) S1 0.44 0.41 0.46 0.47 0.43 0.44 0.45 0.45 0.40 0.41 0.39 0.40
2. Khatima (Jhanket) S2 0.30 0.32 0.30 0.30 0.35 0.35 0.36 0.30 0.29 0.35 0.29 0.28
3. Khatima (Amaun) S3 0.33 0.34 0.35 0.37 0.36 0.39 0.37 0.36 0.36 0.35 0.32 0.38
4. Khatima (Chakerpur) S4 0.29 0.32 0.39 0.33 0.36 0.35 0.35 0.34 0.30 0.30 0.28 0.29
5. Khatima (City) S5 0.39 0.44 0.43 0.42 0.39 0.40 0.40 0.42 0.39 0.38 0.37 0.40
6. Sitarganj-1 S6 0.36 0.33 0.34 0.34 0.35 0.34 0.34 0.33 0.36 0.32 0.30 0.33
7. Sitarganj-2 S7 0.29 0.27 0.30 0.32 0.31 0.32 0.33 0.30 0.26 0.27 0.28 0.30
8. Rudrapur-1 S8 0.46 0.52 0.53 0.51 0.49 0.48 0.58 0.62 0.62 0.59 0.60 0.45
9. Rudrapur-2 S9 0.41 0.42 0.47 0.39 0.38 0.40 0.42 0.50 0.52 0.39 0.38 0.46
10. Pantnagar-1 S10 0.41 0.35 0.36 0.39 0.38 0.35 0.35 0.36 0.40 0.41 0.40 0.42
11. Pantnagar-2 S11 0.33 0.34 0.35 0.37 0.36 0.39 0.37 0.36 0.36 0.35 0.32 0.38
DocumentsPDFComplete
Click Here & UpgradeExpanded Features
Unlimited Pages

252
5.2.8. Cation Exchange Capacity of the Soil
The CEC of the soil types determined by the method described in
chapter-IV have been reported in Table 5.2.8.
Table 5.2.8: CEC of the Soils of Tarai region of Uttarakhand.
Year: 2006
S.
No.
Site Name Site No. CEC
(milli. equiv./100 g)
1. Khatima (Banusa) S1 11.2
2. Khatima (Jhanket) S2 12.6
3. Khatima (Amaun) S3 13.9
4. Khatima (Chakerpur) S4 16.8
5. Khatima (City) S5 14.7
6. Sitarganj-1 S6 16.1
7. Sitarganj-2 S7 15.2
8. Rudrapur-1 S8 15.56
9. Rudrapur-2 S9 15.50
10. Pantnagar-1 S10 16.10
11. Pantnagar-2 S11 13.40
DocumentsPDFComplete
Click Here & UpgradeExpanded Features
Unlimited Pages

253
5.2.9. (a) Organic Carbon and Organic Matter in the Soil.
The Organic Carbon was determined by the method by the method as described in Chapter-IV. The results have
been given in Table 5.2.9 (a). Organic matter of the soils of all the sites have been reported in Table 5.2.9 (b).
Table 5.2.9. Organic Carbon in the soils of Tarai region of Uttarakhand.
Year: 2006
% of Organic CarbonMonths
S. No. Site Name SiteNo.
Jan. Feb. Mar. Apr. May. Jun. Jul. Aug. Sep. Oct. Nov. Dec.
1. Khatima (Banusa) S1 0.56 0.59 0.61 0.60 0.60 0.59 0.55 0.58 0.55 0.58 0.56 0.62
2. Khatima (Jhanket) S2 0.26 0.28 0.30 0.31 0.30 0.23 0.21 0.23 0.24 0.24 0.25 0.26
3. Khatima (Amaun) S3 0.24 0.25 0.25 0.27 0.26 0.28 0.27 0.30 0.29 0.30 0.28 0.28
4. Khatima (Chakerpur) S4 0.61 0.60 0.60 0.63 0.60 0.62 0.61 0.61 0.62 0.64 0.69 0.63
5. Khatima (City) S5 0.28 0.28 0.27 0.30 0.25 0.25 0.21 0.24 0.23 0.25 0.24 0.23
6. Sitarganj-1 S6 0.53 0.61 0.59 0.67 0.66 0.70 0.57 0.69 0.58 0.70 0.70 0.57
7. Sitarganj-2 S7 0.60 0.62 0.63 0.65 0.69 0.63 0.60 0.61 0.61 0.67 0.68 0.60
8. Rudrapur-1 S8 0.63 0.69 0.70 0.77 0.80 0.88 0.82 0.77 0.85 0.76 0.69 0.67
9. Rudrapur-2 S9 0.76 0.77 0.83 0.80 0.79 0.88 0.88 0.78 0.83 0.79 0.90 0.80
10. Pantnagar-1 S10 0.85 1.00 0.98 0.90 0.93 0.90 1.00 0.86 0.89 0.98 0.91 0.86
11. Pantnagar-2 S11 0.79 0.80 0.89 0.88 0.94 0.87 0.77 0.90 1.04 0.89 0.98 0.82
DocumentsPDFComplete
Click Here & UpgradeExpanded Features
Unlimited Pages

254
Table 5.2.9. (b): Organic Matter in the Soils of Tarai region region of Uttarakhand.
Year: 2006
% of Organic MatterMonths
S.No.
Site Name SiteNo.
Jan. Feb. Mar. Apr. May. Jun. Jul. Aug. Sep. Oct. Nov. Dec.
1. Khatima (Banusa) S1 0.97 1.02 1.05 1.04 1.04 1.02 0.95 1.00 0.95 1.00 0.97 1.07
2. Khatima (Jhanket) S2 0.45 0.48 0.52 0.54 0.52 0.40 0.36 0.40 0.42 0.42 0.43 0.45
3. Khatima (Amaun) S3 0.42 0.43 0.43 0.47 0.45 0.48 0.47 0.52 0.56 0.52 0.48 0.48
4. Khatima (Chakerpur) S4 1.05 1.03 1.03 1.09 1.03 1.05 1.09 1.05 1.07 1.10 1.19 1.09
5. Khatima (City) S5 0.48 0.48 0.47 0.52 0.43 0.43 0.36 0.42 0.40 0.43 0.42 0.40
6. Sitarganj-1 S6 0.92 1.05 1.02 1.16 1.14 1.21 1.00 1.19 1.00 1.21 1.22 1.00
7. Sitarganj-2 S7 1.03 1.07 1.09 1.12 1.19 1.09 1.03 1.05 1.05 1.16 1.17 1.03
8. Rudrapur-1 S8 1.09 1.19 1.21 1.33 1.38 1.52 1.42 1.33 1.47 1.31 1.19 1.16
9. Rudrapur-2 S9 1.31 1.33 1.43 1.38 1.36 1.52 1.52 1.35 1.43 1.36 1.55 1.38
10. Pantnagar-1 S10 1.47 1.73 1.69 1.55 1.61 1.55 1.73 1.48 1.54 1.69 1.57 1.48
11. Pantnagar-2 S11 1.36 1.38 1.54 1.52 1.62 1.50 1.33 1.55 1.80 1.54 1.69 1.42
DocumentsPDFComplete
Click Here & UpgradeExpanded Features
Unlimited Pages

255
5.2.10. Phosphorus (P) in the Soil
Phosphorus in the soils of the study area was determined by both the Method i.e. by the Bray and Kurtz method as
well as well as by the Olsen’s Method, as described in Chapter-IV. Phosphorus (P) in the soils have been given in Table
5.2.10.
Table 5.2.10. Phosphorus in the soils of the Tarai region of Uttarakhand
Year: 2006
Phosphorus (P) (in Kg/ha)Months
S.No.
Site Name SiteNo.
Jan. Feb. Mar. Apr. May. Jun. Jul. Aug. Sep. Oct. Nov. Dec.
1. Khatima (Banusa) S1 72.00 72.50 70.70 40.50 69.10 76.50 77.00 71.90 71.10 75.50 77.5 77.5
2. Khatima (Jhanket) S2 31.50 30.00 32.10 28.00 27.50 27.00 27.00 26.00 31.50 35.50 30.0 26.52
3. Khatima (Amaun) S3 18.00 16.50 16.00 11.52 15.50 16.25 9.00 9.50 13.50 19.50 15.00 16.00
4. Khatima (Chakerpur) S4 11.60 11.10 14.30 9.60 10.10 14.56 9.00 9.50 10.50 9.00 12.76 11.20
5. Khatima (City) S5 5.50 6.15 7.18 4.50 4.50 4.72 9.00 6.25 8.15 6.50 5.91 9.71
6. Sitarganj-1 S6 69.70 66.20 69.40 60.00 62.70 71.00 80.01 68.10 71.60 62.10 60.50 68.00
7. Sitarganj-2 S7 54.00 56.20 59.60 69.10 66.27 70.00 56.20 68.20 64.10 66.21 70.00 69.20
8. Rudrapur-1 S8 62.10 60.10 69.40 66.40 60.00 65.00 68.00 70.61 66.20 71.68 63.10 70.00
9. Rudrapur-2 S9 66.00 64.02 64.06 55.80 66.20 61.10 62.50 60.00 67.00 70.00 66.60 69.20
10. Pantnagar-1 S10 78.00 80.00 88.20 89.60 100.08 92.60 98.90 89.00 95.20 101.20 99.20 96.40
11. Pantnagar-2 S11 72.00 68.00 65.60 69.00 71.20 66.21 76.01 77.20 79.40 76.00 74.40 77.50
DocumentsPDFComplete
Click Here & UpgradeExpanded Features
Unlimited Pages

256
5.2.11. Potassium (K) in the Soil
Potassium (K) in the study area was determined by the method as described in Chapter-IV. The results have been in
Table 5.2.11.
Table 5.2.11. Potassium (K) in the soils of Taria region of Uttarakhand.
Year: 2006
Potassium (K) (in Kg/ha)Months
S.No.
Site Name SiteNo.
Jan. Feb. Mar. Apr. May. Jun. Jul. Aug. Sep. Oct. Nov. Dec.
1. Khatima (Banusa) S1 298 302 302 300 298 297 297 295 296 297 300 298
2. Khatima (Jhanket) S2 150 157 155 155 156 155 150 156.5 147 154 145 155
3. Khatima (Amaun) S3 36 70 71 66 70 77 72 80 99 99 98 90
4. Khatima (Chakerpur) S4 385 387 377 397 385 387 390 385 360 390 366 386
5. Khatima (City) S5 36 50 84 77 70 88 77 79 83 90 91 93
6. Sitarganj-1 S6 230 300 224 301.5 230 225 225 238.5 235 240 237 236
7. Sitarganj-2 S7 302 300 301 297 298 299 300 295 297 300 303 302
8. Rudrapur-1 S8 450 444 445 450 440 445 450 443 454 450 454 450
9. Rudrapur-2 S9 157.5 170 165 144 160 157 150 155.5 157 135 144 150
10. Pantnagar-1 S10 298 302 302 300 298 297 297 295 296 297 300 298
11. Pantnagar-2 S11 307 300 301 297 298 299 300 295 297 300 303 302
DocumentsPDFComplete
Click Here & UpgradeExpanded Features
Unlimited Pages

257
5.2.12. Available or Exchangeable Sodium (Na) in the Soil
Available or Exchangeable Sodium (Na) in the Soils of the Study area was determined by the methods as described in
Chapter-IV. The results have been given in Table 5.2.12.
Table 5.2.12. Available Sodium (Na) in the soils of the Khatima region of Uttarakhand.
Year: 2006
Available Sodium (Na) (in ppm)Months
S.No.
Site Name SiteNo.
Jan. Feb. Mar. Apr. May. Jun. Jul. Aug. Sep. Oct. Nov. Dec.
1. Khatima (Banusa) S1 28 30 25 26 27 26 28 27 26 26 25 25
2. Khatima (Jhanket) S2 25 25 30 24 25 23 25 27 24 24 27 28
3. Khatima (Amaun) S3 25 27 31 28 27 26 30 29 27 28 27 25
4. Khatima (Chakerpur) S4 25 26 26 27 27 26 28 29 26 27 25 27
5. Khatima (City) S5 25 27 26 24 26 23 25 23 24 24 22 22
6. Sitarganj-1 S6 20 23 21 19 20 20 21 22 19 24 20 21
7. Sitarganj-2 S7 22 22 21 19 22 24 22 23 20 23 20 21
8. Rudrapur-1 S8 21 24 22 21 26 25 24 21 22 18 27 18
9. Rudrapur-2 S9 23 24 25 23 24 27 26 23 24 25 28 19
10. Pantnagar-1 S10 25 29 22 27 21 24 22 20 21 18 24 16
11. Pantnagar-2 S11 21 24 23 22 22 23 24 22 18 24 19 24
DocumentsPDFComplete
Click Here & UpgradeExpanded Features
Unlimited Pages

258
5.2.13. Available Sulphur (S) in the soil
Sulphur (S) was determined turbiditimtrically using a spectrophotometer at 340 nm. The results have been reported
in Table 5.2.13.
Table 5.2.13. Available Sulphur (S) in the soils of Tarai region of Uttarakhand.
Year: 2006
Available Sulphur (S) (in ppm)Months
S.No.
Site Name SiteNo.
Jan. Feb. Mar. Apr. May. Jun. Jul. Aug. Sep. Oct. Nov. Dec.
1. Khatima (Banusa) S1 20.29 23.00 25.00 24.00 23.00 20.00 23.00 24.00 24.00 22.00 25.10 22.00
2. Khatima (Jhanket) S2 25.48 27.00 29.00 26.00 23.00 24.00 25.00 26.00 26.00 28.00 28.00 29.10
3. Khatima (Amaun) S3 29.29 29.00 30.00 34.20 30.00 32.00 25.00 29.00 32.00 39.00 34.00 35.00
4. Khatima (Chakerpur) S4 10.14 9.85 10.01 10.00 9.15 10.60 9.35 9.30 9.90 9.37 9.50 9.28
5. Khatima (City) S5 10.13 9.50 7.10 9.21 11.30 12.10 9.10 10.00 9.27 12.5 9.00 9.00
6. Sitarganj-1 S6 11.00 12.10 9.06 10.31 8.00 12.00 10.70 8.00 11.10 11.00 12.00 12.00
7. Sitarganj-2 S7 11.01 12.00 10.08 9.00 14.00 12.00 9.00 10.78 10.08 13.00 14.00 12.10
8. Rudrapur-1 S8 12.08 15.07 15.00 17.00 18.00 13.00 18.00 17.00 14.01 15.10 13.01 12.10
9. Rudrapur-2 S9 12.00 14.00 13.00 15.04 15.00 15.00 17.00 18.00 10.00 16.02 14.00 9.10
10. Pantnagar-1 S10 12.01 18.00 14.00 17.00 18.00 17.00 15.00 16.01 15.02 13.00 12.01 14.05
11. Pantnagar-2 S11 13.01 14.05 15.01 15.01 14.01 16.01 15.01 17.05 9.37 9.50 14.07 9.28
DocumentsPDFComplete
Click Here & UpgradeExpanded Features
Unlimited Pages

259
5.2.14. Total Nitrogen (N) in the Soil
Total Nitrogen (N) percentage in the soils was calculated by the Kjeldahl’s method as described in chapter-IV. The
results have been reported in Table 5.2.14.
Table 5.2.14. Total Nitrogen percentage in the Soils of Tarai region of Uttarakhand.
Year: 2006
Percentage of Nitrogen (N)Months
S.No.
Site Name SiteNo.
Jan. Feb. Mar. Apr. May. Jun. Jul. Aug. Sep. Oct. Nov. Dec.
1. Khatima (Banusa) S1 0.098 0.095 0.090 0.084 0.082 0.081 0.092 0.084 0.091 0.090 0.098 0.082
2. Khatima (Jhanket) S2 0.112 0.124 0.145 0.168 0.144 0.151 0.168 0.109 0.115 0.112 0.142 0.151
3. Khatima (Amaun) S3 0.084 0.052 0.080 0.084 0.072 0.056 0.084 0.061 0.420 0.056 0.062 0.072
4. Khatima (Chakerpur) S4 0.071 0.082 0.081 0.109 0.098 0.084 0.084 0.122 0.091 0.066 0.056 0.060
5. Khatima (City) S5 0.112 0.122 0.131 0.112 0.111 0.102 0.112 0.103 0.091 0.102 0.109 0.098
6. Sitarganj-1 S6 0.168 0.125 0.135 0.184 0.144 0.144 0.084 0.109 1.220 0.102 0.144 0.142
7. Sitarganj-2 S7 0.155 0.132 0.132 0.181 0.082 0.092 0.084 0.091 0.098 0.101 0.152 0.140
8. Rudrapur-1 S8 0.082 0.120 0.123 0.152 0.144 0.122 0.066 0.095 0.111 0.131 0.156 0.006
9. Rudrapur-2 S9 0.114 0.125 0.106 0.122 0.135 0.056 0.094 0.084 0.121 0.131 0.122 0.066
10. Pantnagar-1 S10 0.140 0.122 0.110 0.114 0.115 0.126 0.120 0.061 0.041 0.098 0.142 0.125
11. Pantnagar-2 S11 0.122 0.136 0.144 0.099 0.017 0.056 0.112 0.084 0.056 0.098 0.125 0.110
DocumentsPDFComplete
Click Here & UpgradeExpanded Features
Unlimited Pages

260
5.2.15. Micronutrients
Micronutrients in the soils of the study area were determined by the methods as described in Chapter-IV using
Atomic Absorption Spectrophotometer (A.A.S.) method. The results have been reported in Table 5.2.15.
Table 5.2.15. Metallic ions (Zn, Mn, Fe and Cu) in the soils of the Tarai region of Uttarakhand.
Year: 2006
Metals/Site No. S1 S2 S3 S4 S5 S6 S7 S8 S9 S10 S11
Zinc (in ppm) 1.0 2.5 0.76 1.38 0.27 1.45 1.07 1.34 0.73 0.82 0.79
Manganese (in ppm) 4.0 10.0 1.19 1.65 4.02 3.00 4.00 4.02 2.38 2.78 3.02
Ferrous (in ppm) 4.0 10.0 5.45 5.15 14.79 8.83 10.03 14.79 13.86 12.02 17.02
Copper (in ppm) 2.0 5.0 1.67 1.01 0.49 0.65 0.56 1.16 1.67 0.62 0.53
DocumentsPDFComplete
Click Here & UpgradeExpanded Features
Unlimited Pages

CHAPTER VI
DISCUSSION
DocumentsPDFComplete
Click Here & UpgradeExpanded Features
Unlimited Pages

261
6.1 Soil is defined as an independent body with a unique morphology from
the surface down to the parent material as expressed by the sample
profiles (Tan; 1995).
Soil Can also be defined as the collection of natural bodies
occupying parts of the earth’s surface that support plant and that have
properties due to the integrated effect of climate and living matter acting
upon parent material as conditioned by relief over period of time (Negi;
2000).
The study of soil is also known as the soil science or pedology
(pedos means earth or edaphology edaphos means soil). Soil may also be
defined as the part of the earth crust in which humus is present (Shukla
and Chandal; 1991).
Soils are devided by texture into the following groups in the
American classification (Victorova; 1986).
(i) Clayed Soils
Clay Very Clayed Silty Clay
Silty heavy loam
Intermediate Heavy loam
Sandy Clay
(ii) Loamy Soils
Medium loamy Sandy heavy loam
loam
Slightly loamy Sandy loam
(iii) Silty Soils Silty loam
Silty clay loam
Silty
DocumentsPDFComplete
Click Here & UpgradeExpanded Features
Unlimited Pages

262
(iv) Sandy Soils loamy sand
Sand
The present work was undertaken to analyse the soils for their physical
states, their consituents and the nutrients present in the soils.
As reported earlier in 5.1, a comparison of the results of the present study
was done with the work done earlier by Chhabra (1993), Kaur (1995),
Raghwvansh (2002), Shiveshwer Pratap Singh (2002), and Trilochan (2004).
It was therefore agreement considered unnecessary to further extend the present
work for the analysis of the soil types in the Hill region as well as in the Bhabar
region of Uttarakhand state. The analysis of the soil types of Tarai region of
Uttarakhand state was therefore undertaken for the present work with the
objective to obtain the detailed information regarding the soil types of this
region. It was also attempted to compare the results of this region with the
results of the soil types of the Hill and the Bhabar regions as reported by earlier
workers.
DocumentsPDFComplete
Click Here & UpgradeExpanded Features
Unlimited Pages

263
6.2 RELATIONSHIP OF THE NUTRIENTS WITH SOILS OF THE
TARAI REGION OF UTTARAKHAND STATE (INDIA)
Calculating the average of a particular characteristic or nutrient content
for a calender year, the relationship between the nutrients and the soils of the
region has been reported in Tables 6.2.1 to 6.2.13.
Table 6.2.1: Variation of soil water (Dry mass percentage of H2O) in
different sites of the Tarai Region of Uttarakhand state (India).
Year: 2006
S.
No.
Site Name Site No. Average Dry Mass
percentage of H2O
1. Khatima (Banusa) S1 11.26
2. Khatima (Jhanket) S2 10.97
3. Khatima (Amaun) S3 10.47
4. Khatima (Chakerpur) S4 11.66
5. Khatima (City) S5 11.68
6. Sitarganj-1 S6 11.04
7. Sitarganj-2 S7 10.25
8. Rudrapur-1 S8 10.65
9. Rudrapur-2 S9 10.47
10. Pantnagar-1 S10 13.73
11. Pantnagar-2 S11 10.50
DocumentsPDFComplete
Click Here & UpgradeExpanded Features
Unlimited Pages

264
Table 6.2.2: Variation of Soil Temperature in different sites of the Tarai
Region of Uttarakhand state (India).
Year: 2006
S.
No.
Site Name Site No. Average Temperature
(in 0C)
1. Khatima (Banusa) S1 25.58
2. Khatima (Jhanket) S2 26.00
3. Khatima (Amaun) S3 25.58
4. Khatima (Chakerpur) S4 25.50
5. Khatima (City) S5 25.33
6. Sitarganj-1 S6 25.75
7. Sitarganj-2 S7 25.08
8. Rudrapur-1 S8 26.33
9. Rudrapur-2 S9 26.91
10. Pantnagar-1 S10 24.40
11. Pantnagar-2 S11 24.25
DocumentsPDFComplete
Click Here & UpgradeExpanded Features
Unlimited Pages

265
Table 6.2.3: Variation of Bulk Density of the Soil in different sites of the
Tarai Region of Uttarakhand state (India).
Year: 2006
S.
No.
Site Name Site No. Average Bulk Density
(mg/m3)
1. Khatima (Banusa) S1 1.16
2. Khatima (Jhanket) S2 1.20
3. Khatima (Amaun) S3 1.25
4. Khatima (Chakerpur) S4 1.22
5. Khatima (City) S5 1.26
6. Sitarganj-1 S6 1.23
7. Sitarganj-2 S7 1.22
8. Rudrapur-1 S8 1.22
9. Rudrapur-2 S9 1.21
10. Pantnagar-1 S10 1.32
11. Pantnagar-2 S11 1.19
DocumentsPDFComplete
Click Here & UpgradeExpanded Features
Unlimited Pages

266
Table 6.2.4: Variation of pH of the Soil Temperature in different sites of
the Tarai Region of Uttarakhand state (India).
Year: 2006
S.
No.
Site Name Site No. Average pH
1. Khatima (Banusa) S1 7.20
2. Khatima (Jhanket) S2 7.03
3. Khatima (Amaun) S3 7.31
4. Khatima (Chakerpur) S4 7.19
5. Khatima (City) S5 7.32
6. Sitarganj-1 S6 7.32
7. Sitarganj-2 S7 7.11
8. Rudrapur-1 S8 7.11
9. Rudrapur-2 S9 7.30
10. Pantnagar-1 S10 7.35
11. Pantnagar-2 S11 7.31
DocumentsPDFComplete
Click Here & UpgradeExpanded Features
Unlimited Pages

267
Table 6.2.5: Variation of Electrical Conductivity (EC) in the soils of
different sites of the Tarai Region of Uttarakhand state (India).
Year: 2006
S.
No.
Site Name Site No. Average Electrical
Conductivity (EC) (ds/m)
1. Khatima (Banusa) S1 0.429
2. Khatima (Jhanket) S2 0.315
3. Khatima (Amaun) S3 0.356
4. Khatima (Chakerpur) S4 0.325
5. Khatima (City) S5 0.402
6. Sitarganj-1 S6 0.336
7. Sitarganj-2 S7 0.295
8. Rudrapur-1 S8 0.537
9. Rudrapur-2 S9 0.428
10. Pantnagar-1 S10 0.381
11. Pantnagar-2 S11 0.356
DocumentsPDFComplete
Click Here & UpgradeExpanded Features
Unlimited Pages

268
Table 6.2.6: Variation of Organic Carbon in the soils of different sites of
the Tarai Region of Uttarakhand state (India).
Year: 2006
S.
No.
Site Name Site No. Average % of Organic
Carbon
1. Khatima (Banusa) S1 0.528
2. Khatima (Jhanket) S2 0.259
3. Khatima (Amaun) S3 0.272
4. Khatima (Chakerpur) S4 0.621
5. Khatima (City) S5 0.252
6. Sitarganj-1 S6 0.630
7. Sitarganj-2 S7 0.632
8. Rudrapur-1 S8 0.752
9. Rudrapur-2 S9 0.817
10. Pantnagar-1 S10 0.921
11. Pantnagar-2 S11 0.880
DocumentsPDFComplete
Click Here & UpgradeExpanded Features
Unlimited Pages

269
Table 6.2.7: Variation of Organic Matter in the Soils of different sites of the
Tarai Region of Uttarakhand state (India).
Year: 2006
S.
No.
Site Name Site No. Average % of Organic
Matter
1. Khatima (Banusa) S1 1.006
2. Khatima (Jhanket) S2 0.449
3. Khatima (Amaun) S3 0.474
4. Khatima (Chakerpur) S4 1.070
5. Khatima (City) S5 0.436
6. Sitarganj-1 S6 1.093
7. Sitarganj-2 S7 1.090
8. Rudrapur-1 S8 1.300
9. Rudrapur-2 S9 1.410
10. Pantnagar-1 S10 1.590
11. Pantnagar-2 S11 1.520
DocumentsPDFComplete
Click Here & UpgradeExpanded Features
Unlimited Pages

270
Table 6.2.8: Variation of Phosphorus (P) in the Soils of different sites of the
Tarai Region of Uttarakhand state (India).
Year: 2006
S.
No.
Site Name Site No. Average Phosphorus (P)
(Kg/ha)
1. Khatima (Banusa) S1 70.98
2. Khatima (Jhanket) S2 29.38
3. Khatima (Amaun) S3 14.68
4. Khatima (Chakerpur) S4 11.10
5. Khatima (City) S5 6.50
6. Sitarganj-1 S6 67.44
7. Sitarganj-2 S7 64.08
8. Rudrapur-1 S8 66.04
9. Rudrapur-2 S9 64.37
10. Pantnagar-1 S10 92.36
11. Pantnagar-2 S11 72.71
DocumentsPDFComplete
Click Here & UpgradeExpanded Features
Unlimited Pages

271
Table 6.2.9: Variation of Potassium (K) in the Soils of different sites of the
Tarai Region of Uttarakhand state (India).
Year: 2006
S.
No.
Site Name Site No. Average Potassium (K)
(Kg/ha)
1. Khatima (Banusa) S1 298.33
2. Khatima (Jhanket) S2 152.98
3. Khatima (Amaun) S3 77.33
4. Khatima (Chakerpur) S4 382.91
5. Khatima (City) S5 76.50
6. Sitarganj-1 S6 243.50
7. Sitarganj-2 S7 299.50
8. Rudrapur-1 S8 447.91
9. Rudrapur-2 S9 153.75
10. Pantnagar-1 S10 298.33
11. Pantnagar-2 S11 299.91
DocumentsPDFComplete
Click Here & UpgradeExpanded Features
Unlimited Pages

272
Table 6.2.10: Variation of Available Sodium (Na) in the Soils of different
sites of the Tarai Region of Uttarakhand state (India).
Year: 2006
S.
No.
Site Name Site No. Average Available Sodium
(Na) (in ppm)
1. Khatima (Banusa) S1 26.58
2. Khatima (Jhanket) S2 25.58
3. Khatima (Amaun) S3 27.50
4. Khatima (Chakerpur) S4 26.58
5. Khatima (City) S5 24.25
6. Sitarganj-1 S6 20.83
7. Sitarganj-2 S7 21.58
8. Rudrapur-1 S8 22.41
9. Rudrapur-2 S9 24.25
10. Pantnagar-1 S10 22.41
11. Pantnagar-2 S11 22.16
DocumentsPDFComplete
Click Here & UpgradeExpanded Features
Unlimited Pages

273
Table 6.2.11: Variation Available Sulphur (S) in the Soils of different sites
of the Tarai Region of Uttarakhand state (India).
Year: 2006
S.
No.
Site Name Site No. Average Available
Sulphur (S) (in ppm)
1. Khatima (Banusa) S1 22.95
2. Khatima (Jhanket) S2 26.38
3. Khatima (Amaun) S3 31.54
4. Khatima (Chakerpur) S4 9.70
5. Khatima (City) S5 9.85
6. Sitarganj-1 S6 10.60
7. Sitarganj-2 S7 11.42
8. Rudrapur-1 S8 14.94
9. Rudrapur-2 S9 14.01
10. Pantnagar-1 S10 15.09
11. Pantnagar-2 S11 13.44
DocumentsPDFComplete
Click Here & UpgradeExpanded Features
Unlimited Pages
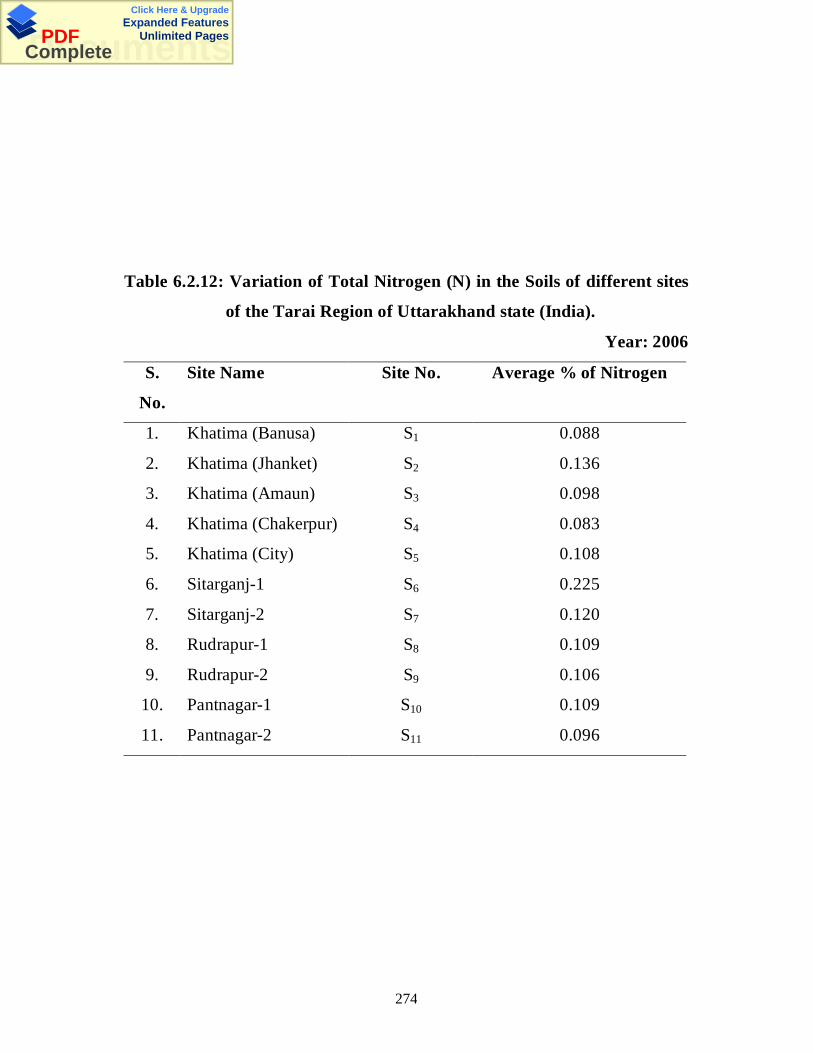
274
Table 6.2.12: Variation of Total Nitrogen (N) in the Soils of different sites
of the Tarai Region of Uttarakhand state (India).
Year: 2006
S.
No.
Site Name Site No. Average % of Nitrogen
1. Khatima (Banusa) S1 0.088
2. Khatima (Jhanket) S2 0.136
3. Khatima (Amaun) S3 0.098
4. Khatima (Chakerpur) S4 0.083
5. Khatima (City) S5 0.108
6. Sitarganj-1 S6 0.225
7. Sitarganj-2 S7 0.120
8. Rudrapur-1 S8 0.109
9. Rudrapur-2 S9 0.106
10. Pantnagar-1 S10 0.109
11. Pantnagar-2 S11 0.096
DocumentsPDFComplete
Click Here & UpgradeExpanded Features
Unlimited Pages

275
Table 6.2.13. Variation of Micronutrients in the Soils of different sites of the Tarai region of Uttarakhand state
(India).
Year: 2006
Metals/Site No. S1 S2 S3 S4 S5 S6 S7 S8 S9 S10 S11
Zinc (in ppm) 1.0 2.50 0.76 1.38 0.27 1.45 1.07 1.34 0.73 0.82 0.79
Manganese (in ppm) 4.0 10.0 1.19 1.65 4.02 3.00 4.00 4.02 2.38 2.78 3.02
Ferrous (in ppm) 4.0 10.0 5.45 5.15 14.79 8.83 10.03 14.79 13.86 12.02 17.02
Copper (in ppm) 2.0 5.00 1.67 1.01 0.49 0.65 0.56 1.16 1.67 0.62 0.53
DocumentsPDFComplete
Click Here & UpgradeExpanded Features
Unlimited Pages

276
A detailed study of the present work done on the soil types of the Tarai
region of Uttarakhand state (India) indicates that except in a few sites the soils
are almost sufficient in Fe, Mn, Cu, Na, S and P.
The entire Tarai region is very poor in the concentration of nitrogen and
nitrogen contaning compounds. Organic Matter Content is also remarkably low
in this region.
Potassium (K) popularly known as Potash in the Fertilizer Industry
has a considerably high value in almost all the soil types of Taria region,
Uttarakhand state (India).
A comparison of the present work, which was concentrated on the
soil types of the Tarai region of Uttarakhand state (India) with the earlier
studies Chhabra (1993), Kaur (1995), Raghwvansh (2002), Shiveshwer
Pratap Singh (2002), Pande (2002), and Trilochan (2004) done on the soil
types of Hill and the Bhabar region of this state was done with the objective
to establish a relationship between the soil types of these regions for the use
of the farmers of this region. Attempt was also made so that the present
study could be a small academic contribution in this field.
A perusal of the present study and earlier studies (Chhabra (1993),
Kaur (1995), Raghwvansh (2002), Shiveshwer Pratap Singh (2002), Pande
(2002) and Trilochan (2004)) indicates that the soil types of the Tarai
region are almost the same in the chemical properties with the soil types of
the Hill and Bhabar of Uttarakhand state (India). But except a few sites the
physical properties including the appearance of the soil types of all these
three regions namely Hill region, Bhabar region and Tarai region are
different. The probable reason of the similarties between the chemical
properties is perhaps because in the Bhabar and Tarai regions alsmot all
the soils have come from the hills due to land slides, rains and with the
rivers/streams which flow from hill tops, down to the plains. The difference
DocumentsPDFComplete
Click Here & UpgradeExpanded Features
Unlimited Pages

277
in the physical properties as well as in the appearance is probably due to
the remarkable temperatue and climatic differences in these regions.
The present work would definitely be useful not only for the
farmers of this reagion but would also be of academic interest. Attempts
have been made to undertake the detailed study of all the objectives
mentioned in 1.2 earlier. But no study can be said to be sufficient and
complete unless the study is worth use of everyone concerned. It is
therefore proper to say that whatever be the shortcomings of this study, a
detailed study in this field would further be carried out to make the study
more useful and more fruitful.
DocumentsPDFComplete
Click Here & UpgradeExpanded Features
Unlimited Pages

CHAPTER VII
REFERENCES
DocumentsPDFComplete
Click Here & UpgradeExpanded Features
Unlimited Pages

278
REFERENCES
1. Zonn, S.V.;(1986), Tropical and Subtropical Soil Science, Mir
Publishers, Moscow.
2. Sachan R.S.; Ram N and Upadhyay R.M.; (1986), Prayogik Mride
Parikshan ewam Urvarak Prabandh Publications Directrate, G.B. Pant,
University of Agriculture and Technology, Pantnagar.
3. Cook Raj L. and Ellis Boyd. G.; (1987), Soil Management, A World
View of Conservation and Production, John Willey and Sons, New
York.
4. Shukla, R.S. and Chandel, P.S.;(1991), Plant Ecology and Soil Science,
S. Chand and Co. Ltd., New Delhi, VII edition.
5. Zou Xiaoming; Binkley Dan; and Doxtader Kenneth G.; (1992). A new
method for estimating gross phosphorus mineralization and
immobilization rates in soils”, Plant and Soil, 147, 243-250.
6. Lesch S.M.; Rhodes J.D.; Lund L.J. and Corwin D.L; (1992). “Mapping
Soil Salinity Using Calibrated Electromagnetic Measurements , Soil
Sci. Soc. Am. J., 56, 540-548.
7. Batch L. B. ;(1992), “Soil water movement in response to Temperature
Gradients: Experimental Measurements and Model Evaluation”, Soil
Sci. Soc. Am. J., 56, 37-46.
8. Sheppard Marsha I.; Thibault Denis H.; (1992). “Desorption and
Extraction of selected Heavy Metals from soils”, Soil Sci. Soc. Am. J.,
56, 415-423.
9. Meek B.D.; Rechel E.R.; Carter L.M. and Detar W.R.; (1992). “Bulk
Density of a sandy loam: Traffic, Tillage, and Irrigation Methods
Effects”, Soil Sci. Soc. Am. J., 56, 562-565.
DocumentsPDFComplete
Click Here & UpgradeExpanded Features
Unlimited Pages

279
10. Tietema A.; Warmerdam B.; Lenting E. and Riemer L; (1992), Abotic
factors regulating nitrogen transformations in the organic layer of acid
forest soils: Moisture and pH , Plant and Soil, 147, 69-78.
11. Sjöström Jan and Qvarfort Ulf ;(1992), Long-Term, Changes of Soil
Chemistry in Central Sweden , Soil Science, 1,54(6), 450-457.
12. Selassie T.G.; Jurinak J.J; and Dudley L.M; (1992), Saline and Sodic-
Saline Soil Reclamation: First Order Kinetic Model , Soil Science,
154(1), 1.
13. Kemp Paul R.; Cornelius Joe M. and Reynolds James F. ;(1992), A
Simple Model for Predicting Soil Temperatures in Desert Ecosystems ,
Soil Science, 153(4), 280.
14. Basta N.T. and Tabatabai M.A. ;( 1992), Effect of Cropping Systems
on Adsorption of Metals by Soils: II. Effect of pH , Soil Science, 153(3),
195.
15. Grigal D.F.; and Ohmann L.F.; (1992), Carbon Storage in Upland
Forests of the Lake States , Soil Sci. Soc. Am. J., 56, 935-943.
16. Schnitzer M.; and Kodama H.; (1992), Interactions between Organic
and Inorganic Components in Particle-Size Fraction Separated from
Four Soils , Soil Sci. Soc. Am. J., 1099-1105.
17. Moore T.R.; Souza W. DE and Kopriunjak J-F; (1992), Controls on
the Sorption of Dissolved Organic Carbon by Soils , Soil Sc., 154(8),
120.
18. Williams R.D.; Ahuja L.R. and Naney J.W; (1992), Comparison of
Methods to Estimate Soil Water Characteristics from Soil Texture, Bulk
Density, and Limited Data , Soil Science, 153(1), 172-183.
19. Walters D.T.; Aulakh M.S.; Doran J.W; (1992), Effects of Soil
Aeration, Legume Residue, and Soil Texture on Transformations of
Macro- and Micronutrients in Soil , Soil Science, 153(2), 100-107.
DocumentsPDFComplete
Click Here & UpgradeExpanded Features
Unlimited Pages

280
20. Bauer Armand and Black A.L; (1992), Organic Carbon effects on
Available Water capacity of three Soil Textural Groups , Soil Sci. Soc.
Am. J., 56, 248-254.
21. Johanson J.A.; Farmer W.J; (1993), Batch versus Column method for
determining distribution of organics between soil and Water phases ,
Soil Sci., 155(2), 92-99.
22. Tamari S.; Bruckler L.; Halbertsma J.; and Chadoeuf J.; (1993), A
Simple Method for Determining Soil Hydraulic Properties in the
Laboratory , Soil Sci. Soc. Am. J., 57, 642-651.
23. Moshrefi N. ;(1993), A New method of Sampling Soil Suspension for
particle size analysis , Soil Sci., 155 (4), 245-248.
24. Amrhein C.; Mosher P.A. and Brown A.D; (1993), The Effects of
Redox on Mo, U, B, V, AND As Solubility in Evaporation Pond Soils ,
Soil Sci., 155(4), 249.
25. XING-CHU QIU; YING-QUAN ZHU; (1993), Rapid Analysis of
Cation Exchange Properties in Acidic Soils , Soil Sci., 155(4), 301.
26. REHMAN ATA-UR; DURNFORD DEANNA S; (1993), Soil
Volumetric Shrinkage Measurements: A Simple method , Soil Sci.,
155(5), 325-330.
27. Massman W.J; (1993), Periodic Temperature Variations in an
inhomogenous Soil: A Comparison of Approximate and Exact Analytical
Expression”, Soil Sci., 155(5), 331.
28. Campbell C.A.; and Zentner R.P.; (1993), Soil Organic Matter as
Influenced by Crop Rotations and Fertilization , Soil Sci. Soc. Am. J.,
57, 1034-1040.
29. Mordelet P.; Abbadie L. and Menaut J.C; (1993), Effects of tree
clumps on soil characteristics in a humid savanna of West Africa
(Lamto, Coted Ivoire) , Plant and Soil, 153, 103-111.
DocumentsPDFComplete
Click Here & UpgradeExpanded Features
Unlimited Pages

281
30. Giesler R.; Lundstrom U; (1993), Soil Solution Chemistry: Effects of
Bulking Soil Samples , Soil Sci. Soc. Am. J., 57, 1283-1288.
31. ZHU B.; ALVA A.K.; (1993), Differential Adsorption of Trace Metals
by Soils as Influenced by Exchangeable Cations and Ionic Strength ,
Soil Sci., 155(1), 61-66.
32. Chiang S.C.; Radcliffe D.E.; Miller W.P; (1993), Hydraulic properties
of Surface Seals in Georgia Soils , Soil Sci. Soc. Am. J., 57, 1418-
1426.
33. Raven K.P.; Hossner L.R.; (1993), Phosphorus Desorption Quantity-
Intensity Relationships in Soils , Soil Sci. Soc. Am. J., 57, 1501-1508.
34. Yaan Cheng, Pettry D.E; (1993), Horizontal and Vertical Movements
of Two Expansive Soils in Mississippi , Soil Sci. Soc. Am. J., 57, 1542-
1547.
35. Chhabra Gulshan; (1993), Available Micronutrient Cations as related to
the Properties of Hill, Tarai and Alluvial Soils From Gola-Kosi
interbasin, Ph.D. Thesis, G.B. Pant University of Agriculture and
Technology Pantnagar.
36. Osaki M.; (1993), Carbon-nitrogen interaction model in field crop
production , Plant and Soil, 155/156, 203-206.
37. Grant R.F.; (1993), Simulation model of soil compaction and root
growth , Pant and Soil, 150, 1-4.
38. Whitehead D.C.; Raistrick N. ;( 1993), The volatilization of ammonia
from Cattle urine applied to soils are influenced by soil properties ,
Plant and Soil, 148, 43-51.
39. Vaz M.D. Ron; Edwards A.C.; Shand C.A. and Cresser M.S.; (1993),
Phosphorus fractions in soil solution: Influence of soil acidity and
fertiliser additions , Plant and Soil, 148, 175-183.
DocumentsPDFComplete
Click Here & UpgradeExpanded Features
Unlimited Pages

282
40. Zhu B.; Alva A.K.; (1993), Trace metal and cation Transport in a
Sandy Soil with various Amendments , Soil Sci. Soc. Am. J., 57, 723-
727.
41. Quisenberry V.L.; Smith B.R.; Phillips R.E.; Scott H.D.; Nortclife S.
(1993), A Soil Classification System for Describing Water and
Chemical Transport , Soil Sci., 156(5), 306-315.
42. Chow T.L.; Rees H.W.; Webb K.T. and Langille D.R. (1993), Modification
of Subsoil Characteristics Resulting from Drainage Tile Installation , Soil
Sci., 156(5), 346.
43. Kuiters A.T.; Mulder W. ;( 1993), Water Soluble Organic Matter in
Forest Soils , Plant and Soil, 152, 225-235.
44. Lefroy Rod D.; Blair Graeme J.; and Strong Wayne M.; (1993),
Changes in soil organic matter with cropping as measured by organic
carbon fractions and 13C natural isotope abundance , Plant and Soil,
155/156, 399-402.
45. Paige G.B.; Hillel D.; (1993), Comparison of three methods for
Assessing Soil Hydraulic properties , Soil Sci., 155(3), 175.
46. Mc Laughlin M.J.; Lancaster P.A.; Sale P.W.G.; Uren N.C. and Peverill
K.I ;.( 1993), Use of cation/anion exchange membranes for multi-
elements testing of acidic soils , 155/156, 223-226.
47. Norfleet M.L.; Karathanasis A.D.; and Smith B.R. ;( 1993), Soil
Solution Composition Relative to Mineral Distribution in Blue Ridge
Mountain soil , Soil Sci. Soc. Am. J., 57, 1375-1380.
48. Kumar Raj; Ahuja R.L.; Singh N.T.; and Ghabru S.K.; (1994),
Occurrence of Sodic Soils at Different Geomorphic Locations and
Climate in the Satluj-Yammuna Divide , J. Indian Soc. Soil Sci., 42(1),
114-119.
DocumentsPDFComplete
Click Here & UpgradeExpanded Features
Unlimited Pages

283
49. Jalota S.K.; (1994), Evaporation Parameter in Relation to Soil Texture
and Atmospheric Evaporativity to Predict Evaporation from Bare Soil ,
J. Indian Soc. Soil Sci., 42(2), 178-181.
50. Knoepp Jennifer Donaldson; Swank Wayna T. ;( 1994), Long-Term
Soil Chemistry changes in Aggrading Forest Ecosystem , Soil Sci. Soc.
Am. J., 58, 325-331.
51. Sen T.K.; Chamuah G.S.; and Sehgal J.L.; (1994), Occurrence and
characteristics of some Kandi Soils in Manipur , J. Indian Soc. Soil
Sci., 42(2), 297-300.
52. Bhattacharyya T.; Sen T.K.; Singh R.S.; Nayak D.C.; and Sehgal J.L.
(1994), Morphology and classification of Ultisols with Kandic Horizon
in North Eastern Region , J. Indian Soc. Soil Sci., 42(2), 301-306.
53. Soni M.L.; Singh J.P. and Kumar Vinod ;( 1994), Effect of Sewage
sludge Application on the Mineralization of Nitrogen in Soils , J. Indian
Soc. Soil Sci., 42(1), 17-21.
54. Chand Milap; Dhillon N.S.; (1994), Evaluation of various Soil Test
methods for available phosphorous in Reclaimed Sodic Soils of
Punjab , J. Indian Soc. Soil Sci., 42(2), 278-281.
55. Bhattacharya T.; Srivastava R.; Sharma J.P.; Sehgal J.L.;
(1994), Classification of Saline-Sodic Vertisols in the Coastal Plains of
Gujarat , J. Indian Soc. Soil Sci., 42(2), 306-309.
56. Bharadwaj Venkatesh and Omanwar P.K.; (1994), Long Term Effects
of Continuous Rotational Cropping and Fertilization on Crop Yields
and Soil Properties-II. Effects on EC, pH, Organic Matter and Available
Nutrients of Soil , J. Indian Soc. Soil Sci., 42(3), 387-392.
57. Bharadwaj Venkatesh; Bansal S.K.; Maheshwari S.C. and Omanwar
P.K.; (1944), Long Term effects of continuous Rotational cropping and
fertilization on crop yields and Soil properties-III changes in the
DocumentsPDFComplete
Click Here & UpgradeExpanded Features
Unlimited Pages

284
fractions of N, P and K of the soil , J. Indian Soc. Soil Sci., 42(3): J.
Indian Soc. Soil Sci., 42(3), 392-397.
58. Mathan K.K.; Natarajan S.; and Mahendran P.P.; (1994), Application
of Fertility Capability Classification Concept in Major Soil Groups of
Kamarajar District, Tamil Nadu , J. Indian Soc. Soil Sci., 42(3), 416-
420.
59. Neto Ladislau Martin; Andriulo Anrian Enrique and Traghetta Dinis
Gomes; (1994), Effects of Cultivation on ESR Spectra of Organic
Matter from Soil Size Fractions of a Mollisol , Soil Science, 157(6),
365.
60. Chandrasekharan H.; Yadav B.R.; Tomar S.P.S. and Sharma P.B.S.;
(1994), Studies on Salinity and Water Content of Soils Geoelectrical
Approach , J. Indian Soc. Soil Sci., 42(3), 430-436.
61. Lebron I.; Suarez D.L.; and Alberto F.; (1994), Stability of a
Calcareous Saline-Sodic During Reclamation , Soil Sci. Soc. Am. J.,
58, 1753-1762.
62. Kun-Huang Houng ;( 1994), Simulation of Cation Exchange Involving
Hydrogen Ion in Soil , Soil Sci. Soc. Am. J., 58, 1086-1094.
63. Preston C.M.; Newman R.H. and Rother P.; (1994), Using 13C CPMAS
NMR to assess effects of cultivation on the organic matter of particle
size fractions in a grassland soil , Soil Sci., 157(1), 26-35.
64. Kohut Connie K.; Dudas M.J.; (1994), “Characteristics of Clay
Minerals in Saline Alkaline Soils in Alberts Canada , Soil Sci. Soc.
Am. J., 58, 1260-1269.
65. Xing B.; Dudas M.J. ;( 1994), Characterization of Clay minerals in
white clay soils, people s republic of China , Soil Sci. Soc. Am. J., 58,
1253-1259.
DocumentsPDFComplete
Click Here & UpgradeExpanded Features
Unlimited Pages

285
66. Schmidhalter U.; Kahr G.; Evequoz M.; Studer C. and Oertli J.J. ;(
1994), Adsorption of Thiamin (Vitamin B1) on Soils and Clays , Soil
Sci. Soc. Am. J., 58, 1829-1837.
67. Johns Mitchell M.; Skogley Earl O.; (1994), Soil Organic Matter
Testing and Labile Carbon Identification by Carbonaceous Resin
Capsules , Soil Sci. Soc. Am. J., 58, 751-758.
68. Veldkamp E.; Weitz A.M.; (1994), Uncertainly Analysis of δ 13C
Method in Soil Organic Matter Studied , Soil Bio. Biochem. 26(2),
153-160.
69. Xu Shihe; and Stephen Boyd A.; (1994), Cation Exchange Chemistry
of Hexa-decyltrimethylammonium in a Subsoil Containing Vermiculite , Soil
Sci. Soc. Am. J., 58, 1382-1391.
70. Diwakar D.P.S.; Singh R.N. ;( 1994), Characterization of Soils of
Diara Land Occuring in Gangetic Plains of Bihar , J. Indian Soc. Soil
Sci., 42(3), 420-425.
71. Barber R.G.; Diaz O.; (1994), Maintenance of Yields and Soil Fertility
in Nonmechanized Cropping Systems, Bolivia , Soil Sci. Soc. Am. J.,
58, 858-866.
72. Sanchez-Maranon M.; Delgado G.; Delgado R.; Perez M.M. and
Melgosa M.; (1995), Spectroradiometric and Visual Color Measurements
of Disturbed and Undisturbed Soil Samples , Soil Sci., 160(1), 291.
73. Anthony W.H.; Hutchinson G.L. and Livingston G.P.; (1995),
Chamber Measurement of Soil-Atmosphere Gas Exchange: Linear Vs
Diffusion-Based Flux Models , Soil Sci. Soc. Am. J., 59, 1308-1310.
74. Polubesova Tamara A.; Chorover Jon and Sposito Garrison ;( 1995),
Surface Charge Characteristics of Podzolized Soil , Soil Sci. Soc.
Am. J., 59, 772-777.
DocumentsPDFComplete
Click Here & UpgradeExpanded Features
Unlimited Pages

286
75. Backes Clare A.; Mcaren Ronald G.; Rate Andrew W. and Swift Roger
S.; (1995), Kinetics of Cadmium and Cobalt Desorption from Iron and
Manganese Oxides , Soil Sci. Soc. Am. J., 59, 778-785.
76. CHAVAN K.N.; KENJALE R.Y. and CHAVAN A.S.; (1995), Effect
of Forest Tree Species on Properties of Lateritic Soil , J. Indian Soc.
Soil Sci., 43(1), 43-46.
77. John K. Susan; Abraham Alice ;( 1995), Microbial Immobilization and
Mineralization of Nutrients during Different Seasons of the Year , J.
Indian Soc. Soil Sci., 43(1), 47-52.
78. Sahu G.C.; Bala Nirmalya; (1995), Characterization and
Classification of soils on valley plains of middle Andaman Island , J.
Indian Soc. Soil Sci., 43(1), 99-103.
79. Maji B.; Bandyopadhyay B.K. ;( 1995), Characterization and
Classification of Coastal Soils of various pH Groups in Sundarbans,
West Bengal , J. Indian Soc. Soil Sci., 43(1), 103-107.
80. Skyllberg Ulf ;( 1995), Solution/Soil Ratio and release of Cations and
Acidity from Spodosol Horizons , Soil Sci. Soc. Am. J., 59, 786-795.
81. Ben-dor E.; Banin A.; (1995), Near Infrared analysis as a rapid
method to simultaneously evaluate several soil properties , Soil Sci.
Soc. Am. J., 59, 364-372.
82. Moraes Jener L.; Cerri Carlos C.; Melillo Jerry M.; Kicklighter David;
Neill Christopher; Skole David L. and Steudler Paul A. ;(1995), Soil
Carbon Stocks of the Brazilian Amazon Basin , Soil Sci. Soc. Am. J.,
59, 244-247.
83. Curtin D.; Smillie G.W.; (1995), Effects of incubation and pH on soil
solution and exchangeable cation ratios , Soil Sci. Soc. Am. J., 59,
1006-1011.
84. Jeffrey S. Kern ;(1995), Evalution of Soil Water Retention Model Based on
Basic Soil Physical Properties , Soil Sci. Soc. Am. J., 59, 1134-1141.
DocumentsPDFComplete
Click Here & UpgradeExpanded Features
Unlimited Pages

287
85. Homann P.S.; Sollines P.; Chappell H.N. and Stangenbrger A.G. ;(1995),
Soil Organic Carbon in a Mountainous, Forested Region: Relation to Site
Characteristics , Soil Sci. Soc. Am. J., 59, 1468-1475.
86. Mahendran P.P.; Mathan K.K.; (1995), Relative Importance of
Component Soil Properties on Saturated Hydraulic Conductivity in
Soil , J. Indian Soc. Soil Sci., 43(2), 149-151.
87. Igwe C.A.; Akamigbo F.O.R. and Mbagwu J.S.C. ;( 1995), Physical
Properties of Soils of South-Eastern Nigeria and the Role of Some
Aggregating Agents in Their Stability , Soil Science, 160(6), 431.
88. Rasiah V.; Biederbeck V.O.; (1995), Fractal Dimension of Soil
Aggregates: Influence of Bulk Density, Fitting Procedure, and Oily
Waste Sludge in Corporation , Soil Science, 160(1), 250.
89. Santini A.; Romano N.; Ciollars G. and Comegna V.; (1995), Evalution
of a Laboratory Inverse Method For Determining Unsaturated Hydraulic
Properties of a Soil Under Different Tillage Practices , Soil Science, 160(5):
340.
90. Singh Room; (1995), Role of Soil Texture and Plant Age in Leaf-Water
Potential Measured at Different Crop Stages of Wheat in Mollisols of
Tarai , J. Indian Soc. Soil Sci., 43(3), 327-330.
91. Saha N.; Das A.C. and Mukherjee D.; (1995), Effect of Decomposition of
Organic Matter on the Activities of Microorganism and Availability of
Nitrogen, Phosphorus and Sulphur in Soil , J. Indian Soc. Soil Sci., 43(2),
210-215.
92. Kumar Kailash; Rao K.V.P. and Singh L.J.;(1995), Forms of Acidity in
Some Acid Inceptisols under Different Land Use in Manipur , J. Indian
Soc. Soil Sci., 43(3), 338-342.
93. Bala Parveen; Bhardwaj S.S.; Sidhu P.S. and Singh Bachan ;(1995),
Effect of Ionic Strength on Phosphate Adsorption by Soils , J. Indian
Soc. Soil Sci., 43(3), 342-346.
DocumentsPDFComplete
Click Here & UpgradeExpanded Features
Unlimited Pages

288
94. Avasthe Yashoda and Avasthe R.K. ;(1995), Altitudinal distribution of
Micronutrients in the soil of Sikkim , J. Indian Soc. Soil Sci., 43(3),
374-377.
95. Kumar Pardeep; Sharma S.P.and Sharma P.D.; (1995), Distrubution of
N, P and K in Soan River Valley Soils of Lower Shiwaliks , J. Indian
Soc. Soil Sci., 43(3), 360-364.
96. Hosur G.C.; Dasog G.S.; (1995), Effect of Tree Speices on Soil
Properties , J. Indian Soc. Soil Sci., 43(2), 256-259.
97. Tiwari Ashok; Tiwari K.N. and Mishra S.G.; (1995), Soil Test Methods
and Critical Limits of Potassium in Soil and Plants for Wheat Grown in
Typic Ustochrepts , J. Indian Soc. Soil Sci., 43(3), 408-413.
98. Singh S.K.; Das K.; Shyampura R.L.; Giri J.D.; Singh R.S. and Sehgal
J.L. ;(1995), Genesis and Taxonomy of Black Soils from Basalt and
Basaltic Alluvium in Rajasthan , J. Indian Soc. Soil Sci., 43(3), 430-
436.
99. Courchesene Francois; Savoie Sylvain and Dufresne Alain ;(1995),
Effect of Air-Drying on the Measurement of Soil pH in Acidic Forest
Soil of Quebec, Canada , Soil Science, 160(1), 56.
100. Anderson Michael A.; Hung Albert Y.C; Mills David and Scott Maricia S.
(1995). Factors Affecting the Surface Tension of Soil Solution and Solutions
of Humic Acids , Soil Science, 160(2), 111.
101. Tan, Kim H.; (1995), Soil Sampling, Preparation and Analysis, Marcel
Dekker, Inc. New York.
102. Rao A. Subba; Rao Ch. Srinivash and Pal S.K.; (1996), Predication of
Cation Exchange Capacity from Clay and Organic Carbon of Some
Smectite and Kaolinite-Rich Soils , J. Indian Soc. Soil Sci., 44(2), 214-
219.
DocumentsPDFComplete
Click Here & UpgradeExpanded Features
Unlimited Pages

289
103. Singh J.P.; Kumar Vinod ;(1996), Nitrogen mineralization of legume
Residues in soils in relation to their chemical Composition , J. Indian
Soc. Soil Sci., 44(2), 219-223.
104. Walia and Rao Y.S.; (1996), Genesis, Characteristics and Taxonomic
Classification of Some Red Soils Bundelkhand Region of Uttar
Pradesh , J. Indian Soc. Soil Sci., 44(3), 476-481.
105. Patil C.V.; Math K.K.; Math K.K.; Bulbule A.V.; Prakash S.S and
Yeledhalli N.A.; (1996), Effects of the Fly Ash on Soil Crust Strength
and Crop Yield , J. Maharastra Agric. Univ.,21 (1), 9-11.
106. Ellerbrek R.H.; Gerke H.H.; Bachmann J. and Goebel M.O.; (2005),
Composition of Organic Matter Fraction for Explaining Wettability of
Three Forest Soils , Soil Sci. Soc. Am. J., 69, 57-66.
107. Scheidegger A.M. and Sparks D.L.; (1996), A Critical Assessment of
Sorption-Desorption Mechanisms at the Soil Mineral/Water Interface ,
Soil Science, 161(12), 813.
108. Lawerence Gregory B. and David Mark B.; (1996), Chemical
Evaluation of Soil Solution in Acid Forest Soils , Soil Science, 161(5),
298.
109. Nelson Shad D.; Terry Richard E. ;( 1996), The Effects of Soil Physical
Properties and Irrigation Method on Denitrification , Soil Science,
161(4), 242.
110. Auxtero E.; Ranst E. Van and Sakagami K.; (1996), Properties and
Related Management Implications of Major Soils in Bukidnon,
Philippines , Soil Science, 161(1), 46.
111. Nayak D.C.; Sen T.K.; Chamuah G.S. and Sehgal J.L. ;( 1996), Nature
of Soil Acidity in Some Soils of Manipur , J. Indian Soc. Soil Sci., 44(2),
209-214.
DocumentsPDFComplete
Click Here & UpgradeExpanded Features
Unlimited Pages

290
112. Elahi S.F.; Hossain M.F. and Kamal A.S.M.M; (1996), Characteristics
of Some Soils Developed on Madhupur Clay in Bangladesh , J. Indian
Soc. Soil Sci., 44(3), 482-488.
113. Sharma S.S.; Totawat K.L. and Shyampura R.L.; (1996), Characterization
and classification of soils in a Top sequence over basaltic Terrain , J.
Indian Soc. Soil Sci., 44(3), 470-475.
114. Kumar Kuldip; Gajri P.R. and Arora V.K. (1996). Estimating
Penetration Resistance from Soil Physical Properties , J. Indian Soc.
Soil Sci., 44(3), 375-377.
115. Piccolo Marisa C.; Neill Christopher; Melillo Jerry M.; Carri Carlos C.
and Steudler Paul A.; (1996), 15N natural abundance in forest and
pasture soils of the Brazilian Amazon Basin , Plant and Soil, 182, 249-
258.
116. Lovell R.D. and Jarvis S.C. ;( 1996), Effect of urine on soil microbial
biomass methanogenesis, nitrification and denitrification in grassland soils ,
Plant and Soil, 186, 265-273.
117. Tang C. and Thomson B.D. ;( 1996), Effects of solution pH and bicarbonate
on the growth and nodulation of a range of grain legume species , Plant and
Soil, 186, 321-330.
118. Miyazaki Tsuyoshi ;( 1996), Bulk Density Dependence of Air Entry
Suctions and Saturated Hydraulic Conductivities of Soils , Soil Science,
161(8), 484.
119. Kaushal R.; Bhandari A.R.; Tripathi D. and Sharma J.C. ;(1996), Soil
Water Retention Characteristics of Some Soils under Forests in
Temperate Zone of the Himalayas , J. Indian Soc. Soil Sci., 44(1): 9-12.
120. Hudson D.B.; Wierenga P.J. and Hills R.G. (1996), Unsaturated
Hydraulic Properties from Upward Flow into Soil Cores , Soil Science
Soc. Am. J., 60, 388-396.
DocumentsPDFComplete
Click Here & UpgradeExpanded Features
Unlimited Pages

291
121. Dulohery C.J.; Morris Lawrence A. and Lowrance Richard ;(1996),
Assessing Forest Soil Disturbance through Biogenic Gas Fluxes , Soil
Sci. Soc. Am. J., 60, 291-298.
122. Scott Neal A.; Cole C. Vernon; Elliott Edward T. and Huffman Steve
A.; (1996), Soil Textual Control on Decomposition and Soil Organic
Matter Dynamics , Soil Sci. Soc. Am. J., 60, 1102-1109.
123. Jaramillo Rafael Angulo; Gaudet Jean-Paul; Thony Jean-Louis and
Vauclin Michel; (1996), Measurement of Hydraulic Properties and
Mobile Water Content of a Field Soil , Soil Sci. Soc. Am. J., 60, 710-715.
124. Wang M.K.; Wang S.L. and Wang W.M.; (1996), Rapid Estimation of
Cation Exchange Capacities of Soils and Clays with Methylene Blue
Exchange , Soil Sci. Soc. Am. J., 60, 138-141.
125. Matschonat G.and Vogt R.; (1996), Equilibrium solution composition
and exchange properties of disturbed and undisturbed soil samples from
an acid forest soil , Pant and Soil, 183, 171-179.
126. Sawhney J.S.; Deka B.; Sharma B.D. and Sidhu P.S.; (1996),
Magnitude of Soil Variability in Morphological and Other Properties
Across Different Landscapes in the Siwalik Hills of Punjab”, J. Indian
Soc. Soil Sci., 44(3), 465-469.
127. Skyllberg U.; (1996), Small Scale pH buffering in organic horizons of
two boreal coniferous forest stands. Plant and Soil, 179, 99-107.
128. Baruah T.C.; Aylmore L.A.G. ;( 1996), Thermodynamic Evalution of
Cation Exchange Equilibria in Binary and Ternary Systems on a Sandy
Clay Loam Soil , J. Indian Soc. Soil Sci., 44(1), 16-21.
129. Mondal Ajijul Haque; Nayak Dulal C.; Varadachari Chandrika and
Ghosh Kunal ;( 1997), Spectroscopic, Thermal and Electron
Microscopic Investigations on Clay-Humus Complexes”, J. Indian Soc.
Soil Sci., 45(2), 239-245.
DocumentsPDFComplete
Click Here & UpgradeExpanded Features
Unlimited Pages

292
130. Menzies N.W.; Gillman G.P. ;(1997), Chemical Characterization of
Soils of a Tropical Humid Forest Zone: A Methodology , Soil Sci. Soc.
Am. J., 61, 1355-1363.
131. Tamgadge D.B ;.( 1997), Soil of Gadchiroli District of Maharashtra ,
J. Maharashtra Argic. Univ., 22(1), 1-4.
132. Tamgadge D.B.; (1997), Soils and Their Production Potential of
Bhandara District Maharashtra State , J. Maharashtra Argic. Univ.,
22(1), 5-9.
133. Sen T.K.; Nayak D.C.; Dubey P.N.; Chamuah G.S. and Sehgal J.
;(1997), Chemical and Electrochemical Characterization of Some Acid
Soils of Assam , J. Indian Soc. Soil Sci., 45(2), 245-249.
134. Dey P.; Jain J.M.; (1997), Mineralization and Nitrification in Soil
Amended with Urea and Enriched Green manures in Submerged Soil
System , J. Indian Soc. Soil Sci., 45(2), 249-255.
135. Celi Luisella; Schnitzer Morris; Negre Michele; (1997), Analysis of
Carboxyl Groups in Soil Humic Acids by a Wet Chemical Method, Fourier-
Transform Infrared Spectrophotometry, and Solution-State Carbon-13 Nuclear
Magnetic Resonance: A Comparative Study , Soil Science, 162(3), 189-197.
136. Sahu G.C.; Mishra K.N. ;( 1997), “Morphology, Characteristics and
Classification of Soils of an Irrigated River Flood Plain in the Eastern
Coastal Region”, J. Indian Soc. Soil Sci., 45(1), 152-156.
137. Walia C.S.; and Rao Y.S.; (1997), Characteristics and Classification
of Some Soils of Trans-Yamuna Plain”, J. India Soc. Soil Sci., 45(1),
156-162.
138. Singh V.N.; Mishra B.B. ;( 1997), Irrigability and Productivity
Classification of Some Typical Soils of Sedentary and Alluvial Origins ,
J. Indian Soc. Soil Sci., 45(4), 805-809.
DocumentsPDFComplete
Click Here & UpgradeExpanded Features
Unlimited Pages

293
139. Sarma P.K.; Bordoloi P.K.; Baruah T.C.; Das K.N. and Borah N.
;(1997), Physical Characterization of Soils in Two Command Areas of
Assam , J. Indian Soc. Soil Sci., 45(4), 709-712.
140. Das Madhumita; Singh B.P. and Khan S.K; (1997), Effect of Major Land
Uses on Soil Characteristics of Alfisols in Meghalaya , J. Indian Soc. Soil
Sci., 45(3), 547-553.
141. Burle M.L.; Mielniczuk J. and Focchi S.; (1977), Effect of cropping
systems on soil chemical characteristics with emphasis on soil
acidification , Plant and Soil, 190, 309-316.
142. Jain Theresa B.; Graham Russell T. and Adams David L.; (1997),
Carbon to Organic Matter Ratios for Soils in Rocky Mountain
Coniferous Forests , Soil Sci. Soc. Am. J., 61, 1190-1195.
143. Khan Z.H.; Mazumdar A.R.; Hussain M.S. and Saheed S.M. ;(1997),
Fertility Status and Productivity Potential of Some Benchmark Soils of
Bangladesh , J. Indian Soc. Soil Sci., 45(1), 89-95.
144. Ananthanarayana R.; Ravi Kumar S.M.; (1997), Characterization of Soil
Acidity and Lime Requirement of Soils in the Agroclimatic Zones of Hassan
District of Karnataka , J. Indian Soc. Soil Sci., 45(3), 442-445.
145. Kornecki Ted S.; Allred Barry and Brown Glenn O.; (1997),
DETERMINATION OF CATIONIC AND ANIONIC SURFACTANT
CONCENTRATIONS IN SOIL , Soil Science, 162(6), 439.
146. Chien Yi-Ju; Lee Dar-Yuan; Guo Horng-Yuh and Houng Kun-Huang
;(1997), GEOSTATISTICAL ANALYSIS OF SOIL PROPERTIES OF MID-
WEST TAIWAN SOILS , Soil Science, 162(4), 291.
147. Shaw J.N.; West L.T.; Truman C.C. and Radcliffe D.E. ;(1997),
MORPHOLOGIC AND HYDRAULIC PROPERTIES OF SOILS WITH
WATER RESTRICTIVE HORIZONS IN THE GEORGIA COASTAL PLAIN ,
Soil Science, 162(12), 875.
DocumentsPDFComplete
Click Here & UpgradeExpanded Features
Unlimited Pages

294
148. Schulten Hans-Roff; and Schnitzer Morris; (1997), Chemical Model
Stractures for Soil Organic Matter and Soils , Soil Science, 162(2),
115.
149. Asadu C.L.A.; Diels J. and Vanlauwa B.; (1997), A COMPARISON OF THE
CONTRIBUTIONS OF CLAY, SILT AND ORGANIC MATTER TO THE
EFFECTIVE CEC OF SOILS OF SUBSAHARAN AFRICA , Soil Science,
162(11), 785.
150. Khan Z.H.; Mazumder A.R.; Hussain M.S. and Mohiuddin A.S.M.;
(1997), Total and DTPA-Extractable Fe, Mn, Cu and Zn Contents in
Some Soils of Bangladesh , J. Indian Soc. Soil Sci., 45(3), 485-489.
151. Sharma B.D.; Sidhu P.S.; Kumar Raj and Sawhney J.S.; (1997),
Inceptisols in North-West India , J. Indian Soc. Soil Sci., 45(1), 167-
174.
152. Patil S.G.; Veeramallappa P. and Hebbara M. ;(1997), Suplhate
Retantion as Influenced by pH and Soil Constituents in Some Major Soil
Groups of Karnataka , J. Indian Soc. Soil Sci., 45(1), 48-53.
153. Randhawa H.S.;and Singh S.P.; (1997), Distribution of Manganese
Fractions in Alluvium-Derived Soils in Different Agro-climatic Zones of
Punjab , J. Indian Soc. Soil Sci., 45(1), 53-57.
154. Beyer Lothar; Knicker Heike; Blume Hans-Peter; Bolter Manfred; Vogt
Birgit and Schneider Dieter ;(1997), Soil organic matter of suggest
Spodic horizons in relic arnithogenic soils of coastal continental
Antarctica (Casey Station, Wilkes land) In comparision with that of
Spodic Soil horizons in Germany , Soil Science, 162(7), 518.
155. S(
imunek Ji r( í; Genuchten Martinus Th. van ;(1997), ESTIMATING
UNSATURATED SOIL HYDRAULIC PROPERTIES FORM MULTIPLE
TENSION DISC INFILTROMETER DATA , Soil Science, 162(6), 383.
DocumentsPDFComplete
Click Here & UpgradeExpanded Features
Unlimited Pages

295
156. Malik R.S.; Grewal K.S.; Jhorar B.S. and Oswal M.C.; (1997), A
Simple field method to determine soil dispersiveness”, Soil Science,
162(4), 283.
157. Olesen T.; Griffiths B.S.; Henriksen K.; Moldrup P. and WheaHey R.;
(1997), Modeling diffusion and Reaction in Soils: V. Nitrogen
Transformations in Organic Manure-Amended Soil , Soil Science,
162(3), 157.
158. Low Andrew P.; Stark John M. and Dudley Lynn M. ;( 1997), Effects
of Soil Osmotic Potential on, Nitrification, ammonification, N-
Assimilation, and Nitrous oxide production , Soil Science, 162(1), 16.
159. Barzegar Rahman A.; Nelson Paul N.; Oades J. Malcoim and
Rengasamy Pichu ;( 1997), Organic Matter, Sodicity, and Clay Type:
Influence on Soil Aggregation , Soil Sci. Soc. Am. J., 61, 1131-1137.
160. Knoepp Jennifer D.; Swank Wayne T.; (1997), Forest Management
Effects on Surface Soil Carbon and Nitrogen , Soil Sci. Soc. Am. J., 61,
928-935.
161. Courchesne Francois; and Gobran George R.; (1997), Minerlogical
Variations of Bulk and Rhizosphere Soil form a Norway Spruce Stand ,
Soil Sci. Soc. Am. J., 61, 1245-1249.
162. Nanda S.S.K.; Mishra B.K. and Bhatta A.K.; (1997), Soil
Classification and Soil and land Suitability for Irrigation in Kuanria
Irrigation Project , J. Indian Soc. Soil Sci., 45(2), 333-338.
163. Arya Lalita M.; dierolf Thomas S.; Sofyan Agus.; Widjaja-Adhi I.P.G.
and Genuchten M.Th. van ;(1998), FIELD MEASUREMENT OF THE
SATURATED HYDRAULIC CONDUCTIVITY OF A MACROPOROUS SOIL
WITH UNSTABLE SUBSOIL STRACT-URE , Soil Science, 163(11), 841-
851.
DocumentsPDFComplete
Click Here & UpgradeExpanded Features
Unlimited Pages

296
164. Bhaskar B.P.; Nagaraju M.S.S. ;(1998), Characterization of Some Salt-
Affected Soil Occurring in the Chitravathi River Basin of Andhra
Pradesh , J. Indian Soc. Soil Sci., 46(3), 416-421.
165. Galbraith John M.; Bryant Ray B.; (1998), A FUNCTIONAL
ANALYSIS OF SOIL TAXONOMY IN RELATION TO EXPERT
SYSTEM TECHNIQUES , Soil Science, 163(9), 739-746.
166. Banerjee Saon; Das D.K.; Yadav B.R.; Navindu Gupta;
Chandrasekharan H.; Ganjoo A.K. and Singh Ranjit ;( 1998),
Estimation of Soil Salinity at IARI Farm by Inductive Electro-Magnetic
Technique , J. Indian Soc. Soil Sci., 46(1), 110-115.
167. Sarkar Dipak; Haldar Abhijit; (1998), A Comparison of Different
Methods for pH Determination in Soils of West Bengal , J. Indian Soc.
Soil Sci., 46(2), 180-183.
168. Kumar Jogendra; and Singh Room; (1998), “Phosphorus Adsorption
and Relese Characteristics of Some Soils in Tarai and Bhabar Regions
of Uttar Pradesh , J. Indian Soc. Soil Sci., 46(1), 14-18.
169. Bhattacharyya T.; Dubey P.N.; Das T.K.; Baruah U.; Gangopadhyay
S.K. and Kumar Dilip; (1998), Soil Formation as Influenced by
Geomorphic Processes in the Brahmaputra Flood Plains of Assam , J.
Indian Soc. Soil Sci., 46(4), 647-651.
170. Singh S.K.; Shyampura R.L.; Singh R.S.; Harindranath C.S. and
Venugopal K.R.; (1998), Genesis of Some Soils of Goa , J. Indian Soc.
Soil Sci., 46(4), 651-656.
171. Sidhu G.S.; Manjaiah K.M. and Gosh S.K. (1998), Elemental and
Mineralogical Composition of Coarse Fractions of Some Soils of
Aravallies-Yamuna River Transect in North-West India , J. Indian Soc.
Soil Sci., 46(1), 668-674.
DocumentsPDFComplete
Click Here & UpgradeExpanded Features
Unlimited Pages

297
172. Singh R.N.; Diwakar D.P.S. and Singh R.N.P.; (1998), Mineralogy of
Some Important Soils of Sona Basin , J. Indian Soc. Soil Sci., 46(1),
124-127.
173. Kumaraswamy K., Venu Reddy R.and Babu K. ;( 1998), Cumulative
Effects of Continuous Cropping and Manuring of Sugarcane on Organic
Matter and NPK Status of the Soil , J. Indian Soc. Soil Sci., 46(1), 47-
49.
174. Santhy P.; Sankar S. Jayasree; Muthuvel P. and Selvi D. ;( 1998), Long
Term Fertilizer Experiments- Status of N, P and K Fractions in Soil , J.
Indian Soc. Soil Sci., 46(3), 395-398.
175. Walia C.S.; Ahmed Nayan; Uppal K.S. and Rao Y.S.; (1998), Profile
Distribution of Various Forms of Nitrogen and C/N Ratio in Some
Landforms of Bundelkhand Region of Uttar Pradesh , J. Indian Soc.
Soil Sci., 46(2), 193-198.
176. Clough T.J.; Ledgard S.F.; Sprosen M.S. and Kear M.J. ;( 1998), “Fate
of 15N labelled urine on four soil types , Plant and Soil, 199, 195-203.
177. Laboski C.A.M.; Dowdy R.H.; Allmaras R.R. and Lamb J.A ; (1998),
Soil strength and water content influences on corn root distribution in
a sandy soil , Plant and Soil, 203, 239-247.
178. Pareek N.; Dhillon K.S. and Dhillon S.K.; (1998), Adsorption
/Desorption Behaviour of Selenium in Alluvial Soils of Punjab , J.
Indian Soc. Soil Sci., 46(3), 363-367.
179. Wander M.M.; Bidart M.G. and Aref S.; (1998), Tillage Impacts on
Depth Distribution of Total and Particulate Organic Matter in Three
Illinois Soils , Soil Sci. Soc. Am. J., 62, 1704-1711.
180. Shang C.; Tiessen H. ;(1998), Organic Matter Stabilization in Two
Semiarid Tropical Soils: Size, Density and Magnetic Separations , Soil
Sci. Soc. Am. J., 62, 1247-1257.
DocumentsPDFComplete
Click Here & UpgradeExpanded Features
Unlimited Pages

298
181. McCarty G.W.; Lyssenko N.N. and Starr J.L; (1998), Short-term
Changes in Soil Carbon and Nitrogen Pools during Tillage
Management Transition , Soil Sci. Soc. Am. J., 62, 1564-1571.
182. Drury C.F.; Oloya T.O.; Mckenney D.J.; gregorich E.G.; Tan C.S. and
Vanluyk C.L. ;( 1998), Long-Term Effects of Fertilization and
Rotation on Denitrification and Soil Carbon , Soil Sci. Soc. Am. J., 62,
1572-1579.
183. Dumroese D.S. Page; Jurgensen M.F.; Brown R.E. and Mroz G.D.
(1999), Comparison of Methods for Determining Bulk Densities of
Rocky Forest Soils , Soil Sci. Soc. Am. J., 63, 379-383.
184. Johannisson C.; Myrold D.D. and Hogberg P.;(1999), Retention of
Nitrogen by a Nitrogen-Loaded Scotch Pine Forest , Soil Sci. Soc. Am.
J., 63, 383-389.
185. Kodesová Radka; Ordway Sondra E.; Gribb Molly M. and Simunek Jiri;
1999), ESTIMATION OF SOIL HYDRAULIC PROPERTIES WITH THE CONE
PERMEAMETER: FIELD STUDIES , Soil Science, 164(8), 527.
186. Xingh Baoshan and Chen Zhengqi ;( 1999), PECTROSCOPIC EVIDENCE FOR
CONDENSED DOMAINS IN SOIL ORGANIC MATTER , Soil Science,
164(1), 40-46.
187. Hall Robert D. ;( 1999), A COMPARISON OF SURFACE SOILS AND
BURIED SOILS: FACTORS OF SOIL DEVELOPMENT , Soil Science,
164(4), 264-287.
188. Arocena J.M.; Sanborn P. ;( 1999), Mineralogy and genesis of selected
soils and their implications for forest management in central and
northeastern British Columbia , Canadian J. Soil Sci., 79, 571.
189. Pennock D.J.; McCann B.L.; Jong E. de and Lemmen D.S.;
1999), Effects of soil redistribution on Soil properties in a cultivated
Solonetzic-Chernozemic landscape of southwestern Saskatchewan ,
Canadian J. Soil Sci., 79, 593.
DocumentsPDFComplete
Click Here & UpgradeExpanded Features
Unlimited Pages

299
190. Sun Z.J.; Young G.D.; Mc Farlane R.A. and Chambers B.M.; (1999)
The effect of soil electrical conductivity on moisture determination
using time-domain reflectometry in sandy soil , Canadian J. Soil Sci.,
80, 13-22.
191. Amponsah G.I.; Meyer W.L. and Murchison H.G. ;( 1999), Soil
sampling size estimates for soils under teak (Tectona grandis Linn. F)
Plantations and natural forests in Ashanti Region, Ghana , Canadian J.
Soil Sci., 80, 327-336.
192. Bennett D. Rodney; Hecker Frank J.; Entz Toby and Greenlee Graeme
M. ;(1999), Salinity and sodicity of irrigated Solonetzic and
Chernozemic soils in east-central Alberta , Canadian J. Soil Sci., 80,
117-125.
193. Elberling Bo; Jakobsen Bjarne H. ;(1999), Soil solution pH
measurements using in-line chambers with tension lysimeters ,
Canadian J. Soil Sci., 80, 283-288.
194. Oorts K.; Valauwe B.; Pleysier J. and Merckx R.;(2004), A New
Method for the Simultaneous Measurement of pH-Dependent Cation
Exchange Capacity and pH Buffering Capacity , Soil Sci. Soc. Am. J.,
68, 1578-1585.
195. Ghose T.J.; Kothandaraman G.V. ;( 1999), COMPARISON OF METHODS
FOR DETERMINATION OF ORGANIC PHOSPHORUS IN SOILS OF
TAMIL NADU , J. Soil and Crops, 9(2), 155.
196. Hussain J.; Olson K.R. and Ebelhar S.A. ;( 1999), Long-Term Tillage
(ffects on Soil Chemical Properties and Organic Matter Fraction , Soil
Sci. Soc. Am. J., 63, 1335-1344.
197. Puri G.; Jaipurkar S.A. and Bajpai R.K.;(1999), INFLUENCE OF SOIL
FERTILITY STATUS AND APPLICATION OF PRIMARY NUTRIENTS
(NPK) ON CHEMICAL COMPOSITION AND OIL CONTENT OF
DocumentsPDFComplete
Click Here & UpgradeExpanded Features
Unlimited Pages

300
MUSTARD (Brassica Juncea Linn.), GROWN IN VERTISOLS”, J. Soils
and Crops, 9(2), 164-167.
198. Ingwersen J.; K. Btterbach-Bahl; Gasche R.; Richter O. and Papen H. ;(
1999), Barometric Process Separation: New Method for Quantifying
Nitrification, Denitrification, and Nitrous Oxide Sources in Soils , Soil
Sci. Soci. Am. J., 63, 117-128.
199. Honeycutt C.Wayne ;( 1999), Nitrogen Mineralization from Soil
Organic Matter and Crop Residues: Field Validation of Laboratory
Predictions , Soil Sci. Soci. Am. J., 63, 134-141.
200. Uttaranchal Men Chey (Tea in Uttaranchal); (1999), A manual
Published by Uttarakhand Tea Development Project, Consul Printers,
Nainital.
201. Smith Roger E. ;(1999), “TECHNICAL NOTE: RAPID
MEASUREMENT OF SOIL SORPTIVITY , Soil Sci. Soci. Am. J., 63,
55-57.
202. Schwarz Andreas; Wilcke Wolfgang; Styk Jan and Zech
Wolfgang;(1999), Heavy Metal Release from Soils in Batch pHstat
Experiments , Soil Sci. Soci. Am. J., 63, 290-296.
203. Poudel D.D.; West L.T.; (1999), Soil Development and Fertility
Characteristics of a Volcanic Slope in Mindanao, the Philippines , Soil
Sci. Soci. Am. J., 63, 1258-1273.
204. Mahieu N.; Powlson D.S. and Randall E.W.; (1999), Statistical
Analysis of Published Carbon-13 CPMAS NMR Spectra of Soil Organic
Matter , Soil Sci. Soci. Am. J., 63, 307-319.
205. Page-Dumroese D.S.; Jurgensen M.F.; Browen R.E. and Mroz G.D.;
(1999), Comparison of Methods for Determining Bulk Densities of
Rocky Forest Soils , Soil Sci. Soci. Am. J., 63, 379-383.
DocumentsPDFComplete
Click Here & UpgradeExpanded Features
Unlimited Pages

301
206. Bouma J.; Droogers P. and Peters P.; (1999), Defining the Ideal Soil
Structure in Surface Soil of a Typic Fluvaquent in the Natherland , Soil
Sci. Soci. Am. J., 63, 343-348.
207. Seybold C.A.; Herrick J.E. and Brejda J.J.; (1999), Soil Resilience a
fundamental component of Soil Quality , Soil Science, 164(4), 224.
208. Vaz Pedro Carlos Manoel; Naime Joao de Mendonca and Macedo
Alvaro ;( 1999), SOIL PARTICLE SIZE FRACTIONS DETERMINED
GAMMA-RAY ATTENUATION , Soil Sci., 164(6), 403.
209. Mori Yasushi; Lwama Kenji; Maruyama Toshisuke and Mitsuno Toru ;(
1999), DISCRIMINATING THE INFLUENCE OF SOIL TEXTURE AND
MANAGEMENT-INDUCED CHANGES IN MACROPORE FLOW USING
SOFT X-RAYS , Soil Sci., 164(7), 467.
210. Yuan Guoshu; Xing Baoshan (1999). Site-Energy distribution analysis
of organic Chemical sorption by Soil Organic Matter , Soil Sci.,
167(7), 503.
211. Swift Roger S.; (1996), MACROMOLECULAR PROPERTIES OF SOIL
HUMIC SUBSTANCES: FACT, FICTION, AND OPINION , Soil Sci.,
164(11), 790.
212. Leinweber Peter; Schulten Hans-Rolf and Jancke H ; (1999), NEW
EVIDENCE FOR THE MOLECULAR COMPOSITION OF SOIL ORGANIC
MATTER IN VERTISOLS , Soil Science, 164(11), 857.
213. Rochete P.; Flanagan L.B. and Gregorich E.G. ;( 1999), Separating
Soil Respiration into Plant and Soil Components Using Analyses of the
Natural Abundance of Carbon-13 , Soil Sci. Soci. Am. J., 63, 1207-
1213.
214. Celis Rafael; Koskinen William C.; (1999), Characterization of
Pesticide Desorption form Soil by the Isotopic Exchange Technique ;
Soil Sci. Soci. Am. J., 63, 1659-1666.
DocumentsPDFComplete
Click Here & UpgradeExpanded Features
Unlimited Pages

302
215. Mahapatra S.K.; Rana K.P.C.; Sidhu G.S. and Walia C.S.; (2000),
Assessment of degradation status of Jammu and Kashmir Soils for
their Amelioration , J. Indian Soc. Soil Science, 48(3), 577-581.
216. Chefetz Benny; Chen Yona; Edward C. and Hatcher Patrick G. ;(2000),
Characterization of Organic Matter in Soils by Thermochemolysis Using
Tetramethyl-ammonium Hydroxide (TMAH) , Soil Sci. Soc. Am. J., 64, 583-
589.
217. Zhao Litong; Gray D.M. and Toth B.; (2000), Influence of Soil Texture
on Snowmelt infiltration into Frozen Soils , Canadian J. Soil Sci., 82,
75-83.
218. Tamgadge D.B.; Raja P.; Gaikaward S.T.; Sehgal J.L.; Gajbhiyl K.S.
and Singh S.R.; (2000), “Assessment of Soil Degradation Status in
Madhya Pradesh , J. Ind. Soc. Soil Sci., 48(3), 581-586.
219. Dai X.Y.; Ping C.L.; Candler R.; Haumaier L. and Zech W.; (2000),
Characterization of Soil Organic Mtter Fractions of Tundra Soils in
Arctic Alaska Carbon-13 Nuclear Magnetic Resonance Spectroscopy ,
Soil Sci. Soc. Am. J., 65, 87-93.
220. Helmko, Philip A. (2000) and Summer Malcolm E. (2000). Edited,
Handbook of Soil Science, CRC Press London, B-3.
221. Huang, P.M. (2000). Summer Malcolm E; Edited, Handbook of Soil
Science, CRC Press, London, B-1.
222. Singh H.C.; Shyam Radhey and Lal Chhedi; (2001), “Estimating Soil
Hydraulic Properties Using Field Drippers , J. Indian Soc. Soil
Science, 49(3), 393-399.
223. Sarkar Dipak; Baruah U.; Gangopadhyay S.K.; Sahoo A.K. and
Velayutham M.; (2002), Characteristics and Classification of Soils of
Loktak Catchment Area of Manipur for Sustainable Land Use
Planning , J. Indian Soc. Soil Sci., 50(2), 196-204.
DocumentsPDFComplete
Click Here & UpgradeExpanded Features
Unlimited Pages

303
224. Desharnais Brain M.; Lewis Barbara Ann. G.; (2002), “Electrochemical
Water Splitting at Bipolar Interfaces of Ion Exchange Membranes and
Soils , Soil Sci. Soc. Am. J., 66, 1518-1525.
225. Amelung Wulf; Kaiser Klaus; Kammerer Gerd and Sauer Gustav; (2002),
ORGANIC CARBON AT SOIL PARTICLE SURFACES EVIDENCE
FROM X-RAY PHOTO-ELECTRON SPECTROSCOPY AND SURFACE
ABRASION , Soil Sci. Soc. Am. J., 66, 1526-1530.
226. Dr. Negi, S.S.; (2002), Forest Soil, Internation Book Distribution,
Dehradun.
227. Hand Book of Soil Testing Kit, Biocraft and Scientific Industries, Agra.
228. Pande Promod Kumar; (2002), Studies on the Physico-Chemical
Characteristics and Nutrient Dynamics of Some Soil in the Ramnagar
Region of U.P., Ph.D. Thesis Kumaon University, Nainital.
229. Shiveshwar Pratap Singh ;(2002), Distribution of Micronutrient Cations
in Some Soils of Kumaon Region of Uttaranchal, Ph.D. Thesis, G.B.
Pant University of Agriculture and Technology, Pantnagar.
230. Raghwvansh Prabhat; (2002), Potassium Distribution and Agricultural
Evaluation of Some Bhabar Soil of Uttaranchal, Ph.D. Thesis, G.B. Pant
University of Agriculture and Technology, Pantnagar.
231. Picone L.I.; Cabrera M.L. and Franzluebbers A.J.; (2002), A Rapid
Method to Estimate Potentially Mineralizable Nitrogen in Soil , Soil
Sci. Soc. Am. J., 66, 1843-1847.
232. Teotia U.S.; Ghosh D. and Srivastava P.C.; (2002), A New Anion
Exchange Resin Method for Sulphate-Sulphur Extraction in Mollisols of
Nainital , J. Indian Soc. Soil Sci., 50(1), 19-22.
233. Chefetz Benny; Salloum Myrna J.; Deshmukh Ashish P and Hatcher
Patrick G.; (2002), Structural Components of Humic Acids as Determined
by Chemical Modifications and Carbon-13 NMR, Pyrolysis-, and
DocumentsPDFComplete
Click Here & UpgradeExpanded Features
Unlimited Pages

304
Thermochmolysis-Gas Chromatograpy/Mass Spectrometry , Soil Sci. Soc.
Am. J., 66, 1159-1171.
234. Joosse P.J.; McBride R.A;. (2002), Assessing physical quality of
plastic soils of differing mineralogy and pre-stress history using
mechanical parameters. I. Saturated compression tests , Canadian J.
Soil Sci., 83, 45-63.
235. Martin P.D.; Malley D.F.; Manning G. and Fuller L.; (2002),
Determination of soil organic Carbon and nitrogen at the filed level
using near-infrared spectroscopy , Canadian J. Soil Sci., 82, 413-422.
236. Seena E.; Suresh Kumar P.; Sajnanath K. and Saifudden N.; (2002),
Cation Exchange in Laterite Soils A Critical Assessment Based on
Net Ionic Equilibrium (NIE) , J. Indian Soc. Soil Sci., 50(3), 236-241.
237. Cano A. Faz; Mermut A.R.; Ortiz; Benke M.B. and Chatson B.; (2002),13C CP/MAS-NMR spectra of organic matter as influenced by
vegetation, climate and soil characteristics in soils from Murcia, Spain”,
Canadian J. Soil Sci., 82, 403-411.
238. Pankhurst C.E.; Pierret A.; Hawke B.G. and Kirby J.M
;(2002), Microbiological and chemical properties of soil associated
with macropores at different depths in a red-duplex soil in NSW
Australia , Palnt and Soil, 238, 11-20.
239. Six J.; Conant R.T.; Paul E.A. and Paustian K. ;( 2002), Stabilization
mechanisms of soil organic matter: Implications for C-saturation of
soils , Plant and Soil, 241, 155-176.
240. Bekele A.; Downer R.G.; Wolcott M.C.; Hudnall W.H. and Moore
S.H.;(2003), COMPARATIVE EVALUATION OF SPATIAL
PREDICTION METHODS IN A FIELD EXPERIMENT FOR MAPPING
SOIL POTASSIUM , Soil Science, 168(1), 15-28.
241. Arbestain M. Camps; Barreal M.E.; Mourenza C.; Aluarez E.; Kidd P. and
Macias F.;(2003), RHIZOSPHERE CHEMISTRY IN ACID FOREST SOILS
DocumentsPDFComplete
Click Here & UpgradeExpanded Features
Unlimited Pages

305
THAT DIFFER IN THEIR DEGREE OF AL-SATURATION OF ORGANIC
MATTER , Soil Science, 164(4), 267-279.
242. Maruyama Toshisuke; Tada Akio; Iwama Kenji and Horino Haruliko ;(
2003) Direct observation of soil water movement through soil
macropores using soft x-raysand stereographing , Soil Science, 168(2),
119-127.
243. Schmalz Britta; Lennartz Bernd and Martinus Th. van Genuchten
;(2003), ANALYSIS OF UNSATURATED WATER FLOW IN A LARGE
SAND TANK , Soil Science, 168(1), 3-14.
244. Turner Benjamin L.; Mahiev Nathaliu and Leo M. Condron ;(2003),
Phosphorus-31 Nuclear Magnetic Resonance Spectral Assignments of
Phosphorus Compounds in Soil NaOH-EDTA Extracts , Soil Sci. Soc.
Am. J., 67, 497-510.
245. Nannipieri P.; Ascher J.; Ceccherini M.T.; Landi L.; Pietramellara G.
and Renella G.; (2003), Microbial Diversity and Soil functions ,
European J. Soil Sci., 54, 655-670.
246. Ludwig B.; Kölbl A.; (2003), MODELING CATION EXCHANGE IN
AN UNDISTURBED SUBSOIL AT DIFFERENT FLUX RATES , Soil
Science, 168(4), 253-265.
247. Harris J.A.; (2003), Measurement of the soil microbial community for
estimating the success of restoration , European J. Soil Sci., 54, 801-808.
248. Van Hees P.A.W.; Godbold D.L.; Jentschke G. and Jones D.L.; (2003),
Impact of ectomycorrhizas on the concentration and biodegradation of
simple organic acids in a forest soil , European J. Soil Sci., 54, 697-706.
249. Kinraide T.B.; (2003), Toxicity factors in acidic forest soils: attempts
to evaluate separately the toxic effects of excessive Al3+ and H+ and
insufficient Ca2+ and Mg2+ upon root elongation , European J. Soil Sci.,
54, 323-333.
DocumentsPDFComplete
Click Here & UpgradeExpanded Features
Unlimited Pages

306
250. Smernik R.J.; Oades J.M.; (2003), Spin accounting and RESTORE
two new methods to improve quantitation in solid-state 13C NMR
analysis of soil organic matter , European J. Soil Sci., 54, 103-116.
251. Monday O. Mbila; Michael L. Thompson; Mbagwu Joe and Devid A. Laird;
(2003), MORPHOLOGICAL AND CHEMICAL PROPERTIES OF
SELECTED SLUDGE-AMENDED NIGERIAN SOILS , Soil Science,
168(9), 660.
252. Gerin P.A.; Genet M.J.; Herbillon A.J. and Deluaux B.;2003), Surface
analysis of soil material by X-rays photoelectron spectroscopy ,
Europena J. Soil Sci., 54, 589-603.
253. Cosenza P.; Guerin R. and Tabbagh A. ;( 2003), Relationship between
thermal conductivity and water content of soils using numerical
modelling , Europena J. Soil Sci., 54, 581-587.
254. Garnier P.; Neel C.; Aita C.; Recous S.; Lafolie F. and Mary B. ;( 2003),
Modelling carbon and nitrogen dynamics in a bare soil with and without
straw incorporation , Europena J. Soil Sci., 54, 555-568.
255. Pachepsky Y.A.; Rawls W.L. (2003). Soil structure and pedotransfer
functions , Europena J. Soil Sci., 54, 443-451.
256. Kaiser K.; Guggenberger G.;(2003), Mineral surfaces and soil organic
matter , Europena J. Soil Sci., 54, 219-236.
257. Poulsen Tjalfe G.; Moldrup Per; Wendroth Ole and Nielsen Donald R.
(2003). Estimating saturated hydraulic conductively and air
permeability from Soil. Physical Properties Using State Space
Analysis , Soil Science, 168(5), 311.
258. Hernik H. Nissen; Paul A. Ferré, and Per Moldrup ;( 2003), TIME DOMAIN
REFLECTOMETRY DEVELOPMENTS IN SOIL SCIENCE: I.
UNBALANCED TWO-ROD PROBE SPATIAL SENSITIVITY AND
SAMPLING VOLUME , Soil Science, 168(2), 77-83.
DocumentsPDFComplete
Click Here & UpgradeExpanded Features
Unlimited Pages

307
259. Hernik H. Nissen; Paul A. Ferré, and Per Moldrup ;(2003), TIME DOMAIN
REFLECTOMETRY DEVELOPMENT IN SOIL SCIENCE: II. COAXIAL FLOW
CELL FOR MEASURING EFFLUENT ELECTRICAL CONDUCTIVITY , Soil
Science, 168(2), 84.
260. John J. Kelly ;( 2003), MOLECULAR TECHNIQUES FOR THE ANALYSIS
OF SOIL MICROBIAL PROCESSES: FUNCTIONAL GENE ANALYSIS AND
THE UTILITY OF DNA MICROARRAYS , 168(9), 597-605.
261. Fiedler S.; Kalbitz K. ;( 2003), CONCENTRATIONS AND PROPERTIES OF
DISSOLVED ORGANIC MATTER IN FOREST SOILS AS AFFECTED BY THE
REDOX REGIME , Soil Science, 168(11), 793.
262. Chaplot Vincent; Vlietlanoe Brigitle Van; Walter Christian; Curmi
Pierre and Cooper Miguel ;(2003), SOIL SPATIAL DISTRIBUTION IN
THE ARMORICAN MASSIF, WESTERN FRANCE: EFFECT OF SOIL-
FORMING FACTORS , Soil Science, 168(12), 856.
263. Francisco J. Arriaga; Lowery Birl ;( 2003), SOIL PHYSICAL PROPERTIES
AND CROP PRODUCTIVITY OF AN ERODED SOIL AMENDED WITH
CATTLE MANURE , Soil Science, 168(12), 888.
264. Franklin R.E.; Duis L.; Smith B.R.; Brown R. and Toler J.E.; (2003),
ELEMENTAL CONCENTRATIONS IN SOILS OF SOUTH CAROLINA , Soil
Science, 168(4), 280.
265. Norfleet M.L.; Ditzler C.A.; Puckett W.E.; Grossman R.B. and Shaw J.N;
(2003),SOIL QUALITY AND ITS RELATIONSHIP TO PEDOLOGY , Soil
Science, 168(3), 149-155.
266. Shukla M.K.; Lal R.; Owens L.B. and Unkefer P;(2003), LAND USE
AND MANAGEMENT IMPACTS ON STRUCTURE AND INFILTRATION
CHARACTERISTICS OF SOILS IN THE NORTH APPALACHIAN REGION OF
OHIO , Soil Science, 168(3), 167-176.
DocumentsPDFComplete
Click Here & UpgradeExpanded Features
Unlimited Pages

308
267. Liu Jen-Chyi and Chen Zueng-Sang; (2004), SOIL CHARACTERISTICS
AND CLAY MINERALOGY OF TWO SUBALPINE FOREST SPODOSOLS WITH
CLAY ACCUMULATION IN TAIWAN , Soil Science, 169(1), 66.
268. Thangasamy A.; Naidu M.V.S. and Ramavatharam N; (2004), Clay
Mineralogy of Soils in the Sivagiri Micro-watershed of Chittoor
District, Andhra Pradesh , J. Indian Soc. Soil Sci., 52(4), 454-461.
269. Guber A.K., Pachepsky Y.A. and Levkovsky E; (2004), MASS-SIZE
SCALING IN SOIL AGGREGATES AS AFFECTED BY AGGREGATE
WATER CONTENT AND SOIL COMPACTION , Soil Sci., 169(1), 1.
270. Krishnan P.; Nair K.M.; Naidu L.G.K.; Srinivas S.; Koyal Arti; Nasre
R.A.; Ramesh M. and Gajbhiye K.S; (2004), Land, Soil and Land Use
of Lakshadweep Coral Island , J. Indian Soc. Soil Sci., 52(3), 226-231.
271. Hassan G.; Ismail K.M.; Persaud N. and Reneau R.B. Jr; (2004),
DEPENDENCE OF THE DEGREE OF LINEAR POLARIZATION IN
SCATTERED VISIBLE LIGHT ON SOIL TEXTURAL FRACTIONS , Soil
Science, 169(11), 806.
272. Dolui A.K. and Maity B; (2004), Nature of Soil Acidity in Relation to
Different Forms of Iron and Aluminium of Some Alfisols of West
Bangal , J. Indian Soc. Soil Science, 52(4), 415-420.
273. Hseu Zeng-Yie; Tsai Chen-Chi; Lin Ching-Wei and Chen Zueng-Sang;
(2004). TRANSITIONAL SOIL CHARACTERISTICS OF ULTISOLS
AND SPODOSOLS IN THE SUBALPINE FOREST OF TAIWAN , Soil
Science, 169(6), 457.
274. Patel K.P.; Pandey R.R.; Maliwal G.L.; Patel K.C.; Ramani V.P. and
George V; (2004), Heavy Metal Content of Different Effluents and
their Relative Availability in Soils Irrigated with Effluent Waters around
Major Industrial Cities of Gujarat , J. Indian Soc. Soil Science, 52(1),
89-94.
DocumentsPDFComplete
Click Here & UpgradeExpanded Features
Unlimited Pages

309
275. Sharma V.K.; Sharma P.D.; Sharma S.P.; Achary C.L. and Sood R.K;
(2004), Characterization of Cultivated Soils of Neogal Watershed in
North-West Himalayas and their Suitability for Major Crops , J. Indian
Soc. Soil Science, 52(1), 63-68.
276. Trilochan; (2004), Physico-Chemical Characteristics of the main soil
types of the Bhabar region of Kumaun, Ph.D. Thesis, Kumaun
University, Nainital.
277. Das Madhumita; (2004), Alliance among Hydro-physical and Physico-
chemical Properties of Soil , J. Indian Soc. Soil Science, 52(1), 1-5.
278. Lama T.D.; Mallick S.; and Sanyal S.K; (2004), Solute Transport and
Retention in Some Soils of West Bengal , J. Indian Soc. Soil Science,
52(1), 5-11.
279. Lu Dianquing; Shao Mingan; Horton Robert and Liu Chunping; (2004),
EFFECT OF CHANGING BULK DENSITY DURING WATER
DESORPTION MEASUREMENT OF SOIL HYDRAULIC PROPERTIES ,
Soil Science, 169(5), 319-329.
280. Bhattacharya Ranjan; Prakash Ued; Kundu S.; Srivastva A.K. and Gupta
H.S; (2004), Effect of Long-term Manuring on Soil Organic Carbon,
Bulk Density and Water Retention Characteristics under Soyabean-
Wheat Cropping Sequence in North-Western Himalayas , J. Indian Soc.
Soil Science, 52(3), 238-242.
281. Jena D.; Mishra B.K.; Dash A.K. and Das A.K; (2004), Transport of
Nitrogen Contained in Urea Super Granules Placed in Flooded Rice
Soils , J. Indian Soc. Soil Science, 52(3), 242-247.
282. Brye K.R. and West C.P; (2005), GRASSLAND MANAGEMENT
EFFECTS ON SOIL SURFACE PROPERTIES IN THE OZARK
HIGHLANDS , Soil Science, 170(2), 63-73.
DocumentsPDFComplete
Click Here & UpgradeExpanded Features
Unlimited Pages

310
283. Olness Alan and Archer David; (2005), EFFECT OF ORGANIC
CARBON ON AVAILABLE WATER IN SOIL , Soil Science, 170(2), 90-
101.
284. Solomon Dawit; Lehmann Johannes; Kinyagi James; Liang Biqing and
Schafer Thorten; (2005), Carbon K-Edge NEXAFS and FTIR-ATR
Spectroscopic Investigation of Organic Carbon Speciation in Soils ,
Soil Sci. Soc. Am. J., 69, 107-119.
285. Brouder S.M.; Hofmann B.S. and Morris D.K; (2005), Mapping Soil
pH: Accuracy of Common Soil Sampling strategies and Estimation
Techniques , Soil Sci. Soc. Am. J., 69, 427-442.
286. Sorensen L.K. and Dalsgaard S; (2005), Determination of Clay and
Other Soil Properties by Near Infrared Spectoscopy , Soil Sci. Soc.
Am. J., 69, 159-167.
287. Allen C.E; (2005), Physical and Chemical Characteristics of Soils
Forming on Boulder Tops, Kärkevagge, Swedan , Soil Sci. Soc. Am. J.,
69, 148-158.
DocumentsPDFComplete
Click Here & UpgradeExpanded Features
Unlimited Pages