comparative study of autostereoscopic displays for mobile devices
TRANSCRIPT

Comparative study of autostereoscopic displays for mobile devices
Atanas Boev, Atanas Gotchev Department of Signal Processing, Tampere University of Technology,
P. O. Box 553, FI-33101 Tampere, Finland
ABSTRACT
We perform comparative analysis of the visual quality of multiple 3D displays – seven portable ones, and a large 3D television set. We discuss two groups of parameters that influence the perceived quality of mobile 3D displays. The first group is related with the optical parameters of the displays, such as crosstalk or size of sweet spots. The second group includes content related parameters, such as objective and subjective comfort disparity range, suitable for a given display. We identify eight important parameters to be measured, and for each parameter we present the measurement methodology, and give comparative results for each display. Finally, we discuss the possibility of each display to visualize downscaled stereoscopic HD content with sufficient visual quality.
Keywords: portable 3D displays, parallax barrier, lenticular sheet, light guide, HDDP, crosstalk, accommodation-convergence rivalry, comfort disparity range, subjective quality, downscaled stereoscopic content.
1. INTRODUCTION After the success of “Avatar 3D” movie in late 2009, twenty-eight stereoscopic movies were released in 2010, with thirty-six titles expected to come in 2011 1. The large amount of available 3D content encouraged the companies to produce 3D capable computers and television sets. In 2011, various models of mobile devices with 3D displays to are expected to become available. Examples of currently available devices with 3D displays, include a digital camera and photo frame 2 by Fujifilm, a mobile phone by Sharp 3. Novel 3D-capable devices such as a game console by Nintendo 4, mobile phones by LG 5 and HTC 6, and a tablet by LG 5 are expected in 2011.
One unresolved question in the deployment of 3D-enabled mobile devices is whether the available 3D content will be suitable for the various mobile 3D displays, and to what extent some post-processing of the content will be needed. In order to select 3D display module, the vendors of mobile devices need to know how to compare the visual quality of such displays. In order to produce optimized 3D scenes, the content producers need to know what disparity range is suitable for a given display.
There are several studies on estimating the visual quality of 3D displays. Some studies propose analytical derivations based on knowledge of display properties 7, 8, 9, other studies measure the optical parameters of the displays 10, 11 or perform subjective tests 12, 13, 14. Neither of this approaches is universally applicable, as display properties might not be known to the user, optical parameters might not be directly related to the perceived quality, and subjective tests are time consuming and expensive.
In this paper, we perform comparative analysis of the quality of seven portable 3D displays, and one large 3D television set. We try to identify the important parameters, which would influence the perceived quality of the display. For each parameter, we present the measurement methodology, and make compassion between the results for each display. The paper is organized as follows: in the next section we explain the operation principles of 3D displays. In Section 3 we discuss sources of visual discomfort specific for handheld 3D displays while in Section 4 we describe the display models included in our comparison. In Section 5, display related quality parameters are compared, such as crosstalk, sweet spot size, apparent size and resolution at the optimal viewing distance while Section 6 is about content related parameters, such as objective and subjective disparity comfort zone. Conclusions are given in Section 7.
2. MOBILE 3D DISPLAYS – PRINCIPLE OF OPERATION Most mobile 3D displays are autostereoscopic. Autostereoscopic displays can create binocular illusion of depth without requiring the observer to wear special glasses. They work by beaming different image towards each eye. Most autostereoscopic displays use TFT-LCD matrix for image formation 15, 16. Additional optical filter mounted on top of the
Multimedia on Mobile Devices 2011; and Multimedia Content Access: Algorithms and Systems V, edited by David Akopian,Reiner Creutzburg, Cees G. M. Snoek, Nicu Sebe, Lyndon Kennedy, Proc. of SPIE-IS&T Electronic Imaging,
SPIE Vol. 7881, 78810B · © 2011 SPIE-IS&T · CCC code: 0277-786X/11/$18 · doi: 10.1117/12.879225
SPIE-IS&T/ Vol. 7881 78810B-1
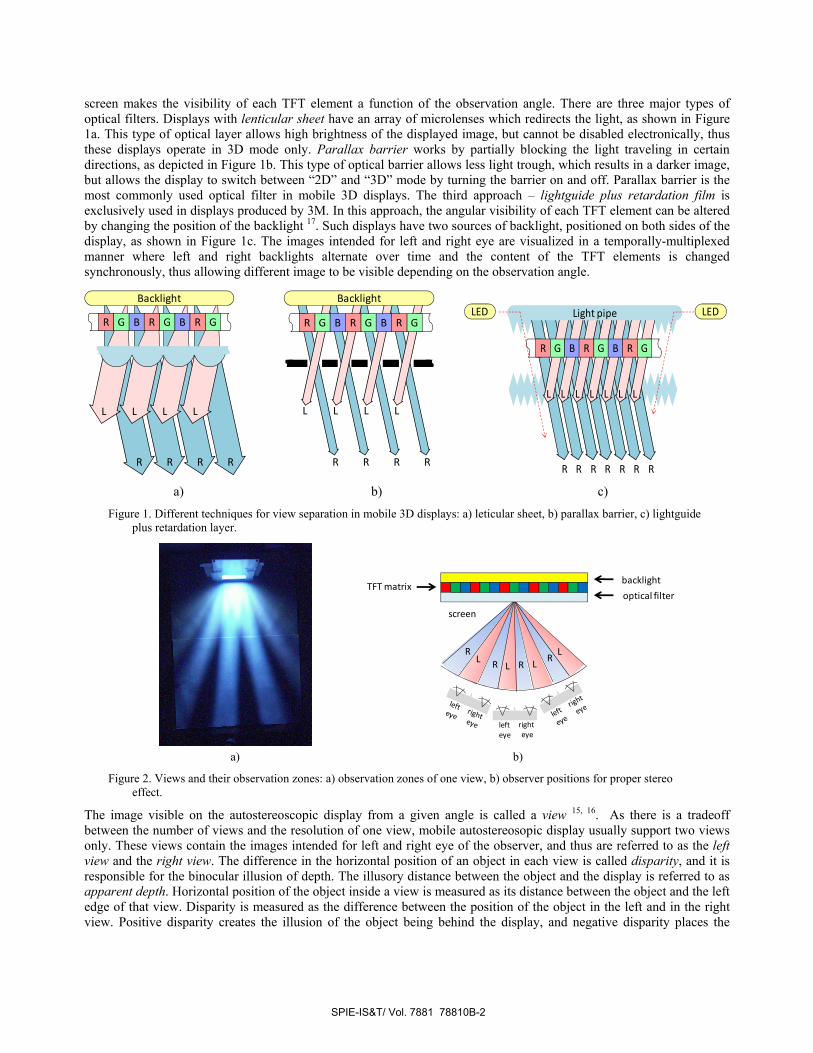
screen makes the visibility of each TFT element a function of the observation angle. There are three major types of optical filters. Displays with lenticular sheet have an array of microlenses which redirects the light, as shown in Figure 1a. This type of optical layer allows high brightness of the displayed image, but cannot be disabled electronically, thus these displays operate in 3D mode only. Parallax barrier works by partially blocking the light traveling in certain directions, as depicted in Figure 1b. This type of optical barrier allows less light trough, which results in a darker image, but allows the display to switch between “2D” and “3D” mode by turning the barrier on and off. Parallax barrier is the most commonly used optical filter in mobile 3D displays. The third approach – lightguide plus retardation film is exclusively used in displays produced by 3M. In this approach, the angular visibility of each TFT element can be altered by changing the position of the backlight 17. Such displays have two sources of backlight, positioned on both sides of the display, as shown in Figure 1c. The images intended for left and right eye are visualized in a temporally-multiplexed manner where left and right backlights alternate over time and the content of the TFT elements is changed synchronously, thus allowing different image to be visible depending on the observation angle.
a) b) c)
Figure 1. Different techniques for view separation in mobile 3D displays: a) leticular sheet, b) parallax barrier, c) lightguide plus retardation layer.
a) b)
Figure 2. Views and their observation zones: a) observation zones of one view, b) observer positions for proper stereo effect.
The image visible on the autostereoscopic display from a given angle is called a view 15, 16. As there is a tradeoff between the number of views and the resolution of one view, mobile autostereosopic display usually support two views only. These views contain the images intended for left and right eye of the observer, and thus are referred to as the left view and the right view. The difference in the horizontal position of an object in each view is called disparity, and it is responsible for the binocular illusion of depth. The illusory distance between the object and the display is referred to as apparent depth. Horizontal position of the object inside a view is measured as its distance between the object and the left edge of that view. Disparity is measured as the difference between the position of the object in the left and in the right view. Positive disparity creates the illusion of the object being behind the display, and negative disparity places the
R G B R G B R G
LL LL
RR RR
Backlight
R G B R G B R G
RR RR
LL LL
Backlight
RR RR
LL LL
R G B R G B R G
Light pipeLED LED
R RR
L LL
LR
screen
R RL RL
L
righteye
lefteye
backlight
optical filterTFT matrix
SPIE-IS&T/ Vol. 7881 78810B-2
object in front of the display. The range of positions from which a view is visible is called visibility zone of that view. A photo of the visibility zones of one view of a mobile 3D display is shown in Figure 2a. If a display has two views, their visibility zones alternate in horizontal direction. There are multiple positions (called sweet spots), from which an observer can perceive proper stereoscopic image as shown in Figure 2b. The procedure of mixing and mapping the images of both views to the TFT elements of the display is called interleaving, and the map, which determines if a TFT element belongs to the left or right view is known as interleaving map. We refer to interleaving maps, where all TFT elements on a row belong to the same view as row-interleaved, and to the ones, where columns of TFT elements belong to the same view - as column-interleaved.
3. SOURCES OF VISUAL DISCOMFORT IN MOBILE AUTOSTEREOSCOPIC DISPLAYS
a. Crosstalk
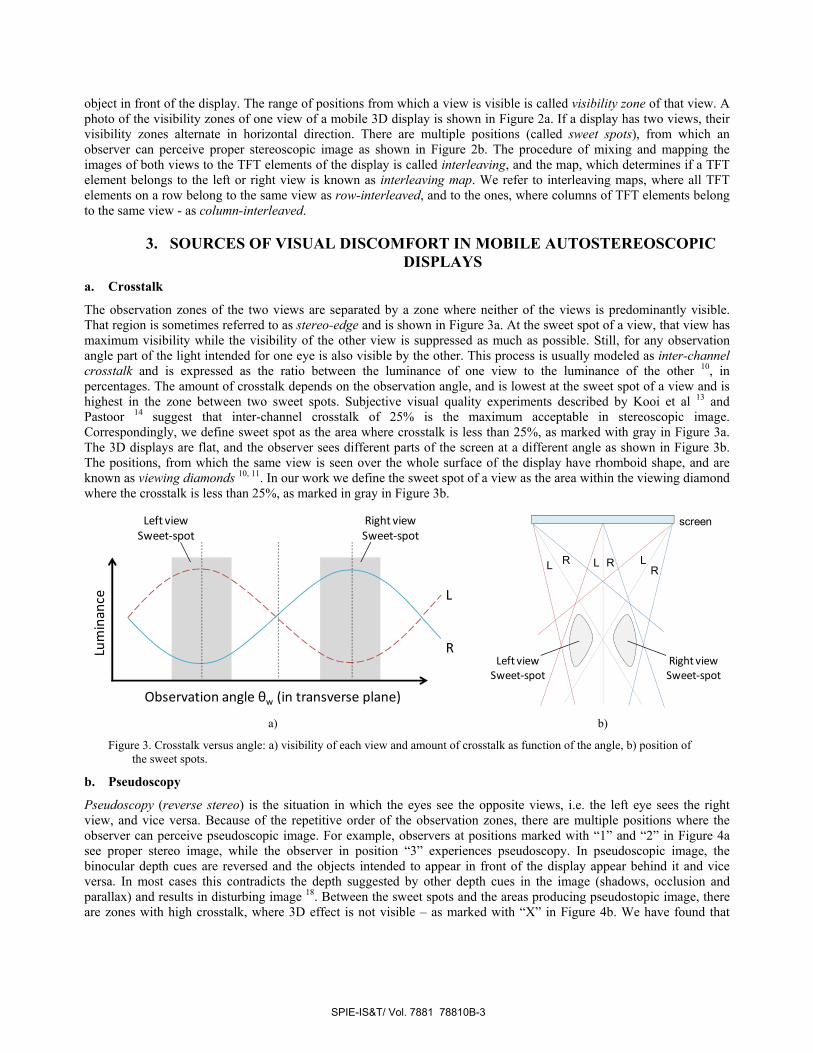
The observation zones of the two views are separated by a zone where neither of the views is predominantly visible. That region is sometimes referred to as stereo-edge and is shown in Figure 3a. At the sweet spot of a view, that view has maximum visibility while the visibility of the other view is suppressed as much as possible. Still, for any observation angle part of the light intended for one eye is also visible by the other. This process is usually modeled as inter-channel crosstalk and is expressed as the ratio between the luminance of one view to the luminance of the other 10, in percentages. The amount of crosstalk depends on the observation angle, and is lowest at the sweet spot of a view and is highest in the zone between two sweet spots. Subjective visual quality experiments described by Kooi et al 13 and Pastoor 14 suggest that inter-channel crosstalk of 25% is the maximum acceptable in stereoscopic image. Correspondingly, we define sweet spot as the area where crosstalk is less than 25%, as marked with gray in Figure 3a. The 3D displays are flat, and the observer sees different parts of the screen at a different angle as shown in Figure 3b. The positions, from which the same view is seen over the whole surface of the display have rhomboid shape, and are known as viewing diamonds 10, 11. In our work we define the sweet spot of a view as the area within the viewing diamond where the crosstalk is less than 25%, as marked in gray in Figure 3b.
a) b)
Figure 3. Crosstalk versus angle: a) visibility of each view and amount of crosstalk as function of the angle, b) position of the sweet spots.
b. Pseudoscopy
Pseudoscopy (reverse stereo) is the situation in which the eyes see the opposite views, i.e. the left eye sees the right view, and vice versa. Because of the repetitive order of the observation zones, there are multiple positions where the observer can perceive pseudoscopic image. For example, observers at positions marked with “1” and “2” in Figure 4a see proper stereo image, while the observer in position “3” experiences pseudoscopy. In pseudoscopic image, the binocular depth cues are reversed and the objects intended to appear in front of the display appear behind it and vice versa. In most cases this contradicts the depth suggested by other depth cues in the image (shadows, occlusion and parallax) and results in disturbing image 18. Between the sweet spots and the areas producing pseudostopic image, there are zones with high crosstalk, where 3D effect is not visible – as marked with “X” in Figure 4b. We have found that
Lum
inan
ce
Observation angle θw (in transverse plane)
R
L
Right viewSweet-spot
Left viewSweet-spot
screen
L L LR RR
Left viewSweet-spot
Right viewSweet-spot
SPIE-IS&T/ Vol. 7881 78810B-3

users of mobile 3D display intuitively change the observation angle in order to avoid zones with high crosstalk, however, avoiding pseudoscopic zones requires conscious effort.
a) b)
Figure 4. Pseudoscopy in mobile 3D displays: a) proper (1 and 2) and wrong (3) positions of the observer, b) zones there proper perception is possible.
c. Aliasing and color bleeding
Autostereoscopic displays are column-interleaved (neighboring TFT elements in the same row belong to different views), thus their horizontal resolution is two times lower that their vertical one. As shown in Figure 5, only half of the TFT elements are visible from an observation position. This is equivalent to horizontal downsampling of the image by a factor of 2. Stereoscopic images are usually prepared for displays with square pixel aspect ratio and need to be suitably pre-filtered before visualized on a 3D display. Otherwise the downsampling performed by the optical filter might create aliasing, which manifests itself as Moiré artifacts. Lightguide-based 3D displays make an exception, as they do not suffer from spatial aliasing. However, they are susceptible to temporal aliasing artifacts.
a) b)
Figure 5. Reasons for color bleeding: a) color balanced interleaving, b) interleaving, causing color misbalance.
The step size used to interleave TFT elements is a potential source of color bleeding artifacts. The elements of a color TFT display are of alternating red, green or blue color, and are also known as sub-pixels. If neighboring sub-pixels from the same row are of different color and the display is column interleaved, the color of the visible image becomes function of the observation angle. Some autostereoscopic displays are interleaved in a sub-pixel level (neighboring sub-pixels from the same row belong to a different view) as shown in Figure 5a. In such case for all observation angles the number of partially occluded sub-pixels is equally distributed along the three colors. In displays with other interleaving step size the amount of visible and partially occluded sub-pixels of certain color might prevail, which introduces color tint for some observation angles as exemplified in Figure 5b. These displays have reduced sweet spot width, since the optimal observation angle of each color channel is slightly different, and the zone which is optimal for all three colors is narrower. In 19 Uehara et al. proposed 3D display with horizontal double-density pixel (HDDP) arrangement, where the color of the sub-pixels change along columns, but the view assignment of sub-pixels change along rows. Displays with such topology do not exhibit color bleeding between the views. Additionally, because of the double pixel density in horizontal direction each view has square pixel aspect ratio which eliminates the most common reason for aliasing.
LR
screen
R RL RL
L
12
3righteye
lefteye R R RL L LX X XX X XX
Stereoscopy StereoscopyStereoscopy
Pseudoscopy Pseudoscopy
Backlight
TFT matrix
Optical filter
R G R GR B G R B GG R B G B
SPIE-IS&T/ Vol. 7881 78810B-4

In Figure 6, one can see the difference between displays with different interleaving map, observed from an angle between two sweet spots. Both images have visible crosstalk, however, the image in Figure 6a also exhibits color bleeding, while the image in Figure 6b exhibits only crosstalk.
a) b)
Figure 6. Crosstalk versus color bleeding between views: a) crosstalk with balanced color distribution, b) crosstalk with additional color bleeding artifacts.
d. Factors limiting the disparity range
The perceived quality of a stereoscopic content is influenced by its maximum and minimum disparity. Content, optimized for large 3D display might not be suitable for smaller one or vice versa. There are two factors that influence the comfort of perception of content with given disparity range – accommodation-convergence (A/C) rivalry, and divergent parallax.
Human vision uses two oculomotor mechanisms to focus on a 3D object and adapt to its depth. One is convergence, in which both eyes perform inward or outward motion in order to bring the projection of the intended object to the foveae of both retinas. The other, called accommodation is the ability of each eye to change its focal power, so the projection of the object is focused on the retina. These two mechanisms are closely coupled, and the eyes automatically accommodate to the distance, suggested by the point of convergence 18. In a natural 3D scene, such coupling increases the speed of accommodation and helps the convergence process by blurring the objects in front and behind the convergence point. However, on a stereoscopic display the conference and focal distances to an object differ. The distance to the converging point is influenced by object disparity, while the focal distance is always equal to the viewing distance, as shown in Figure 7a. This difference causes the objects with pronounced apparent depth to be perceived out-of-focus – an effect, known as accommodation-convergence (A/C) rivalry. In 20, A. Percival defines the combinations of focal and convergence distances, which allow clear vision. On a “focal distance” versus “convergence distance” plot, these combinations define so-called zones of clear single vision 21 (see Figure 7b). Beyond these zones, the A/C rivalry prevents eyes from converging, causing diplopia (double vision). However, inside the zones of clear single vision the observer still might experience A/C rivalry and see objects out of focus. In 22, the authors define so-called Percival’s zone of comfort, which is approximately three times narrower than the zone of clear single vision, as shown in Figure 7b. Within that zone, A/C rivalry is negligible, which allows comfortable 3D perception 21, 22. Notably, the smaller the focal distance is, the more pronounced A/C rivalry is, and smaller differences between focal and convergence distance could lead to uncomfortable 3D scene. As a consequence, the range of “comfortable” disparities is more limited for handheld 3D displays than for displays allowing greater viewing distance.
The inward and outward motion of the eyes is limited. Eyes can converge at distances ranging from about 5cm in front of the head to infinity. The eye muscles do not allow the eyes to look in divergent directions. The maximum disparity
SPIE-IS&T/ Vol. 7881 78810B-5

that can be perceived is limited by the observer’s inter-pupillary distance (IPD). If the disparity is larger, divergent parallax occurs, which is a disturbing, or potentially painful, experience 18. This limitation is somewhat less pronounced in mobile 3D displays, as the mean IPD of 65mm corresponds to substantial part of the display width, the limits imposed by A/C rivalry occur for much lower values.
a) b)
Figure 7. Accomodation-convergence rivalry: a) focal and apparent distance to of an object, b) zones of clear single vision and Persival’s zones of comfort (adapted from 21).
4. DISPLAY MODELS UNDER STUDY In this work, we compare eight autostereosopic displays. The “HDDP” display is lentucular sheet display with HDDP pixel arrangement, produced by NEC LCD 19. The “MI_L” and “MI_P” denote two orientations of a display produced by masterImage 23. That display can operate in 3D-landscape and 3D-portrait mode by changing the direction of its parallax barrier. In either mode, the interleaving is per pixel. “MI_L” denotes the display operating in landscape mode, and “MI_P” – in portrait mode. “FC” is a portable stereoscopic camera produced by Fujifilm and equipped with 3D display 2. The “FC” display uses light guide and retardation layer. Fujifilm also produces 3D photo frame which is labeled with “FF” in our comparison 2. “SL” is a laptop with autostereoscopic 3D display produced by Sharp 24. “V3D” is a prototype of a portable PC with 3D display, which is not in mass production. The “FF”, “SL” and “V3D” displays are all 2D/3D switchable, column-interleaved on a sub-pixel level. For comparison, we have included two displays that work with polarized glasses. “AL” is a laptop with 3D display, produced by Acer, and “VUON” is large 3D television set with HDTV resolution.
Table 1 – display models under study.
Model Description Interleaving Horizontal resolution
(px)
Vertical resolution
(px)
Width (cm)
Height (cm)
HDDP 3.2" display based on the lenticular HDDP technology by NEC
HDDP 427 240 6.9 3.9
MI_L MB403M0117135 by Master Image (landscape 3D mode) Column-interleaved, per pixel 800 480 9.3 5.6 MI_P MB403M0117135 by Master Image (protrait 3D mode) Column-interleaved, per pixel 480 800 5.6 9.3
FC FinePix REAL 3D W1 camera by Fujifilm Light guide 320 240 5.7 4.2 FF FinePix REAL 3D V1 photo frame by Fujifilm Column-interleaved, per sub-pixel 800 600 16.1 12.1 SL Sharp AL3DU (with parallax barrier display) Column-interleaved, per sub-pixel 1024 768 30.3 22.8
V3D Portable computer with 3D display prototype Column-interleaved, per sub-pixel 1024 600 10 5.8 AL Acer AS5738DG-6165 laptop (polarized glasses) Row interleaved 1366 768 34.3 19.3
VUON Vuon E465SV 3D TV set by Hyundai (polarized glasses) Row interleaved 1920 1080 91.5 57
5. DISPLAY RELATED PARAMETERS a. Minimal crosstalk
The optical filter is rarely perfect, and even at the optimal observation position of a view there is still some residual crosstalk. For example, in the sweet spot of the left view (marked by “1” in Figure 8a and Figure 8b) the light of the
Virtual objectFocaldistance
Convergencedistance
Left eye observation
Right eye observation
25
30
50
100
25 30 50 100Convergence distance, cm
Foca
l dis
tanc
e, c
m
Percivial’s zonesof comfort
Zones of clearsingle vision
SPIE-IS&T/ Vol. 7881 78810B-6

right view has some intensity . At the same position, the left view is seen with maximum brightness, and has intensity . One way to measure the crosstalk is to put vertical stripes in the left view and horizontal lines in the right view as proposed in 25. The lines should consist of alternating black (minimum brightness) and white (maximum brightness) regions. In a sweet spot of a view either horizontal or vertical lines would be predominantly visible. From everywhere else the screen would appear with a square pattern as exemplified in Figure 8b. The appearance of the pattern can be used to identify the sweet spot of a view, and the crosstalk can be measured on a photograph of the display. After linearization of the camera response function of the camera making the photo (for example as described in 26), the crosstalk can be measured by analyzing the brightness of four areas of the pattern as shown in Figure 8c. The darkest square in the pattern is where both views contain black pixels. Its intensity is denoted by . The brightest part, where both views contain white pixels has intensity denoted by . We refer to the view that is meant to be visible at the sweet spot where the measurement is done as the current view, and the other – as the other view. The intensity where the current view contains white pixels and the other view contains black pixels is denoted as . The intensity of the part, where the current view has black pixels, and the other view is seen due to crosstalk is denoted as . One should normalize and in a scale where =0 and =1, and then measure the crosstalk as the ratio between and in percentage. Altogether,
· 100, (1)
where is the crosstalk. According to 13, 5% is considered unnoticeable, 10% 25% is noticeable, and crosstalk of more than 25% is rated as unacceptable. However, two of the displays in our comparison exhibited crosstalk higher than 25% - the FC display, which had crosstalk of 35%, and the AL display, which had crosstalk of 28% when used with general purpose polarized glasses. Subjectively, the “FC” display suffers from visible ghosting artifacts, but for natural content with highly textured areas 3D perception is still possible. Figure 9 gives a visual comparison between the amount of minimal crosstalk exhibited by our set of 3D displays and its perceptual impact.
a) b) c)
Figure 8. Minimal crosstalk: a) angular brightness, b) observation positions, c) visual example of minimal crosstalk.
Figure 9. Minimal crosstalk per display model.
screen
L R
I II III
Lum
inan
ce
Observation angle θw (in transverse plane)
R
L
I II III
Imin
1 2 3
1 2 3
Imax
ImaxIC
IOImin
5
10
15
20
Min
imal
cro
ssta
lk in
%
25
30
35
Unnoti-ceable
Slightlynoticeable
Severe crosstalk
Noticeable
HD
DP
MI(L
)
MI(P
)
FC SL
AL
General purposepolarized glasses
Original glasses
FF V3D
SPIE-IS&T/ Vol. 7881 78810B-7
b. Optimal, minimal and maximal viewing distance
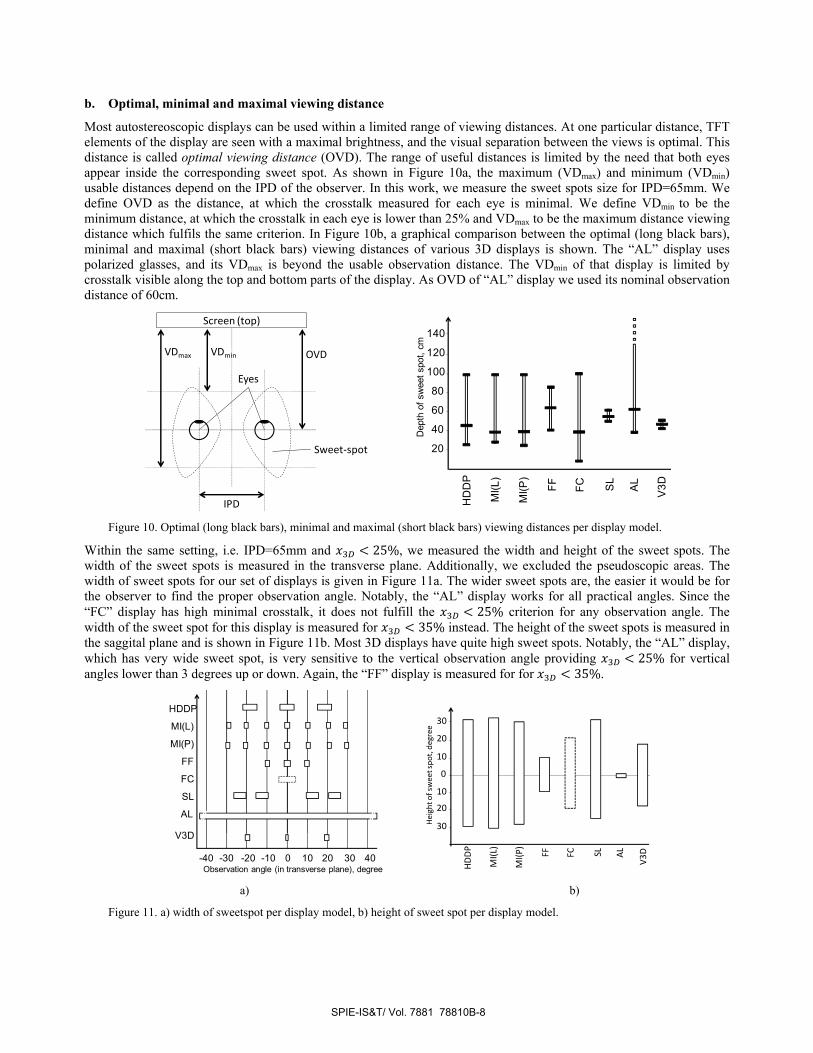
Most autostereoscopic displays can be used within a limited range of viewing distances. At one particular distance, TFT elements of the display are seen with a maximal brightness, and the visual separation between the views is optimal. This distance is called optimal viewing distance (OVD). The range of useful distances is limited by the need that both eyes appear inside the corresponding sweet spot. As shown in Figure 10a, the maximum (VDmax) and minimum (VDmin) usable distances depend on the IPD of the observer. In this work, we measure the sweet spots size for IPD=65mm. We define OVD as the distance, at which the crosstalk measured for each eye is minimal. We define VDmin to be the minimum distance, at which the crosstalk in each eye is lower than 25% and VDmax to be the maximum distance viewing distance which fulfils the same criterion. In Figure 10b, a graphical comparison between the optimal (long black bars), minimal and maximal (short black bars) viewing distances of various 3D displays is shown. The “AL” display uses polarized glasses, and its VDmax is beyond the usable observation distance. The VDmin of that display is limited by crosstalk visible along the top and bottom parts of the display. As OVD of “AL” display we used its nominal observation distance of 60cm.
Figure 10. Optimal (long black bars), minimal and maximal (short black bars) viewing distances per display model.
Within the same setting, i.e. IPD=65mm and 25%, we measured the width and height of the sweet spots. The width of the sweet spots is measured in the transverse plane. Additionally, we excluded the pseudoscopic areas. The width of sweet spots for our set of displays is given in Figure 11a. The wider sweet spots are, the easier it would be for the observer to find the proper observation angle. Notably, the “AL” display works for all practical angles. Since the “FC” display has high minimal crosstalk, it does not fulfill the 25% criterion for any observation angle. The width of the sweet spot for this display is measured for 35% instead. The height of the sweet spots is measured in the saggital plane and is shown in Figure 11b. Most 3D displays have quite high sweet spots. Notably, the “AL” display, which has very wide sweet spot, is very sensitive to the vertical observation angle providing 25% for vertical angles lower than 3 degrees up or down. Again, the “FF” display is measured for for 35%.
a) b)
Figure 11. a) width of sweetspot per display model, b) height of sweet spot per display model.
Sweet-spot
Eyes
IPD
OVDVDminVDmax
Screen (top)
20
40
60
80
Dep
th o
f sw
eet s
pot,
cm
100
120
140
AL
HD
DP
MI(L
)
MI(P
)
FF FC SL
V3D
AL
SL
FC
FF
MI(P)
MI(L)
HDDP
0 10 20 30 40-10-20-30-40Observation angle (in transverse plane), degree
V3D30
20
10
0
Hei
ght o
f sw
eet s
pot,
deg
ree
10
20
30
AL
HD
DP
MI(L
)
MI(P
)
FF FC SL
V3D
SPIE-IS&T/ Vol. 7881 78810B-8
c. Angular size and resolution
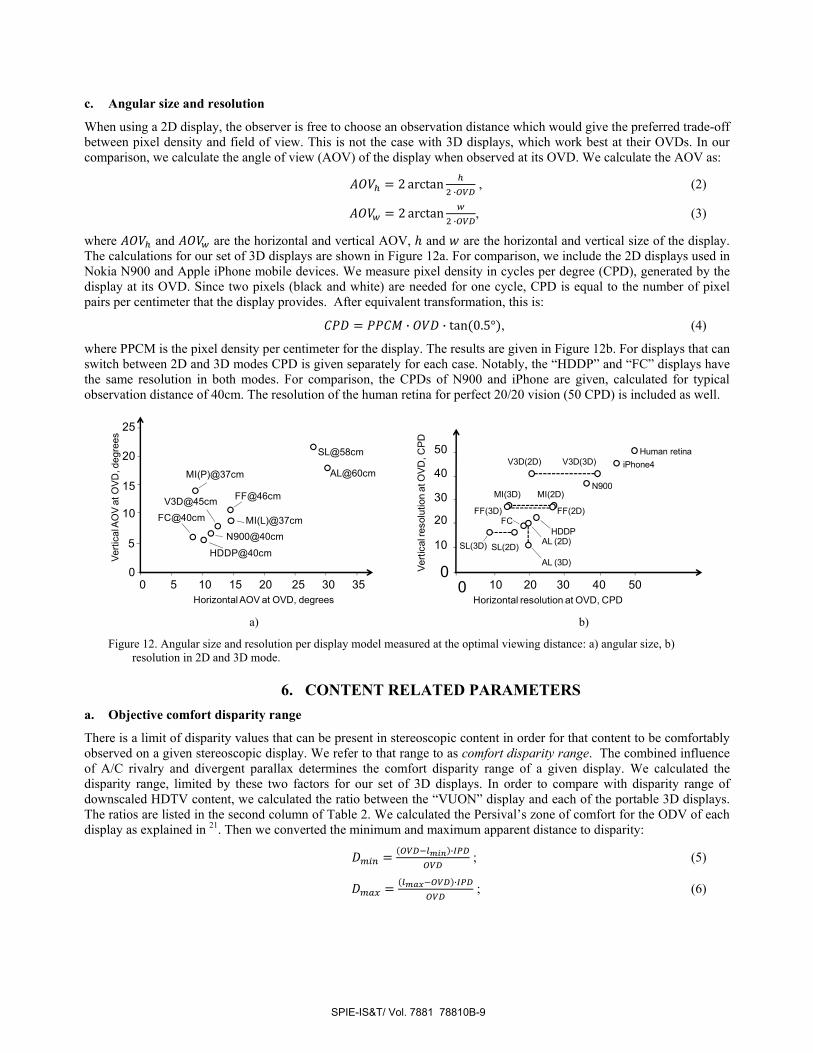
When using a 2D display, the observer is free to choose an observation distance which would give the preferred trade-off between pixel density and field of view. This is not the case with 3D displays, which work best at their OVDs. In our comparison, we calculate the angle of view (AOV) of the display when observed at its OVD. We calculate the AOV as:
2 arctan · , (2)
2 arctan · , (3)
where and are the horizontal and vertical AOV, and are the horizontal and vertical size of the display. The calculations for our set of 3D displays are shown in Figure 12a. For comparison, we include the 2D displays used in Nokia N900 and Apple iPhone mobile devices. We measure pixel density in cycles per degree (CPD), generated by the display at its OVD. Since two pixels (black and white) are needed for one cycle, CPD is equal to the number of pixel pairs per centimeter that the display provides. After equivalent transformation, this is:
· · tan 0.5° , (4)
where PPCM is the pixel density per centimeter for the display. The results are given in Figure 12b. For displays that can switch between 2D and 3D modes CPD is given separately for each case. Notably, the “HDDP” and “FC” displays have the same resolution in both modes. For comparison, the CPDs of N900 and iPhone are given, calculated for typical observation distance of 40cm. The resolution of the human retina for perfect 20/20 vision (50 CPD) is included as well.
a) b)
Figure 12. Angular size and resolution per display model measured at the optimal viewing distance: a) angular size, b) resolution in 2D and 3D mode.
6. CONTENT RELATED PARAMETERS a. Objective comfort disparity range
There is a limit of disparity values that can be present in stereoscopic content in order for that content to be comfortably observed on a given stereoscopic display. We refer to that range to as comfort disparity range. The combined influence of A/C rivalry and divergent parallax determines the comfort disparity range of a given display. We calculated the disparity range, limited by these two factors for our set of 3D displays. In order to compare with disparity range of downscaled HDTV content, we calculated the ratio between the “VUON” display and each of the portable 3D displays. The ratios are listed in the second column of Table 2. We calculated the Persival’s zone of comfort for the ODV of each display as explained in 21. Then we converted the minimum and maximum apparent distance to disparity:
· ; (5)
· ; (6)
AL@60cm
SL@58cm
FF@46cm
MI(L)@37cm
MI(P)@37cm
N900@40cm
HDDP@40cm
FC@40cm
0 5 10 15 20 25 30 350
5
10
15
20
25
Horizontal AOV at OVD, degrees
Verti
cal A
OV
at O
VD, d
egre
es
V3D@45cm
0 10 200
10
20
30
40
Horizontal resolution at OVD, CPD30 40 50
50
N900
iPhone4Human retina
SL(2D)
FC
AL (2D)HDDP
SL(3D)
FF(2D)FF(3D)
MI(3D) MI(2D)
Verti
cal r
esol
utio
n at
OVD
, CPD
V3D(2D) V3D(3D)
AL (3D)
SPIE-IS&T/ Vol. 7881 78810B-9
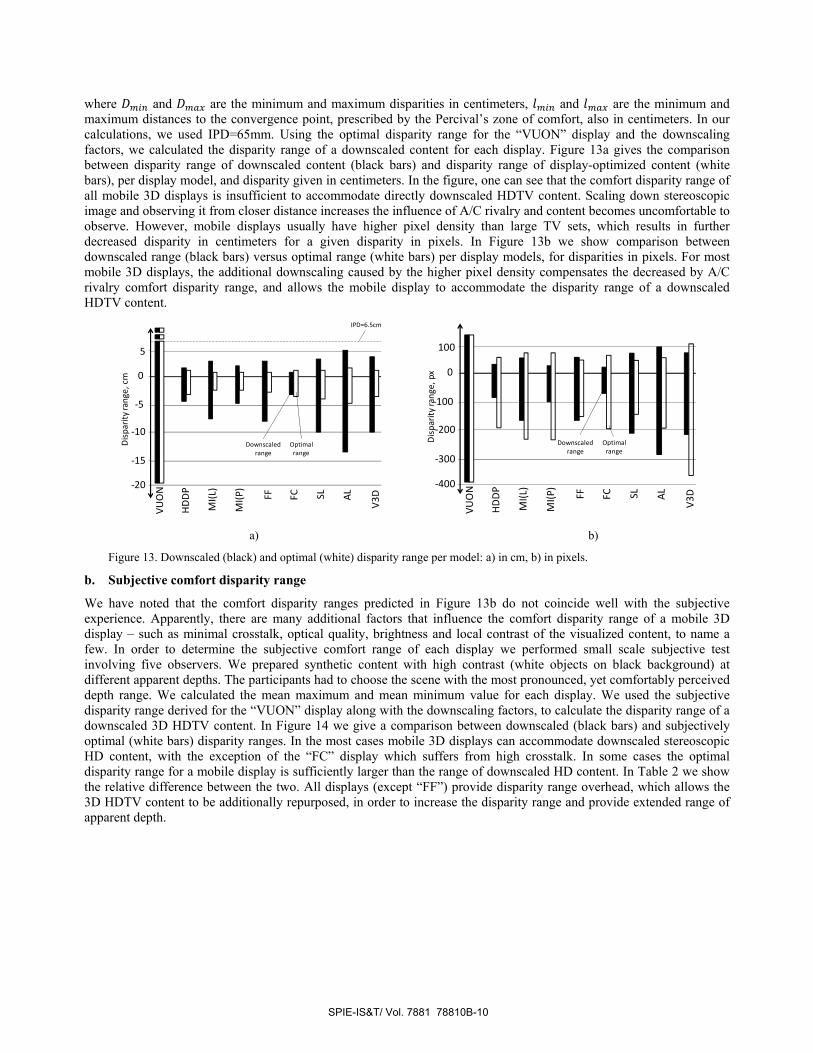
where and are the minimum and maximum disparities in centimeters, and are the minimum and maximum distances to the convergence point, prescribed by the Percival’s zone of comfort, also in centimeters. In our calculations, we used IPD=65mm. Using the optimal disparity range for the “VUON” display and the downscaling factors, we calculated the disparity range of a downscaled content for each display. Figure 13a gives the comparison between disparity range of downscaled content (black bars) and disparity range of display-optimized content (white bars), per display model, and disparity given in centimeters. In the figure, one can see that the comfort disparity range of all mobile 3D displays is insufficient to accommodate directly downscaled HDTV content. Scaling down stereoscopic image and observing it from closer distance increases the influence of A/C rivalry and content becomes uncomfortable to observe. However, mobile displays usually have higher pixel density than large TV sets, which results in further decreased disparity in centimeters for a given disparity in pixels. In Figure 13b we show comparison between downscaled range (black bars) versus optimal range (white bars) per display models, for disparities in pixels. For most mobile 3D displays, the additional downscaling caused by the higher pixel density compensates the decreased by A/C rivalry comfort disparity range, and allows the mobile display to accommodate the disparity range of a downscaled HDTV content.
a) b)
Figure 13. Downscaled (black) and optimal (white) disparity range per model: a) in cm, b) in pixels.
b. Subjective comfort disparity range
We have noted that the comfort disparity ranges predicted in Figure 13b do not coincide well with the subjective experience. Apparently, there are many additional factors that influence the comfort disparity range of a mobile 3D display – such as minimal crosstalk, optical quality, brightness and local contrast of the visualized content, to name a few. In order to determine the subjective comfort range of each display we performed small scale subjective test involving five observers. We prepared synthetic content with high contrast (white objects on black background) at different apparent depths. The participants had to choose the scene with the most pronounced, yet comfortably perceived depth range. We calculated the mean maximum and mean minimum value for each display. We used the subjective disparity range derived for the “VUON” display along with the downscaling factors, to calculate the disparity range of a downscaled 3D HDTV content. In Figure 14 we give a comparison between downscaled (black bars) and subjectively optimal (white bars) disparity ranges. In the most cases mobile 3D displays can accommodate downscaled stereoscopic HD content, with the exception of the “FC” display which suffers from high crosstalk. In some cases the optimal disparity range for a mobile display is sufficiently larger than the range of downscaled HD content. In Table 2 we show the relative difference between the two. All displays (except “FF”) provide disparity range overhead, which allows the 3D HDTV content to be additionally repurposed, in order to increase the disparity range and provide extended range of apparent depth.
Dis
parit
y ra
nge,
cm
5AL
HD
DP
MI(L
)
MI(P
)
FF FC SL
V3D
0
-5
-10
-15
-20
VUO
N
IPD=6.5cm
Downscaledrange
Optimalrange
Dis
parit
y ra
nge,
px
100
AL
HD
DP
MI(L
)
MI(P
)
FF FC SL
V3D
0
-100
-200
-300
-400VU
ON
Downscaledrange
Optimalrange
SPIE-IS&T/ Vol. 7881 78810B-10

Figure 14, Downscaled (black) and optimal (white) disparity subjective comfort disparity range.
Table 2 – Rescaling factors and relative differences between optimized and downscaled content per display model.
Model Rescaling factor (letterbox) Negative disparity range Positive disparity range HDDP 0.23 54% more 98% more MI_L 0.42 64% more 53.6% more MI_P 0.25 64% more 53.6% more
FC 0.17 48% less -52% less FF 0.42 157% more 140% more SL 0.53 20% more 12.5% more AL 0.71 20% more 12.5% more
V3D 0.53 20% more 12.5% more
7. CONCLUSIONS We discussed operation principles of mobile 3D displays. We listed the sources of visual discomfort and the most common artifacts exhibited by these displays. We performed comparative analysis of eight 3D displays, ranging from portable autostereoscopic to large stereoscopic television sets. We compared two groups of parameters – display related parameters, which describe the ability of a 3D display to faithfully reproduce a 3D scene, and content related parameters, which give information if a 3D scene with particular disparity range is suitable for a given stereoscopic display.
We have found that the properties of mobile 3D displays – such as resolution, optimal viewing distance, size of the sweet spot, comfort disparity range – vary a lot between display models, which makes it impossible to extrapolate “typical” properties of a mobile 3D display. According to our measurements, all portable 3D displays (except one) can accommodate the disparity range of downscaled stereoscopic content. In some cases, the optimal disparity range is sufficiently larger, which allows HD content to be additionally repurposed for a portable 3D display, in order to extend the apparent depth range of the content.
Finally, our experiments showed that calculations of the viewing geometry are not sufficient for precise prediction of the comfort disparity zone of a 3D display. In a future work we will study the influence of crosstalk and local contrast on the comfort disparity range of a given stereoscopic display.
ACKNOWLEDGEMENTS
This work was supported by the European Commission within FP7 (Grant 216503 with the acronym MOBILE3DTV).
Dis
parit
y ra
nge,
px
50
AL
HD
DP
MI(L
)
MI(P
)
FF FC SL
V3D
0
VUO
N
Downscaledrange
Optimalrange
40302010
-10
-20-30-40
-50
SPIE-IS&T/ Vol. 7881 78810B-11
REFERENCES
1 “List of 3D films”, Wikipedia, available online at: http://en.wikipedia.org/wiki/List_of_3-D_films 2 “FinePix REAL 3D series”, product brochure, Fujifilm, 2010, Available:
http://fujifilm.co.uk/media/dContent/mediaCentre/Brochures/0_FinePix-Real-3D-catalogue.pdf 3 “Sharp Develops 3D Touchscreen LCD—Switchable Between 2D and 3D Modes—with Industry’s Highest Brightness”, Sharp
press release, available online at: http://sharp-world.com/corporate/news/100402.html 4 ”Nintendo 3DS Brings a Dimensional Shift to the World of Entertainment on March 27”, Nintendo, Press release, available
online at: http://www.nintendo.com/whatsnew/detail/Yc3LhjvhjnDIlUEBTdnVEg-cLSs0NPfJ 5 “LG Optimus Pad and LG Optimus 3D Phone Features Revealed”, PlanetInsane news, available online at:
http://www.planetinsane.com/lg-optimus-pad-and-lg-optimus-3d-phone-features-revealed/268788/ 6 ”HTC 3D phone”, The Tech Journal, available online at: http://thetechjournal.com/electronics/mobile/htc-3d-phone.xhtml 7 Berkel, V. and Clarke, J., “Characterisation and optimisation of 3D-LCD module design”, Proc. SPIE 2653, 179-186 (1997) 8 Konrad, J. and Agniel, P., “Subsampling models and anti-alias filters for 3-D automultiscopic displays,” IEEE Trans. Image
Process. 15, 128-140 (2006). 9 Saveljev, V., Son, J.-Y., Javidi, B., Kim, S.-K. and Kim, D., “Moiré Minimization Condition in Three-Dimensional Image
Displays,” J. Display Technol. 1, 347- 353 (2005). 10 Salmimaa, M. and Jarvenpaa, T., “Optical characterization of autostereoscopic 3-D displays”, J. Soc. Inf. Display 16, 825-833
(2008). 11 Boher, P., Leroux, T., Bignon, T. and Collomb-Patton, V., “A new way to characterize auto-stereoscopic 3D displays using
Fourier optics instrument”, Proc. of SPIE 7237, 72370Z (2009). 12 Hakkinen, J., Takatalo, J., Kilpelainen, M., Salmimaa, M. and Nyman, G., “Determining limits to avoid double vision in an
autostereoscopic display: Disparity and image element width,” J. Soc. Inf. Display 17, 433-441 (2009). 13 Kooi, F. and Toet, A., “Visual comfort of binocular and 3D displays,” Displays 25 (2-3), 99-108 (2004). 14 Pastoor, S., “Human factors of 3D images: Results of recent research at Heinrich-Hertz-Institut Berlin,” Proceedings of IDW’95,
69-72 (1995). 15 Pastoor, S., “3D displays”, in (Schreer, Kauff, Sikora, edts.) 3D Video Communication, Wiley, 2005. 16 Dodgson, N., “Autostereoscopic 3D Displays,” Computer 38(8), 31- 36 (2005). 17 3M Press release, “3M Enhances 3D Display Capabilities for Handheld Displays with 3D Optical Film,” available online at:
http://www.businesswire.com/news/3m/20091005005255/en/3M-Enhances-3D-Display-Capabilities-Handheld-Displays, 2009. 18 IJsselsteijn, W., Seuntiens, P. and Meesters, L., “Human factors of 3D displays”, 3D Video Communication (Schreer, Kauff,
Sikora, Edts.), Wiley 2005. 19 Uehara, S., Hiroya, T.., Kusanagi, H., Shigemura, K. and Asada, H., “1-inch diagonal transflective 2D and 3D LCD with HDDP
arrangement”,Proc. SPIE 6803, 68030O-68030O-8 (2008). 20 Percival, A. S., [The prescribing of spectacles], Bristol, J. Wright, (1920). 21 Hoffman, D., Girshick, A., Akeley, K. and Banks, M., “Vergence–accommodation conflicts hinder visual performance and cause
visual fatigue”, Journal of Vision 8(3), 1–30 (2008). 22 Howard, I. P., & Rogers, B. J., [Seeing in depth], University of Toronto Press, Toronto, (2002). 23 MasterImage , 3D-LCD product brochure, available online at http://masterimage.co.kr/new_eng/data/masterimage.zip?pos=60 24 Sharp, Sharp Laboratories of Europe, http://www.sle.sharp.co.uk/research/optical_imaging/3d_research.php, 2010 25 Scala, V., “Cross-talk measurement for 3D dispalays,” 3DTV-CON 2009, 4 pages (2009) 26 Debevec, P., Malik, J., “Recovering High Dynamic Range Radiance Maps from Photographs,” Proc. ACM SIGGRAPH, (1997)
SPIE-IS&T/ Vol. 7881 78810B-12