comparative analysis of an integration of a wind …irphouse.com/ijee/ijeev6n3_02.pdf ·...
TRANSCRIPT

International Journal of Electrical Engineering. ISSN 0974-2158 Volume 6, Number 3 (2013), pp. 231-248 © International Research Publication House http://www.irphouse.com
Comparative Analysis of an integration of a Wind Energy Conversion System of PMSG and DFIG
Models Connected to Power Grid
Sasi C.1 and Dr. G. Mohan2 1,2Department of Electrical Engineering, Annamalai University,Tamilnadu,India.
E-mail: [email protected], [email protected]
Abstract This paper present the comparative analysis of an integration of a doubly fed induction generator and permanent magnet synchronous generator models fed to power grid. The large number of wind generators are going to be connected with the existing network in the near future. Therefore, it is necessary to analyse various models of wind energy conversion systems (WECS) for the purpose of studying the impacts upon grid. Both models are connected to AC grid through an efficient power electronic interface. Transient simulations are carried out under the condition of sudden short circuit disturbance and effect of increased generator inertia constant, friction factor and base speed is analysed. The power quality is also analysed in terms of total harmonic distortion for both models and steps are taken to improve the power quality by reducing total harmonic distortion. Keywords: Permanent Magnet Synchronous Generator, Doubly Fed Induction generator, Power Electronic Interface, Power Quality, Total Harmonic Distortion.
Nomenclature THD Total Harmonic Distortion DFIG Doubly Fed Induction Generator WECS Wind Energy Conversion System EPEI Efficient Power Electronic Interface PMSG Permanent Magnet Synchronous Generator RSC Rotor Side Converter GSC Grid Side Converter
Sasi C. and Dr. G. Mohan
232
ωB Rotational speed of turbine Pw Power from the wind Ρ Air density R Blade radius Vω Wind speed Cp Power coefficient λ Tip speed ratio β Blade pitch angle J Moment of inertia Pa Accelerate mechanical power u Voltage R Resistance i Current ω Stator electrical frequency s Rotor slip Ls Stator leakage inductance
Lr Rotor leakage inductance M Mutual inductance Lq ,Ld q and d axis inductances
Introduction The development and utilisation of wind energy to satisfy the electrical demand has received considerable attention in recent years, owing to the concerns regarding the energy resources and enhanced public awareness of the potential impact of the conventional energy systems on the environment. Improvements in wind generation technologies will continue to encourage the use of wind energy in both the stand-alone and grid-connected systems [10], [9] & [7]. Owing to the random nature of the wind, the wind generators behave quite differently from the conventional generators. Therefore, it is important for the power system planners and engineers to carefully consider the reliability issues associated with the wind energy sources. A wind energy conversion system (WECS) converts the natural energy available at the system location into electrical energy. Directly interfacing the WECS to the utility gives rise to problems of voltage fluctuations, flickering and generation of sub-harmonics/harmonics [8],[2] &[5] associated with the pulsating torque, characteristic of the vertical axis wind turbine (prime mover) driving the induction generator. Hence, to overcome these difficulties generally, an asynchronous link is used to interconnect the WECS to the utility. The asynchronous link used in this paper
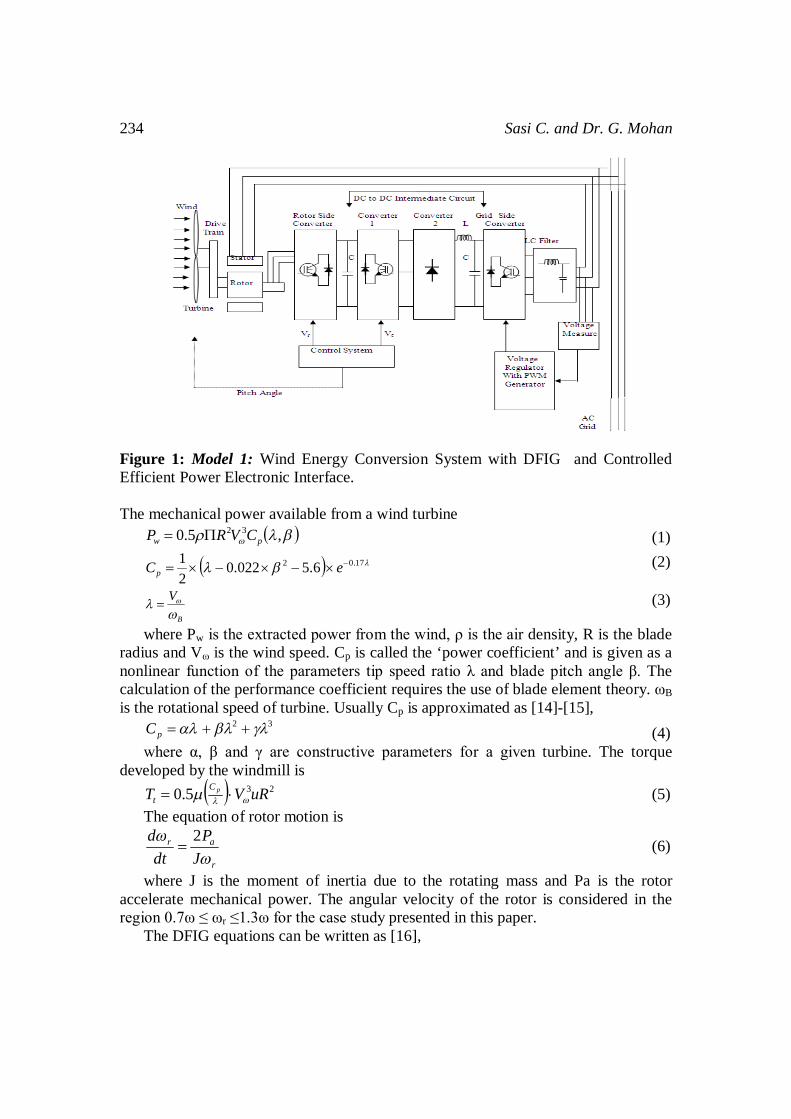
Comparative Analysis of an integration of a Wind Energy Conversion System 233 consists of rotor side converter (RSC), DC to DC intermediate circuit and grid side converter (GSC) as shown in Figure 1.
In terms of the generators for wind-power application, there are different concepts in use today. The major distinction among them is made between fixed speed and variable speed wind turbine generators. In the early stage of wind power development, fixed-speed wind turbines and induction generators were often used in wind farms. But the limitations of such generators, e.g., low efficiency and poor power quality, adversely influence their applications. With large-scale exploration and integration of wind sources, variable speed wind turbine generators, such as doubly fed induction generators (DFIG s) [6] & [1] and permanent magnetic synchronous generators (PMSGs) [3] & [4] are emerging as the preferred technology. In contrast to their fixed-speed counterparts, the variable speed generators allow operating wind turbines at the optimum tip-speed ratio and, hence at the optimum power efficient for a wide wind speed range.
In this paper, two different wind turbine generator systems (WTGS) models connected to AC grid through efficient power electronic interface capable of reducing total harmonic distortion (THD) noticeably during disturbances are proposed. The WECS model has a pitch-angled controlled, wind turbine, a generator model, a power system model with harmonic filters and power electronic interface having controlled converters. Simulations have been conducted with Matlab/ Simulink software to validate the model and the control schemes.
The generator speed is regulated to 1.09 p.u., reactive power to 0 p.u. and pitch angle to 0 degree. The two WTGS models are compared for increased generator inertia constant, increased generator friction factor and increased generator base speed. Further, power quality is analysed in terms of reducing THD using harmonic filters. Different types of symmetrical and asymmetrical faults are analysed under different wind generator power conditions with and without consider different harmonic filters at various bus locations of a power system.
Modeling of Wind Energy Conversion System with DFIG Model 1 Half of the world‘s leading wind turbine manufacturers use the DFIG systems. Figure 1 shows a schematic of the WECS having WTGS Model 1 (DFIG) and efficient power electronic interface that will be discussed in this paper.
Sasi C. and Dr. G. Mohan
234
Figure 1: Model 1: Wind Energy Conversion System with DFIG and Controlled Efficient Power Electronic Interface. The mechanical power available from a wind turbine
,5.0 32pw CVRP (1)
17.02 6.5022.021 eCp (2)
B
V
(3)
where Pw is the extracted power from the wind, ρ is the air density, R is the blade radius and Vω is the wind speed. Cp is called the ‘power coefficient’ and is given as a nonlinear function of the parameters tip speed ratio λ and blade pitch angle β. The calculation of the performance coefficient requires the use of blade element theory. ωB is the rotational speed of turbine. Usually Cp is approximated as [14]-[15],
32 pC (4) where α, β and γ are constructive parameters for a given turbine. The torque
developed by the windmill is 235.0 uRVT pC
t (5) The equation of rotor motion is
r
ar
JP
dtd
2
(6)
where J is the moment of inertia due to the rotating mass and Pa is the rotor accelerate mechanical power. The angular velocity of the rotor is considered in the region 0.7ω ≤ ωr ≤1.3ω for the case study presented in this paper.
The DFIG equations can be written as [16],

Comparative Analysis of an integration of a Wind Energy Conversion System 235
qsdssdsds iRu
dtd (7)
dsqssqsqs iRu
dtd
(8)
qrdrsdrdr siRu
dtd (9)
drqrsqrqr siRu
dtd
(10)
The stator electric values are indicated by the subscript s and the rotor electric values are indicated by the subscript r. u is a voltage, R is a resistance, i is a current, λ is a flux linkage. ω is the stator electrical frequency and s is the rotor slip. The flux linkages are given by
drdssds MiiL (11)
qrqssqs MiiL (12) dsdrsdr MiiL (13)
qsqrsqr MiiL (14) Ls, Lr and M are respectively the stator and the rotor leakage inductance and the
mutual inductance between the stator and the rotor.
Modeling of Wind Energy Conversion System with PMSG Model 2 The WECS considered here consists of WTGS having a PMSG driven by a wind turbine and efficient power electronic interface as shown in Figure 2. The modelling of wind turbine is same as that of Model 1. The dynamic model of PMSG is derived from the two-phase synchronous reference frame in which the q-axis is 90° ahead of the d-axis with respect to the direction of rotation. Figure 2 shows model 2 having PMSG and efficient power electronic interface.
The electrical model of PMSG in the synchronous reference frame is given as:
qrd
q
d
d
d
dd ipwLL
LRi
Lv
dtdi
(15)
q
rdr
q
d
q
q
q
Lpwipw
LL
LRi
Lv
dtdi
(16)
qddqqe iiLipT 5.1 (17) where all quantities in the rotor reference frame are referred to the stator. Lq, Ld - q and d axis inductances R - resistance of the stator windings iq, id - q and d axis currents vq, vd - q and d axis voltages ωr - angular velocity of the rotor λ - flux amplitude induced by the permanent magnets in the stator phases

Sasi C. and Dr. G. Mohan
236
p - number of pole pairs Te - electromagnetic torque.
Fig. 2. Model 2: Wind Energy Conversion System with PMSG and Controlled Efficient Power Electronic Interface
The Lq and Ld inductances represent the relation between the phase inductance and the rotor position due to the saliency of the rotor. The inductance measured between phase a and b (phase c is left open) Lab is given by:
3
2cos edqqdab LLLLL
(18)
Where ?e represents the electrical angle. Mechanical system for the model is:
mrer TFwT
Jdrdw
1 (19)
rwdtd (20)
where J Combined inertia of rotor and load. F Combined viscous friction of rotor and load. ? Rotor angular position. Tm - SHAFT mechanical torque. Table 1 shows the design parameters of DFIG and PMSG. Figure 3 shows
voltage and VAR regulation of rotor side converter. The control system of converter 1
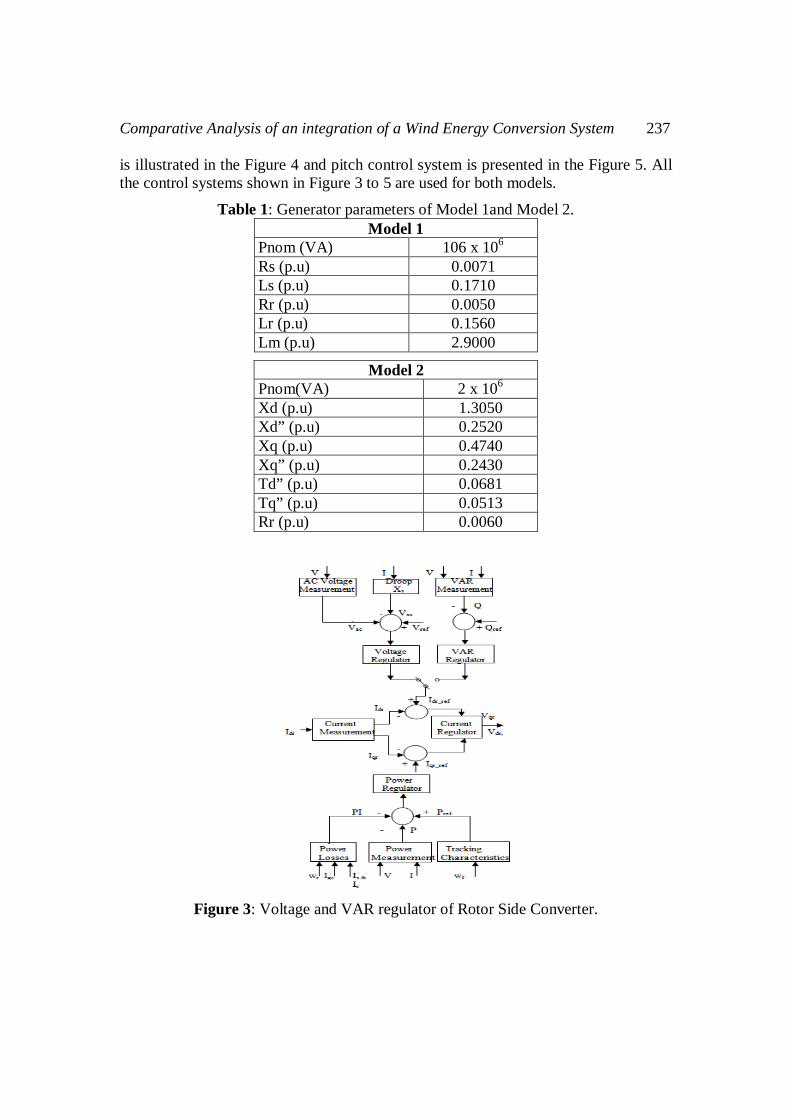
Comparative Analysis of an integration of a Wind Energy Conversion System 237 is illustrated in the Figure 4 and pitch control system is presented in the Figure 5. All the control systems shown in Figure 3 to 5 are used for both models.
Table 1: Generator parameters of Model 1and Model 2. Model 1
Pnom (VA) 106 x 106 Rs (p.u) 0.0071 Ls (p.u) 0.1710 Rr (p.u) 0.0050 Lr (p.u) 0.1560 Lm (p.u) 2.9000
Model 2 Pnom(VA) 2 x 10⁶ Xd (p.u) 1.3050 Xd” (p.u) 0.2520 Xq (p.u) 0.4740 Xq” (p.u) 0.2430 Td” (p.u) 0.0681 Tq” (p.u) 0.0513 Rr (p.u) 0.0060
Figure 3: Voltage and VAR regulator of Rotor Side Converter.
Sasi C. and Dr. G. Mohan
238
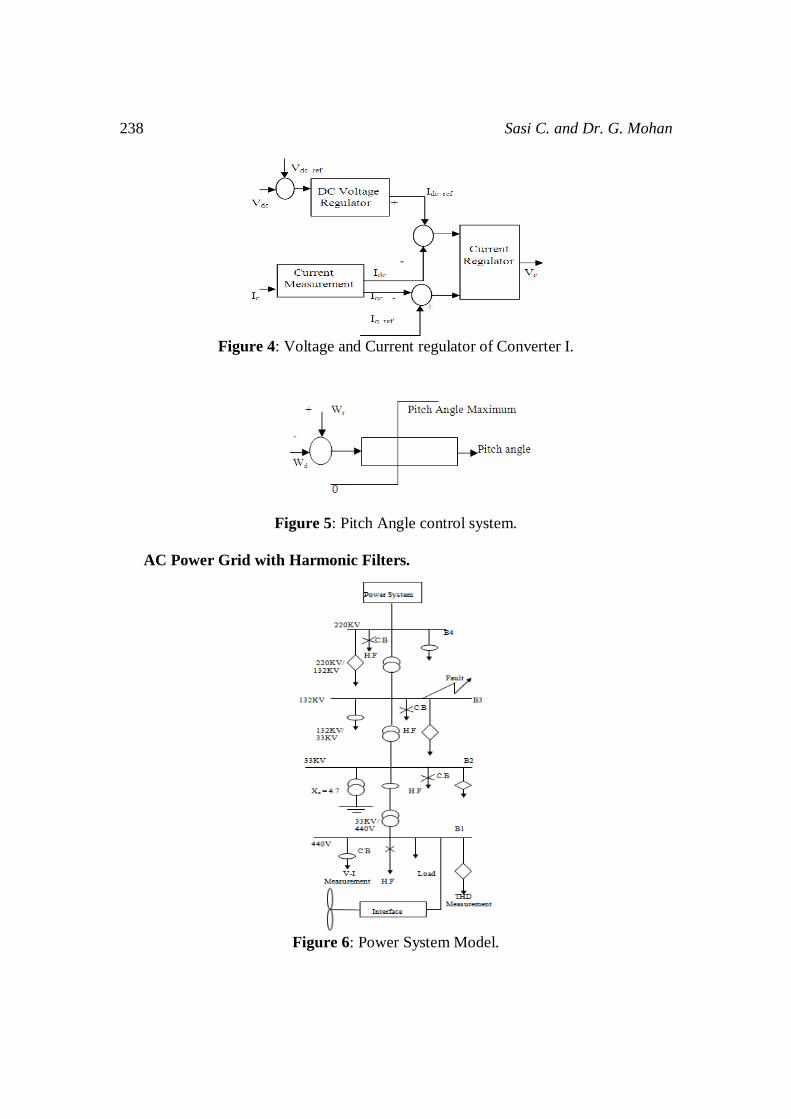
Figure 4: Voltage and Current regulator of Converter I.
Figure 5: Pitch Angle control system. AC Power Grid with Harmonic Filters.
Figure 6: Power System Model.
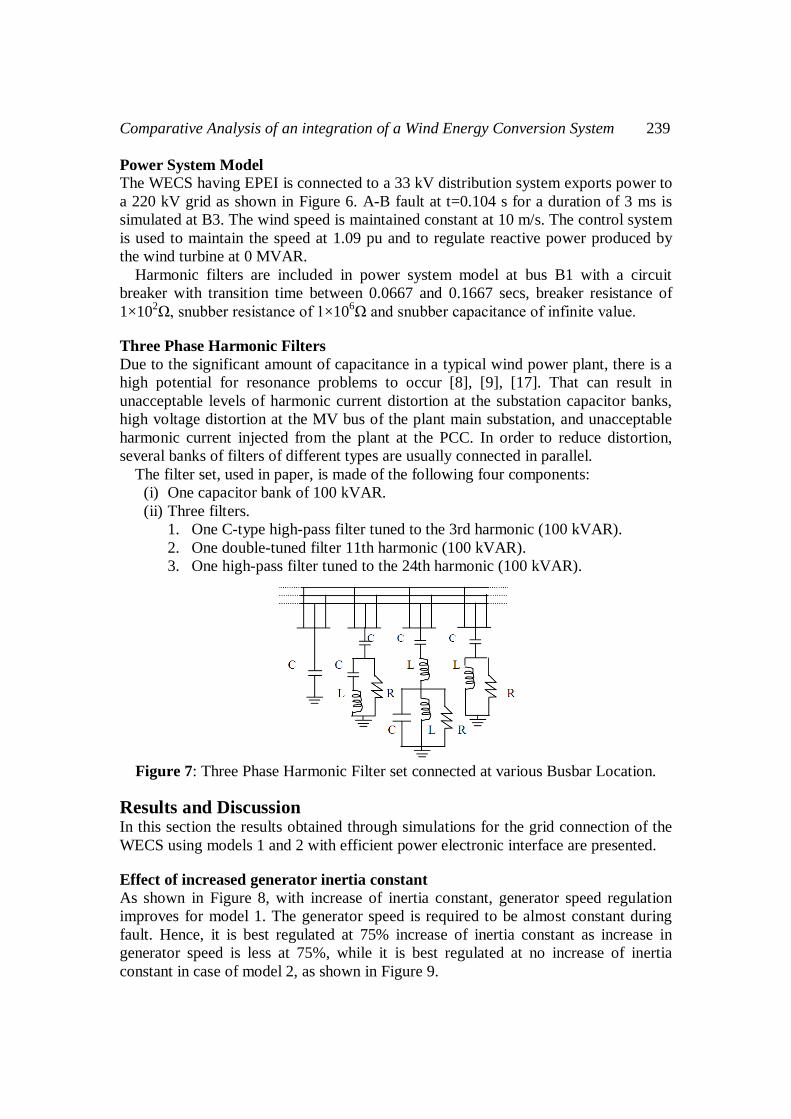
Comparative Analysis of an integration of a Wind Energy Conversion System 239 Power System Model The WECS having EPEI is connected to a 33 kV distribution system exports power to a 220 kV grid as shown in Figure 6. A-B fault at t=0.104 s for a duration of 3 ms is simulated at B3. The wind speed is maintained constant at 10 m/s. The control system is used to maintain the speed at 1.09 pu and to regulate reactive power produced by the wind turbine at 0 MVAR.
Harmonic filters are included in power system model at bus B1 with a circuit breaker with transition time between 0.0667 and 0.1667 secs, breaker resistance of 1×10²Ω, snubber resistance of 1×10⁶Ω and snubber capacitance of infinite value.
Three Phase Harmonic Filters Due to the significant amount of capacitance in a typical wind power plant, there is a high potential for resonance problems to occur [8], [9], [17]. That can result in unacceptable levels of harmonic current distortion at the substation capacitor banks, high voltage distortion at the MV bus of the plant main substation, and unacceptable harmonic current injected from the plant at the PCC. In order to reduce distortion, several banks of filters of different types are usually connected in parallel.
The filter set, used in paper, is made of the following four components: (i) One capacitor bank of 100 kVAR. (ii) Three filters.
1. One C-type high-pass filter tuned to the 3rd harmonic (100 kVAR). 2. One double-tuned filter 11th harmonic (100 kVAR). 3. One high-pass filter tuned to the 24th harmonic (100 kVAR).
Figure 7: Three Phase Harmonic Filter set connected at various Busbar Location.
Results and Discussion In this section the results obtained through simulations for the grid connection of the WECS using models 1 and 2 with efficient power electronic interface are presented.
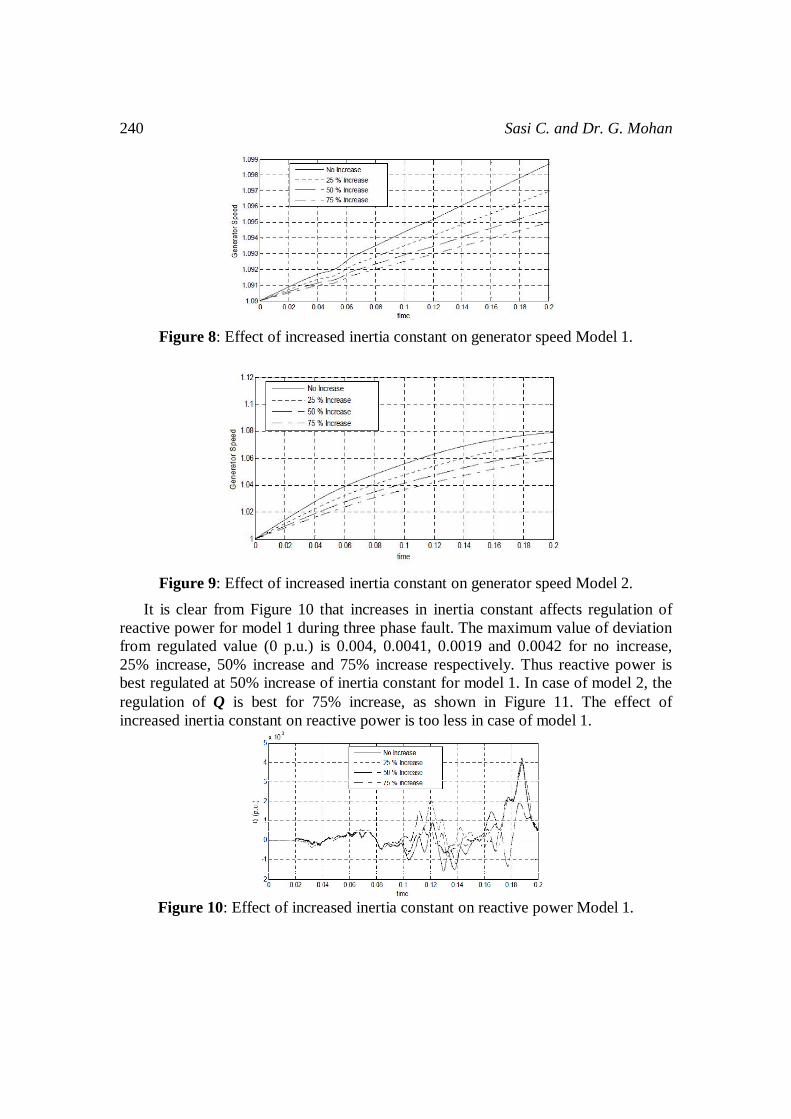
Effect of increased generator inertia constant As shown in Figure 8, with increase of inertia constant, generator speed regulation improves for model 1. The generator speed is required to be almost constant during fault. Hence, it is best regulated at 75% increase of inertia constant as increase in generator speed is less at 75%, while it is best regulated at no increase of inertia constant in case of model 2, as shown in Figure 9.
Sasi C. and Dr. G. Mohan
240
Figure 8: Effect of increased inertia constant on generator speed Model 1.
Figure 9: Effect of increased inertia constant on generator speed Model 2. It is clear from Figure 10 that increases in inertia constant affects regulation of
reactive power for model 1 during three phase fault. The maximum value of deviation from regulated value (0 p.u.) is 0.004, 0.0041, 0.0019 and 0.0042 for no increase, 25% increase, 50% increase and 75% increase respectively. Thus reactive power is best regulated at 50% increase of inertia constant for model 1. In case of model 2, the regulation of Q is best for 75% increase, as shown in Figure 11. The effect of increased inertia constant on reactive power is too less in case of model 1.
Figure 10: Effect of increased inertia constant on reactive power Model 1.

Comparative Analysis of an integration of a Wind Energy Conversion System 241
Figure 11: Effect of increased inertia constant on reactive power Model 2.
Effect of increased generator friction constant It is seen that with increase of friction factor, regulation of generator speed becomes slightly better for model 1. As clear from Figure 12, the speed is best regulated at 75% increase of friction factor in case model 1. The speed regulation is best for no increase in model 2 as it is nearest to 1.09 p.u (as shown in Figure 13).
Figure 12: Effect of increased friction factor on generator speed (Model 1).
Figure 13: Effect of increased friction factor on generator speed Model 2.

Sasi C. and Dr. G. Mohan
242
Figure 14: Effect of increased friction factor on reactive power (Model 1).
Figure 15: Effect of increased friction factor on reactive power Model 2.
Effect of increased generator base speed In model 1, the maximum deviation from regulated speed 1.09 p.u. is same for 50% increase and 75% increase, i.e., 0.0007, but for 50% increase the deviation is on positive side or generator speed increases and for 75% increase the deviation is on negative side or generator speed decreases as shown in Figure 16. Speed is best regulated for no increase of generator base speed in case model 2 as clear from Figure 17. It is shown in Figure 18 that Q is best regulated at 25% increase of base speed in case model 1. In case of model 2, Q is worst regulated for no increase while the curves are overlapping for 25%, 50% and 75% increase of generator base speed as in Figure 19. It is repeatedly seen that the effect of increased inertia constant on reactive power is too less in case of model 1.

Comparative Analysis of an integration of a Wind Energy Conversion System 243
Figure 16: Effect of increased Generator base speed on generator Speed Model 1.
Figure 17: Effect of increased Generator base speed on generator Speed Model 2.
Figure 18: Effect of increased Generator base speed on reactive power Model 1.

Sasi C. and Dr. G. Mohan
244
Figure 19: Effect of increased Generator base speed on reactive power Model 2.
Power quality analysis using harmonic filters The effect of adding harmonic filters is analyzed using models 1 and 2 with three phase fault. The simulation results are shown briefly in Tables 2 and 3 for model 1.
Table 2 represents the effect of adding capacitor filter, then third harmonic filter, then 11/13th harmonic filter and lastly 24th harmonic filter at various locations (B1, B2, B3 and B4) in power system model. Table 3 presents the effect of adding harmonic filter set at different location of power system and effect of changing filter conFigure urations and then again running simulations.
Here, ‘0’ - Represents decrease in THD (in range 0.025–0.05); ‘00’- represents significant decrease in THD (in range 0.05–0.075). ‘000’-represents more significant decrease in THD. (more than 0.1). ‘x’ -represents increase in THD. (less than 0.1). ‘xx’ Represents significant increase in THD. (more than 0.1). ‘s’ - Represents approximately same. Steps 2 to 4 are performed to decrease THD at various bus locations and increase
power quality. Step 2: Remove capacitor filter from B4 bus and run simulation. (S2). Step 3: Remove capacitor filter from bus B3 and run simulation. (S3). Step 4: Remove 24th harmonic filter from bus B4 and run simulation. (S4).

Comparative Analysis of an integration of a Wind Energy Conversion System 245 Table 2: THD measurements at various locations of power system by adding different harmonic filters, model 1.
THD Measurements 1st 3st 11st 24st 1st 3st 11st 24st Location: bus B1, Adding H.F. Location: bus B2, Adding H.F. 0 0 0 0 0 0 x X Location: bus B2, Adding H.F. Location: bus B4, Adding H.F. 0 0 0 0 0 0 x X
Table 3: THD measurements by changing con Figure uration of harmonic filter set, model 1.
Table 4: THD measurements at various locations of power system by adding different harmonic filters, Model 2.

Sasi C. and Dr. G. Mohan
246
Table 5: THD measurements by changing conFigure uration of harmonic filter set, model 2.
Tables 4 and 5 present the simulation results briefly for model 2. Table 4 represents the effect of adding harmonic filters and Table 5 represents the effect of adding harmonic filter set at various bus locations of power system. Also, steps 2 and 3 are performed to reduce THD and hence enhance power quality.
Step 2: Active power from 0 to 100×106; reactive power Q from 50×106 to 150
×106. (S2). Step 3: Active power from 100×106
to 150×106; reactive power Q from 150×106 to
200×106. (S3). In step S3, the decrease in THD at B4 due to adding harmonic filter set at B4 is
more significant than increase in THD at B4 due to adding harmonic filter set at B3.
Conclusion In this paper, grid connected WECS having two different WTGS models are compared during severe network disturbance. Power quality is also analysed and steps are taken to enhance it by reducing THD. A detailed model of the variable speed wind turbine with different generators connected to AC grid having harmonic filters through efficient power electronic interface is presented. At the same time, the paper addresses control schemes of the wind turbine in terms of pitch angle control, AC and DC voltage regulation, VAR regulation and current regulation of converter systems. The effect of increased generator parameters such as inertia constant, friction constant, base speed are examined for the above mentioned two types of WECS. Moreover, different types of symmetrical and asymmetrical faults are analysed at different power levels, with or without harmonic filters. Considering all the
Comparative Analysis of an integration of a Wind Energy Conversion System 247 simulation results, it can be concluded that the regarding efficient control of reactive power to 0 p.u. WECS having model 1 is effective and regarding control of generator speed to 1.09 p.u., WECS having model 2 is effective. The effect of changing generator parameters is less on generator speed and reactive power in case model 2. So, one can choose any model according to need of system. As a whole, it can be concluded that the proposed models can enhance the power quality of system during a transient fault and maintain the output reactive power at 0 p.u., rotor speed to 1.09 p.u., pitch angle to 0 degree and also reduces THD at various locations in power system.
References
[1] Beltran, B., Ahmed-Ali, T. and Benbouzid, M.E.H. (2008), “Sliding mode power control of variable-speed wind energy conversion systems”, IEEE Trans. on Energy Conv., Vol. 23, No. 2, pp.551–558.
[2] Chang, G.W., Chen, C.I. and Teng, Y.F. (2010), “Radial-basis-function-based neural network for harmonic detection”, IEEE Trans. Ind. Electron, Vol. 57, No. 6, pp.2171–2179.
[3] Chen, J., Nayar, C.V. and Xu, L. (2000), “Design and finite-element analysis of an outer-rotor permanent-magnet generator for directly coupled wind turbines”, IEEE Trans. Magn., Vol. 36, No. 5, pp.3802–3809.
[4] Huang, K., Zhang, Y., Huang, S., Lu, J., Gao, J. and Cai, L. (2009), “Some practical consideration of a 2MW direct-drive permanent-magnet wind-power generation system”, International Conference on Energy and Environment Technology, 16–18 October, Guilin, China, Vol. 1, pp.824–828.
[5] Lian, K.L. and Noda, T. (2010), “A time-domain harmonic power-flow algorithm for obtaining nonsinusoidal steady-state solutions”, IEEE Trans. Power Delivery, Vol. 25, No. 99, pp.1–11.
[6] Machmoum, M., Doeuff, R.L. and Sargos, F.M. (1992), “Steady state analysis of a doubly fed asynchronous machine supplied by a current controlled cycloconverter in the rotor”, Proc. Inst. Elect. Eng. B, Vol. 139, No. 2, pp.114–122.
[7] Nishikata, S. and Tatsuta, F. (2010), “A new interconnecting method for wind turbine/generators in a wind far farm and basic performances of the integrated system”, IEEE Trans. Ind. Electron, Vol. 57, No. 2, pp.468–475.
[8] S.A. Papathanassiou and M.P. Papadopoulos, 2006, “Harmonic Analysis in a Power System with Wind Generation”, IEEE Transactions on Power Delivery, Vol. 2, No.4, pp.2006–2016.
[9] Ren, Z., Yin, Z. and Bao, W. (2009), “Control strategy and simulation of permanent magnet synchronous wind power generator”, International Conference on Energy and Environment Technology, 16–18 October, Guilin, China, Vol. 1, pp.568–571.
[10] Slootweg, J.G. and Kling, W.L. (2003), “Aggregated modeling of wind parks in power system dynamics simulation”, IEEE Power Tech. Conference, Vol. 3, pp.1–6.

Sasi C. and Dr. G. Mohan
248
[11] Slootweg, J.G., Polinder, H. and Kling, W.L. (2001), “Dynamic modelling of a wind turbine with doubly fed induction generator”, Power Engineering Society Summer Meeting, Vancouver, BC, Vol. 1, pp.644–649.