company presentation for the first ... - home|ntt data · ntt data and remote sensing technology...
TRANSCRIPT

© 2019 NTT DATA Corporation
Company Presentation for the First Quarter of
Fiscal Year Ending March 31, 2020
This English text is a translation of
the Japanese original. The Japanese
Original is authoritative.
August 2, 2019
NTT DATA Corporation

2© 2019 NTT DATA Corporation
INDEX
1. Results for the First Quarter of Fiscal Year Ending March 31, 2020
(The whole company basis)
2. Results for the First Quarter of Fiscal Year Ending March 31, 2020
(By business segment)
3. Appendices
• Business topics
• Explanatory details of financial results and forecasts
• Mid- to long-term financial trends
Cautionary Statement Regarding Forward-looking Statements
※ Forecast figures in this document are based on current economic and market conditions. As
changes in the global economy and information services market are possible, NTT DATA Group
cannot guarantee their accuracy.
※ Services, products, and other names contained within this handout are trademarks, registered or
otherwise, of NTT DATA Corporation or other companies.

© 2019 NTT DATA Corporation 3
1
Results for the First Quarter of
Fiscal Year Ending March 31,
2020 (The whole company basis)

4© 2019 NTT DATA Corporation 4
Results for the First Quarter of Fiscal Year Ending March 31, 2020
• Steady expansion of the scale of overseas businesses contributed to a stable increase
in new orders received and net sales.
• Operating income increased due mainly to the decrease of PMI cost.
( Billions of Yen, % )
2019/3 1st Quarter
Results (Apr-Jun)
2020/3 1st Quarter
Results (Apr-Jun)
YoY
(Amount)
YoY
(Rate)
New Orders Received 504.1 522.9 +18.8 +3.7%
Net Sales 505.2 527.3 +22.0 +4.4%
Operating Income(Operating income margin)
29.1(5.8%)
29.8(5.7%)
+0.7(-0.1P)
+2.4%
Net Income Attributable to
Shareholders of NTT DATA20.8 21.0 +0.2 +0.8%

© 2019 NTT DATA Corporation 5
2
Results for the First Quarter of
Fiscal Year Ending March 31,
2020 (By business segment)

6© 2019 NTT DATA Corporation 6
New Orders Received: YoY Changes by Business Segment
(1Q FYE3/2019 and 1Q FYE3/2020)
504.1522.9
+5.0 -54.8
+3.2
+43.6(+0.4)
+19.0(-5.1)
2019/3 1st QuarterResults (Apr-Jun)
2020/3 1st QuarterResults (Apr-Jun)
OthersPublic &
Social
InfrastructureFinancial Enterprise &
Solutions
EMEA &
LATAMNorth
America
Ne
w O
rde
rs
Re
ce
ive
d
(Billions of yen)
( ) shows an exchange rate impact included in the figure above.
2019/3 1st Quarter
Results (Apr-Jun)
2020/3 1st Quarter
Results (Apr-Jun)
Public & Social Infrastructure Increased due mainly to winning projects for the telecom and utilities industries.
Financial Decreased due mainly to less orders compared to the previous fiscal year such as for projects for banks.
Enterprise & Solutions Increased due mainly to winning projects for manufacturing industry.
North America Increased due mainly to wining projects for public sector and manufacturing industry.
EMEA & LATAMIncreased due mainly to winning projects in Europe mainly in Spain, despite a decrease due to the negative impact
from yen appreciation in foreign exchange.

7© 2019 NTT DATA Corporation 7
505.2527.3
-6.6 +8.1 +14.4 +1.6(+0.6)
+7.1(-5.1)
2019/3 1st QuarterResults (Apr-Jun)
2020/3 1st QuarterResults (Apr-Jun)
Net Sales: YoY Changes by Business Segment
(1Q FYE3/2019 and 1Q FYE3/2020)
Others
Public &
Social
Infrastructure
Financial Enterprise &
Solutions
EMEA &
LATAMNorth
AmericaNe
t Sa
les
(Billions of yen)
( ) shows an exchange rate impact included in the figure above.
2019/3 1st Quarter
Results (Apr-Jun)
2020/3 1st Quarter
Results (Apr-Jun)
Public & Social Infrastructure Decreased due mainly to less sales compared to the previous fiscal year such as for services for government ministries.
Financial Increased due mainly to the expansion in the scale of services for financial institutions.
Enterprise & Solutions Increased due mainly to the expansion in the scale of services for manufacturing industry and payment including M&A.
North America Increased due to the expansion of scale from M&A.
EMEA & LATAMIncreased due mainly to the expansion of scale in Europe mainly in businesses in Spain, despite a decrease due to the
negative impact of yen appreciation in foreign exchange.

8© 2019 NTT DATA Corporation 8
Operating Income: YoY Changes by Business Segment
(1Q FYE3/2019 and 1Q FYE3/2020)
29.1 29.8-0.1 -0.2 +0.2 +1.1
(-0)-0.2(-0.1)
2019/3 1st QuarterResults (Apr-Jun)
2020/3 1st QuarterResults (Apr-Jun)
OthersPublic &
Social
Infrastructure
Financial Enterprise &
Solutions
EMEA &
LATAMNorth
America
Op
era
ting
Inco
me
(Billions of yen)
( ) shows an exchange rate impact included in the figure above.
2019/3 1st Quarter
Results (Apr-Jun)
2020/3 1st Quarter
Results (Apr-Jun)
Public & Social InfrastructureRemained on par with the previous fiscal year due mainly to the improvement in cost rate, despite a decrease due to
decline in sales.
FinancialRemained on par with the previous fiscal year due mainly to an increase of costs for business expansion, despite an
increase attributable to sales growth.
Enterprise & SolutionsRemained on par with the previous fiscal year due mainly to an increase of costs for business expansion, despite an
increase attributable to sales growth.
North America Increased due mainly to a decrease of PMI cost.
EMEA & LATAMRemained on par with the previous fiscal year due mainly to an increase of costs for business expansion, despite an
increase attributable to sales growth.

9© 2019 NTT DATA Corporation 9
Public & Social Infrastructure (1Q FYE3/2019 and 1Q FYE3/2020)
2019/3 1st Quarter
Results (Apr-Jun)
2020/3 1st Quarter
Results (Apr-Jun)
YoY
(Amount)
YoY
(Rate)
New Orders
Received101.4 106.4 +5.0 +5.0%
Net Sales 106.7 100.1 -6.6 -6.2%
Operating Income(Operating income margin)
8.0(7.5%)
7.9(7.9%)
-0.1(+0.4P)
-1.0%
(Billions of Yen,%)
New orders received Increased due mainly to winning projects for the telecom and utilities industries.
Net salesDecreased due mainly to less sales compared to the previous fiscal year such as for services for government
ministries.
Operating incomeRemained on par with the previous fiscal year due mainly to the improvement in cost rate, despite a decrease due
to decline in sales.

10© 2019 NTT DATA Corporation 10
Financial (1Q FYE3/2019 and 1Q FYE3/2020)
(Billions of Yen,%)
2019/3 1st Quarter
Results (Apr-Jun)
2020/3 1st Quarter
Results (Apr-Jun)
YoY
(Amount)
YoY
(Rate)
New Orders
Received146.3 91.5 -54.8 -37.5%
Net Sales 130.9 139.0 +8.1 +6.2%
Operating Income(Operating income margin)
10.9(8.3%)
10.7(7.7%)
-0.2(-0.6P)
-1.5%
New orders received Decreased due mainly to less orders compared to the previous fiscal year such as for projects for banks.
Net sales Increased due mainly to the expansion in the scale of services for financial institutions.
Operating incomeRemained on par with the previous fiscal year due mainly to an increase of costs for business expansion, despite
an increase attributable to sales growth.

11© 2019 NTT DATA Corporation 11
Enterprise & Solutions (1Q FYE3/2019 and 1Q FYE3/2020)
(Billions of Yen,%)
2019/3 1st Quarter
Results (Apr-Jun)
2020/3 1st Quarter
Results (Apr-Jun)
YoY
(Amount)
YoY
(Rate)
New Orders
Received77.4 80.6 +3.2 +4.2%
Net Sales 120.7 135.1 +14.4 +12.0%
Operating Income(Operating income
margin)
11.3(9.3%)
11.5(8.5%)
+0.2(-0.9P)
+1.7%
New orders received Increased due mainly to winning projects for manufacturing industry.
Net salesIncreased due mainly to the expansion in the scale of services for manufacturing industry and payment including
M&A.
Operating incomeRemained on par with the previous fiscal year due mainly to an increase of costs for business expansion, despite
an increase attributable to sales growth.

12© 2019 NTT DATA Corporation 12
North America (1Q FYE3/2019 and 1Q FYE3/2020)
2019/3 1st Quarter
Results (Apr-Jun)
2020/3 1st Quarter
Results (Apr-Jun)
YoY
(Amount)
YoY
(Rate)
New Orders
Received69.5 113.2 +43.6 +62.7%
Net Sales 101.5 103.0 +1.6 +1.5%
EBITA(EBITA margin)
0.7(0.7%)
2.0(1.9%)
+1.3(+1.3P)
+193.1%
Operating Income(Operating income margin)
-1.9(-1.9%)
-0.8(-0.8%)
+1.1(+1.1P)
+56.2%
(Billions of Yen,%)
(*1)
(*1) EBITA = Operating income + Amortization of intangible assets subject to purchase price allocation (PPA) arising from acquisition and others.
New orders received Increased due mainly to wining projects for public sector and manufacturing industry.
Net sales Increased due to the expansion of scale from M&A.
EBITA Increased due mainly to a decrease of PMI cost.
Operating income Increased due mainly to a decrease of PMI cost.

13© 2019 NTT DATA Corporation 13
EMEA & LATAM (1Q FYE3/2019 and 1Q FYE3/2020)
2019/3 1st Quarter
Results (Apr-Jun)
2020/3 1st Quarter
Results (Apr-Jun)
YoY
(Amount)
YoY
(Rate)
New Orders
Received102.1 121.1 +19.0 +18.6%
Net Sales 103.7 110.8 +7.1 +6.9%
EBITA(EBITA margin)
2.7(2.6%)
1.8(1.6%)
-0.9(-0.9P)
-32.1%
Operating Income(Operating income margin)
0.8(0.8%)
0.6(0.5%)
-0.2(-0.2P)
-26.7%
(Billions of Yen,%)
(*1) EBITA = Operating income + Amortization of intangible assets subject to purchase price allocation (PPA) arising from acquisition and others.
(*1)
New orders receivedIncreased due mainly to winning projects in Europe mainly in Spain, despite a decrease due to the negative impact from yen
appreciation in foreign exchange.
Net salesIncreased due mainly to the expansion of scale in Europe mainly in businesses in Spain, despite a decrease due to the negative
impact of yen appreciation in foreign exchange.
EBITARemained on par with the previous fiscal year due mainly to an increase of costs for business expansion, despite an increase
attributable to sales growth.
Operating incomeRemained on par with the previous fiscal year due mainly to an increase of costs for business expansion, despite an increase
attributable to sales growth.

© 2019 NTT DATA Corporation 14
3
Appendices -Business topics-

15© 2019 NTT DATA Corporation 15
Principal Measures Taken in the 1 st Quarter of Fiscal Year Ending March 31,
2020(1/4)
NTT DATA and Remote Sensing Technology Center of Japan worked on the following further resolution
improvement of “AW3D Full Global 3D Map,” the world’s most accurate map utilizing satellite images, in
response to demands for prompt usage of a wide range digital 3D map in Japan and more accurate
geographical information in geospatial data on a world-wide level. Both companies are working towards the
utilization of global geospatial information and promotion of related industries through this service and aim to
achieve net sales of 5 billion yen by fiscal 2022.
・We have begun selling the 3D map covering the entire globe with 2.5m resolution, “AW3D Standard (2.5m
resolution)”. This service is more accurate than the 5m resolution which was already available, and more
accurate simulation and analysis can be performed for world-wide city planning, natural disaster damage
prediction, etc.
・We launched the digital 3D map with 0.5 m resolution covering the entire land of Japan, “AW3D Enhanced
Japan 3D Map,” in May 2019. This is the first attempt in Japan to develop a digital 3D map of the entire land
area with this accuracy. This service enables users to accurately measure coordinates and heights all over
Japan and grasp detailed terrain undulations, and can be utilized for various simulations such as quantity and
gradient calculation (degree of inclination), disaster prevention, communication, electricity, etc.
Launching “AW3D Full Global 3D Map” of higher
accuracy

16© 2019 NTT DATA Corporation 16
Principal Measures Taken in the 1 st Quarter of Fiscal Year Ending March 31,
2020(2/4)
From April 2019, NTT DATA started to provide a “code payment gateway” which enables to accept a wide
variety of domestic and overseas payment methods using various codes such as linear barcodes and QR
codes. This is provided as the new solution of “CAFIS,” the largest payment platform in Japan that we offer.
The use of this service will enable accepting payment services for domestic users such as Origami Pay, d-Barai,
pring, PayPay, Merpay, LINE Pay, Rakuten Pay (payment using application), and au PAY (scheduled), as well
as overseas code payments including Alipay and WeChatPay that are widely used in China in an integrated
manner. The solution automatically identifies the types of code payments presented by consumers at the code
payment gateway center, allowing retailers to accept payments using a single payment terminal or an interface
without being aware of the types of the code payments. This will reduce the workload of clerks at the retailers
accepting different types of code payments as well as eliminate the risk of settling the payment with the code
payment which was not intended by the consumers who are able to use different types of code payments. We
will contribute to the progress and the realization of cashless society in Japan by promoting acceptance of a
wide variety of code payments and advancing collaboration with various services provided by CAFIS.
Started to provide a “code payment gateway” to
accept a wide variety of domestic and overseas code
payments in an integrated manner
17© 2019 NTT DATA Corporation 17
Principal Measures Taken in the 1 st Quarter of Fiscal Year Ending March 31,
2020(3/4)
NTT DATA Services, a subsidiary of NTT DATA Corporation, won a new five-year, $218 million contract with
the United States Agency for International Development (USAID). NTT DATA Services will provide
infrastructure and application management services across the USAID.
NTT DATA Services built a strong relationship with the client by leveraging a deep understanding of the USAID
environment, years of government expertise, and proven performance with public sector clients. We also
leveraged our corporate capabilities to infuse innovation and automation to help improve overall efficiencies of
USAID’s operations.
NTT DATA Services will provide an excellent foundation to drive USAID’s day-to-day operations and
maintenance and enhance performance, leveraging our deep government experience, as well as support their
mission for the betterment of people throughout the world as their IT partner.
Awarded a new large-scale IT Service contract
with the United States Agency for International Development
leveraging government experience and exceptional expertise

18© 2019 NTT DATA Corporation 18
Principal Measures Taken in the 1 st Quarter of Fiscal Year Ending March 31,
2020(4/4)
NTT DATA is working to enhance our CoE (Note 1) globally based on our global digital strategy of the new mid-
term management plan and has established AI CoE as part of the effort in May 2019. AI CoE is a base for
supporting global expansion of digital businesses with functions such as AI knowledge integration, AI trainings,
AI technology support, AI asset (intellectual asset) offering, etc. By launching this AI CoE, we now have CoEs in
four fields: Blockchain, Digital Design, DevOps, and AI. Through the activities of each CoE, we aim to have
around 5,000 experts in the four fields by the end of fiscal 2021. We will also aim to enhance new CoEs and
enrich our support system for digital businesses including other fields.
NTT DATA has also developed “NTT DATA’s AI guidelines” outlining our stance toward contributing to the
realization of “a more affluent and harmonious society” (hereafter called “AI society”) in which people and AI
coexist. Based on these guidelines, we will promote R&D, operation, and utilization of AI, not to merely improve
efficiency, but to help establish an AI society where all individuals, businesses, and society as a whole,
including our clients, are able to enjoy the benefits of AI, in line with SDGs principle of “No one will be left
behind.”
Established AI CoE as a global base for
integrating AI technologies, and
developed NTT DATA’s AI guidelines
(Note 1) CoE (Center of Excellence)
A base which conducts advanced R&D activities and plays a central role in creating/developing human resources and businesses.
© 2019 NTT DATA Corporation 19
3
Appendices -Explanatory details of
financial results and forecasts-

20© 2019 NTT DATA Corporation 20
Overview of Consolidated Result(Billions of Yen,%)
2019/3 1st Quarter
Results
(Apr-Jun)
2020/3 1st Quarter
Results
(Apr-Jun)
YoY
(%)
FY Ended 2019/3
Results
(Full-Year)
FY Ending 2020/3
Forecasts
(Full-Year)
New Orders Received 504.1 522.9 +3.7 2,076.1 2,000.0
Order Backlog 2,434.3 2,466.1 +1.3 2,457.1 2,380.0
Net Sales 505.2 527.3 +4.4 2,163.6 2,240.0
(Main item) Overseas Net Sales(*1) 210.6 221.4 +5.2 881.1 910.0
Cost of Sales 378.4 395.1 +4.4 1,618.6 1,658.0
Gross Profit 126.8 132.2 +4.2 545.0 582.0
SG&A Expenses 97.7 102.3 +4.8 397.3 434.0
Selling Expenses 35.9 36.4 +1.6 146.7 160.0
R&D Expenses 3.1 4.0 +30.9 15.1 22.0
Other Administrative Expenses 58.7 61.9 +5.3 235.5 252.0
Operating Income 29.1 29.8 +2.4 147.7 148.0
Operating Income Margin(%) 5.8 5.7 -0.1P 6.8 6.6
Financial Income and Costs/Share of
Profit/Loss of Entities for Using Method1.1 1.0 +3.1 -0.8 -3.0
Income Before Income Taxes 30.2 30.8 +2.0 146.9 145.0
Income Taxes and Others(*2) 9.4 9.8 +4.6 53.3 53.0
Net Income Attributable to
Shareholders of NTT DATA20.8 21.0 +0.8 93.6 92.0
Capital Expenditures 38.2 42.1 +10.1 179.2 202.0
Depreciation and Amortization/Loss on
Disposal of Property and Equipment and
Intangibles(*3)38.4 40.1 +4.4 160.7 162.0
(*1) The total of external net sales of North America and EMEA & LATAM Segments and China & APAC regions.
(*2) “Income Taxes and Others” includes “corporate income taxes” and “net income attributable to non-controlling interests.”
(*3) “2020/3 1st Quarter Results” and “FY Ending 2020/3 Forecasts (Full-Year)” were calculated excluding the effect (1st quarter estimate of 8.6 billion yen and full-year estimate of 34.5 billion yen)
of IFRS 16 (New Lease Standard) which has been applied since April 2019.

21© 2019 NTT DATA Corporation 21
Consolidated New Orders Received and Order Backlog
2019/3 1st Quarter
Results
(Apr-Jun)
2020/3 1st Quarter
Results
(Apr-Jun)
FY Ended 2019/3
Results
(Full-Year)
FY Ending 2020/3
Forecasts
(Full-Year)
Public & Social Infrastructure 101.4 106.4 391.1 402.0 (Main
item) Central Government and Related Agencies,
Local Government, and Healthcare56.3 54.7 194.5 226.0
Telecom and Utility 22.9 26.4 114.0 93.0
Financial 146.3 91.5 458.2 389.0 (Main
item) Banks, Insurance, Security, Credit Corporations
and Financial Infrastructure118.0 67.5 348.5 269.0
Cooperative financial institutions and Financial
Network Services16.9 17.5 83.3 102.0
Enterprise & Solutions(*1, 2) 77.4 80.6 307.7 297.0(Main
item) Retail, Logistics, Payment and Other Service 18.9 18.6 73.0 73.0
Manufacturing 47.1 51.0 188.8 184.0
Data Center, Network, and Other Solutions 9.6 9.2 38.0 33.0
North America 69.5 113.2 427.6 414.0
EMEA & LATAM 102.1 121.1 457.4 466.0
Order Backlog 2,434.3 2,466.1 2,457.1 2,380.0
Public & Social Infrastructure 431.4 440.8 416.8 416.0
Financial 853.3 811.3 828.8 757.0
Enterprise & Solutions 141.6 138.8 131.0 112.0
North America 730.9 771.4 784.7 767.0
EMEA & LATAM 266.1 287.8 282.4 303.0
(Billions of Yen)
Detail of Consolidated Order Backlog
Detail of Consolidated New Orders Received (to Clients Outside the NTT DATA Group)
(*1) New Orders Received of Enterprise & Solutions does not include orders taken via other segments.
(*2) The figures for Enterprise & Solutions for 1Q FYE 3/2019 show results based on revision of the details recorded as of March 31, 2019.
(Billions of Yen)
22© 2019 NTT DATA Corporation 22
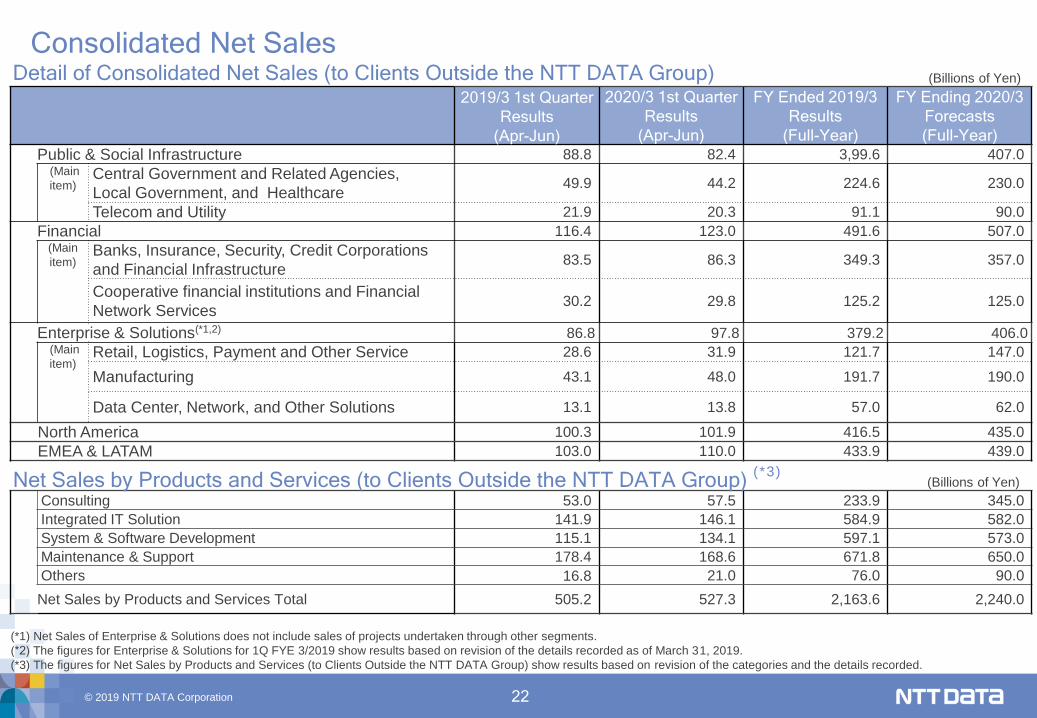
Consolidated Net Sales
2019/3 1st Quarter
Results
(Apr-Jun)
2020/3 1st Quarter
Results
(Apr-Jun)
FY Ended 2019/3
Results
(Full-Year)
FY Ending 2020/3
Forecasts
(Full-Year)
Public & Social Infrastructure 88.8 82.4 3,99.6 407.0(Main
item)Central Government and Related Agencies,
Local Government, and Healthcare49.9 44.2 224.6 230.0
Telecom and Utility 21.9 20.3 91.1 90.0
Financial 116.4 123.0 491.6 507.0(Main
item)Banks, Insurance, Security, Credit Corporations
and Financial Infrastructure83.5 86.3 349.3 357.0
Cooperative financial institutions and Financial
Network Services30.2 29.8 125.2 125.0
Enterprise & Solutions(*1,2) 86.8 97.8 379.2 406.0(Main
item)Retail, Logistics, Payment and Other Service 28.6 31.9 121.7 147.0
Manufacturing 43.1 48.0 191.7 190.0
Data Center, Network, and Other Solutions 13.1 13.8 57.0 62.0
North America 100.3 101.9 416.5 435.0
EMEA & LATAM 103.0 110.0 433.9 439.0
Consulting 53.0 57.5 233.9 345.0
Integrated IT Solution 141.9 146.1 584.9 582.0
System & Software Development 115.1 134.1 597.1 573.0
Maintenance & Support 178.4 168.6 671.8 650.0
Others 16.8 21.0 76.0 90.0
Net Sales by Products and Services Total 505.2 527.3 2,163.6 2,240.0
(Billions of Yen)Detail of Consolidated Net Sales (to Clients Outside the NTT DATA Group)
Net Sales by Products and Services (to Clients Outside the NTT DATA Group)(*3)
(*1) Net Sales of Enterprise & Solutions does not include sales of projects undertaken through other segments.
(*2) The figures for Enterprise & Solutions for 1Q FYE 3/2019 show results based on revision of the details recorded as of March 31, 2019.
(*3) The figures for Net Sales by Products and Services (to Clients Outside the NTT DATA Group) show results based on revision of the categories and the details recorded.
(Billions of Yen)

23© 2019 NTT DATA Corporation 23
Trends in Quarter (Consolidated)
Net Sales
Operating
Income
New Orders
Received
(Billions of Yen,%)

24© 2019 NTT DATA Corporation 24
Foreign exchange rates (used for the conversion of the amount of orders received and incomes and expenditures)
(Yen,%)
2019/3 1st Quarter
Results
(Apr-Jun)
2020/3 1st Quarter
Results
(Apr-Jun)
YoY
(%)
FY Ended
2019/3
Results
(Full-Year)
FY Ending
2020/3
Forecasts
(Full-Year)
YoY
(%)
① ② (②-①)/ ① ③ ④ (④-③) / ③
USD 109.09 109.76 +0.6% 110.88 109.00 -1.7%
EUR 130.02 123.48 -5.0% 128.37 124.00 -3.4%

© 2019 NTT DATA Corporation 25
Appendices - Mid- to long-term financial trends -
3

26© 2019 NTT DATA Corporation 26
Trend of Order Backlog and Net Sales
1,142.91,161.9
1,251.11,301.9
1,343.7
1,511.8
1,614.8
1,732.4
2,117.12,039.7
2,163.62,240.0
1,166.11,156.5
1,131.9 1,140.2
1,341.4 1,355.8
1,544.5
2,411.3 2,371.5 2,369.22,457.1
2,380.0
0.0
500.0
1,000.0
1,500.0
2,000.0
2,500.0
3,000.0
2010/3 2011/3 2012/3 2013/3 2014/3 2015/3 2016/3 2017/3 2018/3 2018/3 2019/3 2020/3
Forecasts
Net Sales Year-end order backlog
(Billions of yen)
JGAAP IFRS

27© 2019 NTT DATA Corporation 27
Overseas Net Sales and Profitability of Trends
(Billions of yen)
4.7%
3.2%
5.2% 5.3% 4.8%4.8%
2.3%3.2% 3.0%
0.0%
5.0%
10.0%
15.0%
0.0
500.0
1,000.0
1,500.0
Overseas Net Sales
EBITA margin
JGAAP IFRS
(Billions of yen) 2013/3 2014/3 2015/3 2016/3 2017/3 2018/3 2018/3 2019/32020/3Forecasts
Overseasnet sales
231.3 298.7 449.0 504.4 586.3 911.1 831.3 881.1 910.0
EBITA 10.8 9.6 23.5 26.6 28.2 43.4 19.4 28.3 27.0
(*1) The figures for the periods until FYE 3/2017 are those for the former Global Segment, and from FYE 3/2018 and later, are the total of North America/EMEA & LATAM Segments
and China and APAC.
(*2) Net sales to Clients Outside the NTT DATA Group.
(*3) EBITA (JGAAP) = operating income (JGAAP) + amortization of goodwill and intangible assets subject to purchase price allocation (PPA) arising from acquisition and others
(*3) EBITA (IFRS) = operating income (IFRS) + amortization of intangible assets subject to purchase price allocation (PPA) arising from acquisition and others
(*1)
(*2)
(*2)
(*3)

28© 2019 NTT DATA Corporation 28
EBITDA Trend
(Billions of yen)
JGAAP IFRS
(Billions of yen) 2010/3 2011/3 2012/3 2013/3 2014/3 2015/3 2016/3 2017/3 2018/3 2018/3 2019/32020/3
Forecasts
Operation Income 81.6 78.3 80.4 85.6 62.5 84.0 100.8 117.1 123.5 123.1 147.7 148.0
Depreciation(*1) 154.5 152.2 148.3 140.0 138.0 146.8 147.9 154.5 160.0 158.1 158.0 159.0Loss on Retirement
of Fixed Asset 7.4 6.3 11.3 13.8 5.6 11.6 7.2 5.4 3.2 3.1 2.7 3.0Goodwill
Amortization etc. 7.5 5.7 8.3 10.7 14.0 14.7 16.0 20.0 26.9 - - -
EBITDA(*2) 251.1 242.6 248.5 250.3 220.2 257.3 272.1 297.1 313.7 284.2 308.4 310.0
-7.1%
-3.4%
2.4%0.7%
-12.0%
16.8%
5.8%
9.2%
5.6%8.5%
0.5%
-20.0%
-10.0%
0.0%
10.0%
20.0%
30.0%
40.0%
50.0%
60.0%
70.0%
-100.0
-50.0
0.0
50.0
100.0
150.0
200.0
250.0
300.0
350.0
Goodwill Amortization etc.
Loss on Retirement of Fixed Asset
Depreciation
Operation Income
EBITDA growth rate
(*1) The figures for the forecasts for FYE 3/2020 were calculated excluding the impact amount of 34.5 billion yen (estimate) of IFRS No. 16 (new lease standard) which will be
applied from April 2019.
(*2) Figures based on JGAAP include adjustments for goodwill amortization and others (including impairment loss).
(*1)

29© 2019 NTT DATA Corporation 29
EPS Trend(Yen)
(*1) “Net Income Attributable to Owners of Parent” based on JGAAP.
(*2) Figures based on JGAAP include adjustments for goodwill amortization and others (including impairment loss).(*3) Conducted stock split which shall split of common stock at a ratio of 1:5 as the effective date of July 1, 2017. EPS is referring the amount after stock split.
0.00
10.00
20.00
30.00
40.00
50.00
60.00
70.00
80.00
JGAAP IFRS
(Billions of yen) 2010/3 2011/3 2012/3 2013/3 2014/3 2015/3 2016/3 2017/3 2018/3 2018/3 2019/32020/3
Forecasts
Net Income Attributable to
Shareholders of NTT DATA 43.1 43.0 38.8 54.3 37.2 46.9 79.4 85.7 85.1 82.4 93.6 92.0
EPS (yen) 30.78 30.73 27.69 38.73 26.59 33.45 56.64 61.15 60.68 58.75 66.75 65.60
(*1,2)
(*3)

30© 2019 NTT DATA Corporation 30
ROE Trend
7.4% 7.1%
6.2%
8.2%
5.3%6.0%
9.6%9.9%
9.1%
10.3%10.7%
0.0%
5.0%
10.0%
15.0%
JGAAP IFRS
(Billions of yen) 2010/3 2011/3 2012/3 2013/3 2014/3 2015/3 2016/3 2017/3 2018/3 2018/3 2019/3
Net Income Attributable to
Shareholders of NTT DATA 43.1 43.0 38.8 54.3 37.2 46.9 79.4 85.7 85.1 82.4 93.6
Equity EOY 597.1 620.0 632.5 688.9 728.4 839.8 823.3 904.6 963.3 826.2 925.7
(*1) ROE = Net Income attributable to shareholders of NTT DATA / average equity during the period.(*2) “Net Income Attributable to Owners of Parent” based on JGAAP.
(*3) Figures based on JGAAP include adjustments for goodwill amortization and others (including impairment loss).
(*2,3)
(*3)
(*1)

31© 2019 NTT DATA Corporation 31
ROIC Trend
(Billions of yen)
JGAAP IFRS
(Billions of yen) 2010/3 2011/3 2012/3 2013/3 2014/3 2015/3 2016/3 2017/3 2018/3 2018/3 2019/3
Operating Income 81.6 78.3 80.4 85.6 62.5 84.0 100.8 117.1 123.5 123.1 147.7
Effective Tax Rate 40.69% 40.69% 40.69% 38.01% 38.01% 35.64% 33.06% 30.86% 30.86% 30.86% 30.62%
Net Asset 615.1 630.3 639.7 684.2 709.8 806.2 773.6 833.7 868.8 860.5 966.8
Interest-bearing
Liabilities 289.1 414.4 380.2 378.3 412.9 446.9 407.0 650.8 592.0 586.3 605.0
5.3%4.8% 4.6%
5.1%3.6%
4.6% 5.5%
6.1%5.8% 5.9%
6.8%
0.0%
2.0%
4.0%
6.0%
8.0%
10.0%
0.0
250.0
500.0
750.0
1,000.0
1,250.0
1,500.0
Interest-bearing Liabilities
Net Asset
ROIC
(*1) The figures based on JGAAP are the total of borrowings, bonds, and lease payables. The figures based on IFRS are the total of borrowings and bonds.(*2) ROIC = (operating income × (1- effective tax rate)) / (average net assets during the period + average interest-bearing liabilities during the period)
(*2)
(*1)
(*1)

32© 2019 NTT DATA Corporation 32
D/E Ratio Trend
JGAAP IFRS
2010/3 2011/3 2012/3 2013/3 2014/3 2015/3 2016/3 2017/3 2018/3 2018/3 2019/3
Net Asset 615.1 630.3 639.7 684.2 709.8 806.2 773.6 833.7 868.8 860.5 966.8
(Main Item)Net AssetNon-controlling interests 30.6 28.7 34.0 32.8 32.9 32.7 32.7 31.5 35.0 34.3 41.1
Interest-bearing
Liabilities289.1 414.4 380.2 378.3 412.9 446.9 407.0 650.8 592.0 586.3 605.0
0.49
0.690.63
0.58
0.61
0.58 0.55
0.81
0.71 0.710.65
0.00
0.25
0.50
0.75
1.00
1.25
1.50
D/E Ratio
(*1) D/E ratio = interest-bearing liabilities / (net asset – non-controlling interests)(*2) The figures based on JGAAP are the total of borrowings, bonds, and lease payables. The figures based on IFRS are the total of borrowings and bonds.
(*1)
(Billions of yen)
(Billions of yen)
(*2)
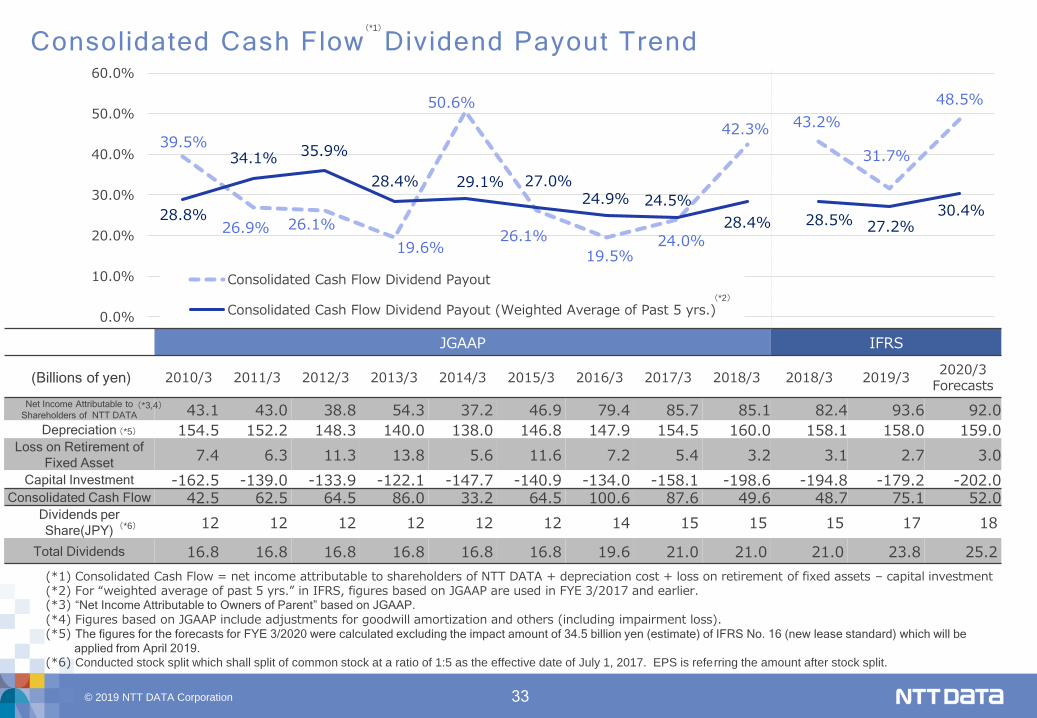
33© 2019 NTT DATA Corporation 33
Consolidated Cash Flow Dividend Payout Trend
39.5%
26.9% 26.1%
19.6%
50.6%
26.1%
19.5%24.0%
42.3% 43.2%
31.7%
48.5%
28.8%
34.1% 35.9%
28.4% 29.1% 27.0%24.9% 24.5%
28.4% 28.5% 27.2%30.4%
0.0%
10.0%
20.0%
30.0%
40.0%
50.0%
60.0%
Consolidated Cash Flow Dividend Payout
Consolidated Cash Flow Dividend Payout (Weighted Average of Past 5 yrs.)
JGAAP IFRS
(Billions of yen) 2010/3 2011/3 2012/3 2013/3 2014/3 2015/3 2016/3 2017/3 2018/3 2018/3 2019/32020/3
Forecasts
Net Income Attributable to
Shareholders of NTT DATA 43.1 43.0 38.8 54.3 37.2 46.9 79.4 85.7 85.1 82.4 93.6 92.0
Depreciation 154.5 152.2 148.3 140.0 138.0 146.8 147.9 154.5 160.0 158.1 158.0 159.0Loss on Retirement of
Fixed Asset7.4 6.3 11.3 13.8 5.6 11.6 7.2 5.4 3.2 3.1 2.7 3.0
Capital Investment -162.5 -139.0 -133.9 -122.1 -147.7 -140.9 -134.0 -158.1 -198.6 -194.8 -179.2 -202.0Consolidated Cash Flow 42.5 62.5 64.5 86.0 33.2 64.5 100.6 87.6 49.6 48.7 75.1 52.0
Dividends per
Share(JPY)12 12 12 12 12 12 14 15 15 15 17 18
Total Dividends 16.8 16.8 16.8 16.8 16.8 16.8 19.6 21.0 21.0 21.0 23.8 25.2
(*1) Consolidated Cash Flow = net income attributable to shareholders of NTT DATA + depreciation cost + loss on retirement of fixed assets – capital investment(*2) For “weighted average of past 5 yrs.” in IFRS, figures based on JGAAP are used in FYE 3/2017 and earlier. (*3) “Net Income Attributable to Owners of Parent” based on JGAAP.
(*4) Figures based on JGAAP include adjustments for goodwill amortization and others (including impairment loss). (*5) The figures for the forecasts for FYE 3/2020 were calculated excluding the impact amount of 34.5 billion yen (estimate) of IFRS No. 16 (new lease standard) which will be
applied from April 2019.
(*6) Conducted stock split which shall split of common stock at a ratio of 1:5 as the effective date of July 1, 2017. EPS is referring the amount after stock split.
(*3,4)
(*2)
(*5)
(*6)
(*1)

© 2019 NTT DATA Corporation