company overview - mediobanca · company overview . 4 ferrari at a glance: unique, exclusive,...
TRANSCRIPT

Company Overview

2 2
This document, and in particular the section entitled “2016 Outlook”, contains forward-looking statements. These statements may include terms
such as “may”, “will”, “expect”, “could”, “should”, “intend”, “estimate”, “anticipate”, “believe”, “remain”, “on track”, “design”, “target”, “objective”, “goal”,
“forecast”, “projection”, “outlook”, “prospects”, “plan”, or similar terms. Forward-looking statements are not guarantees of future performance.
Rather, they are based on the Group’s current expectations and projections about future events and, by their nature, are subject to inherent risks
and uncertainties. They relate to events and depend on circumstances that may or may not occur or exist in the future and, as such, undue reliance
should not be placed on them.
Actual results may differ materially from those expressed in such statements as a result of a variety of factors, including: the Group’s ability to
preserve and enhance the value of the Ferrari brand; the success of Ferrari’s Formula 1 racing team and the expenses the Group incurs for Formula
1 activities; the Group’s ability to keep up with advances in high performance car technology and to make appealing designs for its new models; the
Group’s low volume strategy; the ability of Maserati, the Group’s engine customer, to sell its planned volume of cars; changes in client preferences
and automotive trends; changes in the general economic environment and changes in demand for luxury goods, including high performance luxury
cars, which is highly volatile; the impact of increasingly stringent fuel economy, emission and safety standards; the Group’s ability to successfully
carry out its growth strategy and, particularly, the Group’s ability to grow its presence in emerging market countries; competition in the luxury
performance automobile industry; reliance upon a number of key members of executive management and employees; the performance of the
Group’s dealer network on which the Group depend for sales and services; increases in costs, disruptions of supply or shortages of components and
raw materials; disruptions at the Group’s manufacturing facilities in Maranello and Modena; the Group’s ability to provide or arrange for adequate
access to financing for its dealers and clients; the performance of the Group’s licensees for Ferrari-branded products; the Group’s ability to protect
its intellectual property rights and to avoid infringing on the intellectual property rights of others; product recalls, liability claims and product
warranties; exchange rate fluctuations, interest rate changes, credit risk and other market risks; potential conflicts of interest due to director and
officer overlaps with the Group’s largest shareholders and other factors discussed elsewhere in this document.
Any forward-looking statements contained in this document speak only as of the date of this document and the Company does not undertake any
obligation to update or revise publicly forward-looking statements. Further information concerning the Group and its businesses, including factors
that could materially affect the Company’s financial results, is included in the Company’s reports and filings with the U.S. Securities and Exchange
Commission, the AFM and CONSOB
SAFE HARBOUR STATEMENT
2 2

Company Overview

4 4
FERRARI AT A GLANCE: UNIQUE, EXCLUSIVE, SUCCESSFUL, RESILIENT
• The world’s most recognizable luxury performance sports cars
• One of the world's most valuable and powerful brands(1), underpinned by a rich history
• The epitome of exclusivity, sporting performance, technological innovation, Italian style, design and engineering excellence
• The longest running and most successful team in Formula 1 history, with 15 Drivers and 16 Constructors World titles
• Serving a loyal and growing customer base, with 7,664 vehicles shipped in 2015
• Strong free cash flow generation coupled with both a conservative financial policy and solid balance sheet
• Dual listed company: NYSE (RACE US) and MTA (RACE IM).
1 Source: www.brandfinance.com. According to "Brand Finance Global 500", last release in 2016

5 5
FERRARI'S HISTORICAL MILESTONES
First racing car
produced by
Ferrari
Debut of Ferrari
166 Inter –
Ferrari's first
road car
Scuderia Ferrari
begins competing
in Formula 1 in
1950
Jose Froilan
Gonzalez wins the
first race in 1951
GT cars become
relevant part of
Ferrari business
Enzo Ferrari sells to
Fiat Group a 50%
stake in Ferrari
Debut of V8
engine
production
7 Constructors and 6
Drivers’ world titles over
the decade
Launch of F40, the first
supercar by Ferrari
Fiat Group increases its
stake in Ferrari to 90%
Ferrari begins its
branding activities by
launching Ferrari
branded products in
Ferrari stores
Launch of
Enzo Ferrari
supercar
Ferrari World
theme park opens
in Abu Dhabi
Launch of LaFerrari
Ferrari named as
the world’s most
powerful brand by
Brand Finance
NYSE listing
1948 1947
1950/
51
1960s
1969
1970s
1980s
1987
1988
2000s
2002
2010
2013
2015
2002
2016
Spin-off and Milan
listing

6 6
EMEA Americas
Greater China Rest of APAC
39 Markets 11 Markets
3 Markets 9 Markets
94
POS
31
POS
53
POS
20
POS
Dealer performance is regularly monitored and constantly enhanced through ongoing training programs and upgraded when necessary
14% of 2015
Shipments
34% of 2015
Shipments
44% of 2015
Shipments
8% of 2015
Shipments
SALES GLOBAL FOOTPRINT Dealer network of 198 Points of Sale (POS) globally covering 62 markets

7 7
FERRARI’S SHAREHOLDING STRUCTURE
EXOR S.p.A. Free Float
Ferrari N.V.
Ferrari S.p.A.
Mr. Piero Ferrari
~24 % ~66 %
~10 %
100%
Shareholding Structure
• Exor is the largest shareholder of Ferrari through its 23.5%. Exor’s voting power is
approximately 33.4%
• Mr. Piero Ferrari holds 10% of Ferrari common shares and, as a result of the loyalty
voting mechanism, his voting power is approximately 15.4%
• Exor and Mr. Piero Ferrari have entered into a shareholder agreement which
includes, inter alia, a pre-emption right in favor of Exor and right of first offer of Mr.
Piero Ferrari in the event of transfer of common shares

8 8
Competitive Strengths

9 9
COMPETITIVE STRENGTHS
1. Iconic brand with superior, enduring power, benefitting from a loyal customer base
2. Global access to growing wealth creation
3. Exceptional pricing power and value resilience
4. Racing heritage
5. Leading edge engineering capabilities
6. Flexible and efficient development and production process
7. Strong and resilient financial performance and conservative financial profile
8. Superior talent

10 10
1. ICONIC BRAND WITH SUPERIOR, ENDURING POWER,
BENEFITTING FROM A LOYAL CUSTOMER BASE
AAA 1
Brand Finance(1) Top 100
ItalBrand(2)
60% of new Ferrari
cars sold to existing
owners
34% of Ferrari clients
own more than one
Ferrari
1 According to Brand Finance 2 According to ItalBrand Top 100 Italian Brands, Ferrari is the most valuable Italian brand. Latest release in 2012
Unmatched tradition of luxury, world class sporting
performance, Italian design and engineering
innovation
One of the world's most iconic, valuable and
recognizable brands
Loyal and expanding customer base Ability to grow into selected lifestyle categories

11 11
16.3 24 37.4 8.4
17.4
42.1
12.4
17.3
26.6
2006A 2015A 2025E
Americas Asia Pacific EMEA
2. GLOBAL ACCESS TO GROWING WEALTH CREATION Alongside other factors, GDP and High Net Worth Individuals (“HNWIs”) wealth growth contribute to drive
demand in our cars
CAGR '15A-25E
4.4%
9.2%
4.5%
HNWIs wealth by region (US$ trillion)(1)
Ever expanding population of HNWIs
• HNWIs wealth grew by c. 5% over 2006-15
• HNWIs wealth estimated to grow by c. 6%
over the 2015-2025 period reaching
~US$106tn, threefold the 2006 figure
We adopt a flexible car shipping model, covering
emerging pockets of demand globally
1 Source: World Wealth Report 2016 (Capgemini)
37.2
58.7
106.0

12 12
3. EXCEPTIONAL PRICING POWER AND VALUE RESILIENCE Controlled production and distribution model promote unsatisfied demand (waiting lists) and thus scarcity
value, driving premium prices for new cars and resilient aftermarket values
9 OUT OF 10 MOST VALUABLE CARS EVER AUCTIONED ARE FERRARI
# Maker Type Price
(US$m)(1) Auction date
1 250 GTO Berlinetta 1962 38.1 Aug-14
2 335 Sport Scaglietti 1957 35.8 Feb-16
3 W196 Silver Arrow1954 29.6 Jul-13
4 Fangio's Mille Miglia Ferrari
290 28 Dec-15
5 275 GTB/4 S NART Spider
1967 27.7 Aug-13
6 275 GTB/C Speciale 1964 26.4 Aug-14
7 250 GT California Spider
1961 18.5 Feb-15
8 250 LM by Scaglietti1964 17.6 Aug-15
9 250 GT SWB California
Spider 1961 16.8 Aug-15
10 Ferrari 250 GT SWB
Berlinetta Speciale 1962 16.5 Aug-15
• Highly personalized "tailor made" products
• Special limited editions and one-off cars
LaFerrari >€1m
F12 TRS
• Scarcity value strongly supports value resilience
Source: www.gizmag.com, www.rmsothebys.com, www.goodingco.com updated as of February 2016 1. Auction in US$ except for: 250 GT California Spider 1961 (€16.3m), W196 Silver Arrow 1954 (£19.6m), 375-Plus Spider Competizione 1954 (£10.8m) and 355 Sport Scaglietti 1957 (€32m) 2. As of December 31, 2015
+16%(2) average
increase to selling
price from all the
personalization
programs
1%
30%
100%
2-3 per
year
One-off
Special Equipment
Personalization Program
% of clients
F12tdf

13 13
4. RACING HERITAGE Formula 1 racing – with a 2015 global viewership of 420m – is an unparalleled platform to promote our
brand and develop state-of-the-art technology
No need for mainstream product advertising, as Formula 1 participation acts as a core marketing activity
The most successful team in the racing history…
Source: Analysis based on data from IFM Sports Marketing Survey, IEG, SportCal, Sports Business, TV Sports Markets and Eurodata
Formula 1 World Drivers
Championship titles 15 Formula 1 World Constructors
Championship titles 16 Grand Prix won 224
…in one of the leading sport events globally
Local Global
Tie
r 2
Tie
r 1
Regional
2000–04 1964 1961 1958 1956 2007 1979 1975/77 1952–53
Michael Schumacher
F1-2000
John Surtees
158 F1
Phil Hill
156 F1
Mike Hawthorn
326 MI
Juan Fangio
246
Kimi Räikkönen
F2007
Jody Schekter
312 T4
Niki Lauda
312 T
Alberto Ascari
500
14 14
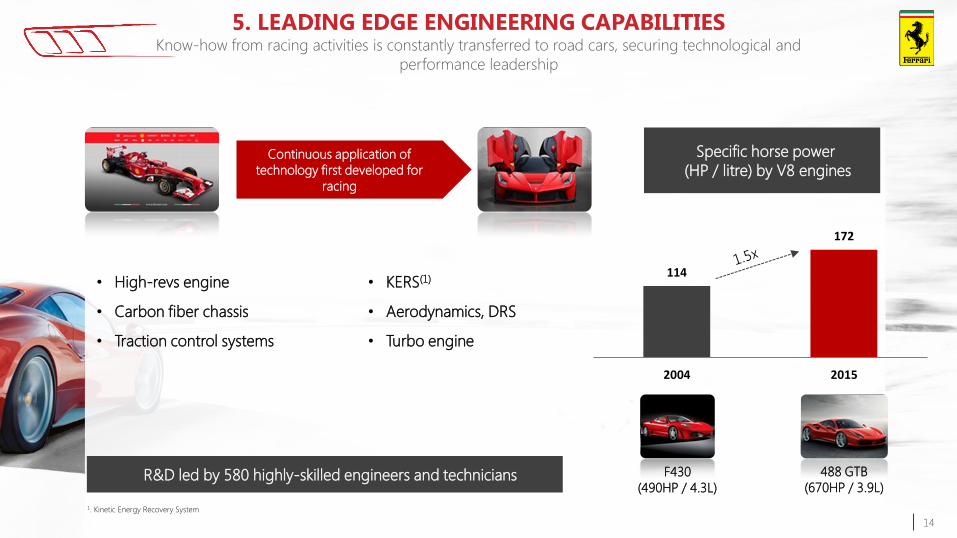
5. LEADING EDGE ENGINEERING CAPABILITIES Know-how from racing activities is constantly transferred to road cars, securing technological and
performance leadership
Specific horse power
(HP / litre) by V8 engines
R&D led by 580 highly-skilled engineers and technicians
114
172
2004 2015
488 GTB
(670HP / 3.9L)
F430
(490HP / 4.3L)
Continuous application of
technology first developed for
racing
• High-revs engine
• Carbon fiber chassis
• Traction control systems
• KERS(1)
• Aerodynamics, DRS
• Turbo engine
1. Kinetic Energy Recovery System

15
6. FLEXIBLE AND EFFICIENT DEVELOPMENT & PRODUCTION PROCESS At least one new model is launched every year, for a life cycle of 4-5 years
40 months development for new models (33 months for modified models)
Design In-house design
development
Product
Development Vehicle dynamics,
powertrain,
control systems,
aerodynamics and
technology
Procurement Strategic and
long-term
partnership
Production Production facilities
(Maranello and Modena)
Ferrari cars are fully designed, engineered and manufactured in Italy,
in recently renovated production facilities

16 16
7. STRONG AND RESILIENT FINANCIAL PERFORMANCE
AND CONSERVATIVE FINANCIAL PROFILE Over the past decade, Ferrari has consistently achieved material growth and margin expansion
Shipment evolution in line with
our controlled growth strategy to
preserve exclusivity
Source: Company filings 1. EBITDA Adjusted for non-recurring items. In 2014, €15m adjustment for former Chairman leaving package, in 2015 €29m due to expenses incurred in connection with our IPO and separation and Employees extra bonus
748
2,854
7.4 Shipments (k)
Net revenues (€m)
Adj. EBITDA(1) (€m)
2005
CAGR
2005-2015
+800bps Margin (%) 18.2% 26.2%
+10.4%
+6.4%
+3.5%
2005
2005
2015
2015
2015
CAGR
2005-2015
CAGR
2005-2015
A resilient business, almost
untouched by the financial crisis
Margin enhancement driven by
operational leverage and cost
control

17 17
8. KEY MANAGEMENT FEATURES: SUPERIOR TALENT
Vice Chairman
P. Ferrari
Chairman and CEO
S. Marchionne*
CFO and
Financial Services
A. Gili*
Internal Audit
M. Lovati
Communication
S. Lai
Legal
C. Daneo
Brand
L. Fuso*
Head of Product
N. Boari*
Chief Human
Resources Officer
M. Antoniazzi*
Chief Manufacturing
Officer
V. Regazzoni*
Chief Commercial
Officer
E. Galliera*
Head of Design
F. Manzoni*
Managing Director of
Gestione Sportiva
M. Arrivabene*
* Members of the Ferrari Group Executive Council
Chief Technology
Officer
M. Leiters*

Business Strategy and Product Portfolio

19 19
REFERENCE MARKET
• Small number of
luxury performance
car manufacturers
• Competition is
driven by the
strength of the
brand and the
appeal of the
products in terms
of performance,
styling and
innovation
Within the luxury goods market, we define our target market for luxury performance cars as two-door cars powered by
engines producing more than 500 horse power (“HP”) and selling at a retail price in excess of €150,000 per unit
Market Our Models Selected Competitors Models
SPORT
GT
488 GTB
488 Spider
F12berlinetta
California T
Lamborghini
Aventador/Huracan
Porsche 911 Turbo,
Turbo S. GT2 and GT3
Aston Martin V12
Vantage/Vanquish
Mercedes S Coupé/Cabrio
63/65 AMG Rolls-Royce Wraith
Audi R8 V10
Mercedes SL 63/65 AMG McLaren 650S
Bentley Cont. GT/GTC, V12 and
V8
GTC4Lusso

20 20
KEY MARKET TRENDS Ferrari sales have proven to be less volatile than competitors, thanks to our low volume strategy, brand
equity and constantly refreshed product range
Luxury goods market affected by
global wealth creation
1. Sources: Bain & Company, 2016 Spring Update for global personal luxury goods market and World Bank data, 1995-2015 for global GDP 2. Ferrari data based on the 22 top countries (excluding Middle East countries) for Ferrari annual registrations and sales (which accounted for approximately 85% of the total Ferrari shipments in 2015).
Data for the Luxury Performance Car Industry based on units registered (in USA, Brazil, Japan, Hong Kong, Taiwan, Australia, United Kingdom, Germany, France, Switzerland, Italy, Spain, Sweden, Netherlands, Belgium and Austria) or sold (in South Korea, Thailand, China, New Zealand, Singapore and Indonesia)
in each period. Source: USA: US Maker Data Club, Brazil-ANFAVEA; Austria-OSZ; Belgium-FEBIAC; France-SIV; Germany-KBA; UK-SMMT; Italy-UNRAE; Netherlands- VWE; Spain- TRAFICO; Sweden-BranschData; Switzerland-ASTRA; China-China Automobile Industry Association-DataClub; Hong Kong-Hong
Kong Motor Trader Association; Taiwan-Ministry of Transportation and Communications; Australia-VFACTS-S; Japan-JAIA; Indonesia-GAIKINDO; New Zealand-VFACTS; Singapore-LTA, MTA (Land Transport Authority, Motor Trader Associations); South Korea-KAIDA; Thailand -Department of Land Transportation
14,000
16,000
18,000
20,000
22,000
24,000
26,000
28,000
30,000
32,000
0
1,000
2,000
3,000
4,000
5,000
6,000
7,000
Jan-05 Dec. 31,
2005
Dec. 31,
2006
Dec. 31,
2007
Dec. 31,
2008
Dec. 31,
2009
Dec. 31,
2010
Dec. 31,
2011
Dec. 31,
2012
Dec. 31,
2013
Dec. 31,
2014
Dec. 31,
2015
FERRARI LUXURY PERFORMANCE CAR INDUSTRY
Ferrari vs. Luxury performance car market(2) (in units)
Personal luxury goods market vs. global GDP evolution(1)
(Relative growth)
(Ferrari’s units) (Luxury performance
car industry)
Personal luxury goods market has
been over-performing global GDP
growth over the past 20 years
Within the luxury performance car
market, Ferrari stands out for its
regularly growing and resilient
business
50
100
150
200
250
300
350
400
1995 1996 1997 1998 1999 2000 2001 2002 2003 2004 2005 2006 2007 2008 2009 2010 2011 2012 2013 2014 2015
Global Personal-Luxury-Goods Market Global GDP

21 21
UNRIVALLED PRODUCT PORTFOLIO Ferrari cars stand out from competition for their extreme performance, distinctive design and state-of-the-
art technology
THE XX PROGRAM(1) LIMITED EDITION SUPERCARS SPECIAL SERIES MODELS
GT SPORTS
RANGE MODELS
ROAD CARS
1. The XX Program is used to test advanced solutions and innovations by providing a selected group of clients the opportunity to drive cars with superior power and performance
V8
488 Spider
V8
California T
V8
488 GTB
V12
F12berlinetta
V12
FXX K
V12
F60 America
V12
F12tdf
V8
488 GTE
V8
F12 TRS
V12
GTC4Lusso
NON-REGISTERED RACING CARS
NON-REGISTERED CARS
ONE-OFFS “FUORI SERIE” MODELS
V12
LaFerrari

Financial Overview

23 23
Adj. EBITDA (€m) and Adj. EBITDA Margin (%)(1) Net Revenues (€m) and Shipments (k)
1 EBITDA Adjusted for non-recurring items. In 2014, €15m adjustment for former Chairman leaving package, in 2015 €29m due to expenses incurred in connection with our IPO and Separation and Employees extra bonus
3,703 3,309 3,274 3,351
2,208 2,382 2,462 2,640
789 572 675 610 705
737 844 1,063
7,405 7,000 7,255
7,664
2012 2013 2014 2015
EMEA Americas Greater China Rest of APAC
• Consistently highly profitable across the cycle
• Resilient to economic downturns
• Delivering margins above ~26% over the recent years
• Limited exposure to recent emerging markets volatility
Key Highlights Group Shipments
2,225 2,335
2,762 2,854
7.4 7.0
7.3 7.7
2005 2006 2007 2008 2009 2010 2011 2012 2013 2014 2015
573 634 693 748
25.8% 27.2%
25.1% 26.2%
2005 2006 2007 2008 2009 2010 2011 2012 2013 2014 2015
LONG-TERM HISTORICAL PERFORMANCE Resilient to economic downturns and predictable

24 24
Special series and one-offs not included
2004 2005 2006 2007 2008 2009 2010 2011 2012 2013 2014 2015 2016
V8
F430
F430 Spider
F430 Scuderia
California
Scuderia Spider 16M
458 Italia
458 Spider
California 30
458 Speciale
California T
458 Speciale A
488 GTB
488 Spider
V12
612 Scaglietti
Superamerica
599 GTB Fiorano
599 GTO
SA APERTA
FF
F12berlinetta
F12tdf
GTC4Lusso
Supercars
LaFerrari
“open-top LaFerrari”
STRONG TRACK-RECORD IN NEW MODELS INTRODUCTION Product Line-Up (at least a new model launched every year)

25 25
FY 2015 HIGHLIGHTS
Shipments
(units)
Total shipments up 6% driven by an 17% increase in V8, which was partially
offset by a 24% decrease in V12
Free Cash
Flow(1) (€M)
Free Cash Flow primarily driven by strong increase in cash from operating activities which included the following one-time cash inflows: the sale of investment properties; the reimbursement of the financing of inventory related to the establishment of the Maserati standalone business in China; and the sale of the financial assets portfolios of FFS S.p.A. and FFS KK; partially offset by the one-time extra bonus payment in December to all Ferrari employees
Net revenues up 3% (-3% at constant FX) led by cars and spare parts (+€136M)
Net revenues
(€M)
Americas: €801M (+40%) due to volumes, LaFerrari and FX
EMEA: €780 (-12%) due to lower shipments to Middle East and FX
Greater China: €239M (-11%) due to lower shipments and mix
Rest of APAC €260M (+23%) due to higher shipments, partially offset by mix
Adjusted EBIT(1)
(€M and
margin %)
Adj. EBIT growth primarily driven by volume and FX, partially offset by mix
EBIT at €444 million up 14% vs. last year, including one-time extraordinary payment in December to all Ferrari employees and IPO/spin-off costs
16.6%
14.6%
Adjusted
EBITDA(1)
(€M and
margin %)
Adjusted EBITDA increased by 8% driven by strong adjusted EBIT, partially offset by lower D&A in line with 458 family phase-out
EBITDA at €719 million (vs. €678 million in FY ‘14), including one-time extra bonus payment in December to all Ferrari employees and IPO/spin-off costs
26.2%
25.1%
Net Industrial
Cash/
(Net Industrial
Debt) (1)
(€M)
Net industrial debt at €797 million due to the capital reorganization in connection with our IPO and spin-off partially offset by the strong Free Cash Flow generation
Dec. 31, 2015
Dec. 31, 2014
1Reconciliation to non-gaap financial measures are provided in the appendix

26 26
161 162 169 185
84 93
145
154 13
16
16
17
2012 2013 2014 2015
R&D AND CAPEX BREAKDOWN
334 359 415 448
258 271
330 356
2012 2013 2014 2015
R&D expensed to the P&L Capex PP&E Capitalised R&D Other intangible assets
Highlights
• Capex have peaked in 2015 due to renewal of our product range and is expected to remain at similar levels in 2016
• The strategic business plan foresees a gradual reduction of capex from 2017 to 2019
• Depreciation and amortisation is expected to increase over the business plan period
R&D and Capex (€m)
Expensed R&D and Capex Gross Capex

Q2 2016 Results

28 28
Note: (1) Reconciliations to non-gaap financial measures are provided in the appendix
(2) Assuming FX consistent with current market conditions
(3) Including an ordinary cash distribution to the holders of common shares
…ON THE WAY TO ANOTHER RECORD YEAR
A RECORD SECOND QUARTER…
Shipments at 2,214 units, increased
by 8% vs. previous year (+155 units) – Solid performance of new models: the 488 GTB,
488 Spider and F12tdf
– LaFerrari finished its limited series run
Financial results – Net revenues grew 5.9% to €811 million
– Adjusted EBIT(1) of €156 million, 310 bps margin
increase
– Adjusted net profit(1) up 35% to €104 million
– Net industrial debt(1) at €763 million, better than
March 2016
New key product launched and
recent events – Recently unveiled open-top LaFerrari, details to be
provided at the Paris International Motor Show
– Recently signed a sponsorship agreement with
Ray-Ban
Confirming 2016 guidance(2) – Shipments: ~8,000 including supercars
– Net revenues: >€3 billion
– Adjusted EBITDA: ≥ €800 million
– Net industrial debt(3): ≤ €730 million

29 29
Q2 2016 HIGHLIGHTS
(797)
(763)
Dec. 31, 2015
Jun. 30, 2016
Shipments
(units)
Total shipments up 8% driven by a 16% increase in V8, which was partially offset by a 22%
decrease in V12:
766
811
Q2'15
Q2'16
194
217
Q2'15
Q2'16
Net revenues up 5.9% (+6.2% at constant currencies), all revenue lines positively contributing, in
particular Cars and spare parts driven by positive volumes partially offset by mix:
173
145
289 Q2'15
Q2'16
2,059
2,214
Q2'15
Q2'16
Industrial free
cash flow(1)
(€M)
Net revenues
(€M)
Adjusted EBITDA(1)
(€M and
margin %)
Net industrial
debt(1)
(€M)
Industrial free cash flow(1) primarily driven by adjusted EBITDA(1), positive change of working
capital and timing effect of advances on the new open-top LaFerrari, partially offset by capex
and the first 2016 tax advance.
Q2 2015 included one-time of €116 million.
Net industrial debt(1) reduced to €763 million primarily due to industrial free cash flow(1)
generation partially offset by €87 million cash distribution to holders of common shares and
€13 million dividends paid to NCI
Adjusted EBITDA(1) grew by 12% primarily driven by higher volume and positive contribution from Sponsorship, commercial and brand as well as other supporting activities. Adjusted EBITDA(1) excludes charges for Takata airbag inflator recalls.
Americas: €209 million (-12.7%) due to lower sales of LaFerrari
EMEA: €217 million (+6.5%) due to higher shipments of 488 family and F12tdf
Greater China: €80 million (+60.6%) due to 488 family volume increase
Rest of APAC: €84 million (-2.1%) due to mix, performance affected by timing, with 488 Spider and F12tdf having just arrived on the market
19.3%
16.2%
Adjusted EBIT(1)
(€M and
margin %) 124
156
Q2'15
Q2'16
Adjusted EBIT(1) margin increased by 310 bps driven by strong adjusted EBITDA(1) and lower D&A mainly due to 458 family and LaFerrari phase-out
26.9%
25.4%
Continuous strong sales of the new 488 GTB and 488 Spider
F12tdf reaching global distribution
F12berlinetta at its 5th year of commercialization continues to perform better than expected
LaFerrari finished its limited series run
FF phasing out in line with plans
GTC4Lusso, distribution will commence in Q3 2016
Note: (1) reconciliations to non-gaap financial measures are provided in the appendix.
Certain totals in the tables included in this document may not add due to rounding.
30 30
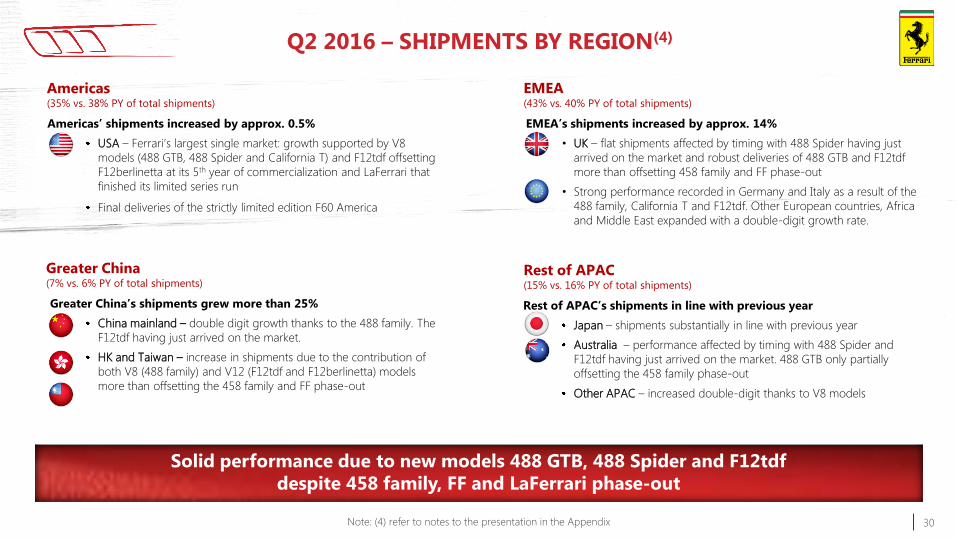
Q2 2016 – SHIPMENTS BY REGION(4)
Americas (35% vs. 38% PY of total shipments)
Americas’ shipments increased by approx. 0.5%
USA – Ferrari’s largest single market: growth supported by V8
models (488 GTB, 488 Spider and California T) and F12tdf offsetting
F12berlinetta at its 5th year of commercialization and LaFerrari that
finished its limited series run
Final deliveries of the strictly limited edition F60 America
Greater China (7% vs. 6% PY of total shipments)
Greater China’s shipments grew more than 25%
China mainland – double digit growth thanks to the 488 family. The
F12tdf having just arrived on the market.
HK and Taiwan – increase in shipments due to the contribution of
both V8 (488 family) and V12 (F12tdf and F12berlinetta) models
more than offsetting the 458 family and FF phase-out
EMEA (43% vs. 40% PY of total shipments)
EMEA’s shipments increased by approx. 14%
• UK – flat shipments affected by timing with 488 Spider having just
arrived on the market and robust deliveries of 488 GTB and F12tdf
more than offsetting 458 family and FF phase-out
• Strong performance recorded in Germany and Italy as a result of the
488 family, California T and F12tdf. Other European countries, Africa
and Middle East expanded with a double-digit growth rate.
Rest of APAC (15% vs. 16% PY of total shipments)
Rest of APAC’s shipments in line with previous year
Japan – shipments substantially in line with previous year
Australia – performance affected by timing with 488 Spider and
F12tdf having just arrived on the market. 488 GTB only partially
offsetting the 458 family phase-out
Other APAC – increased double-digit thanks to V8 models
Solid performance due to new models 488 GTB, 488 Spider and F12tdf
despite 458 family, FF and LaFerrari phase-out
Note: (4) refer to notes to the presentation in the Appendix

31
NET REVENUES BRIDGE Q2 2015-2016
+5.9%
(+6.2% at constant currencies)
579 589
57 71
103117
27
1014 14 7
34
Q2 2015 Cars and spare parts Engines Sponsorship,
commercial and
brand
Other Q2 2016
Cars and spare parts Engines Sponsorship, commercial and brand Other
766
811(€M)
(5) (6)
(7)
(8)
Note: refer to notes to the presentation in the Appendix
• €10 million increase in Cars and spare parts due to higher volumes led by new models 488 GTB, 488 Spider, F12tdf, the
non-registered car FXX K and the limited edition F60 America, along with a higher contribution from personalization partially
offset by LaFerrari that finished its limited series run
• €14 million increase in Engines mainly attributable to higher rental revenues from other Formula 1 Teams, Maserati engines in
line with previous year
• €14 million increase in Sponsorship, commercial and brand mainly due to better championship ranking, higher sponsorship
revenues and positive contribution from brand related activities

32
ADJUSTED EBIT(1) BRIDGE Q2 2015-2016
Note: (1) reconciliations to non-gaap financial measures are provided in the appendix
(€M)
Margin w/o
FX hedges
Adj. EBITDA Adj. EBITDA
194 217
25.4% 26.9%
(25)
124 24
11 0 8 14 156
Adj. EBIT Q2
2015
Vol. Mix Ind. Costs /
R&D
SG&A FX Other Adj. EBIT Q2
2016
Margin
16.2%
20.5%
(41) (23)
Margin
19.3%
21.5%
• Volume increase of approx. 230 cars (excluding LaFerrari) thanks to the newly launched 488 GTB, 488 Spider and F12tdf as well as positive contribution from personalization
• Negative mix impacted by LaFerrari that finished its limited series run and V8 slightly higher compared to the previous year partially offset by the non-registered car FXX K and the limited edition F60 America
• Industrial costs / R&D driven by lower D&A for 458 family and LaFerrari phase-out coupled with positive contribution from industrial cost savings partially offset by F1 costs
• SG&A costs flat with new store openings, new model launches and corporate costs offset by bad debt in Q2 2015
• Positive impact on FX net of hedging mainly due to USD partially offset by GBP
• Other, positive contribution from Sponsorship, commercial, brand as well as other supporting activities

33 33
NET INDUSTRIAL DEBT BRIDGE(1) MAR 31, 2016 – JUN 30, 2016
Note: (1) reconciliations to non-gaap financial measures are provided in the appendix
(€M)
217
7
62(782)
(51)(90) (100)
(26) (763)
March 31, 2016
Net industrial
debt
Adj. EBITDA Net ∆ working
capital
Tax paid Capex Other Cash distribution
and dividends
paid
FX and other June 30, 2016
Net industrial
debt
Industrial FCF €145m
• Industrial free cash flow(1) of €145 million driven by strong adjusted EBITDA(1) of €217 million, positive change of working capital and timing effect of
advances on the new open-top LaFerrari, partially offset by capex of €90 million and the first 2016 tax advance of €51 million
• Net industrial debt(1) of €763 million, better than Q1 primarily due to industrial free cash flow(1) partially offset by €87 million cash distribution to
holders of common shares and €13 million dividends paid to NCI

34 34
DEBT AND LIQUIDITY POSITION
Gross Debt Maturity Profile (€M) Cash and Marketable Securities (€M)
Net Cash/Net Industrial Debt (€M)
Maintaining a Conservative Industrial Leverage
Net Industrial Debt (€M)
Net Industrial Debt in line with EBITDA
Jun. 30, Mar. 31, Adj.
(€M) 2016 2016 FY 2015 (9)FY 2015 FY 2014
Euro 343 356 137 22 10
US Dollar 96 41 21 1 14
Chinese Yuan 73 99 106 106 74
Japanese Yen 29 24 41 41 27
Other Currencies 44 43 17 13 9
Total (€ equivalent) 585 563 322 183 134
At June 30 At March 31 At December 31
(€M) 2016 2016 2015 2014
Gross Debt (2,483) (2,442) (2,260) (510)
Cash & Cash Equivalents 585 563 183 134
Deposits in FCA Cash Management Pools - - 139 942
(Net Debt)/Net Cash (1,898) (1,879) (1,938) 566
Funded Self-Liquidating Financial 1,135 1,097 1,141 1,061
Receivables Portfolio
(Net Industrial Debt)/Net Industrial Cash (763) (782) (797) 1,627
Undrawn Committed Credit Lines 500 500 500 -
Total Available Liquidity 1,085 1,063 822 1,076
Note: (9) After settlement of deposits on FCA Group cash management pools and Financial liabilities with FCA
167
333 333 333 333
500
102 76 47
118
139
4 4 2
2016 2017 2018 2019 2020 2023Term Loan Bond US Securitization Other Financial Liabilities
Cash Maturities
285
574
414 384 335
500
(1,898)
1,135
June 30, 2016
Net Industrial Debt
Funded Self-liquidating
Financial
Receivables Portfolio
June 30, 2016
Net Debt
(763)

35 35
Shipments
Net revenues
Adj. EBITDA
Net industrial debt
˜ 8,000
>€3 billion
≥€800 million
≤€730 million(3)
CONFIRMING 2016 GUIDANCE
Guidance(2)
Note: (2) Assuming FX consistent with current market conditions
(3) Including an ordinary cash distribution to the holders of common shares

36 36
A UNIQUE VALUE PROPOSITION
Controlled Growth
in Developed and
Emerging Markets
Regular New Model
Introductions and
Enhancements
Pursue Excellence
in Formula 1 Racing
Controlled Growth
in Adjacent Luxury
and Lifestyle
Categories
Protect and Enhance the Value and Exclusivity of the Ferrari Brand, While Pursuing Profitable Growth


38 38
INCOME STATEMENT
(€m) At December 31,
2015 2014 2013 2012
Net Revenues 2,854 2,762 2,335 2,225
Cost of sales 1,499 1,506 1,235 1,199
Selling, general and administrative costs 339 300 260 243
Research and development costs 562 541 479 431
Other expenses / (income), net 11 26 (2) 17
EBIT 444 389 364 335
Net financial (expenses) / income (10) 9 3 (1)
Profit before taxes 434 398 366 335
Income tax expense 144 133 120 101
Net profit 290 265 246 233
Net profit attributable to:
Owners of the parent 288 261 241 225
Non-controlling interests 2 4 5 8
Basic and diluted earnings per common share (in €) 1.52 1.38 1.27 1.19
Company filings prepared in accordance with IFRS

39 39
BALANCE SHEET
(€m) At December 31,
(€m) At December 31,
2015 2014 2013 2012 2015 2014 2013 2012
Assets Total (deficit) / equity (19) 2,478 2,316 2,041
Goodwill 787 787 787 787 Debt 2,260 510 317 261
Intangible assets 308 265 242 265 Other financial liabilities 103 104 4 23
Property, plant and equipment 626 585 568 545 Trade payables 507 536 486 480
Other non-current assets 134 159 79 76 Current tax payables 125 110 104 109
Total non-current assets 1,856 1,797 1,677 1,673 Employee benefits 78 77 65 79
Deposits in FCA Group cash
management 139 942 684 457 Provisions 142 135 104 119
Cash and cash equivalents 183 134 114 100 Other liabilities 678 692 498 352
Inventories 295 296 237 216 Total liabilities 3,895 2,163 1,579 1,424
Trade receivables 158 184 206 136 Total (deficit) / equity and liabilities 3,875 4,641 3,895 3,465
Receivables from financing activities 1,174 1,224 863 803
Other current assets 70 64 115 81
Total current assets 2,020 2,845 2,219 1,792
Total assets 3,875 4,641 3,895 3,465
Company filings prepared in accordance with IFRS

40
CASH FLOW STATEMENT
(€m) At December 31,
2015 2014 2013 2012
Profit before taxes 434 398 366 335
Amortization and depreciation 275 289 270 238
Change in Operating Working Capital (33) (52) (88) 14
Change in Receivables from Financing Activities 121 (202) (57) (148)
Paid Taxes (145) (141) (139) (134)
Other Cash Flows from Operating Activities 55 134 101 160
Cash Flow from Operating Activities 707 426 454 463
Net Capex (317) (290) (267) (258)
Cash Flow from Investing Activities (317) (290) (267) (258)
Net Repayment of Bank Borrowings 2,119 79 5 10
Net change in financial liabilities with FCA Group (3,211) 89 51 (293)
Net change in deposits in FCA Group cash management pools 814 (247) (227) 73
Dividends paid to non-controlling interest (54) (15) 0 (7)
Other Cash Flows from Financing Activities (20) (28) 8 23
Cash Flow from Financing Activities (351) (122) (163) (194)
Translation exchange differences 10 6 (9) (4)
Net Change in Cash 48 20 14 6
Cash at Beginning of the Period 134 114 100 94
Cash at End of the Period 183 134 114 100
Company filings prepared in accordance with IFRS

41 41
NOTES TO THE PRESENTATION
1. reconciliations to non-gaap financial measures are
provided in the appendix
2. Assuming FX consistent with current market conditions
3. Including an ordinary cash distribution to the holders of
common shares
4. Shipments geographical breakdown
EMEA includes: Italy, UK, Germany, Switzerland, France,
Middle East (includes the United Arab Emirates, Saudi
Arabia, Bahrain, Lebanon, Qatar, Oman and Kuwait)
and Rest of EMEA (includes Africa and the other
European markets not separately identified);
Americas includes: United States of America, Canada,
Mexico, the Caribbean and Central and South America;
Greater China includes: China, Hong Kong and Taiwan;
Rest of APAC includes: Japan, Australia, Singapore,
Indonesia and South Korea
5. Includes the net revenues generated from shipments of
our cars, including any personalization revenue
generated on these cars and sales of spare parts
6. Includes the net revenues generated from the sale of
engines to Maserati for use in their cars, and the
revenues generated from the rental of engines to other
Formula 1 racing teams
7. Includes the net revenues earned by our Formula 1
racing team through sponsorship agreements and our
share of the Formula 1 World Championship
commercial revenues and net revenues generated
through the Ferrari brand, including merchandising,
licensing and royalty income
8. Primarily includes interest income generated by the
Ferrari Financial Services group and net revenues from
the management of the Mugello racetrack

42 42
GROUP SHIPMENTS
833 953
772 774
127 160
327
327 2,059
2,214
Q2 2015 Q2 2016
1,598 1,903
1,287
1,297
261
316 548
580 3,694
4,096
H1 2015 H1 2016
EMEA Americas Greater China Rest of APAC
3,351 ~3,500
2,640 ~2,700
610 ~700
1,063 ~1,100
7,664 ~8,000
FY 2015 FY 2016E
Note: Graphs not to scale. Shipments including supercar LaFerrari
+8% +11%

43 43
KEY PERFORMANCE METRICS
€M, except as otherwise stated FY ’15 FY ’14 FY ’13 FY ’12
Worldwide Shipments (Units) 7,664 7,255 7,000 7,405
Net Revenues 2,854 2,762 2,335 2,225
EBIT 444 389 364 335
Adjustments 29 15 - -
Adjusted EBIT(1) 473 404 364 335
Net Financial (Expenses)/Income (10) 9 2 (1)
Profit before Taxes 434 398 366 334
Income Tax Expense 144 133 120 101
Effective Tax Rate 33.2% 33.5% 32.8% 30.2%
Net Profit 290 265 246 233
EPS 1.52 1.38 1.27 1.19
EBITDA(1) 719 678 634 573
Adjusted EBITDA(1) 748 693 634 573
Note: (1) Reconciliation of non-gaap financial measures are provided in the appendix

44 44
KEY PERFORMANCE METRICS
Note: (1) Reconciliation to non-gaap financial measures are provided in the appendix.
Certain totals in the tables included in this document may not add due to rounding.
Q2 ‘16 Q2 ‘15 €M, except as otherwise stated H1 ‘16 H1 ‘15
2,214 2,059 Worldwide shipments (units) 4,096 3,694
811 766 Net revenues 1,486 1,387
207 192 EBITDA(1) 385 348
217 194 Adjusted EBITDA(1) 395 354
146 122 EBIT 267 218
156 124 Adjusted EBIT(1) 277 224
5 8 Net financial expenses 14 6
141 114 Profit before taxes 253 212
44 38 Income tax expense 78 71
30.7% 33.5% Effective tax rate 30.8% 33.5%
97 76 Net profit 175 141
104 78 Adjusted net profit(1) 182 145
0.52 0.40 EPS 0.93 0.74
0.55 0.41 Adjusted EPS(1) 0.96 0.76

45 45
NON-GAAP FINANCIAL MEASURES
Non-GAAP financial measures
Operations are monitored through the use of
various Non-GAAP financial measures that
may not be comparable to other similarly
titled measures of other companies
Accordingly, investors and analysts should
exercise appropriate caution in comparing
these supplemental financial measures to
similarly titled financial measures reported by
other companies
We believe that these supplemental financial
measures provide comparable measures of
its financial performance which then facilitate
management’s ability to identify operational
trends, as well as make decisions regarding
future spending, resource allocations and
other operational decisions
Non-GAAP financial measures
EBITDA is defined as net profit before income tax expense, net financial
expenses/(income) and depreciation and amortization. Adjusted EBITDA is defined as
EBITDA as adjusted for income and costs, which are significant in nature, but expected
to occur infrequently
Adjusted Earnings Before Interest and Taxes (“Adjusted EBIT”) represents EBIT as
adjusted for income and costs, which are significant in nature, but expected to occur
infrequently
Adjusted net profit represents net profit as adjusted for income and costs, which are
significant in nature, but expected to occur infrequently
Adjusted earning per share represents earning per share as adjusted for income and
costs, which are significant in nature, but expected to occur infrequently
Net Industrial Debt defined as Net Debt excluding the funded portion of the self-
liquidating financial receivables portfolio, is the primary measure to analyze our financial
leverage and capital structure, and is one of the key indicators used to measure our
financial position
Free Cash Flow and Free Cash Flow from Industrial Activities are two of management’s
primary key performance indicators to measure the Group’s performance. Free Cash
flow is defined as net cash generated from operations less cash flows used in investing
activities. Free Cash Flow from Industrial Activities is defined as Free Cash Flow adjusted
for the change in the self-liquidating financial receivables portfolio.

46 46
RECONCILIATION OF NON-GAAP MEASURES: ADJ. EBIT
€M, except as otherwise state FY ’15 FY ’14 FY ’13 FY ’12
EBIT 444 389 364 335
Expense Related to the Resignation of
the Former Chairman – 15 – –
Income and Expenses Incurred in
Connection with Our IPO and
Separation and Employees Extra Bonus
29 – – –
Adjusted EBIT 473 404 364 335

47 47
RECONCILIATION OF NON-GAAP MEASURES: EBITDA
€M, except as otherwise stated FY ’15 FY ’14 FY ’13 FY ’12
Net Profit 290 265 246 233
Income Tax Expense 144 133 120 101
Net Financial Expenses/(Income) 10 (9) (2) 1
Amortisation and Depreciation 275 289 270 238
EBITDA 719 678 634 573

48 48
RECONCILIATION OF NON-GAAP MEASURES: ADJ. EBITDA
€M, except as otherwise stated FY ’15 FY ’14 FY ’13 FY ’12
EBITDA 719 678 634 573
Expense Related to the Resignation of
the Former Chairman – 15 – –
Income and Expenses Incurred in
Connection with our IPO and
Separation and Employees Extra Bonus
29 – – –
Adjusted EBITDA 748 693 634 573

49 49
RECONCILIATION OF NON-GAAP MEASURES: FREE CASH FLOW
€M, except as otherwise stated FY ’15 FY ’14 FY ’13 FY ’12
Cash Flows from Operating Activities 707 426 454 463
Cash Flows Used in Investing Activities (317) (290) (267) (258)
Free Cash Flow 390 136 187 205

50 50
RECONCILIATION OF NON-GAAP MEASURES:
NET INDUSTRIAL CASH/(DEBT)
€M, except as otherwise stated December 31,
2015
December 31,
2014
December 31,
2013
December 31,
2012
Cash and Cash Equivalents 183 134 114 100
Deposits in FCA Group cash
Management Pools 139 942 684 457
Financial Liabilities with FCA Group (3) (379) (242) (196)
Financial Liabilities with Third-parties (2,257) (131) (76) (65)
Total Net Cash/(Net Debt) (1,938) 566 480 296
Funded Portion of the Self-liquidating
Financial Receivables portfolio 1,141 1,061 782 758
Net Industrial Cash/(Debt) (797) 1,627 1,262 1,054
51 51
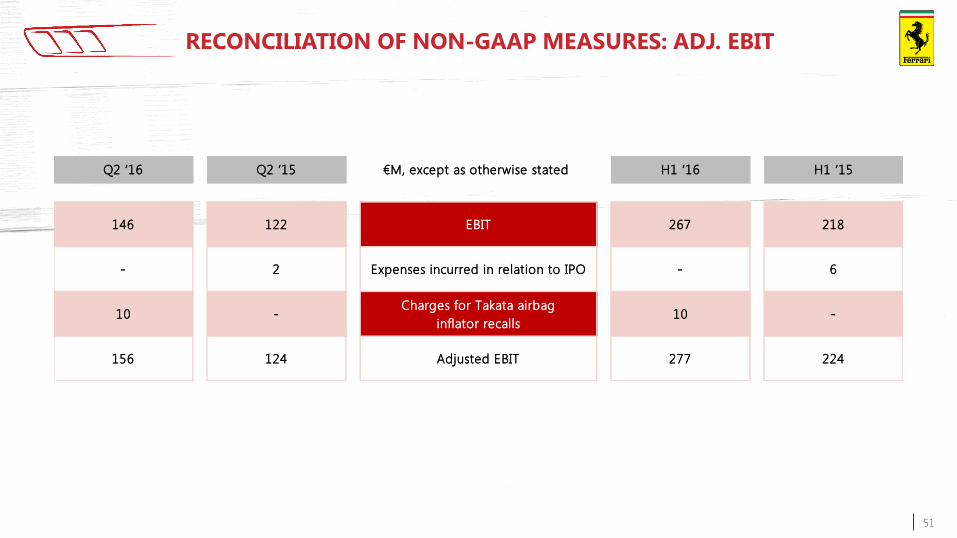
RECONCILIATION OF NON-GAAP MEASURES: ADJ. EBIT
Q2 ‘16 Q2 ‘15 €M, except as otherwise stated H1 ‘16 H1 ‘15
146 122 EBIT 267 218
- 2 Expenses incurred in relation to IPO - 6
10 -Charges for Takata airbag
inflator recalls10 -
156 124 Adjusted EBIT 277 224

52 52
RECONCILIATION OF NON-GAAP MEASURES: EBITDA
Q2 ‘16 Q2 ‘15 €M, except as otherwise stated H1 ‘16 H1 ‘15
97 76 Net profit 175 141
44 38 Income tax expenses 78 71
5 8 Net financial expenses 14 6
61 70 Amortization and depreciation 118 130
207 192 EBITDA 385 348
53 53
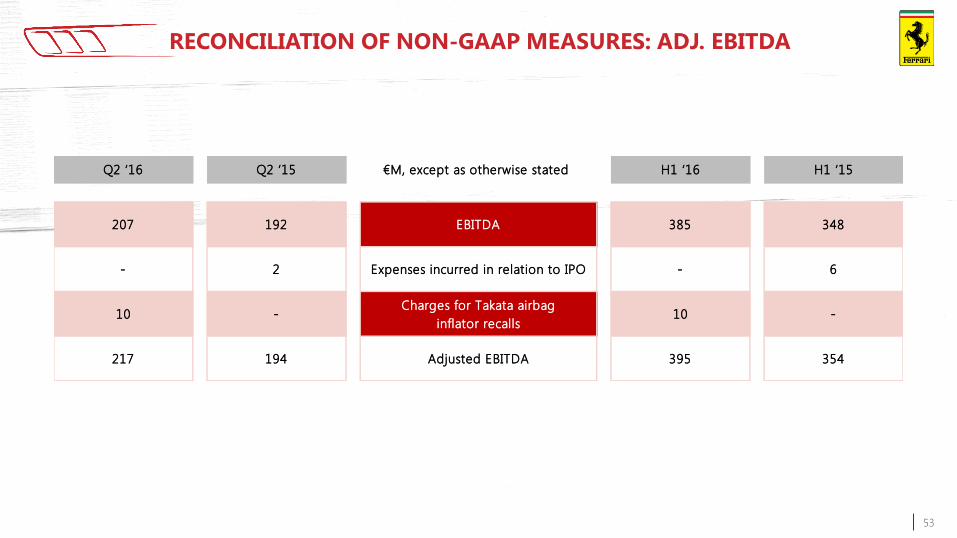
RECONCILIATION OF NON-GAAP MEASURES: ADJ. EBITDA
Q2 ‘16 Q2 ‘15 €M, except as otherwise stated H1 ‘16 H1 ‘15
207 192 EBITDA 385 348
- 2 Expenses incurred in relation to IPO - 6
10 -Charges for Takata airbag
inflator recalls10 -
217 194 Adjusted EBITDA 395 354

54 54
RECONCILIATION OF NON-GAAP MEASURES: ADJ. NET PROFIT
Q2 ‘16 Q2 ‘15 €M, except as otherwise stated H1 ‘16 H1 ‘15
97 76 Net profit 175 141
- 2 Expenses incurred in relation to IPO
(net of tax effect)- 4
7 -Charges for Takata airbag
inflator recalls (net of tax effect)7 -
104 78 Adjusted net profit 182 145

55 55
RECONCILIATION OF NON-GAAP MEASURES: ADJ. EPS
Q2 ‘16 Q2 ‘15 € per common share H1 ‘16 H1 ‘15
0.52 0.40 EPS 0.93 0.74
- 0.01 Expenses incurred in relation to IPO
(net of tax effect)- 0.02
0.04 -Charges for Takata airbag
inflator recalls (net of tax effect)0.04 -
0.55 0.41 Adjusted EPS 0.96 0.76
Certain totals in the tables included in this document may not add due to rounding
56 56
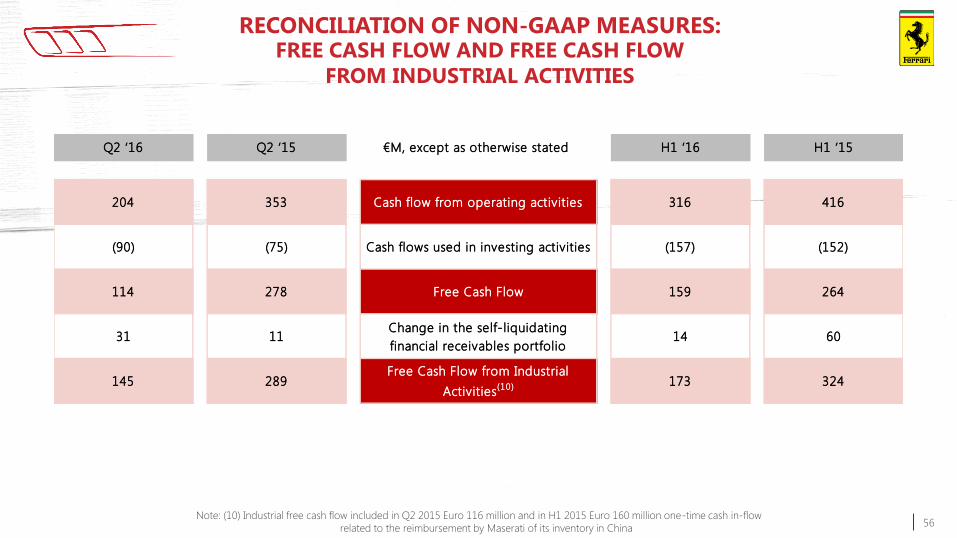
RECONCILIATION OF NON-GAAP MEASURES: FREE CASH FLOW AND FREE CASH FLOW
FROM INDUSTRIAL ACTIVITIES
Q2 ‘16 Q2 ‘15 €M, except as otherwise stated H1 ‘16 H1 ‘15
204 353 Cash flow from operating activities 316 416
(90) (75) Cash flows used in investing activities (157) (152)
114 278 Free Cash Flow 159 264
31 11 Change in the self-liquidating
financial receivables portfolio14 60
145 289 Free Cash Flow from Industrial
Activities(10) 173 324
Note: (10) Industrial free cash flow included in Q2 2015 Euro 116 million and in H1 2015 Euro 160 million one-time cash in-flow
related to the reimbursement by Maserati of its inventory in China

57 57
RECONCILIATION OF NON-GAAP MEASURES:
NET INDUSTRIAL DEBT
€M, except as otherwise stated June 30, 2016 March 31, 2016 December 31, 2015
Net Industrial Debt (763) (782) (797)
Funded portion of the self-liquidating
financial receivables portfolio1,135 1,097 1,141
Net Debt (1,898) (1,879) (1,938)
Financial liabilities with FCA Group - - (3)
Deposits in FCA Group cash management
pools- - 139
Cash and cash equivalents 585 563 183
Gross Debt (2,483) (2,442) (2,257)

A unique combination of
technology,
performance,
versatility
and sport luxury
Mid – front naturally
aspirated V12 engine:
690 hp @ 8,000 rpm
Max speed
in excess
of 335 km/h
Distribution will
commence in
Q3 2016
and it will
substitute the FF

Strictly
confidential
The new limited-edition
special series
already pre-sold
Sporting a 800 hp V12
coupled with a 120 kW
electric motor, unleashing
963 hp in total
The name and technical characteristics of
the new limited-edition special series to
be unveiled at the
Paris International Motor Show