company overview - emo
TRANSCRIPT

Company OverviewNovember 2016

DCC Overview
Profit by division Profit by geography
1
• Listed on the London Stock Exchange since 1994
• FTSE 100 (Support Services) since December 2015
• Market capitalisation of c. £5.5 billion
• Employs approximately 10,500 people
• Operating in 15 countries
DCC is an international sales, marketing, distribution and business support services group operating across four divisions
68%15%
12%5%
DCC Energy
DCC Healthcare
DCC Technology
DCC Environmental
53%40%
7%
UKContinental Europe/OtherROI
DCC – Financial Highlights 2016Revenue
£10.6bnOperating profit
£300.5mOperating cash flow
£411.7m
ROCE
21.0%Net debt/EBITDA
0.2xInterest cover (times)
12.9x

DCC’s Strategy
Our objective:
To continue to build a growing, sustainable and cash generative business which consistently provides returns on total capital employed significantly ahead of its cost of capital
2
Our strategic priorities:
Creating and sustaining leading positions ineach of the markets in which we operate
Continuously benchmarking and improvingthe efficiency of our operating model in eachof our businesses
Carefully extending our geographic footprintto provide new horizons for growth
Attracting and empowering entrepreneurial leadership teams, capable of delivering outstanding performance, through the deployment of a devolved management structure
Maintaining financial strength through a disciplined approach to balance sheet management

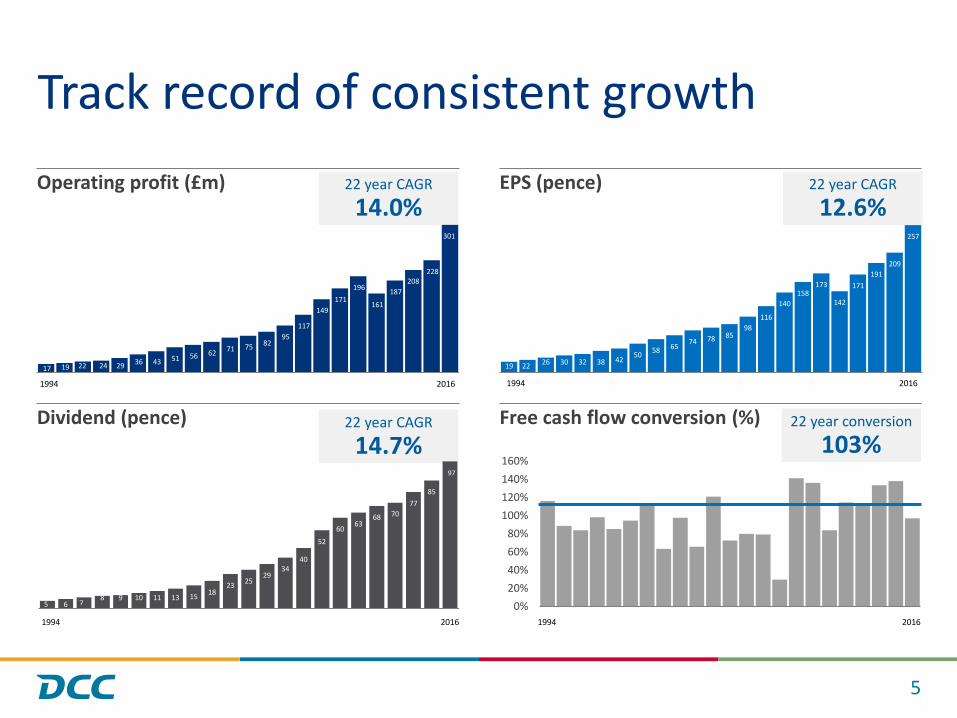
Cash flow since flotation in 1994
• Revenue increased from £0.2bn to £10.6bn
• Operating profit increased from £17.5m to £300.5m. CAGR of 14.0%
• £252m working capital inflow
• Capex exceeded depreciation by £132m
• Free cash flow of £2.6bn
• 22 year free cash flow conversion of 103%and CAGR of 13.1%
• Cash flow after interest and tax of £2.0bn
• Acquisition spend of £1.8bn
• Dividend / share buybacks of £0.8bn
• Net debt / EBITDA of c. 0.2 times
3
1 April 1994 – 31 March 2016 £m22 Year CAGR
Operating profit 2,496 14.0%
Decrease in working capital 252
Depreciation 689
Other (52)
Operating cash flow 3,385 13.6%
Capex (821)
Free cash flow 2,564 13.1%
Interest and tax (537)
Free cash flow after interest and tax 2,027 13.2%
Acquisitions (1,776)
Disposals/exceptionals 223
Dividends/share buybacks (761)
Share issues 263
Translation and other (29)
Net cash outflow (53)
Opening net debt (2)
Closing net debt (55)

£1,084m63%
£239m14%
£303m18%
£88m5%
EnergyHealthcareTechnologyEnvironmental
*Excluding acquisitions in DCC Food & Beverage - which was disposed of in FY15
Acquisitions – an important part of the growth story
Acquisitions (£m) By Division – Since 1994*
4
32 9
32 26 7
48 31
21
48
72
11
66 45
86
144
83
109
64
137
168
50
124
394
• £1.8bn acquisition spend since flotation in 1994
• Disposals net of exceptionals yielded £0.2bn
• Acquisition spend increasing as size of the Grouphas grown – £1.3bn spend since 2008
• 2016 included the Group’s two largest acquisitionsto date – Butagaz and Esso Retail in France
22 Year Total
£1.7bn
1994 2016
22 year CAGR
14.0%
17 19 22 24 29 36 43 51 56 6271 75 82
95
117
149
171
196
161
187
208228
301
22 year CAGR
14.7%
22 year CAGR
12.6%
Track record of consistent growth
5
5 6 78 9 10 11 13 15
1823
2529
3440
52
6063
68 70
77
85
97
19 22 26 30 32 38 4250
58 6574 78 85
98
116
140
158173
142
171
191
209
257
0%
20%
40%
60%
80%
100%
120%
140%
160%
Operating profit (£m) EPS (pence)
Dividend (pence) Free cash flow conversion (%) 22 year conversion
103%
1994 2016 1994 2016
1994 2016 1994 2016
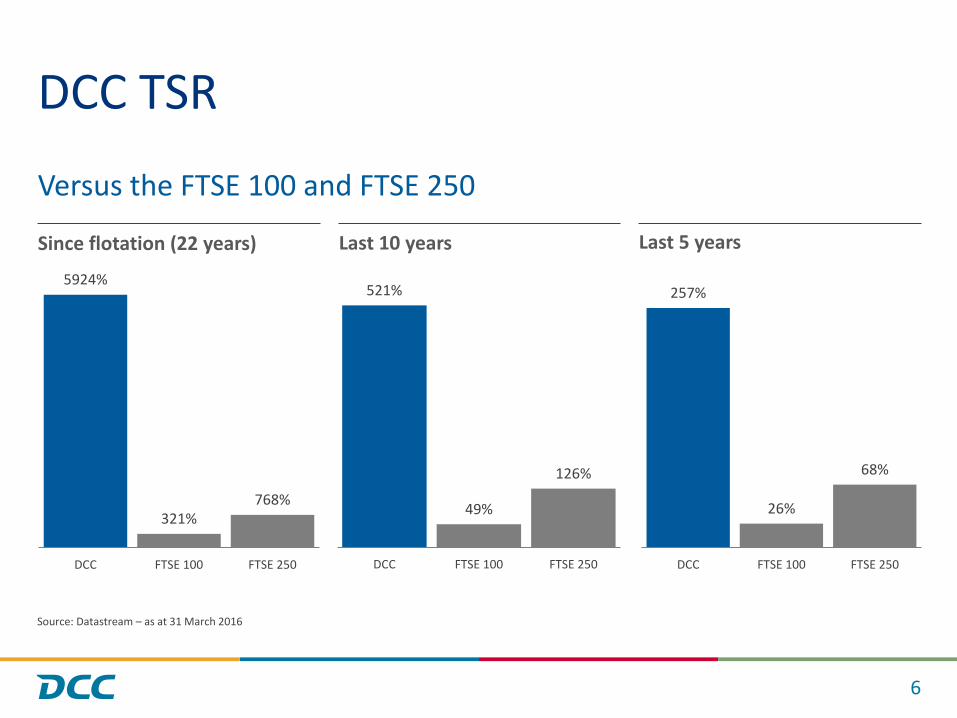
Versus the FTSE 100 and FTSE 250
DCC TSR
6
Source: Datastream – as at 31 March 2016
5924%
321%768%
DCC FTSE 100 FTSE 250
Since flotation (22 years)
521%
49%
126%
DCC FTSE 100 FTSE 250
Last 10 years
257%
26%
68%
DCC FTSE 100 FTSE 250
Last 5 years

Our Business: By Division

DCC Energy
The leading oil and liquefied petroleum gas (“LPG”) sales, marketing and distribution business in Europe
• LPG distribution for heating, cooking, transportand industrial/agricultural processes, developing position in natural gas
• Oil distribution for transport, heating andindustrial/agricultural processes
• Retail stations and fuel cards for consumersand commercial customers
• Established market leadership positions in7 countries with a platform to grow the business across Europe and beyond
• Over 30 years industry experience
• Consolidator of fragmented markets
• Partner of choice for oil majors in asset divestment
8
55%
14%
20%
11%
Transport Fuels
Commercial Fuel
Heating (Oil & LPG)
LPG
Volume
12.7bnLitres
Revenue
£7,515m
Operating profit
£205.2m
ROCE
24.4%
Recurring revenue, cash generative and high ROCE business
Based on results for the year ended 31 March 2016

Our Business
54%38%
8%
Britain
Europe
Ireland
9
Volumes by geography
Customer Volumes
46%
26%
11%
4%3%
10% Commercial & Industrial
Retail
Domestic
Agricultural
Marine
Other
16%
25%59%
LPG
Retail & Fuelcard
Oil
Volumes by sector
Operating profit by sector
57%23%
20%
LPG
Retail & Fuelcard
Oil
Based on results for the year ended 31 March 2016
DCC Energy

A Business of Scale
Pro-Forma Business Statistics FY 2016(inc. acquisitions announced)
10
Volumes
14.4bnLitres
Customers
1.3m
Trucks
2,100Employees
5,300Facilities
420
Retail petrol sites operated (825) / supplied (1,900)
Sweden
205
Britain
1,270
Austria
300
France
400
Ireland
150
400
Denmark
DCC Energy

DCC Healthcare
A leading healthcare business, providing products and services to healthcare providers and health & beauty brand owners
11
FY2016
Revenue £490.7m
Operating profit £45.0m
ROCE 17.1%
Employees 2,054
68%
32%Healthcare providers
Brand Owners
FY16 sales by sector FY16 sales by geography
72%
11%
17%
UK
Ireland
ROW

DCC Vital - What We Do
12
40%
60%Own Brand
Third Party
FY16 Gross Profit by product:
FY16 Gross Profit by channel:
53%24%
23% Hospitals
Pharma retail /wholesalePrimary care
DCC VitalSales and marketing of medical and pharmaceutical products to healthcare providers across all sectors of the healthcare market in the UK & Ireland
Our Suppliers
Third party brand owners
Our Services
Our Customers
Own brand/licence products
Sales marketingand distribution
Portfoliodevelopment
Procurement VendorManagement
Supply chainmanagementand logistic
services
Hospitals Pharma retailersand wholesalers
Primary Care(GPs and Community Care)
DCC Healthcare

DCC Health & Beauty Solutions - What We Do
13
DCC H&BS
builds long term partnerships with international brand owners, providing specialist services incl. product development, formulation, manufacturingand packaging
• Five high quality facilities producing tablets, hard shell capsules, soft gels capsules, creams, liquids
• Packaging formats: pots, blisters, sachets, tubes, bottles, pumps, sprays
A selection of brands we support:
Our Services
Product development,contract manufacturingand packing of health
& beauty products
Our Customers
Health &beauty brand
owners
Specialisthealth &beauty
retailers
Direct sales/mail ordercompanies
DCC Healthcare

DCC Technology
Leading route-to-market partner for global technology brands
14
FY2016
Revenue £2,442m
Operating profit £35.1m
ROCE 17.8%
Employees 2,132
DCC Technology operates under the brand
350+industry leading
suppliers
In the homeIn the office On the move
30,000+ customers
Retail, etail, reseller
Consumer & B2B
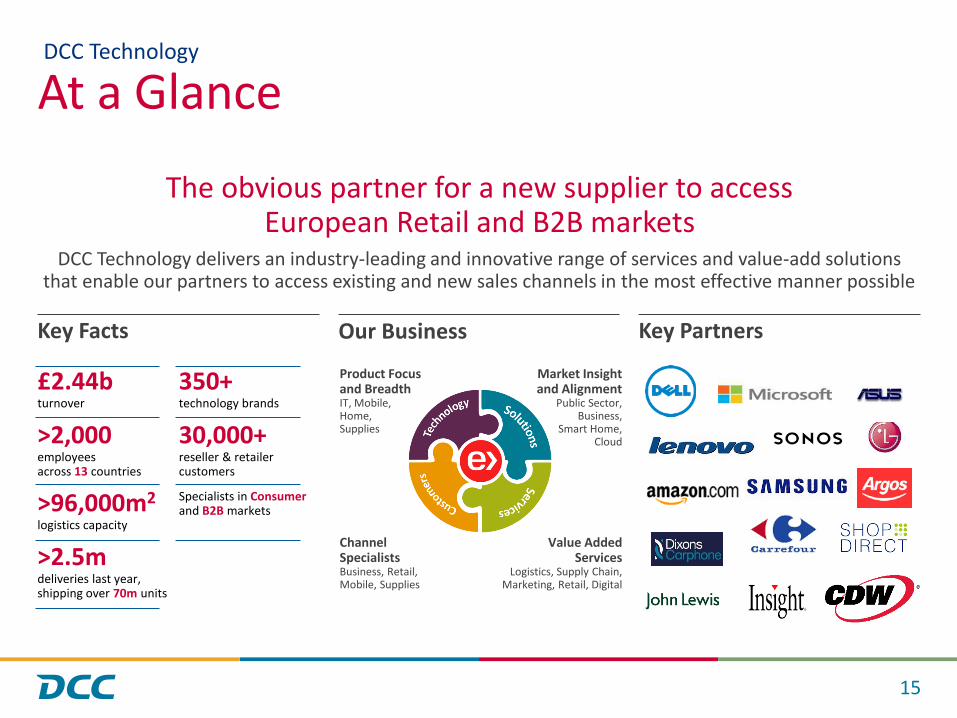
At a Glance
The obvious partner for a new supplier to access European Retail and B2B markets
DCC Technology delivers an industry-leading and innovative range of services and value-add solutionsthat enable our partners to access existing and new sales channels in the most effective manner possible
15
Key Facts Key PartnersOur Business
£2.44bturnover
>2,000employees across 13 countries
>96,000m2
logistics capacity
>2.5m deliveries last year, shipping over 70m units
350+ technology brands
30,000+reseller & retailer customers
Specialists in Consumerand B2B markets
Channel SpecialistsBusiness, Retail, Mobile, Supplies
Market Insight and Alignment
Public Sector, Business,
Smart Home, Cloud
Product Focus and BreadthIT, Mobile, Home,Supplies
Value Added Services
Logistics, Supply Chain, Marketing, Retail, Digital
DCC Technology

Strong Market Positions
16
DCC Technology Geography Market Position
In the homeIn the office On the move
UK No. 1
Ireland No. 1
France No. 7
Sweden No. 3
Others
BelgiumGermanyNetherlandsNorwaySpainUAE
Total Europe No. 4
Current presence
Expansion plans
Global supply chain capability with offices in China, Poland and US
DCC Technology

FY2016
Revenue £153.5m
Operating profit £15.2m
ROCE 11.7%
Employees 1,070
Leading British & Irish provider of recycling, waste management and resource recovery services
Raw material formanufacturing
Our Customers
Commercial and industrial waste
Construction and demolition waste
Public sector
Our Outlets
Energy Landfill
DCC Environmental
17
Revenue Split
59%
41%
Non hazardous waste
Hazardous waste
Our Services
DCC Material recycling facility