community trauma report - universityhealthsystem.com
TRANSCRIPT

SECOND ANNUAL
COMMUNITYTRAUMA REPORT
1
ith this, our second annual Community Trauma Report, we hope to continue an important conversation about the terrible cost of serious injuries in our region. There are the human costs, measured in lost lives and lifelong disabilities. There are financial costs, with millions of dollars in medical expenses and
collateral property loss that all of us share. And finally, there are the devastating emotional costs of witnessing our parents, children and other loved ones suffer, and of seeing the promise and productivity of young adults cut short. These are not fixed costs. We have the opportunity to change the extent to which we are impacted by them. We can — and should — decide as a community that these costs are too high to pay.
As a trauma surgeon who treats and studies these injuries, I have come to the realization that the last significant frontier where we can reduce these costs is in injury prevention. Here at University Health System we have stepped up our trauma prevention programs. We provide hundreds of car seats, and classes on how to properly install them, each year to families throughout Bexar County. We visit schools and talk to children and teens about the consequences of distracted driving. We have also begun a program to help older adults avoid falls — a highly underappreciated and major cause of disability and death. In order to make a significant dent in this problem, however, we need a communitywide commitment to safer driving, to safer streets and to safer homes. Each of us must encourage, expect and even
demand responsible behavior from our family, friends, coworkers — and ourselves.
We are fortunate to have a first-rate system of trauma care in Bexar County. University Hospital, with its physician partners at the UT Health Science Center, is the premier Level I trauma center for South Texas. We serve a land mass equal in size to the state of Louisiana. Last year, University Hospital admitted 4,340 seriously injured patients — a 29 percent increase from only five years earlier. Since mid-April, these patients have been cared for in the newly constructed, state-of-the-art trauma center at University Hospital. South Texas is one of the fastest-growing regions in the nation, and economic growth fueled in part by drilling in the Eagle Ford formation will mean more people — and more injuries. This year’s report includes a special look at trauma in the Eagle Ford counties.
The trends described in this report reflect the thousands of trauma patients treated each year at University Hospital. By identifying those trends, we can focus our efforts on building a safer community. I thank you for your interest in this important topic.
Dr. John G. MyersPresident, University Health System Medical/Dental StaffChief of Trauma and Emergency SurgeryProfessor, Department of Surgery at the UT Health Science Center.
W
Top 5 injury causes1. Falls2. Car and truck crashes3. Assaults4. Burns5. Motorcycle crashesUniversity Hospital 2013


Table of ContentsSPOTLIGHT
Concussions ............................................................................................................................................... 6Dog bites ..................................................................................................................................................... 7 Falls .............................................................................................................................................................. 8
INJURIES TO CHILDREN ....................................................................................................................... 11 Leon and Krystina .................................................................................................................................... 12Leading causes by age .............................................................................................................................. 13Five-year trends .................................................................................................................................. 14-15Motor vehicle crashes .............................................................................................................................. 16Burns .......................................................................................................................................................... 17 Bike injuries .............................................................................................................................................. 18Map of children’s injuries ......................................................................................................................... 19
INJURIES TO ADULTS ............................................................................................................................. 20Jonathan Esquivel .................................................................................................................................... 21Eagle Ford Shale Formation .................................................................................................................... 22Leading causes by age .............................................................................................................................. 23Five-year trends .................................................................................................................................. 24-25Motor vehicle crashes .............................................................................................................................. 26Violence ..................................................................................................................................................... 27Map of adult injuries ................................................................................................................................ 29
University Hospital ..................................................................................................................................... 30A system of trauma care ............................................................................................................................. 31Resources ...................................................................................................................................................... 32Research ........................................................................................................................................................ 33Trauma Service faculty and staff ................................................................................................................ 34Bexar County Hospital District and University Health System leadership .......................................... 35

Spotlight: ConcussionsThe problem: The growing realization that concussions in sports can have lasting and cumulative damage to the brain, particularly in children and adolescents.
The numbers: A total of 202 children were treated for head injuries at University Hospital’s trauma center in 2013 — some of them for sports-related concussions. An estimated 250,000 children a year are brought to emergency rooms across the country for sports-related concussions.
The recommendation: Concussions are serious. Even what seems like a minor blow on the head can have lasting consequences. Know the symptoms of concussions. If any are present, that person should be kept out of play that day, and until he or she can be evaluated and cleared by a medical professional trained to evaluate concussion. Pre-season baseline concussion screenings that evaluate a young athlete’s balance and brain function are available, and
can help quickly determine the seriousness of a brain injury when it occurs.
Rising concern about the problem of concussions in sports led the White House to convene in May 2014 a Healthy Kids & Safe Sports Concussion Summit, bringing together athletes, parents and researchers to focus attention on the risks of head injury to athletes of all ages, all sports and both sexes.
“Our brain is our most valuable resource,” said Dr. Lillian Liao, assistant professor of surgery at UT Health Science Center San Antonio, and medical director of pediatric trauma and burns at University
Hospital. “An injured brain that is not allowed to fully recover can cause sudden death when injured again.
“We would never let a kid with a broken leg go back to playing football or soccer until the bone is healed,” Dr. Liao added. “Why would we even consider doing that to our most valuable resource?”
University Hospital offers ImPACT testing, pre- and post-injury evaluations that establish a baseline to quickly diagnose and measure concussions in young athletes. For information about the screening, call (210) 358-0500. The trauma team is also launching a major public awareness campaign, working with area schools and school districts to make parents, students and faculty aware of the symptoms and steps to take to reduce the risk of permanent disabilities. Symptoms include:
• Headache• Confusion• Difficulty remembering or paying attention• Balance problems or dizziness• Feeling sluggish, hazy, foggy or groggy• Feeling irritable, more emotional or “down”
• Nausea or vomiting• Bothered by light or noise• Double or blurry vision• Slowed reaction time• Sleep problems• Loss of consciousness
6
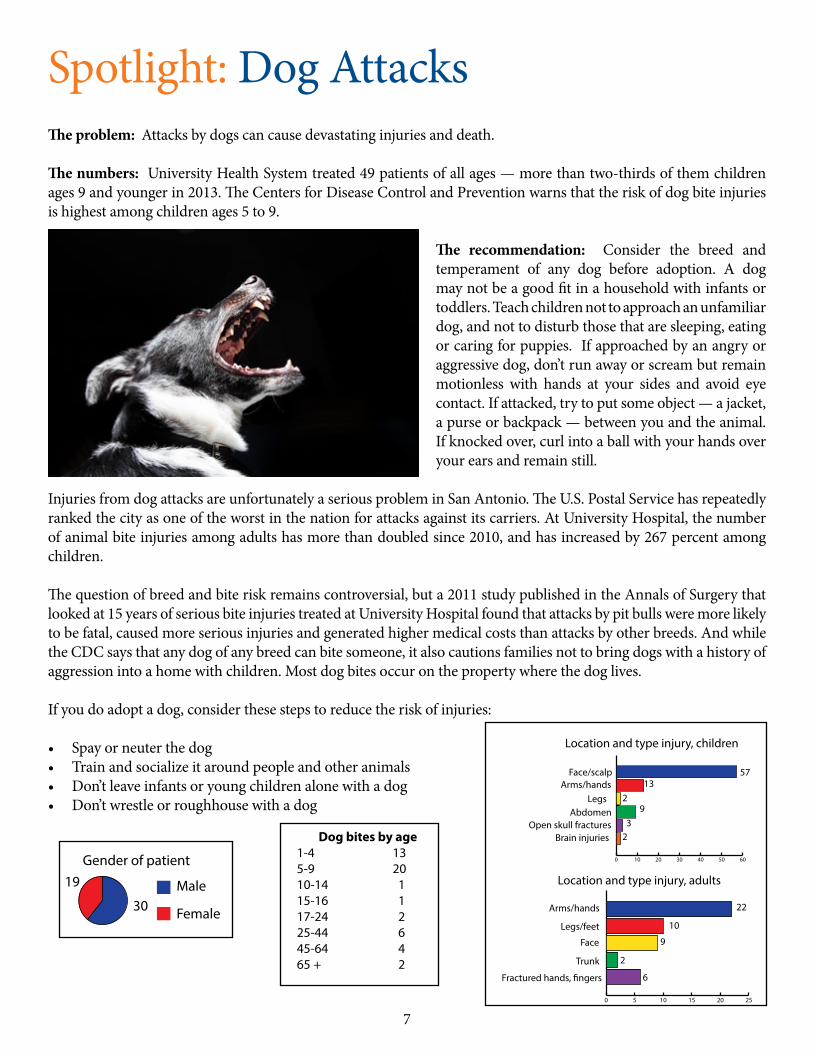
Spotlight: Dog AttacksThe problem: Attacks by dogs can cause devastating injuries and death.
The numbers: University Health System treated 49 patients of all ages — more than two-thirds of them children ages 9 and younger in 2013. The Centers for Disease Control and Prevention warns that the risk of dog bite injuries is highest among children ages 5 to 9.
The recommendation: Consider the breed and temperament of any dog before adoption. A dog may not be a good fit in a household with infants or toddlers. Teach children not to approach an unfamiliar dog, and not to disturb those that are sleeping, eating or caring for puppies. If approached by an angry or aggressive dog, don’t run away or scream but remain motionless with hands at your sides and avoid eye contact. If attacked, try to put some object — a jacket, a purse or backpack — between you and the animal. If knocked over, curl into a ball with your hands over your ears and remain still.
Injuries from dog attacks are unfortunately a serious problem in San Antonio. The U.S. Postal Service has repeatedly ranked the city as one of the worst in the nation for attacks against its carriers. At University Hospital, the number of animal bite injuries among adults has more than doubled since 2010, and has increased by 267 percent among children.
The question of breed and bite risk remains controversial, but a 2011 study published in the Annals of Surgery that looked at 15 years of serious bite injuries treated at University Hospital found that attacks by pit bulls were more likely to be fatal, caused more serious injuries and generated higher medical costs than attacks by other breeds. And while the CDC says that any dog of any breed can bite someone, it also cautions families not to bring dogs with a history of aggression into a home with children. Most dog bites occur on the property where the dog lives.
If you do adopt a dog, consider these steps to reduce the risk of injuries:
• Spay or neuter the dog• Train and socialize it around people and other animals• Don’t leave infants or young children alone with a dog• Don’t wrestle or roughhouse with a dog
Dog bites by age1-4 135-9 2010-14 115-16 117-24 225-44 645-64 465 + 2
Gender of patient19
30Male
Female
5713
92
32
Location and type injury, children
Legs
0 10 20 30 40 50 60
Face/scalpArms/hands
AbdomenOpen skull fractures
Brain injuries
22
6
9
10
2
Location and type injury, adults
Face
Legs/feet
Arms/hands
Trunk
Fractured hands, �ngers
0 5 10 15 20 25
7
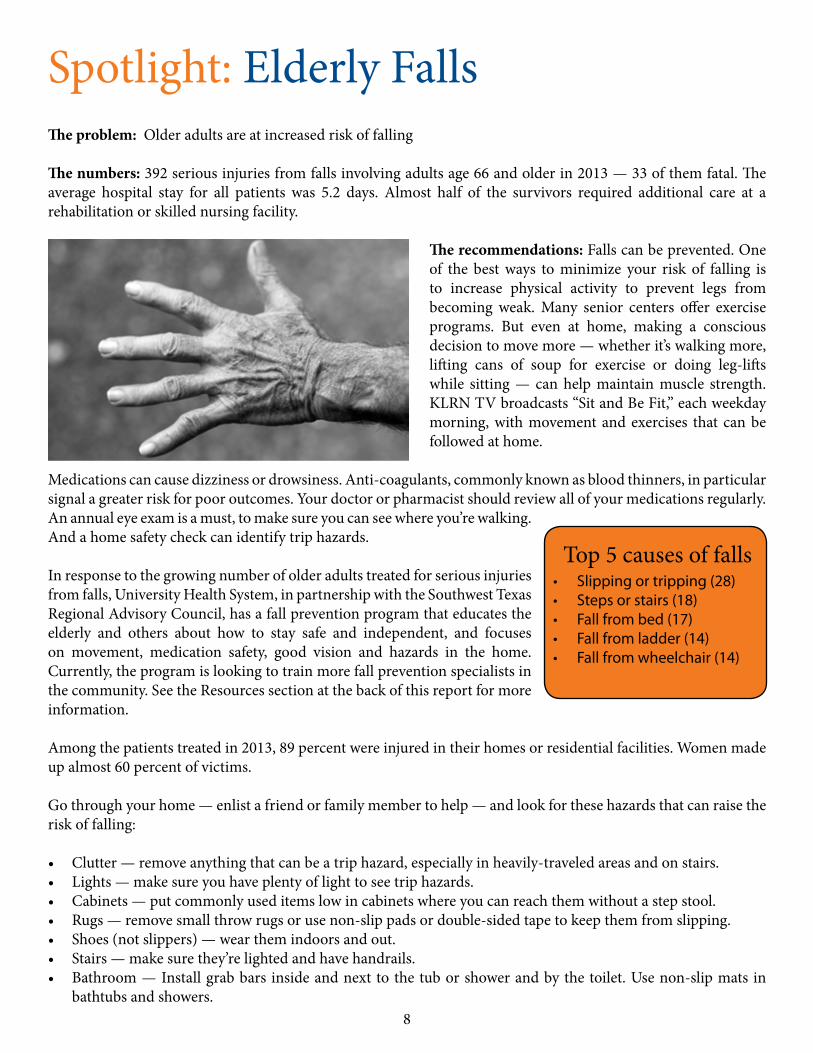
Spotlight: Elderly FallsThe problem: Older adults are at increased risk of falling
The numbers: 392 serious injuries from falls involving adults age 66 and older in 2013 — 33 of them fatal. The average hospital stay for all patients was 5.2 days. Almost half of the survivors required additional care at a rehabilitation or skilled nursing facility.
The recommendations: Falls can be prevented. One of the best ways to minimize your risk of falling is to increase physical activity to prevent legs from becoming weak. Many senior centers offer exercise programs. But even at home, making a conscious decision to move more — whether it’s walking more, lifting cans of soup for exercise or doing leg-lifts while sitting — can help maintain muscle strength. KLRN TV broadcasts “Sit and Be Fit,” each weekday morning, with movement and exercises that can be followed at home.
Medications can cause dizziness or drowsiness. Anti-coagulants, commonly known as blood thinners, in particular signal a greater risk for poor outcomes. Your doctor or pharmacist should review all of your medications regularly. An annual eye exam is a must, to make sure you can see where you’re walking. And a home safety check can identify trip hazards.
In response to the growing number of older adults treated for serious injuries from falls, University Health System, in partnership with the Southwest Texas Regional Advisory Council, has a fall prevention program that educates the elderly and others about how to stay safe and independent, and focuses on movement, medication safety, good vision and hazards in the home. Currently, the program is looking to train more fall prevention specialists in the community. See the Resources section at the back of this report for more information.
Among the patients treated in 2013, 89 percent were injured in their homes or residential facilities. Women made up almost 60 percent of victims.
Go through your home — enlist a friend or family member to help — and look for these hazards that can raise the risk of falling:
• Clutter — remove anything that can be a trip hazard, especially in heavily-traveled areas and on stairs. • Lights — make sure you have plenty of light to see trip hazards. • Cabinets — put commonly used items low in cabinets where you can reach them without a step stool.• Rugs — remove small throw rugs or use non-slip pads or double-sided tape to keep them from slipping. • Shoes (not slippers) — wear them indoors and out. • Stairs — make sure they’re lighted and have handrails.• Bathroom — Install grab bars inside and next to the tub or shower and by the toilet. Use non-slip mats in
bathtubs and showers.
Top 5 causes of falls • Slipping or tripping (28)• Steps or stairs (18)• Fall from bed (17)• Fall from ladder (14)• Fall from wheelchair (14)
8
9
10
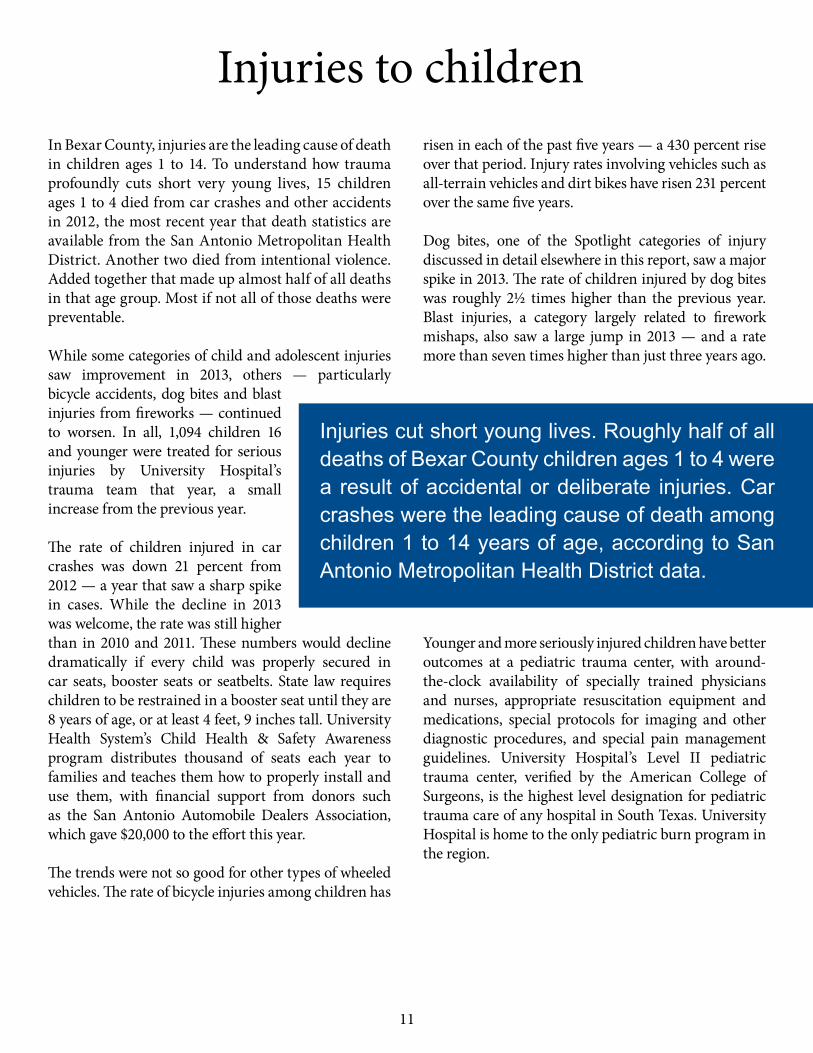
In Bexar County, injuries are the leading cause of death in children ages 1 to 14. To understand how trauma profoundly cuts short very young lives, 15 children ages 1 to 4 died from car crashes and other accidents in 2012, the most recent year that death statistics are available from the San Antonio Metropolitan Health District. Another two died from intentional violence. Added together that made up almost half of all deaths in that age group. Most if not all of those deaths were preventable.
While some categories of child and adolescent injuries saw improvement in 2013, others — particularly bicycle accidents, dog bites and blast injuries from fireworks — continued to worsen. In all, 1,094 children 16 and younger were treated for serious injuries by University Hospital’s trauma team that year, a small increase from the previous year.
The rate of children injured in car crashes was down 21 percent from 2012 — a year that saw a sharp spike in cases. While the decline in 2013 was welcome, the rate was still higher than in 2010 and 2011. These numbers would decline dramatically if every child was properly secured in car seats, booster seats or seatbelts. State law requires children to be restrained in a booster seat until they are 8 years of age, or at least 4 feet, 9 inches tall. University Health System’s Child Health & Safety Awareness program distributes thousand of seats each year to families and teaches them how to properly install and use them, with financial support from donors such as the San Antonio Automobile Dealers Association, which gave $20,000 to the effort this year.
The trends were not so good for other types of wheeled vehicles. The rate of bicycle injuries among children has
risen in each of the past five years — a 430 percent rise over that period. Injury rates involving vehicles such as all-terrain vehicles and dirt bikes have risen 231 percent over the same five years.
Dog bites, one of the Spotlight categories of injury discussed in detail elsewhere in this report, saw a major spike in 2013. The rate of children injured by dog bites was roughly 2½ times higher than the previous year. Blast injuries, a category largely related to firework mishaps, also saw a large jump in 2013 — and a rate more than seven times higher than just three years ago.
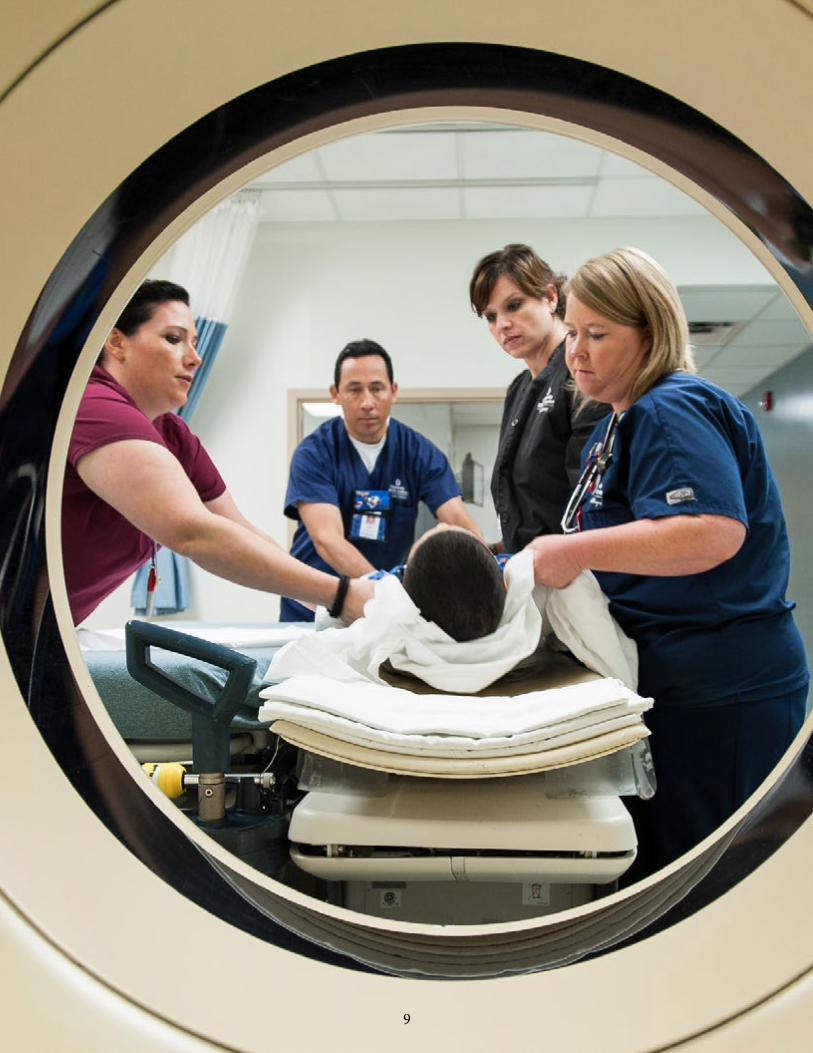
Younger and more seriously injured children have better outcomes at a pediatric trauma center, with around-the-clock availability of specially trained physicians and nurses, appropriate resuscitation equipment and medications, special protocols for imaging and other diagnostic procedures, and special pain management guidelines. University Hospital’s Level II pediatric trauma center, verified by the American College of Surgeons, is the highest level designation for pediatric trauma care of any hospital in South Texas. University Hospital is home to the only pediatric burn program in the region.
Injuries to children
Injuries cut short young lives. Roughly half of all deaths of Bexar County children ages 1 to 4 were a result of accidental or deliberate injuries. Car crashes were the leading cause of death among children 1 to 14 years of age, according to San Antonio Metropolitan Health District data.
11
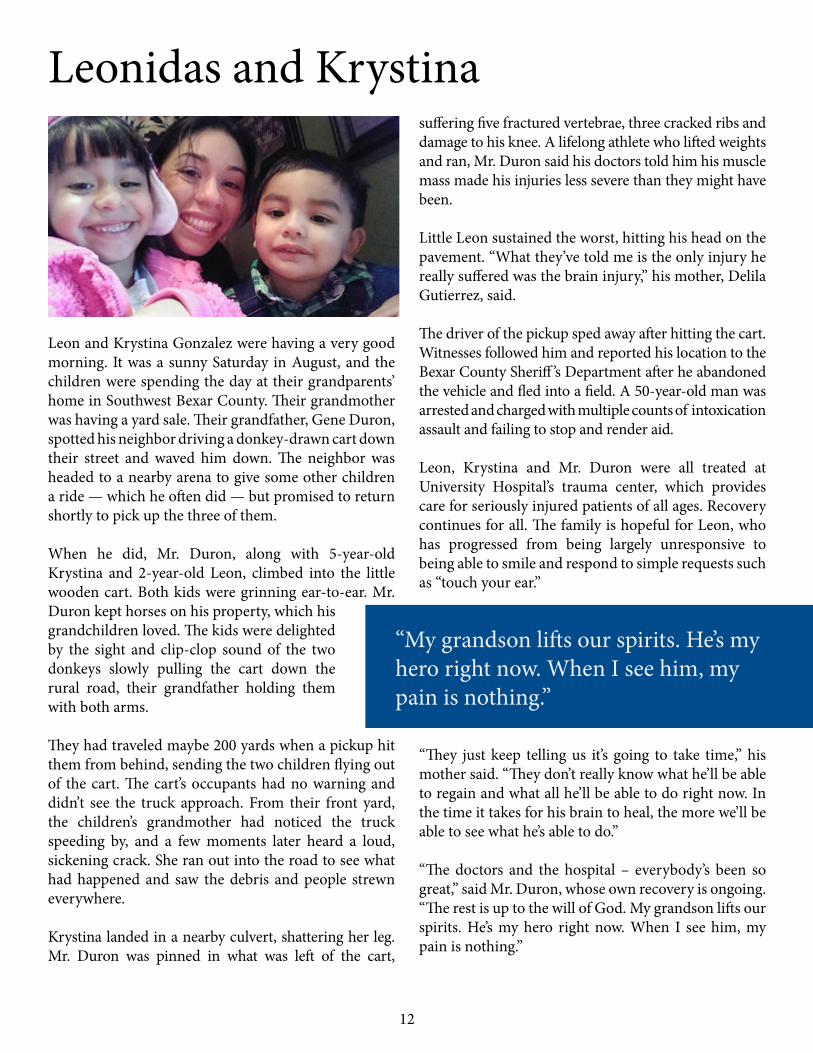
Leonidas and Krystina
Leon and Krystina Gonzalez were having a very good morning. It was a sunny Saturday in August, and the children were spending the day at their grandparents’ home in Southwest Bexar County. Their grandmother was having a yard sale. Their grandfather, Gene Duron, spotted his neighbor driving a donkey-drawn cart down their street and waved him down. The neighbor was headed to a nearby arena to give some other children a ride — which he often did — but promised to return shortly to pick up the three of them.
When he did, Mr. Duron, along with 5-year-old Krystina and 2-year-old Leon, climbed into the little wooden cart. Both kids were grinning ear-to-ear. Mr. Duron kept horses on his property, which his grandchildren loved. The kids were delighted by the sight and clip-clop sound of the two donkeys slowly pulling the cart down the rural road, their grandfather holding them with both arms.
They had traveled maybe 200 yards when a pickup hit them from behind, sending the two children flying out of the cart. The cart’s occupants had no warning and didn’t see the truck approach. From their front yard, the children’s grandmother had noticed the truck speeding by, and a few moments later heard a loud, sickening crack. She ran out into the road to see what had happened and saw the debris and people strewn everywhere.
Krystina landed in a nearby culvert, shattering her leg. Mr. Duron was pinned in what was left of the cart,
suffering five fractured vertebrae, three cracked ribs and damage to his knee. A lifelong athlete who lifted weights and ran, Mr. Duron said his doctors told him his muscle mass made his injuries less severe than they might have been.
Little Leon sustained the worst, hitting his head on the pavement. “What they’ve told me is the only injury he really suffered was the brain injury,” his mother, Delila Gutierrez, said.
The driver of the pickup sped away after hitting the cart. Witnesses followed him and reported his location to the Bexar County Sheriff ’s Department after he abandoned the vehicle and fled into a field. A 50-year-old man was arrested and charged with multiple counts of intoxication assault and failing to stop and render aid.
Leon, Krystina and Mr. Duron were all treated at University Hospital’s trauma center, which provides care for seriously injured patients of all ages. Recovery continues for all. The family is hopeful for Leon, who has progressed from being largely unresponsive to being able to smile and respond to simple requests such as “touch your ear.”
“They just keep telling us it’s going to take time,” his mother said. “They don’t really know what he’ll be able to regain and what all he’ll be able to do right now. In the time it takes for his brain to heal, the more we’ll be able to see what he’s able to do.”
“The doctors and the hospital – everybody’s been so great,” said Mr. Duron, whose own recovery is ongoing. “The rest is up to the will of God. My grandson lifts our spirits. He’s my hero right now. When I see him, my pain is nothing.”
“My grandson lifts our spirits. He’s my hero right now. When I see him, my pain is nothing.”
12
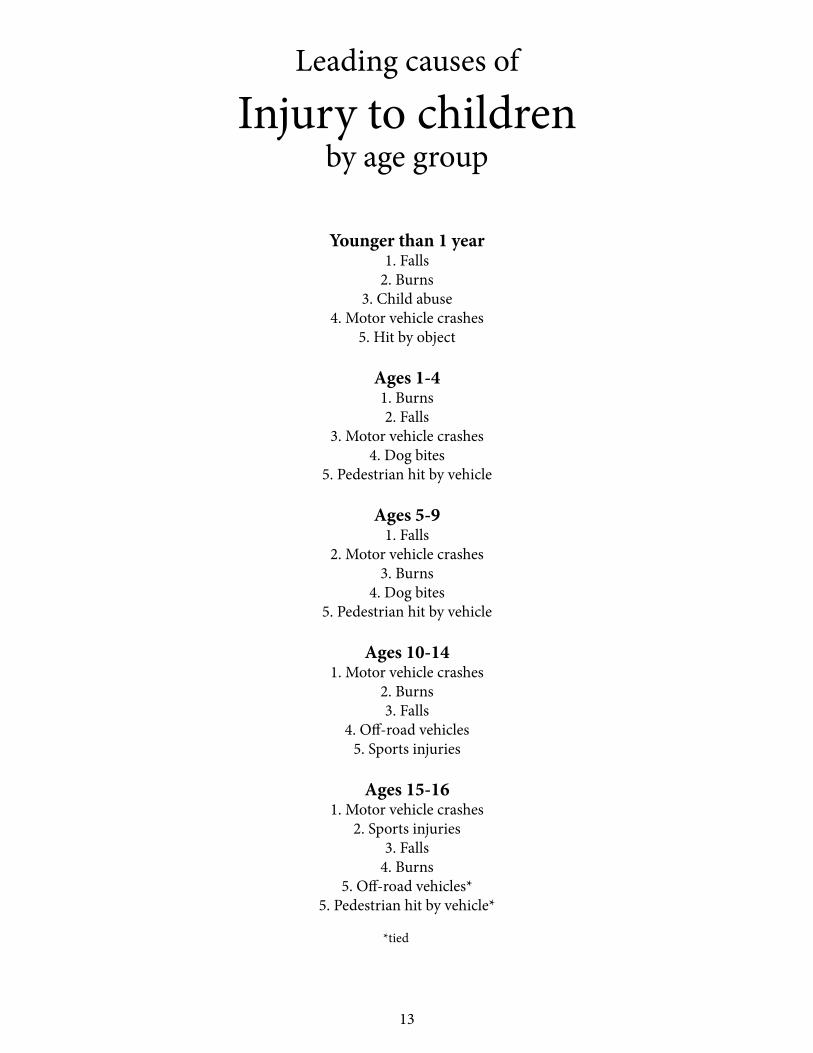
Leading causes of
Injury to childrenby age group
Younger than 1 year1. Falls
2. Burns3. Child abuse
4. Motor vehicle crashes5. Hit by object
Ages 1-41. Burns2. Falls
3. Motor vehicle crashes4. Dog bites
5. Pedestrian hit by vehicle
Ages 5-91. Falls
2. Motor vehicle crashes3. Burns
4. Dog bites5. Pedestrian hit by vehicle
Ages 10-141. Motor vehicle crashes
2. Burns3. Falls
4. Off-road vehicles5. Sports injuries
Ages 15-161. Motor vehicle crashes
2. Sports injuries3. Falls
4. Burns5. Off-road vehicles*
5. Pedestrian hit by vehicle* *tied
13

Inju
ries t
o ch
ildre
n ag
es 0
-16
Rate
per
100
,000
pop
ulati
on, 1
6 an
d yo
unge
r. So
urce
: Tex
as S
tate
Dat
a Ce
nter
pop
ulati
on e
stim
ates
and
pro
jecti
ons f
or 2
2 co
untie
s in
Trau
ma
Regi
on P
.
20
0920
1020
1120
1220
1320
09-1
3CA
USE
NO
. RA
TEN
O.
RATE
NO
. RA
TEN
O.
RATE
NO
.RA
TERA
TE C
HAN
GE
Cras
hes
295
50.7
270
43.8
247
40.0
340
55.0
323
52.1
3%Ca
r or t
ruck
211
36.3
184
29.8
182
29.5
237
38.3
187
30.2
-17%
Mot
orcy
cle
172.
911
1.8
91.
510
1.6
30.
5-8
3%Bi
cycl
e6
1.0
71.
111
1.8
254.
033
5.3
430%
Pede
stria
n46
7.9
619.
940
6.5
589.
447
7.6
-4%
Railw
ay
00
00
00
10.
20
00%
Oth
er v
ehic
les
(boa
ts, A
TV, d
irt b
ike)
152.
67
1.1
50.
89
1.5
538.
623
1%32
6 Non
-veh
icle
Inju
ries
182
31.3
178
28.9
244
39.5
283
45.8
326
52.6
68%
Burn
155
26.6
151
24.5
222
36.0
243
39.3
232
37.4
41%
Anim
al b
ite14
2.4
121.
914
2.3
172.
844
7.1
196%
Stru
ck b
y fa
lling
obj
ect
71.
28
1.3
10.
26
1.0
111.
850
%M
achi
nery
0
00
00
02
0.3
50.
8-
Elec
tric
al sh
ock
00
00
30.
54
0.6
50.
8-
Fire
wor
ks6
1.0
71.
14
0.6
111.
829
4.7
370%
Viol
ence
366.
224
3.9
274.
436
5.8
294.
7-2
4%Sh
ootin
g10
1.7
20.
36
1.0
91.
59
1.5
-12%
Stab
bing
or C
utting
50.
94
0.6
30.
512
1.9
50.
8-1
1%As
saul
t21
3.6
182.
918
2.9
152.
415
2.4
-33%
Falls
23
540
.416
526
.719
731
.922
536
.421
634
.9-1
4%
Oth
er12
521
.511
618
.814
223
.016
727
.020
032
.350
%
TOTA
L IN
JURI
ES87
315
0.0
753
122.
185
713
8.9
1,05
117
0.1
1,09
417
6.6
18%
14
051015202530354045
2009
2010
2011
2012
2013
Car &
truc
k cr
ashe
s
Bicy
cle
cras
hes
Burn
s
Shoo
tings
Falls
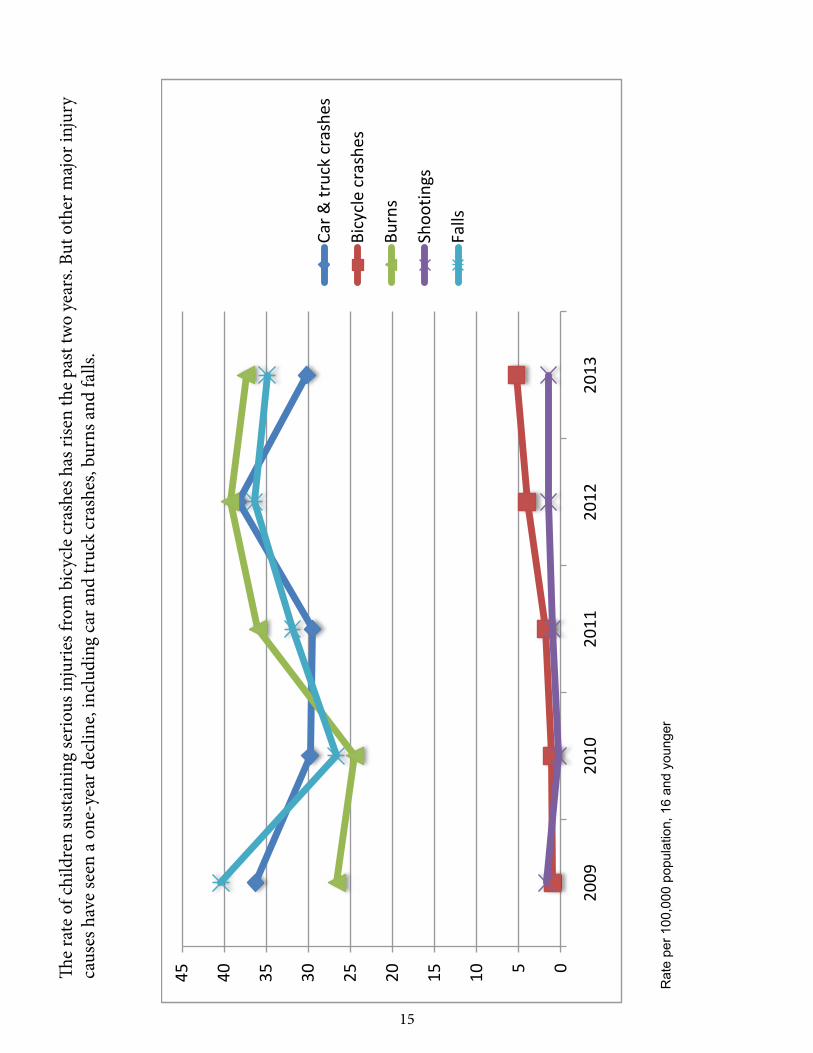
The
rate
of c
hild
ren
sust
aini
ng se
rious
inju
ries f
rom
bic
ycle
cras
hes h
as ri
sen
the
past
two
year
s. Bu
t oth
er m
ajor
inju
ry
caus
es h
ave
seen
a o
ne-y
ear d
eclin
e, in
clud
ing
car a
nd tr
uck
cras
hes,
burn
s and
falls
.
Rat
e pe
r 100
,000
pop
ulat
ion,
16
and
youn
ger
15

Car and truck crashes are one of the biggest causes of injury to children, bringing 187 patients ages 0-16 to University Hospital’s Pediatric Trauma Center in 2013. The proper use of car seats and seat belts, along with safer and sober driving, would have drastically reduced the number of these injuries.
98%
2%
Fatal
Non-fatal
Child car and truck crash injuries by month
JanuaryFebruaryMarch AprilMayJune
JulyAugustSeptemberOctoberNovemberDecember
9101914 718
222216161717
Known hazards
Infant1-45-910-1415-16Total
437515342187
Patients by age
0
5
10
15
20
25
30
Infant 1-4 5-9 10-14 15-16
%
2%
20%
27% 28%23%
Age of patients
No protective device (69) Protective device (96)
Major injury Minor injury
39 30 43 53
*Of 165 injuries in which presence of protective device (car seat, booster, seatbelt) was known.
0
10
20
30
40
50
60
0
10
20
30
40
50
60
57% 43% 45% 55%
Higher risk of serious injuries when no protective device* is used. Serious injuries that occur despite the use of car seats is often the result of incorrect installation. One recent study found 93 percent of infant car seats had at least one major error in how they were installed.
16
0
10
20
30
40
50
60 15-17
10-14
5-9
1-4
Infant
Age of patient
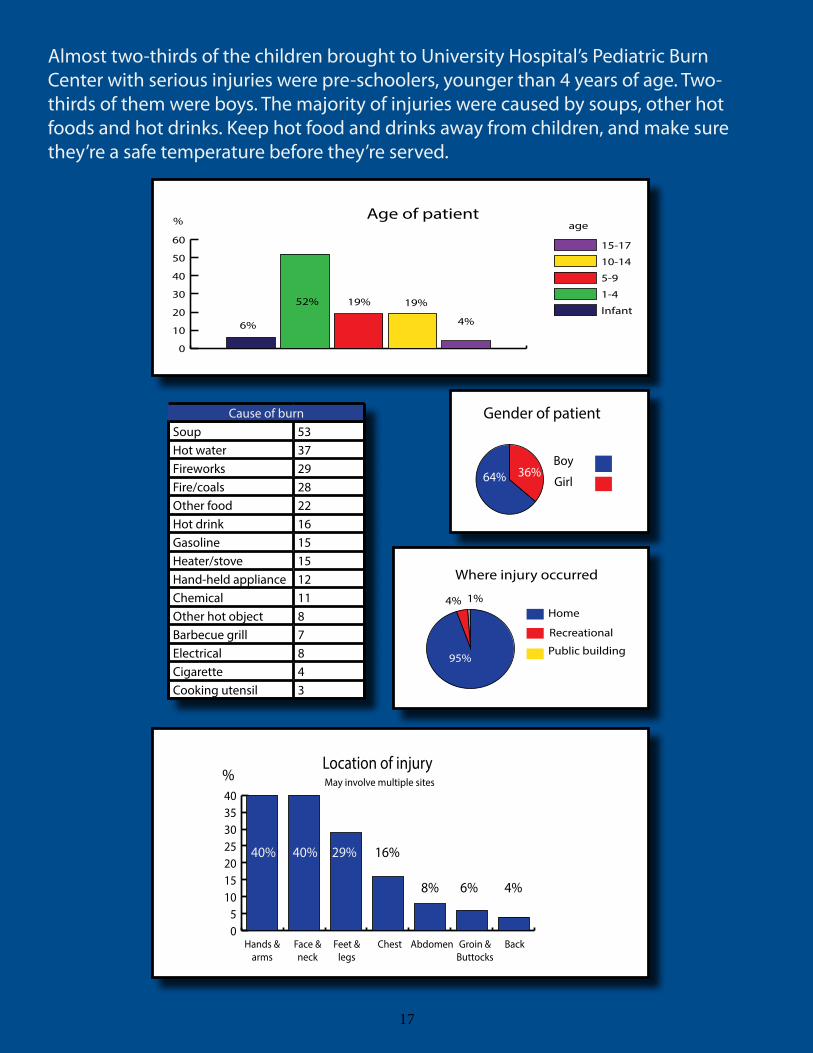
6%
52% 19% 19%
4%
% age
05
10152025303540
%
40% 40% 29% 16%
8% 6% 4%
Location of injury May involve multiple sites
Hands &arms
Face &neck
Feet &legs
Chest Abdomen Groin &Buttocks
Back
Gender of patient
64% 36%Boy
Girl
95%
4% 1%
Where injury occurred
Home
Public building
Recreational
Cause of burnSoup 53Hot water 37Fireworks 29Fire/coals 28Other food 22Hot drink 16Gasoline 15Heater/stove 15Hand-held appliance 12Chemical 11Other hot object 8Barbecue grill 7Electrical 8Cigarette 4Cooking utensil 3
Almost two-thirds of the children brought to University Hospital’s Pediatric Burn Center with serious injuries were pre-schoolers, younger than 4 years of age. Two-thirds of them were boys. The majority of injuries were caused by soups, other hot foods and hot drinks. Keep hot food and drinks away from children, and make sure they’re a safe temperature before they’re served.
17

Bicycle injuries among kids are on the rise, with 33 brought to University Hospital last year. Of the 25 who were not involved in collisions with motor vehicles, only two were known to be wearing helmets. These injuries weren’t scrapes and bruises. The average length of stay in the hospital for these kids was six days. More than half were between 10 and 14 years of age. Keep your kids safe by making sure they wear a properly-fitting helmet, that they pay attention while riding and understand the rules of the road. And if you’re behind the wheel of the car, keep your eyes open for cyclists and give them plenty of room.
Age of bike rider injured
1-4
5-9
10-14
15-16
1
8
14
2
7
18
Boys
Girls
Gender of patient
Where injury occurred
Neighborhood
Street
Recreation area
13
6
6
18
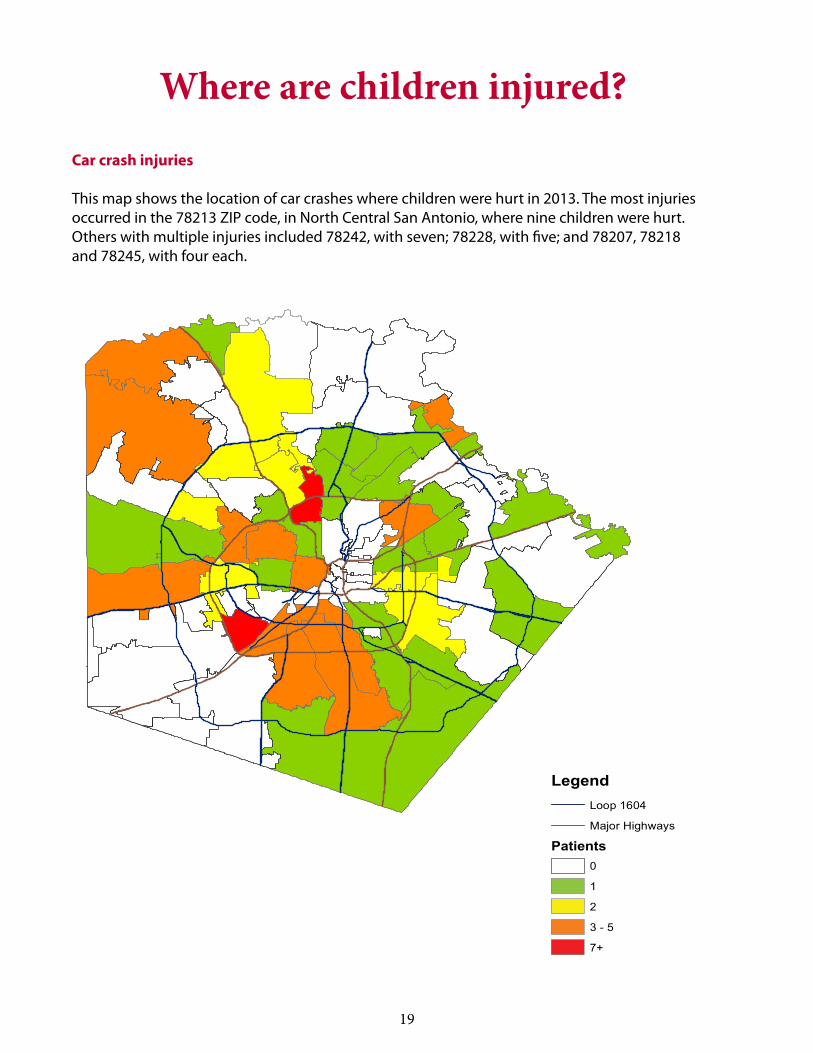
Car crash injuries
This map shows the location of car crashes where children were hurt in 2013. The most injuries occurred in the 78213 ZIP code, in North Central San Antonio, where nine children were hurt. Others with multiple injuries included 78242, with seven; 78228, with five; and 78207, 78218 and 78245, with four each.
Where are children injured?
LegendLoop 1604
Major Highways
Patients0
1
2
3 - 5
7+
LegendLoop 1604
Major Highways
Patients0
1
2
3 - 5
7+
19

Injuries to adultsInjuries are by far the leading cause of death among Bexar County adults ages 25 to 34, according to the San Antonio Metropolitan Health District. In fact, non-motor vehicle incidents (including falls and on-the-job injuries) are the No. 1 cause, motor vehicle crashes the No. 3 cause and homicide the No. 4 cause of death in
that age group. These are young adults in the prime of their productive working years, and these preventable deaths not only represent a tragic loss for their families and friends, they also represent a significant loss of potential and productivity for society as a whole.
A total of 3,246 adults ages 17 and older were treated for serious injuries at University Hospital’s Level 1 trauma center last year. The number of adult injury patients has risen in each of the past five years, and was up from 3,166 the previous year. Taking into consideration population growth, the rate of adult injuries rose 23 percent over that five-year period, and is 3 percent higher than in 2012.
At University Hospital, almost all categories of serious injuries saw higher rates over the five-year period ending in 2013. The exception was blast injuries, mainly from fireworks.
While car and truck crashes saw a one-year, 19 percent decline from 2012 to 2013, over five years the rate is 11 percent higher. As with children, 2012 saw a major spike in car crash injuries.
Other types of vehicle crashes are also worth noting. The rate of injuries from all-terrain vehicles, boats and other types of motorized vehicles rose 200 percent from 2012 to 2013.
The rate of adult bicycle injuries has doubled over the past two years, and has risen 633 percent since 2009. The reason may be tied to the rise in popularity of bike riding and bike lanes, leading to a growing conflict with motorists sharing the road with them. If drivers of cars and trucks would put down their cell phones while behind the wheel, and if cyclists wore proper protective gear and followed the rules of the road, this skyrocketing increase in injuries might start to fall.
And speaking of falling, two other injury categories involving different kinds of falls have also been on the rise. The rate of adult falls — the subject of one of this year’s Spotlight categories elsewhere in this report — are up 44 percent from 2009, and up 19 percent from the previous year. The rate of injuries from falling objects — tree limbs, industrial accidents — have risen fairly steadily over the past five years, up 250 percent.
Trends were mixed for injuries from violence treated at University Health System. The rate of shootings declined by 15 percent from 2012 to 2013, while the rate of injuries from stabbings and assaults were both up by 10 percent and 30 percent respectively over the same period.
20
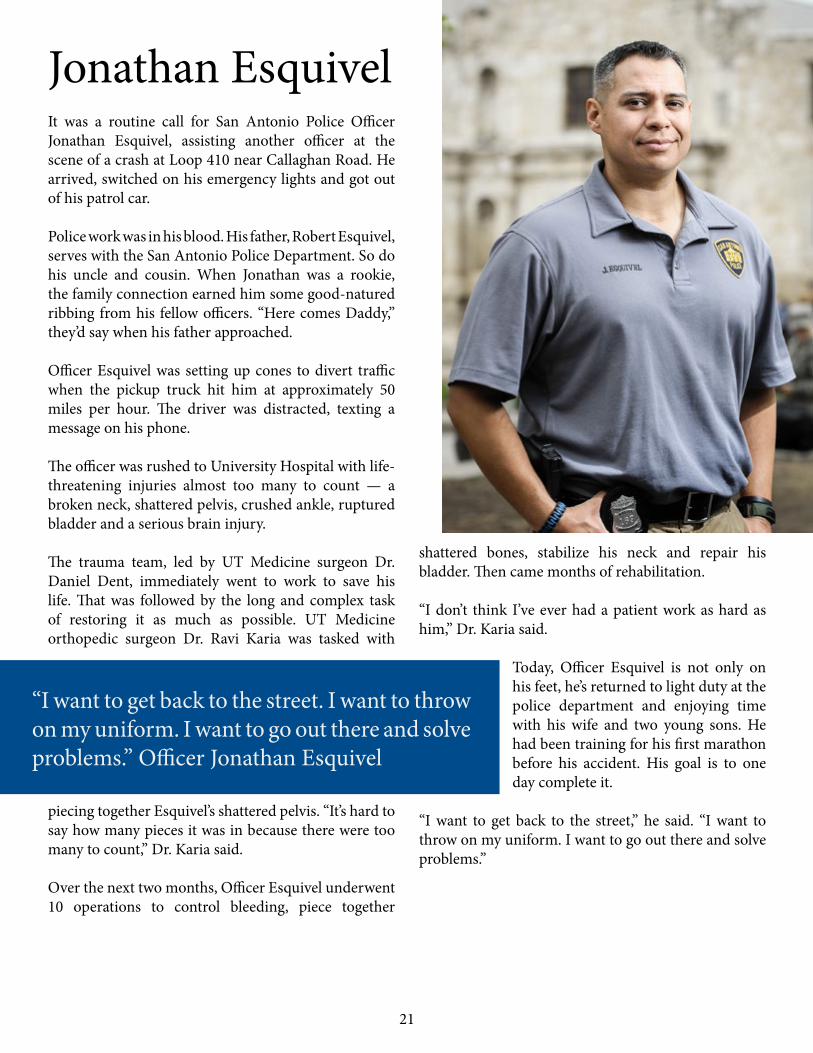
It was a routine call for San Antonio Police Officer Jonathan Esquivel, assisting another officer at the scene of a crash at Loop 410 near Callaghan Road. He arrived, switched on his emergency lights and got out of his patrol car.
Police work was in his blood. His father, Robert Esquivel, serves with the San Antonio Police Department. So do his uncle and cousin. When Jonathan was a rookie, the family connection earned him some good-natured ribbing from his fellow officers. “Here comes Daddy,” they’d say when his father approached.
Officer Esquivel was setting up cones to divert traffic when the pickup truck hit him at approximately 50 miles per hour. The driver was distracted, texting a message on his phone.
The officer was rushed to University Hospital with life-threatening injuries almost too many to count — a broken neck, shattered pelvis, crushed ankle, ruptured bladder and a serious brain injury.
The trauma team, led by UT Medicine surgeon Dr. Daniel Dent, immediately went to work to save his life. That was followed by the long and complex task of restoring it as much as possible. UT Medicine orthopedic surgeon Dr. Ravi Karia was tasked with
piecing together Esquivel’s shattered pelvis. “It’s hard to say how many pieces it was in because there were too many to count,” Dr. Karia said.
Over the next two months, Officer Esquivel underwent 10 operations to control bleeding, piece together
shattered bones, stabilize his neck and repair his bladder. Then came months of rehabilitation.
“I don’t think I’ve ever had a patient work as hard as him,” Dr. Karia said.
Today, Officer Esquivel is not only on his feet, he’s returned to light duty at the police department and enjoying time with his wife and two young sons. He had been training for his first marathon before his accident. His goal is to one day complete it.
“I want to get back to the street,” he said. “I want to throw on my uniform. I want to go out there and solve problems.”
Jonathan Esquivel
“I want to get back to the street. I want to throw on my uniform. I want to go out there and solve problems.” Officer Jonathan Esquivel
21
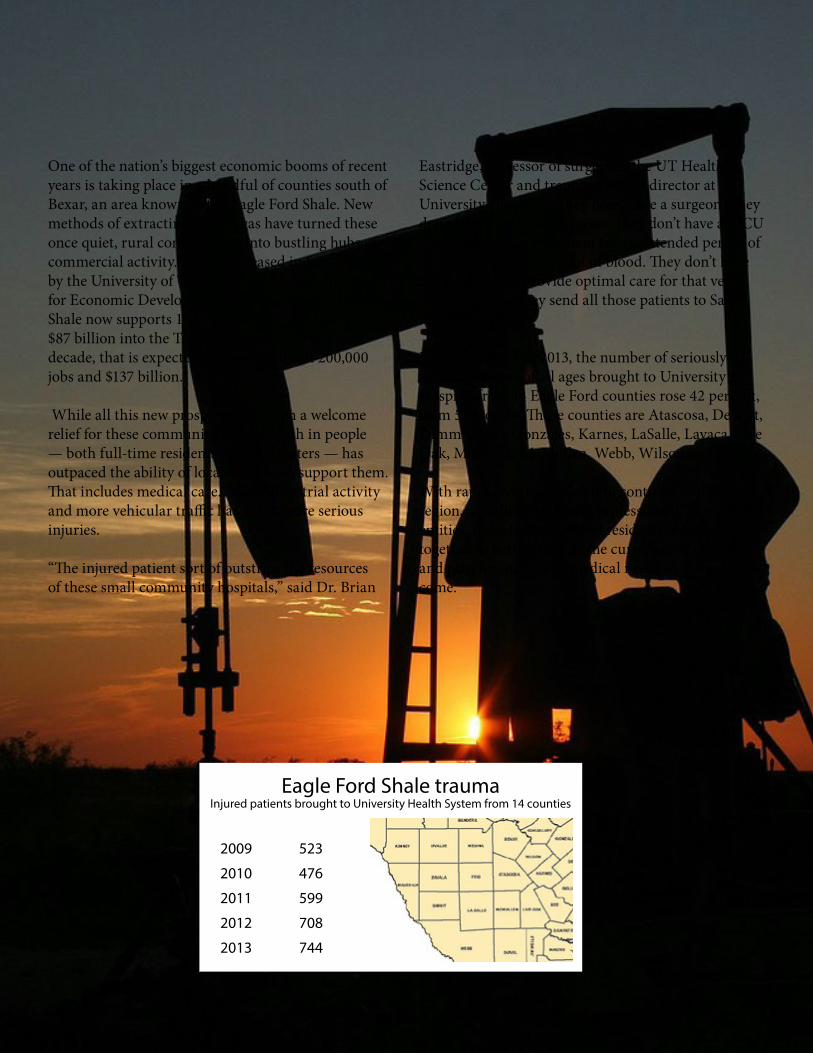
Eagle Ford Shale FormationOne of the nation’s biggest economic booms of recent years is taking place in a handful of counties south of Bexar, an area known as the Eagle Ford Shale. New methods of extracting oil and gas have turned these once quiet, rural communities into bustling hubs of commercial activity. A study released in September by the University of Texas at San Antonio’s Institute for Economic Development estimates the Eagle Ford Shale now supports 155,000 full-time jobs and pumps $87 billion into the Texas economy. Over the next decade, that is expected to grow to almost 200,000 jobs and $137 billion.
While all this new prosperity has been a welcome relief for these communities, the growth in people — both full-time residents and commuters — has outpaced the ability of local services to support them. That includes medical care. More industrial activity and more vehicular traffic has led to more serious injuries.
“The injured patient sort of outstrips the resources of these small community hospitals,” said Dr. Brian
Eastridge, professor of surgery at the UT Health Science Center and trauma medical director at University Hospital. “They don’t have a surgeon. They don’t have an on-call surgeon. They don’t have an ICU to take care of a sick patient for an extended period of time. They don’t have a lot of blood. They don’t have the resources to provide optimal care for that very sick patient. So they send all those patients to San Antonio.”
Between 2009 and 2013, the number of seriously injured patients of all ages brought to University Hospital from 14 Eagle Ford counties rose 42 percent, from 523 to 744. Those counties are Atascosa, DeWitt, Dimmit, Frio, Gonzales, Karnes, LaSalle, Lavaca, Live Oak, Maverick, McMullen, Webb, Wilson and Zavala.
With rapid growth expected to continue in the region, a coalition of health professionals, government entities, industry leaders and residents must work together to better manage the current level of injuries, and plan for increasing medical needs in the years to come.
Eagle Ford Shale traumaInjured patients brought to University Health System from 14 counties
2009 523
2010 476
2011 599
2012 708
2013 744
22
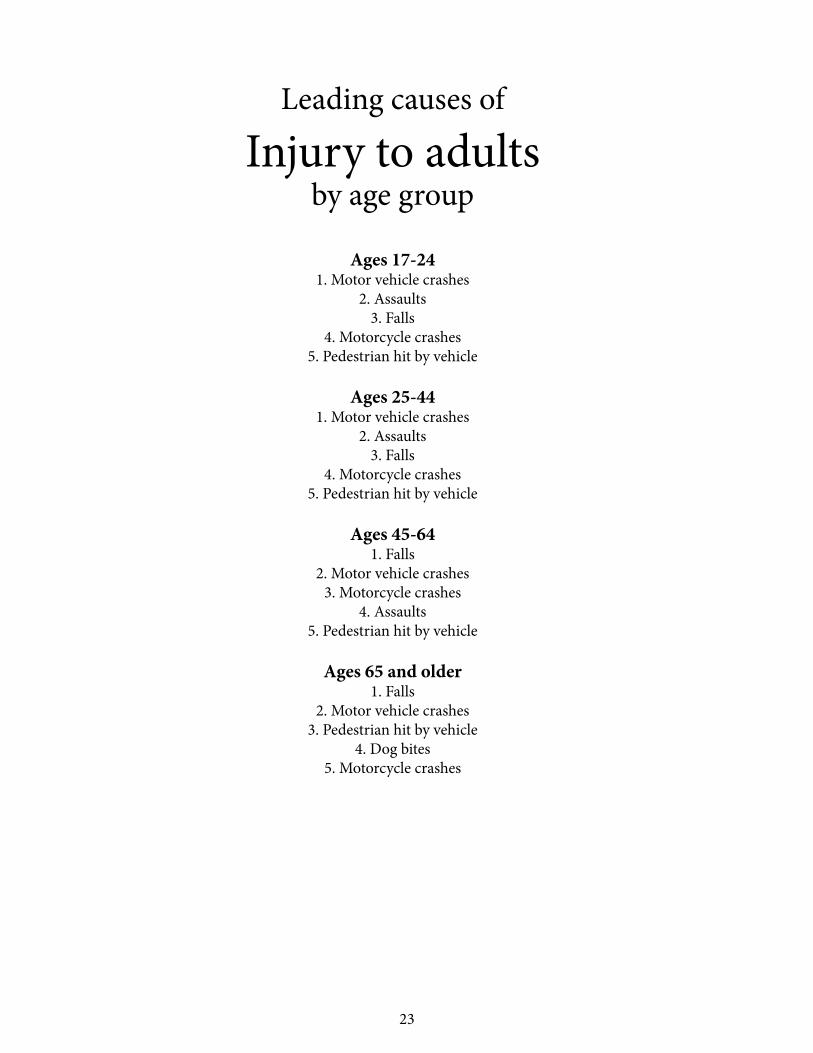
Leading causes of
Injury to adultsby age group
Ages 17-241. Motor vehicle crashes
2. Assaults3. Falls
4. Motorcycle crashes5. Pedestrian hit by vehicle
Ages 25-441. Motor vehicle crashes
2. Assaults3. Falls
4. Motorcycle crashes5. Pedestrian hit by vehicle
Ages 45-641. Falls
2. Motor vehicle crashes3. Motorcycle crashes
4. Assaults5. Pedestrian hit by vehicle
Ages 65 and older1. Falls
2. Motor vehicle crashes3. Pedestrian hit by vehicle
4. Dog bites5. Motorcycle crashes
23

Inju
ries t
o ad
ults
17 a
nd o
lder
20
0920
1020
1120
1220
1320
09-1
3CA
USE
NO
. RA
TEN
O.
RATE
NO
. RA
TEN
O.
RATE
NO
.RA
TERA
TE C
HAN
GE
Cras
hes
1,12
963
.51,
236
68.0
1,34
973
.31,
672
89.9
1,43
476
.320
%Ca
r or t
ruck
801
45.1
830
45.6
931
50.6
1,14
661
.694
350
.211
%M
otor
cycl
e20
611
.620
811
.423
612
.829
816
.023
612
.69%
Bicy
cle
60.
331
1.7
201.
133
1.8
422.
263
3%Pe
dest
rian
104
5.9
153
8.4
142
7.7
175
9.4
159
8.5
44%
Railw
ay
10.
10
04
0.2
40.
23
0.2
100%
Oth
er v
ehic
les
(boa
ts, A
TV, d
irt b
ike)
110.
614
0.8
160.
916
0.9
512.
735
0%
Non
-veh
icle
inju
ries
100
5.6
794.
396
5.2
121
6.5
160
8.5
52%
Burn
100.
611
0.6
191.
018
1.0
231.
210
0%An
imal
bite
341.
918
1.0
261.
435
1.9
382.
05%
Stru
ck b
y fa
lling
obj
ect
70.
411
0.6
140.
817
0.9
271.
425
0%M
achi
nery
41
2.3
351.
935
1.9
442.
466
3.5
52%
Elec
tric
al sh
ock
10.
10
01
0.1
20.
15
0.3
200%
Blas
t7
0.4
40.
21
0.1
50.
32
0.1
-75%
407 Vi
olen
ce28
215
.928
215
.534
018
.535
719
.240
721
.736
%Sh
ootin
g59
3.3
814.
597
5.3
965.
282
4.4
33%
Stab
bing
or C
utting
814.
678
4.3
945.
110
95.
912
36.
541
%As
saul
t14
28.
012
36.
814
98.
115
28.
220
210
.734
%91
7 Falls
60
033
.865
836
.260
632
.976
341
.091
748
.844
%
Oth
er39
122
.034
919
.239
321
.425
313
.632
817
.5-2
0%TO
TAL
INJU
RIES
2,50
214
0.8
2,60
414
3.2
2,78
415
1.3
3,16
617
0.2
3,24
617
2.7
23%
Rate
per
100
,000
pop
ulati
on, 1
7 an
d ol
der.
Sour
ce: T
exas
Sta
te D
ata
Cent
er p
opul
ation
esti
mat
es a
nd p
roje
ction
s for
22
coun
ties i
n Tr
aum
a Re
gion
P.
24
010203040506070
2009
2010
2011
2012
2013
Car &
truc
k cr
ashe
s
Mot
orcy
cle
cras
hes
Bicy
cle
cras
hes
Pede
stri
an
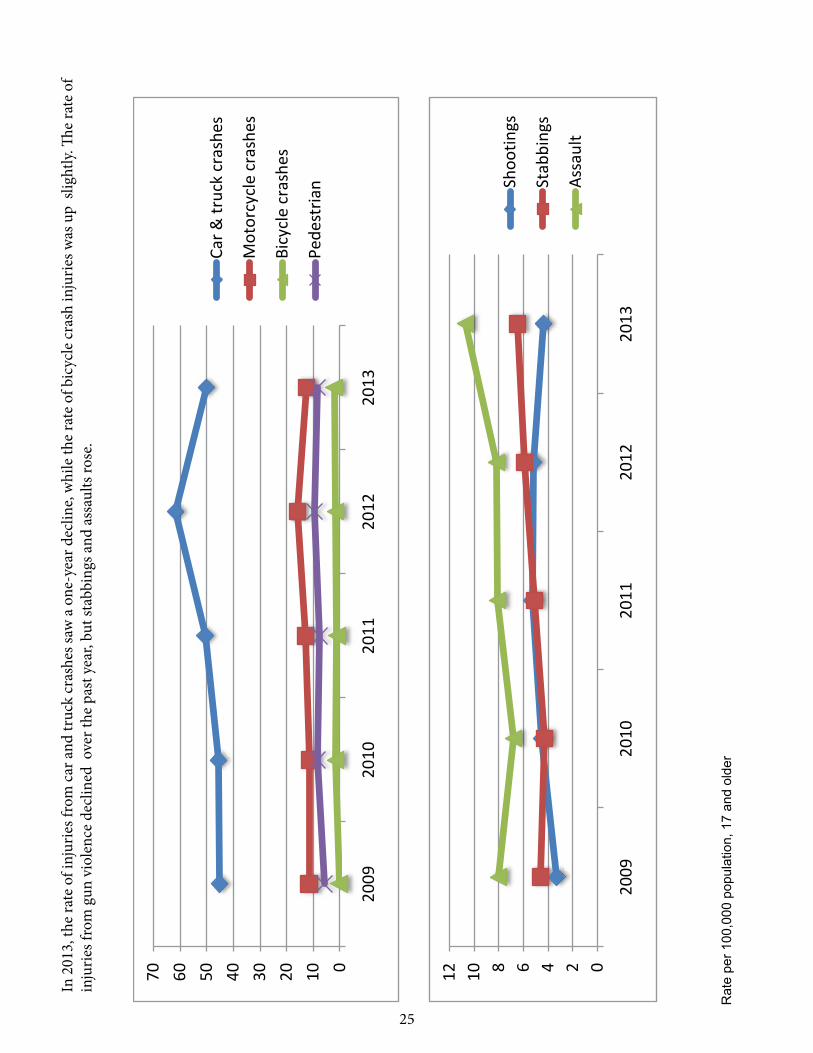
In 2
013,
the
rate
of i
njur
ies f
rom
car
and
truc
k cr
ashe
s saw
a o
ne-y
ear d
eclin
e, w
hile
the
rate
of b
icyc
le cr
ash
inju
ries w
as u
p sl
ight
ly. Th
e ra
te o
f in
jurie
s fro
m g
un v
iole
nce
decl
ined
ove
r the
pas
t yea
r, bu
t sta
bbin
gs a
nd a
ssau
lts ro
se.
Rat
e pe
r 100
,000
pop
ulat
ion,
17
and
olde
r
024681012
2009
2010
2011
2012
2013
Shoo
tings
Stab
bing
s
Ass
ault
25

Injuries from car and truck crashes saw a one-year, 19 percent decline among patients treated at University Hospital in 2013. However, that rate is 11 percent higher than it was five years ago. Motor vehicle crashes make up the single largest category of adult injuries, with 943 patients seen last year.
Car crashes
Outcomes (943)
156
745
42Sent home
Death
Post-hospital care
Position in vehicle
Driver
Passenger71%
29%
17-24
25-44
45-64
64 +
Age of patient
30%
35%
23%
12%
Known hazards in car and truck crashes
No protective device (297)Protective device (524)
Major injury Minor injury
260 303 221
*Of 821 injuries in which the presence of device (seatbelts) was known.
0
20
40
60
80
100
0
10
20
30
40
50
60
88% 58% 42%
Higher risk of serious injuries when no protective device* is used.
12%
0 5 10 15 20
19%
7%
10%
Alcohol Drugs Both
Alcohol and Drugs
Motorcycle crashesOutcomes (236)
41
184
11Sent home
Death
Post-hospital care
Position on vehicle
Driver
Passenger92%
8% 17-24
25-44
45-64
64 +
Age of patient
18%
36%40%
6%
Protective gear
303221
Of 220 injuries in which the presence of protective device (helmet) was known.
73% 76%
0
10
20
30
40
50
helmet only protective clothing only
both helmet and protective
clothing
no protective gear
46% 47%
2% 5%0
5
10
15
20
Alcohol and drugs
alcohol drugs both
18% 11% 7%
involved in crash injuries
26
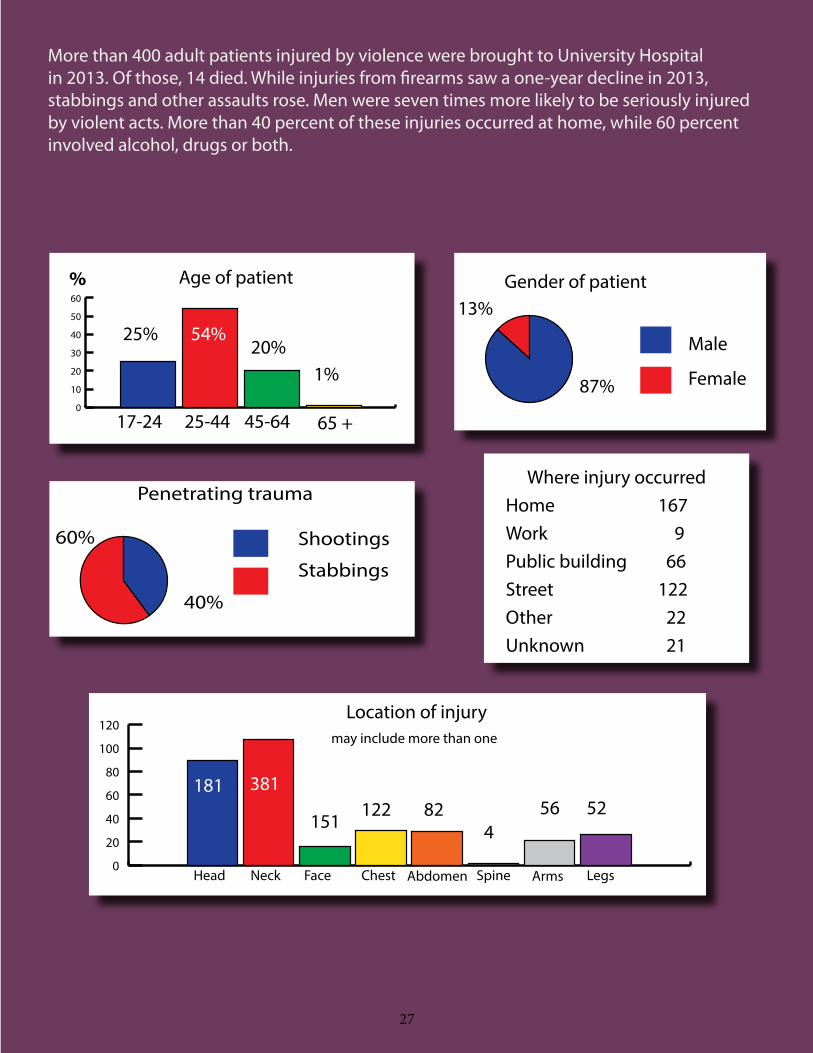
More than 400 adult patients injured by violence were brought to University Hospital in 2013. Of those, 14 died. While injuries from firearms saw a one-year decline in 2013, stabbings and other assaults rose. Men were seven times more likely to be seriously injured by violent acts. More than 40 percent of these injuries occurred at home, while 60 percent involved alcohol, drugs or both.
0
10
20
30
40
50
60
25% 54%
1%20%
17-24 25-44 45-64 65 +
Age of patient% Gender of patient
87%
13%
Male
Female
60%
40%
Shootings
Stabbings
Penetrating trauma
0
20
40
60
80
100
120Location of injury
may include more than one
181 381
151122 82
456 52
Where injury occurredHome 167Work 9Public building 66Street 122Other 22Unknown 21
Head Neck Face Chest Abdomen Spine Arms Legs
27
28
LegendMajor Highways
Loop 1604
Patients0
1 - 2
3 - 6
7 - 12
12 - 20
21 +
Injuries from violence
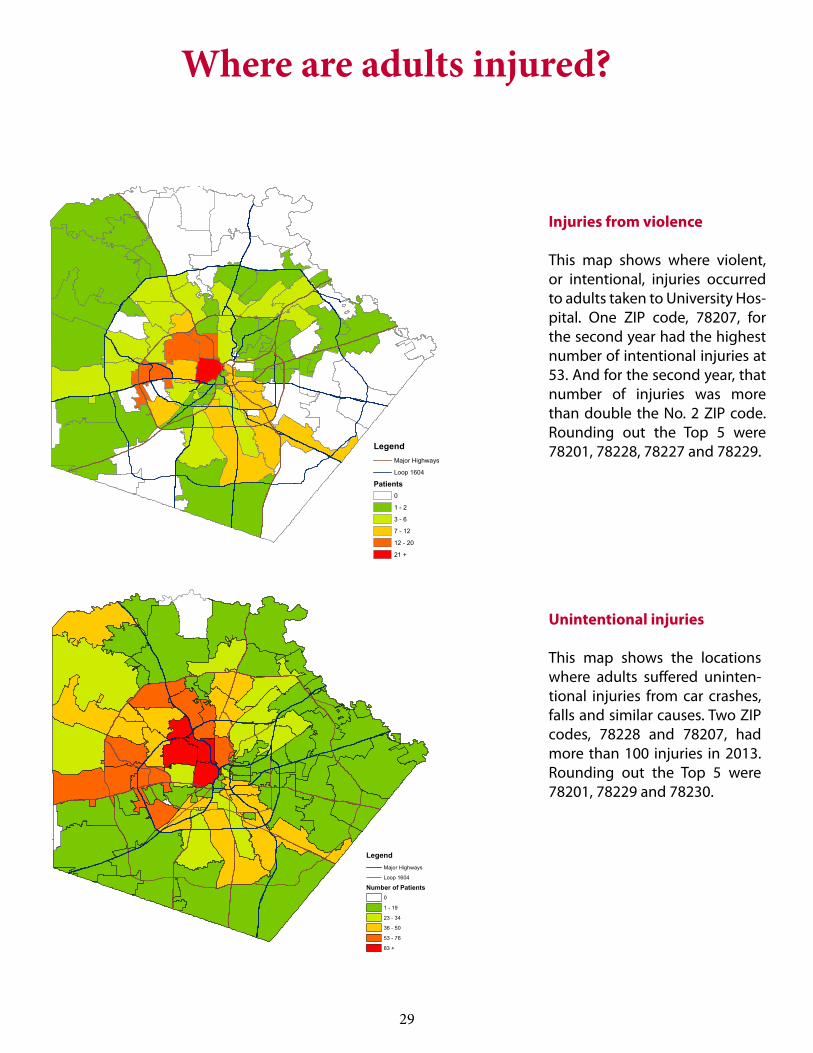
This map shows where violent, or intentional, injuries occurred to adults taken to University Hos-pital. One ZIP code, 78207, for the second year had the highest number of intentional injuries at 53. And for the second year, that number of injuries was more than double the No. 2 ZIP code. Rounding out the Top 5 were 78201, 78228, 78227 and 78229.
LegendMajor Highways
Loop 1604
Number of Patients0
1 - 19
23 - 34
36 - 50
53 - 76
83 +
Unintentional injuries
This map shows the locations where adults suffered uninten-tional injuries from car crashes, falls and similar causes. Two ZIP codes, 78228 and 78207, had more than 100 injuries in 2013. Rounding out the Top 5 were 78201, 78229 and 78230.
Where are adults injured?
29
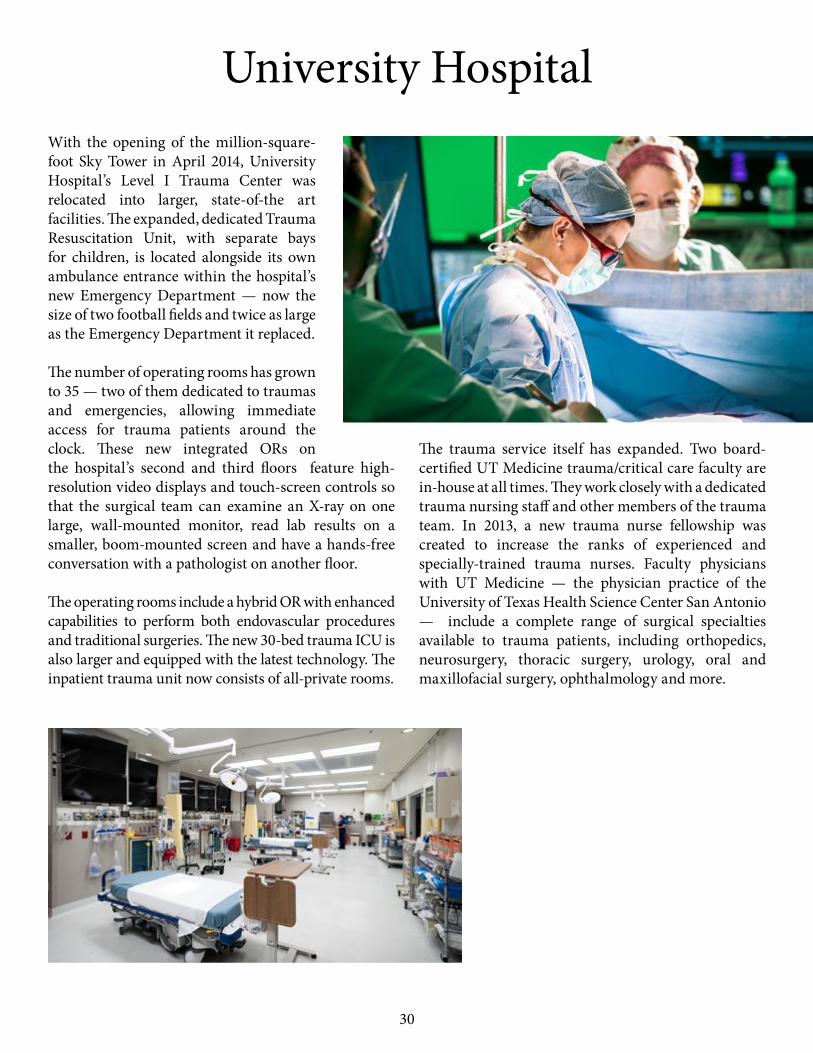
University HospitalWith the opening of the million-square-foot Sky Tower in April 2014, University Hospital’s Level I Trauma Center was relocated into larger, state-of-the art facilities. The expanded, dedicated Trauma Resuscitation Unit, with separate bays for children, is located alongside its own ambulance entrance within the hospital’s new Emergency Department — now the size of two football fields and twice as large as the Emergency Department it replaced.
The number of operating rooms has grown to 35 — two of them dedicated to traumas and emergencies, allowing immediate access for trauma patients around the clock. These new integrated ORs on the hospital’s second and third floors feature high-resolution video displays and touch-screen controls so that the surgical team can examine an X-ray on one large, wall-mounted monitor, read lab results on a smaller, boom-mounted screen and have a hands-free conversation with a pathologist on another floor.
The operating rooms include a hybrid OR with enhanced capabilities to perform both endovascular procedures and traditional surgeries. The new 30-bed trauma ICU is also larger and equipped with the latest technology. The inpatient trauma unit now consists of all-private rooms.
The trauma service itself has expanded. Two board-certified UT Medicine trauma/critical care faculty are in-house at all times. They work closely with a dedicated trauma nursing staff and other members of the trauma team. In 2013, a new trauma nurse fellowship was created to increase the ranks of experienced and specially-trained trauma nurses. Faculty physicians with UT Medicine — the physician practice of the University of Texas Health Science Center San Antonio — include a complete range of surgical specialties available to trauma patients, including orthopedics, neurosurgery, thoracic surgery, urology, oral and maxillofacial surgery, ophthalmology and more.
30

A System of Trauma CareWhen someone is seriously injured in Texas, an organized system exists to get them to a hospital with the skills and capability to care for that level of injury as quickly as possible. Bexar County is part of Trauma Service Area-P, which includes 53 hospitals and 71 EMS agencies within a 22-county region. The Southwest Texas Regional Advisory Council, or STRAC, is the leadership organization for the region. Trauma centers are designated by the Texas Department of State Health Services according to their ability to treat injured patients. University Hospital serves as a Level 1 trauma center, which is the highest level of trauma center. San Antonio Military Medical Center also provides Level 1 trauma care for the region. University Hospital is also the highest designated pediatric trauma center in all of South Texas, and operates the only pediatric burn center in the region.
One of the most critical tools in ensuring that patients get to an appropriate trauma center quickly is MEDCOM, a San Antonio-based communications center that rapidly processes over 300 critical trauma transfer requests each month. MEDCOM is staffed around the clock to connect doctors at regional hospitals by telephone with a trauma surgeon in San Antonio —
usually in less than 10 minutes. MEDCOM also serves as the communications hub for regional mass casualty and disaster response, allowing EMS, air medical and hospital personnel to coordinate their activities.
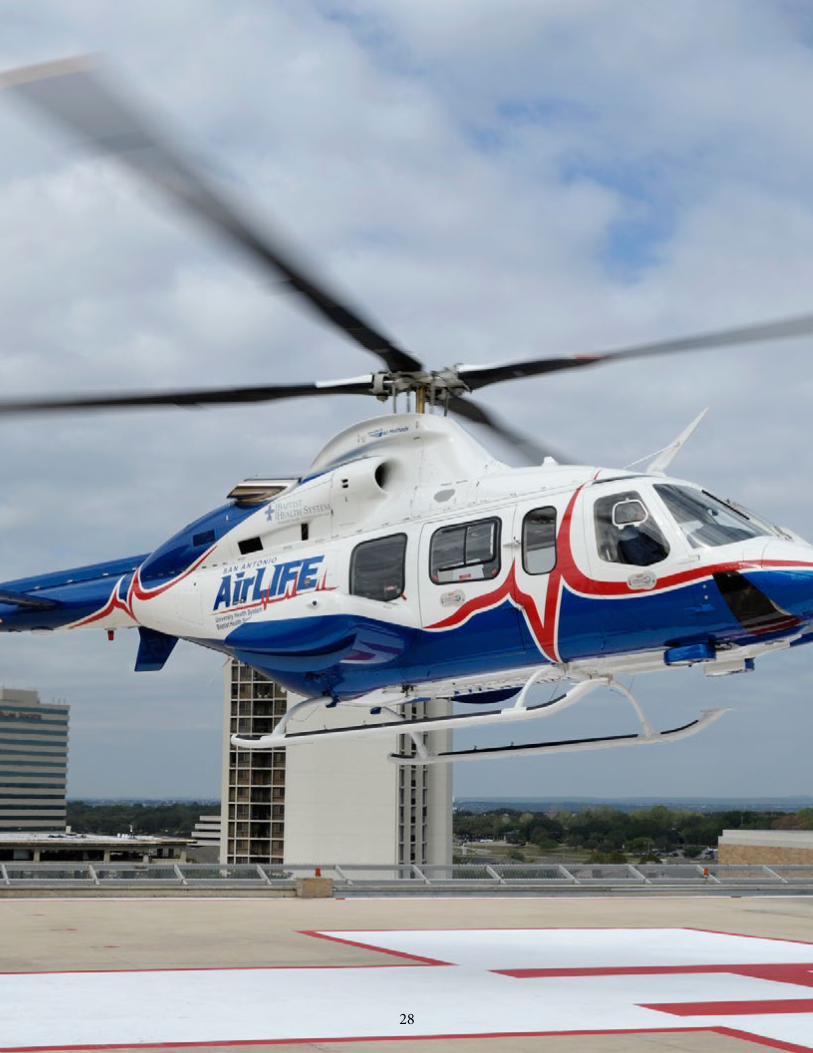
AirLIFE, a helicopter ambulance service jointly owned by University Health System and the Baptist Health System, is a critical component in the rapid transfer of seriously injured patients throughout the vast region. With three Bell 430 and two Bell 407 helicopters capable of quickly reaching remote or hard-to-access locations, AirLIFE covers a 150-mile radius of San Antonio. It has helicopters based in New Braunfels, Kerrville, Uvalde, San Antonio, and a 12-hour-per-day base in Pleasanton. AirLIFE employs more than 65 people, including flight nurses, flight paramedics and communication specialists. Air Methods Corporation, which operates and maintains the fleet of helicopters, has more than 30 pilots and mechanics assigned to the program.
As a whole, this organized approach to trauma care has saved lives, improved cooperation among providers and created a more efficient, effective trauma system benefitting millions of Texas residents.
31

Research
“Glucose variability and mortality after adjustment for injury severity, Glasgow Coma Scale, and age in critically ill trauma patients.” Sordo, S., Corneille, M., Louden, C., Ouyang, Y., Dent, D., Stewart, R., Michalek, J. Journal of Critical Care. 2013 February, Volume 28 Issue 1 19-20.
“Defining when to initiate massive transfusion: a validation study of individual massive transfusion triggers in PROM-MTT patients.” Callcut RA, Cotton BA, Muskat P, Fox EE, Wade CE, Holcomb JB, Schreiber MA, Rahbar MH, Cohen MJ, Knudson MM, Brasel KJ, Bulger EM, Del Junco DJ, Myers JG, Alarcon LH, Robinson BR, PROMMTT Study Group. The Journal of Trauma and Acute Care Surgery. 2013 Jan; 74(1):59-65, 67-8; discussion 66-7.
“Initial management of the trauma patient.” Ray JM, Cestero RF. Atlas of the Oral & Maxillofacial Surgery Clinics of North America. 2013 Mar; 21(1):1-7.
“Characterizing vasopressin and other vasoactive mediators released during resuscitation of trauma patients.” Cohn SM, DeRosa M, McCarthy J, Song J, White C, Louden C, Ehler B, Michalek J, Landry DW. Journal of Trauma. 2013 Oct; 75 (4):620-628.
“On the shoulders of giants…” Pruitt BA Jr, Rasmussen TE. Journal of Trauma and Acute Care Surgery. 2013 Aug; 75(2Suppl 2):S106-110.
“A small amount can make a difference: a prospective human study of the paradoxical coagulation characteristics of hemothorax.” Smith WZ, Harrison HB, Salhanick MA, Higgins RA, Ortiz A, Olson JD, Schwacha MG, Harrison CR, Aydelotte JD, Stewart RM, Dent DL. American Journal of Surgery. 2013 Dec;206(6):904-9; discussion 909-10.
“The general surgery workforce shortage is worse when assessed at county level.” Stewart RM. Liao LF. West M. Sirinek KR. American Journal of Surgery. 206(6):1016-22; discussion 1022-3, 2013 Dec.
“Impact of the age of transfused red blood cells in the trauma population: a feasibility study.” Cohn SM, DeRosa M, Kumar A, Harrison C, Dent D, Sivam S, McCarthy J, Warner S, Williams S, Michalek JE, Spinella P. Injury. 2014 Mar; 45(3):605-11.
“Burn wound gamma-delta T-cells support a Th2 and Th17 immune response.” Rani M, Zhang Q, Schwacha MG. Journal of Burn Care Research, 2014 Jan-Feb; 35(1):46-53 (Lonza Award Recipient).
“Seven deadly sins in trauma outcomes research: an epidemiologic post mortem for major causes of bias.” del Junco DJ, Fox EE, Camp EA, Rahbar MH, Holcomb JB; PROMMTT Study Group Myers JG, Stewart RM. Journal of Trauma and Acute Care Surgery. 2013 Jul;75(1 Suppl 1):S97-103.
“Purposeful variable selection and stratification to impute missing Focused Assessment with Sonography for Trauma data in trauma research data in trauma research.” Fuchs PA, del Junco DJ, Fox EE, Holcomb JB, Rahbar MH, Wade CA, Alarcon LH, Brasel KJ, Bulger EM, Cohen MJ, Myers JG, Muskat P, Phelan HA, Schreiber MA, Cotton BA; PROM-MTT Study Group. Journal of Trauma and Acute Care Surgery. 2013 Jul;75(1 Suppl 1):S75-81.
As the premier Level I trauma center for South Texas, University Hospital doctors and staff are not only tasked with saving lives, but with finding new and better ways to save lives through research. Below is a sample of research studies and articles published in 2013.
32

ResourcesGeneral Safety
University Health System Child Health & Safety Awareness ProgramCar seat inspections and installation, safe driving, elderly falls; school, community and family education.www.universityhealthsystem.com/trauma-services/preventing-trauma
Centers for Disease Control and Prevention Injury CenterSafe driving, violence prevention, falls, home safety, animal bites, concussionswww.cdc.gov/injury/overview
San Antonio Fire Department Safety PageSmoke detectors and carbon monoxide safety, child car seats, fireworks safety, water safety.www.sanantonio.gov/safd/safetyinformation
Safe Kids USAA wide range of information on keeping kids safewww.safekids.org
Vehicle Safety
Texas Department of TransportationState laws, safe driving tips, traffic conditions, child safety, motorcycle safety classeswww.txdot.gov/driver
National Highway Traffic Safety AdministrationBicycle safety, 5-star crash ratings, child safety, teen driving, distracted driving, substance abusewww.nhtsa.gov
Household Safety
Texas Falls Prevention CoalitionClasses and programs for the elderly, fall-proofing at homewww.texasfpc.org
American Veterinary Medical AssociationDog Bite Preventionwww.avma.org/public/Pages/Dog-Bite-Prevention.aspx
Consumer Product Safety CommissionRecalls and alerts, product safety advicewww.cpsc.gov
33

University Hospital and UT Health Science Center San Antonio School of Medicine Trauma Faculty and Staff
Jason D. Gourlas, PA-C, SpecialistAmanda Loquias, RN, MSN, FNP, SpecialistSusan McCollow, RN, FNP-C, SpecialistLindsey Rippee, RN, ACNP, BC, SpecialistErnest L. Wheeler, PA, SpecialistJeni Wilson, MS, RN, APRN, BC, SpecialistJessica Parker-Raley, PhD, Associate Professor, Director of Re-search OperationsMark DeRosa, CRT, CCRC, Clinical Research Project ManagerRachelle Jonas, RN, Senior Clinical Research NurseMeenakshi Rani, PhD, Research ScientistKristin Rocchi, RN, Clinical Research Nurse IntermediateRick L. Sambucini, RN, Senior Clinical Research NurseSylvia Castillo, Manager of Finance & Administration, Trauma & Emergency SurgerySusan Douglass, MSN, RN, CEN, Administrative Director, Child Health and Safety AwarenessRudy Jackson, MHA,BSN, RN, Executive Director of Trauma & Emergency ServicesTracy Cotner-Pouncy, RN, Director, Trauma ServicesDawn Belscamper, RN, Assistant Director, Trauma ServicesJenny Oliver, RN, Assistant Director, Pediatric Trauma & BurnRose Marie Bolenbaucher, MSN, Trauma Educator Deborah Hutton, RHIT, CSTR, Trauma Registry Supervisor
Dr. Ronald Stewart, Professor & Chair, Department of Surgery, Dr. Witten B. Russ Chair in SurgeryDr. John G. Myers, Professor & Division Chief, Trauma and Emergency Surgery, Chief of StaffDr. Brian Eastridge, Professor, Trauma Medical DirectorDr. Lillian Liao, Assistant Professor, Pediatric Trauma & Burn DirectorDr. Stephen M. Cohn, ProfessorDr. Daniel L. Dent, Distinguished Teaching Professor, General Surgery Residency Program Director, Professor of SurgeryDr. Deborah L. Mueller, Clinical Associate ProfessorDr. Ramon F. Cestero, Assistant Professor, Medical Director Surgical ICUDr. Mark A. Gunst, Assistant ProfessorDr. Mark T. Muir, Assistant ProfessorDr. Susannah Nicholson, Assistant ProfessorDr. Basil A. Pruitt, Clinical Professor of Surgery, Betty and Bob Kelso Distinguished Chair in Burn and Trauma Surgery, Dr. Ferdinand P. Herff Chair in SurgeryDr. Harlan D. Root, Clinical ProfessorMartin G. Schwacha, PhD ProfessorPatricia Botello, RN, ACNP, SpecialistBill Butler, PA-C, SpecialistGreg Goodwiler, MPAS, PA-C, Specialist
Bexar County Commissioners CourtNelson W. WolffBexar County Judge
Sergio “Chico” RodriguezCommissioner, Precinct 1
Paul ElizondoCommissioner, Precinct 2
Kevin WolffCommissioner, Precinct 3
Tommy AdkissonCommissioner, Precinct 4
Bexar County Hospital District Board of ManagersJames AdamsChair, Board of Managers
Linda RivasVice Chair
Dr. Dianna M. BurnsSecretary
Dr. Roberto L. JimenezImmediate Past Chair
Robert Engberg
Bo Gilbert
Ira Smith, Jr.
2013 Community Trauma ReportProduced by University Health System Corporate Communications & Marketing DepartmentLeni Kirkman, Vice President, Strategic Communications and Patient Relations Project manager Don Finley, Senior Writer, Corporate CommunicationsProject designer Helena Hummel, Graphic Design and Branding CoordinatorPhotography Mark GreenbergMapping Camerino I. Salazar, M.S., Senior Director, Health Analytics, Research and Information Management
Thanks to the San Antonio Metropolitan Health District for additional data used in this report.
University Health System Leadership TeamGeorge B. Hernández, Jr., JD, President/Chief Executive Officer
Mark Webb, Executive Vice President/Chief Operating Officer
Reed Hurley, Interim Executive Vice President/Chief Financial Officer
Dr. Bryan Alsip, MPH, FACPM, Executive Vice President/Chief Medical Officer
Tim Brierty, Chief Executive Officer, University Hospital
Nancy Ray, Senior Vice President/Chief Nurse Executive
35
