community forest vulnerability workshop
TRANSCRIPT

Community Forest Vulnerability Workshop

Northern Institute of Applied Climate Science
Chartered by USDA Forest Service, universities, non-profit, and tribal conservation organizations

USDA Climate Hubs

Climate Change Response Framework
2012: Central Appalachians
2011: Central Hardwoods
2009: Wisconsin pilot
2010: Northwoods expansion
2013-14:New EnglandMid-AtlanticUrban
www.forestadaptation.org

Urban Forestry Climate Change Response Framework
Brandt et al. 2017. Environmental Science and Policy

Vulnerability Assessment: Chicago Region
www.treesearch.fs.fed.us/pubs/54128

Objectives
•Understand key climate change impacts to Austin’s community forest
•Provide feedback on species vulnerability list for Austin’s trees
•Assess the vulnerability of the community forest in developed areas
•Assess the vulnerability of key natural ecosystems in the Austin region
•Develop vulnerability summaries for developed and natural areas to inform future adaptation strategies.

Workshop Product = Vulnerability AssessmentWe are creating a vulnerability assessment for the terrestrial ecosystems and developed urban trees
within the Austin region.
We will be focusing on the present through end of the century (2100).
Workshop participants and other contributors will be included as co-authors on the report.
We will synthesize the state of science using our best judgement. We will not make recommendations
about management or adaptation.

Assessment Process & Expert Panel
PotentialEcosystem
Change•Future climate
•Model results
•Literature review
Local Info
•Current ecosystem conditions
•Climate trends
Expert Knowledge &
Experience(via workshop)

Assessment Process & Expert Panel
EcosystemVulnerability
& Confidence
PotentialEcosystem
Change•Future climate
•Published research
•Model results
Local Info
•Current ecosystem conditions
•Climate trends
Expert Knowledge &
Experience(via workshop)

Outcome: Vulnerability Determination
Community Type Potential Impacts Adaptive Capacity Vulnerability
Northern hardwoods Moderate-Negative Moderate-High Moderate
Aspen-birch Moderate-Negative Moderate-High Moderate-High
Upland spruce-fir Negative Moderate-Low High
Lowland conifers Negative Moderate-Low High
Jack pine Moderate-Negative Moderate-High Moderate
Red pine Moderate-Negative Moderate-Low Moderate-High
White pine Moderate-Negative High Moderate-Low
Oak associations Moderate Moderate-High Moderate- Low
Lowland-riparian
hardwoodsModerate-Negative Moderate Moderate-High
Janowiak et al. 2014

Brandt et al. 2014
Outcome: Vulnerability Description

Vulnerability Assessment of Austin’s Trees and Shrubs

VulnerabilityThe degree to which a system is susceptible to, and unable to cope with, adverse effects of climate change, including climate variability and extremes (IPCC 2007)
Figure: Glick et al. 2011
Vulnerability
Potential Impact
Adaptive Capacity

VulnerabilityThe degree to which a system is susceptible to, and unable to cope with, adverse effects of climate change, including climate variability and extremes (IPCC 2007)
Figure: Glick et al. 2011
Vulnerability
Potential Impact
Adaptive Capacity

Native Trees Model Projections: Climate Change Tree Atlas/Distrib-II • Developed by Louis Iverson and the Landscape Change Research
Group (part of NIACS)
• https://www.fs.fed.us/nrs/atlas/
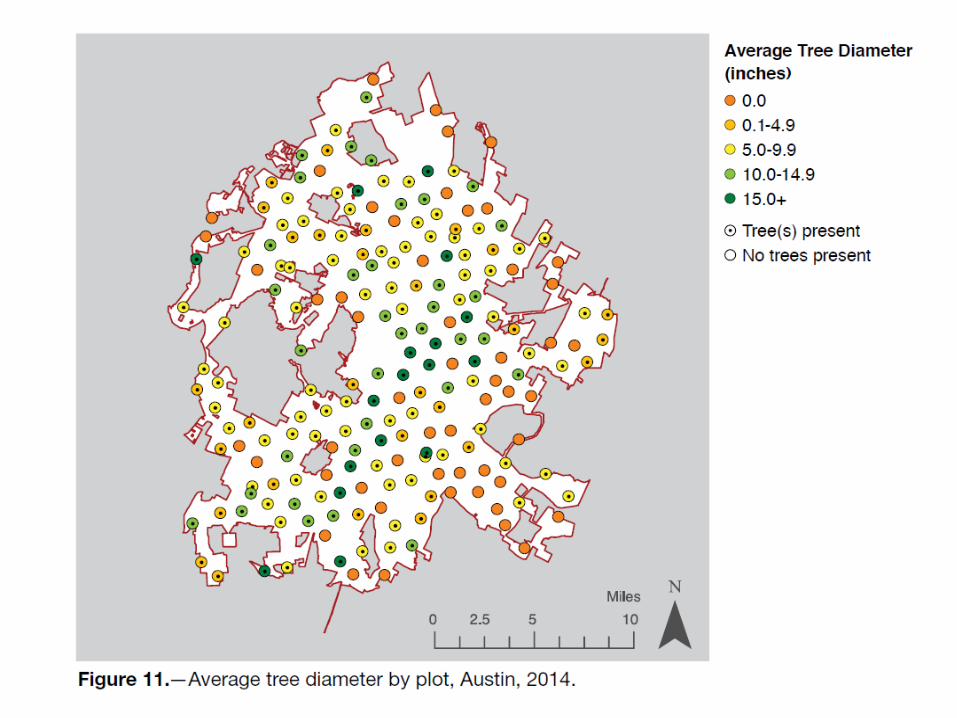
• Based on Forest Inventory and Analysis Data (not urban FIA)
• Uses current climate, soils, topopgraphy and downscaled climate projections (through 2099)
• Model developed for the entire Eastern US.
• Summarized in 1x1 degree grids


Summary Area 1x1 grid
1x1 area for model results

Species Expected to Lose Habitat (*from most to least abundant)
• ashe juniper (high emissions only)
• live oak
• post oak
• eastern redcedar
• pecan
• hackberry
• blackjack oak
• chittamwood/gum bumelia
• green ash
• American elm
• boxelder
• winged elm
• red mulberry (high emissions only)
• slippery elm
• flowering dogwood
• Black cherry (low emissions only)
• Honeylocust (low emissions only)
• Bitternut hickory

Post Oak
Current Habitat
End of Century-high emissions
End of Century-low emissions

Species Expect to Retain Habitat(*from most to least abundant)
• cedar elm
• sugarberry
• black walnut
• Osage-orange
• sycamore
• Shumard oak
• water oak
• bur oak
• white ash
• black hickory

Cedar Elm
Current Habitat
End of Century-high emissions
End of Century-low emissions

Impacts: Non-native, rare species, shrubs, and cultivars
• Compared species’ tolerances to projected changes in heat and hardiness zones for Austin region • Heat/hardiness zone projection exceeds species tolerance: potential negative
effect
• Examined species ranges • South, west end of range: potential negative effect
• Center of range: No effect
• North/east end of range: potential positive effect

Shifts in Hardiness Zones

Shifts in Heat Zones

Species that Could Benefit from Warmer Temps
• mescal bean (Texas mountain laurel)
• Desert willow
• Texas persimmon
• Berlandier ash
• Mexican white oak
• Jerusalem thorn (Retama)
• Lindheimer's silktassel
• sweet acacia (Huisache)
• Anacacho orchid tree
• Montezuma cypress
• Brasil
• Mexican olive
• Mexican redbud
• Catclaw
• Texas kidneywood
• Mexican sycamore

Species that Could be Negative Affected by Warmer Temps
• Durand oak
• bastard oak (White shin)
• Buckley oak
• American smoketree
• bur oak
• Chinese privet
• eastern redbud
• glossy privet
• roughleaf dogwood
• hackberry
• boxelder
• sugarberry
• Osage orange• Wafer ash• chinkapin oak• eastern cottonwood• winged elm• Shumard oak• chittamwood, gum bumelia• eastern redcedar• pecan• post oak• black walnut• green ash• Texas ash• Ashe juniper
• Chinese elm• cedar elm• western soapberry• black willow• Mexican plum• slippery elm• Blackjack oak• Possumhaw• Red buckeye• rusty blackhaw• sweetgum• American sycamore• water oak• red mulberry• Black hickory• carolina buckthorn• Mockernut hickory

VulnerabilityThe degree to which a system is susceptible to, and unable to cope with, adverse effects of climate change, including climate variability and extremes (IPCC 2007)
Figure: Glick et al. 2011
Vulnerability
Potential Impact
Adaptive Capacity

Adaptive Capacity Factors
Disturbance Factors
Biological Factors
Based on Matthews et al. 2011
-3 30
Pest, disease, fire, drought, flood, pollution, heat, herbivory, invasive species, salt resistance
Shade tolerance, edaphic specificity, propagation, pruning needed, establishment, rooting conditions

bio
logi
cal s
core
Highest possible adaptability score: 8.5
Mid-range adaptability score: 4.25
High biological, low disturbance scores
0 1 2 3-3 -2 -1-3
-2
-1
0
1
2
3
disturbance score
Lowest possible adaptability score: 0
High disturbance, low biological scores
Length0 6
Len
gth
06
ADAPTIVE CAPACITY SCORE

2 Separate Scores
Planted/Developed • Species that are or could be
planted in yards, boulevards, parks, campuses
• Greater emphasis on pollution and heat tolerance
• Fire tolerance, invasive species competition, natural regeneration not factors
• Includes nursery propagation, restricted rooting conditions, maintenance, planting site
Natural • Species that are native or
naturalized to the area
• Less emphasis on pollution, heat, but still factors
• Includes invasive species competition, fire tolerance and post-fire regeneration
• Greater emphasis on shade tolerance
• Includes dispersal, seedling establishment, vegetative reproduction

Tree Species Assessed
• 104 Species• 59 currently present (Urban FIA)
• 45 additional species based on expert recommendations
• Canopy, sub-canopy trees native to the Austin region
• Non-native species and many cultivars of trees that are currently present
• Invasive tree species

Most Adaptable Native Trees-Native trees in Natural Areas
• Fragrant sumac
• Boxelder
• prairie sumac
• roughleaf dogwood
• Crapemyrtle
• paper mulberry
• Prickly-ash,Tickle-tongue
• eastern redbud
• evergreen sumac
• Osage orange
• Hackberry
• bigtooth maple

Most Adaptable Trees-Planted Sites
• Texas red oak (NutallOak)
• eastern redbud
• bur oak
• goldenrain tree
• Chinese tallowtree
• baldcypress
• Chinese pistache
• Shumard oak
• Texas ash
• hackberry
• chittamwood, gum bumelia• cherry laurel• Chinese elm• Mexican white oak• western soapberry• crapemyrtle• yaupon• glossy privet• mescal bean (Texas mountain
laurel)• live oak

VulnerabilityThe degree to which a system is susceptible to, and unable to cope with, adverse effects of climate change, including climate variability and extremes (IPCC 2007)
Figure: Glick et al. 2011
Vulnerability
Potential Impact
Adaptive Capacity
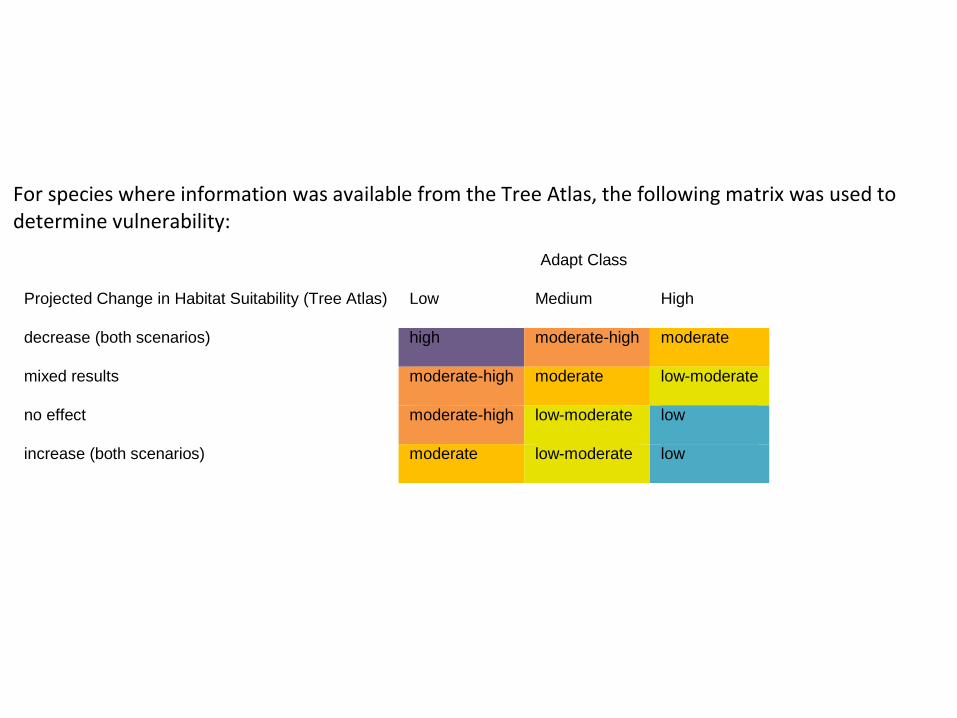
For species where information was available from the Tree Atlas, the following matrix was used to determine vulnerability:
Adapt Class
Projected Change in Habitat Suitability (Tree Atlas) Low Medium High
decrease (both scenarios) high moderate-high moderate
mixed results moderate-high moderate low-moderate
no effect moderate-high low-moderate low
increase (both scenarios) moderate low-moderate low

For species where no model information was available, the following matrix was used to determine vulnerability:
Adapt Class
Heat/Hardiness Zone Effect Low Medium High
negative high moderate-high moderate
no effect moderate-high low-moderate low
positive moderate low-moderate low

Vulnerability-Public Trees (based on natural adaptability)
0 2000000 4000000 6000000 8000000 10000000 12000000
low
low-moderate
moderate
moderate-high
high
Number of Trees in Each Vulnerability Class-Public Spaces (based on urban FIA data)

Most Vulnerable Trees-Natural Areas
High Vulnerablity
• Durand oak
• bastard oak (White shin)
• Buckley oak
• cedar elm
Moderate-High Vulnerability • Shumard oak• chittamwood, gum bumelia• eastern redcedar• pecan• western soapberry• post oak• black walnut• green ash• Texas live oak• red mulberry• Texas ash• Ashe juniper

Lower Vulnerability Trees-Natural Areas
Low
• chinaberry
• prairie sumac
• paper mulberry
• yaupon
• Texas persimmon
Low-moderate
• Jerusalem thorn (Retama)
• honey mesquite

Vulnerability-Trees on private lands (based on planted/developed adaptability)
0 1,000,000 2,000,000 3,000,000 4,000,000 5,000,000 6,000,000
low
low-moderate
moderate
moderate-high
high
Number of Trees in Each Vulnerability Class-Private lands (based on Urban FIA data)

Most Vulnerable Trees-Developed Sites
High vulnerability
• mimosa, silktree
• black walnut
• post oak
• eastern cottonwood
• pecan
• Ashe juniper
Moderate-High Vulnerability• edible fig• water oak• southern magnolia• American elm• chinkapin oak• slippery elm• Japanese privet• velvet ash• Buckley oak• Chinese privet• American sycamore• winged elm• boxelder• sugarberry• green ash• cedar elm• eastern redcedar

Lower Vulnerability Trees-Developed Sites
Low
• Mexican white oak
• yaupon
• mescal bean (Texas mountain laurel)
Low-moderate
• Texas madrone
• paper mulberry
• honey mesquite
• Berlandier ash
• chinaberry
• Texas persimmon

Key Points
• Species at southwestern extent of their ranges are expected to lose habitat
• Not many species expected to gain newly suitable habitat
• Species that are heat, drought, and flood-adapted and pest/disease resistant are least vulnerable
• Ashe juniper (the most abundant species) is considered vulnerable to loss of suitable habitat

Introduction to Assessment Process

VulnerabilityThe degree to which a system is susceptible to, and unable to cope with, adverse effects of climate change, including climate variability and extremes (IPCC 2007)
Figure: Glick et al. 2011
Vulnerability
Potential Impact
Adaptive Capacity

Potential Impacts-Developed Sites
• Direct and indirect climate change effects
• For each ecosystem, how will climate change affect…• Conditions (e.g., soil or site conditions, disturbance
dynamics) • Dominant/important species• Stressors/threats (e.g., invasive species, pests, diseases,
fragmentation)• Interactions
• Rate potential impacts
(Positive ↔Negative)

Adaptive Capacity-Developed Sites • Ability of human-ecological system to cope with changes
• For each forest system, how resilient is it based on…• Dominant species response to environmental shifts
(phenotypic plasticity)
• Diversity (e.g., species, functional, genetic) • Response to enhanced disturbances• Social, economic, organizational capacity
• Rate adaptive capacity
(Low↔High)

Potential Impacts-Natural Areas
• Direct and indirect climate change effects
• For each ecosystem, how will climate change affect…• Drivers (e.g., soil or site conditions, disturbance dynamics)
• Dominant/important species• Stressors/threats (e.g., invasive species, pests, diseases,
fragmentation)• Interactions
• Rate potential impacts
(Positive ↔Negative)

Adaptive Capacity-Developed Sites
• Ability of ecosystem to cope with changes
• For each forest system, how resilient is it based on…• Dominant species response to environmental shifts
(phenotypic plasticity)
• Diversity (e.g., species, functional, genetic) • Response to enhanced disturbances
• Rate adaptive capacity
(Low↔High)
….not management

Vulnerability Determination
1) Assess impacts on a system (individually)
(On Worksheets)

Vulnerability Determination
2) Assess adaptive capacity of a forest system (individually)
(On Worksheets)

Vulnerability Determination
3) Determine the vulnerability based upon impacts and adaptive capacity (individually)
(On Worksheets)

Vulnerability Determination
4) Consider evidence and agreement to rate your level of confidence in that vulnerability rating (individually)
(On Worksheets)

Vulnerability Determination
5) As a group, consider individual ratings
(On Large Poster)

Vulnerability Determination
6) As a group, come to consensus on overall vulnerability and confidence for each forest type
(On Large Poster)

Systems we will Consider
For each, consider current:
• Drivers
• Dominant/important species
• Stressors and threats
• Adaptive capacity
Then consider likely
changes over the next 80
years
Systems
Urban Core
Upland Forests
West Austin
East Austin
Upland Mixed Shrublands
Floodplains and Low Terraces
Dev
elo
ped
A
reas
Nat
ura
l Are
as
Upland Woodlands

Urban Core Downtown and other highly developed areas.
Key Characteristics • Low canopy cover• High impervious surface• High development• High population density
Dominant/Important Species• Ashe Juniper • Mescal Bean• Live Oak
Key Stressors• Urban heat island• Stormwater runoff/localized flooding• Air pollution• Development• Restricted rooting conditions
Hop et al. 2010

Urban Heat Island

Localized Flooding

West Austin Low-medium density developed areas west of I-35/ on Edwards plateau
Key Characteristics • Higher canopy cover• Some impervious surface• Low-medium development• Medium population density
Dominant/Important Species• Ashe juniper• Live oak• Texas persimmon• Cedar elm
Key Stressors• Urban heat island• Stormwater runoff/localized flooding• Air pollution• Development• Restricted rooting conditions
Hop et al. 2010

East Austin Low-medium density developed areas east of I-35/ on Blackland prairie
Key Characteristics • Lower canopy cover• Some impervious surface• Low-medium development• Medium population density
Dominant/Important Species• Ashe juniper• Live oak• Texas persimmon
Key Stressors• Urban heat island• Stormwater runoff/localized flooding• Air pollution• Development• Restricted rooting conditions
Hop et al. 2010

Upland ForestsMore closed-canopy areas within the Edwards Plateau/Balcones canyonlands
Drivers• Closed canopy • Fire resistant• Mesic conditions• Topographic release
Dominant/Important Species• Live oak• Cedar elm• Ashe juniper• Texas persimmon• Sugar hackberry
Key stressors• Wildfire• Drought• Oak wilt • Invasive plants
Hop et al. 2010

Wildfire Hazards

Wildland-Urban Interface
http://silvis.forest.wisc.edu/data/wui-change/

Upland WoodlandsModerate canopy cover with herbaceous and graminoid layer.
Drivers• Fire-adapted• Topographic relief in some areas• Dry-mesic
Dominant/Important Species• Escarpment live oak• Post oak • Texas/buckley oak
Stressors• Wildfire suppression• Overgrazing• Drought• Oak wilt
Hop et al. 2010

Upland Mixed Shrubland
Shrub-dominated systems within the Edwards Plateau and Blackland Prairie
Drivers• Xeric sites and shallow soils • Grassland-woodland transition• Fire-driven
Dominant/Important Species• Escarpment live oak• White shin oak• Lacey oak• Ashe juniper• Post oak • Live oak• Honey mesquite
Stressors • Overgrazing• Wildfire suppression • Invasive woody shrubs
Hop et al. 2010

Floodplains and Terraces Forested floodplain and riparian areas within the Blackland Prairie and Edwards Plateau ecoregions.
Drivers• List drivers
Dominant/Important Species• Sugar hackberry• Cedar Elm • Green Ash• American sycamore• Eastern Cottonwood• Pecan
Stressors• Emerald ash borer • Changes in flood regime • Water use/withdrawal • Invasive species • Development
Hop et al. 2010

Flood Risks

Additional maps and information