community-based, continuous distribution of … · web viewcommunity-based, continuous distribution...
TRANSCRIPT
Community-Based, Continuous Distribution of LLIN in Nasarawa State, Nigeria
Albert Kilian, Emmanuel ObiTropical Health LLPAugust 6, 2015

EVALUATION OF COMMUNITY LLIN DISTRIBUTION, NIGERIA
List of Abbreviations
ANC Ante-Natal CareBCC Behavioral Change CommunicationCD Continuous DistributionCDD Community Drug DistributorCI Confidence IntervalFCT Federal Capital TerritoryHF Health FacilityHH HouseholdsITN Insecticide Treated NetsJHU Johns Hopkins UniversityLGA Local Government AreaLLIN Long-lasting Insecticidal NetsPHC Primary Healthcare CenterPMI President’s Malaria InitiativeUNICEF United Nations Children’s FundUSAID United States Agency for International DevelopmentWDC Ward Development CommitteeWHO World Health Organization
2
EVALUATION OF COMMUNITY LLIN DISTRIBUTION, NIGERIA
Table of ContentsList of Abbreviations....................................................................................................................................1Table of Contents........................................................................................................................................3Acknowledgements.....................................................................................................................................3Executive Summary.....................................................................................................................................4Background..................................................................................................................................................6Study Site.....................................................................................................................................................6Community Distribution..............................................................................................................................7
Distribution design..................................................................................................................................7Implementation.......................................................................................................................................9
Evaluation Methods..................................................................................................................................11Evaluation objectives.............................................................................................................................11Evaluation design...................................................................................................................................12Sampling and sample size......................................................................................................................12Data collection.......................................................................................................................................13Data analysis..........................................................................................................................................14Ethical clearance....................................................................................................................................14
Results.......................................................................................................................................................16The sample............................................................................................................................................16Result of community distribution..........................................................................................................17Access to new nets................................................................................................................................18Net ownership.......................................................................................................................................20Equity aspects........................................................................................................................................21Behavior Change Communication.........................................................................................................22Net use..................................................................................................................................................24
Discussion..................................................................................................................................................26Conclusion and Recommendations...........................................................................................................27
Acknowledgements
This report is made possible by the generous support of the American people through the United States Agency for International Development (USAID) and the President’s Malaria Initiative (PMI) under the terms of USAID/JHU Cooperative Agreements No. GHS A 00 09 00014 00 and AID-OAA-A-14-00057.‐ ‐ ‐ ‐ ‐ The contents do not necessarily reflect the views of PMI or the United States Government.
The implementation of the CDD distribution was carried out as part of the MAPS program while the evaluation surveys were implemented through Malaria Consortium.
3

EVALUATION OF COMMUNITY LLIN DISTRIBUTION, NIGERIA
Executive Summary
This report presents the outcome of an evaluation of a community-based, push-pull system of LLIN distribution in Nasarawa State, Nigeria. Households in selected areas of the State were encouraged to contact their local Community Drug Distributor (CDD) if they felt they need new or additional nets to protect their family from malaria. The CDD would then verify the need and if satisfied, issue a net coupon against which the household could obtain a new LLIN from the nearest distribution point at a health facility.
The community based distributions started in June 2013, 31 months after the last mass campaign and continued for 10 months until the evaluation survey in April 2014. Data from the endline survey was compared to the findings from a baseline survey undertaken in October 2012, 11 months after the campaign. Both surveys were standard population representative household surveys with a cluster sampling design. Targeted sample size for each survey was 1020 and sample achieved was 1015 and 1003 for baseline and endline respectively. The evaluation design was a before-after comparison with an embedded “per protocol” comparison between households aware and not aware of the CDD scheme at the endline survey.
The major findings can be summarized as follows: ITN ownership indicators decreased from baseline to endline, but at endline were twice as high
among households aware of the CDD distributions than those not aware, and the decline from baseline to endline was small for the CDD households and statistically not significant. In detail the indicators were
o Ownership of any ITN: baseline 63%; endline CDD 55%, non CDD 28%o Owning 1 ITN/ 2 people: baseline 25%; endline CDD 17%, non CDD 6%o Population access to ITN: baseline 45%; endline CDD 35%, non CDD 16%
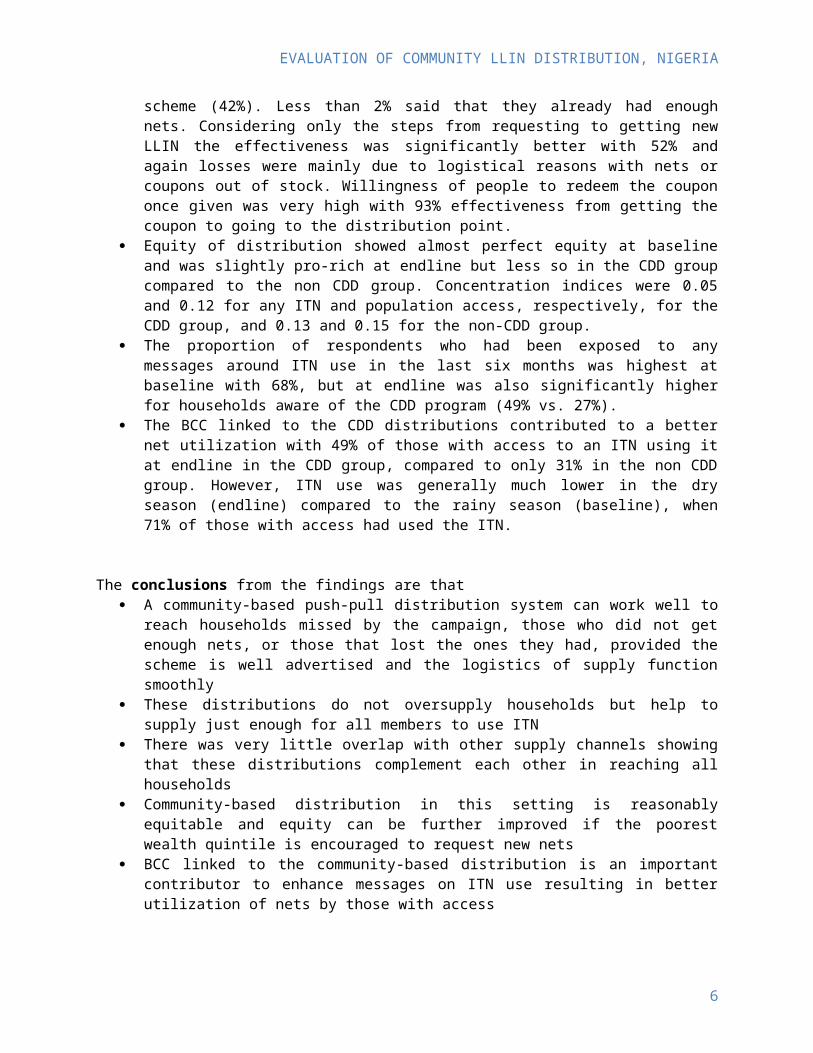
Program effectiveness was overall not very good with only 18% of households that were aware of the CDD distribution getting a new LLIN through the system. The biggest loss was by people not requesting nets because either nets or net coupons were out of stock (55% of non-registration) or people did not understand the scheme (42%). Less than 2% said that they already had enough nets. Considering only the steps from requesting to getting new LLIN the effectiveness was significantly better with 52% and again losses were mainly due to logistical reasons with nets or coupons out of stock. Willingness of people to redeem the coupon once given was very high with 93% effectiveness from getting the coupon to going to the distribution point.
Equity of distribution showed almost perfect equity at baseline and was slightly pro-rich at endline but less so in the CDD group compared to the non CDD group. Concentration indices were 0.05 and 0.12 for any ITN and population access, respectively, for the CDD group, and 0.13 and 0.15 for the non-CDD group.
The proportion of respondents who had been exposed to any messages around ITN use in the last six months was highest at baseline with 68%, but at endline was also significantly higher for households aware of the CDD program (49% vs. 27%).
The BCC linked to the CDD distributions contributed to a better net utilization with 49% of those with access to an ITN using it at endline in the CDD group, compared to only 31% in the non CDD
4

EVALUATION OF COMMUNITY LLIN DISTRIBUTION, NIGERIA
group. However, ITN use was generally much lower in the dry season (endline) compared to the rainy season (baseline), when 71% of those with access had used the ITN.
The conclusions from the findings are that A community-based push-pull distribution system can work well to reach households missed by
the campaign, those who did not get enough nets, or those that lost the ones they had, provided the scheme is well advertised and the logistics of supply function smoothly
These distributions do not oversupply households but help to supply just enough for all members to use ITN
There was very little overlap with other supply channels showing that these distributions complement each other in reaching all households
Community-based distribution in this setting is reasonably equitable and equity can be further improved if the poorest wealth quintile is encouraged to request new nets
BCC linked to the community-based distribution is an important contributor to enhance messages on ITN use resulting in better utilization of nets by those with access
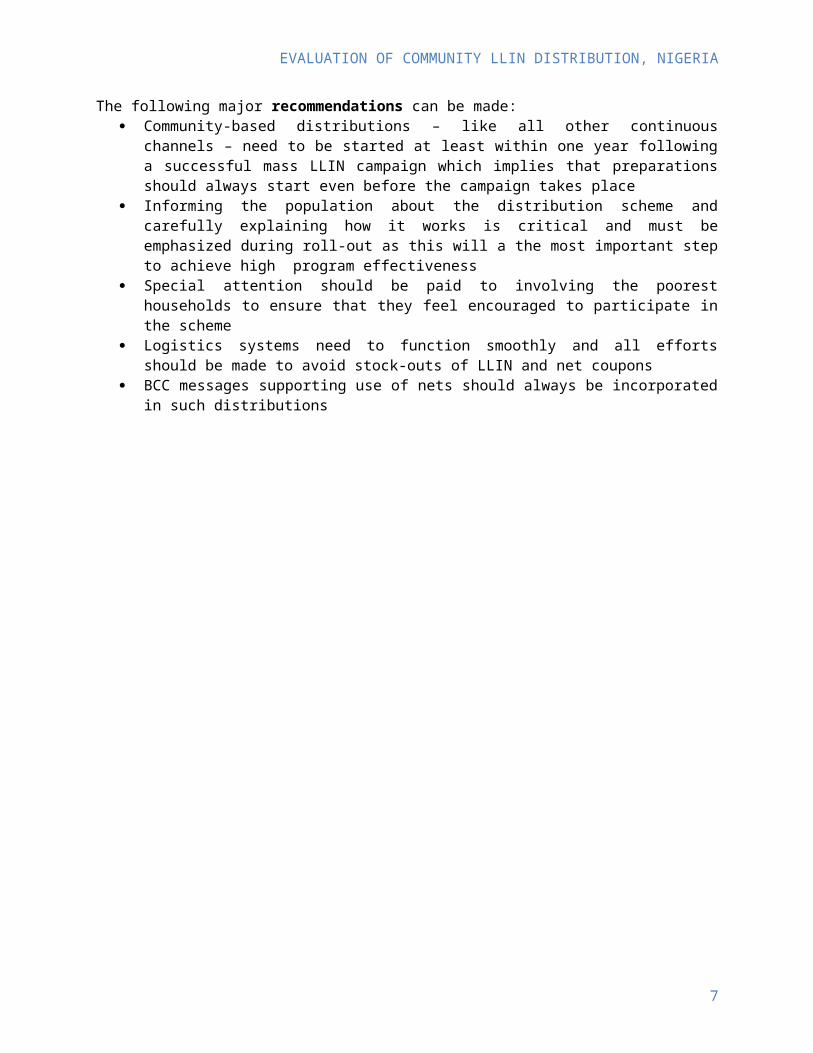
The following major recommendations can be made: Community-based distributions – like all other continuous channels – need to be started at least
within one year following a successful mass LLIN campaign which implies that preparations should always start even before the campaign takes place
Informing the population about the distribution scheme and carefully explaining how it works is critical and must be emphasized during roll-out as this will a the most important step to achieve high program effectiveness
Special attention should be paid to involving the poorest households to ensure that they feel encouraged to participate in the scheme
Logistics systems need to function smoothly and all efforts should be made to avoid stock-outs of LLIN and net coupons
BCC messages supporting use of nets should always be incorporated in such distributions
5
EVALUATION OF COMMUNITY LLIN DISTRIBUTION, NIGERIA
Background
Following the dramatic scale up of LLIN distributions in Nigeria through mass distribution campaigns, it is increasingly realized by the Roll Back Malaria Partnership that repeated campaigns are not the best solution to sustain the achieved gains and that a comprehensive distribution strategy which includes continuous distribution mechanisms is needed. The purpose of such continuous LLIN distribution is to
Avoid decline of population coverage (and hence protection) to levels below the threshold of the mass effect between repeated campaigns caused by the loss of nets through wear and tear
To provide replacement nets as well as supply new families when and where this is needed and to do this in an equitable and sustainable manner
Two principle approaches are possible in the implementation of continuous distribution. The most common way is to use routine health services to give LLIN to persons at particular risk such as pregnant women through ANC or children when they come for immunization. The eligibility to receive an LLIN is defined exclusively by the attendance at the specific services and therefore these distributions are called routine distributions in the strict sense. They can also been described as a push system.
The second approach consists of distribution mechanisms which are initiated by those who have a perceived demand for nets and then gain access to a full-price or subsidized system. This can also be described as a pull or demand-driven system and includes among others the classical social marketing.
A combination of the two would be a push-pull system where a certain amount of nets is pushed to a certain point in the supply chain (hub) from where the net users can pull down nets according to their demand and based on defined eligibility criteria.
In December 2010, nets were distributed in a mass campaign in Nasarawa state, where each household/family received two nets. NetWorks Project designed and supported the implementation of a community-based long lasting insecticidal nets (LLIN) distribution strategy, to help improve and sustain net coverage beyond the mass distributions in all LGAs in Nasarawa state.
This community-led LLIN distribution strategy has two separate phases: 1) The push of LLIN to the storage/ health facility2) The pull of LLIN by households, which requires two active steps by the household (supported by
adequate BCC) Visit to a Community Drug Distributor (CDD) to declare the need for an additional or
replacement net Visit to a LLIN storage hub (health facility) to redeem a LLIN coupon issued to the
household upon assessment of LLIN need by CDD. LLIN coupon is redeemed for a new LLIN
Study Site
6
EVALUATION OF COMMUNITY LLIN DISTRIBUTION, NIGERIA
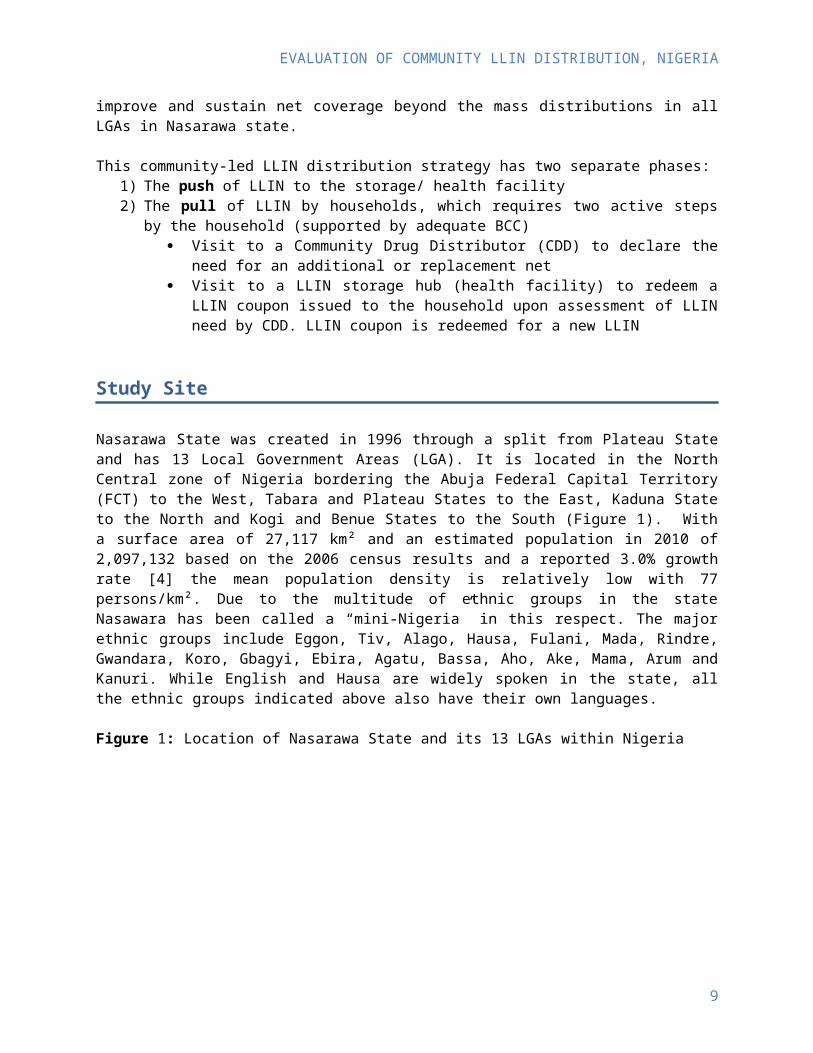
Nasarawa State was created in 1996 through a split from Plateau State and has 13 Local Government Areas (LGA). It is located in the North Central zone of Nigeria bordering the Abuja Federal Capital Territory (FCT) to the West, Tabara and Plateau States to the East, Kaduna State to the North and Kogi and Benue States to the South (Figure 1). With a surface area of 27,117 km² and an estimated population in 2010 of 2,097,132 based on the 2006 census results and a reported 3.0% growth rate [4] the mean population density is relatively low with 77 persons/km². Due to the multitude of ethnic groups in the state Nasawara has been called a “mini-Nigeria” in this respect. The major ethnic groups include Eggon, Tiv, Alago, Hausa, Fulani, Mada, Rindre, Gwandara, Koro, Gbagyi, Ebira, Agatu, Bassa, Aho, Ake, Mama, Arum and Kanuri. While English and Hausa are widely spoken in the state, all the ethnic groups indicated above also have their own languages.
Figure 1: Location of Nasarawa State and its 13 LGAs within Nigeria
NORTH W ESTNORTH EAST
NORTH CENTRAL
SOUTH W EST
SOUTH EAST
SOUTH SOUTH
Nasarawa State lies within the Guinea Savannah eco-geographical zone. Accordingly, overall rainfall is moderate to high varying between 1300-1550 mm per annum. The rainy season lasts from April to November with the peak of rains between July and October.
Community Distribution
Distribution design
Following meetings with the State authorities for Health discussions were held with key partners and stakeholders (UNICEF, WHO) and departments of the State Ministry of Health (Onchocerciasis Control and HMIS). This was followed by field visits to two LGAs (Kokona and Akwanga) including discussions with the LGA health teams, visit of a health facility and discussions with a number of CDD. A one-day workshop then presented the options the team had developed to the stakeholders and preferences and challenges were discussed. Building on the consensus reached with representatives at all levels (State,
7
EVALUATION OF COMMUNITY LLIN DISTRIBUTION, NIGERIA
LGA, Wards, communities and the CDDs), the community distribution channel was designed with the aid of the NetCALC tool.
The CDD distribution system: Builds on existing systems and mechanisms and supports or enhances these as much as possible
(integration). Makes adjustments where needed to take into account the specific characteristics of the nets
(e.g. their bulkiness) as well as aspects of use (need for a net culture and motivation to use) Complements ANC-based distributions as recommended by WHO and NMCP since this will
guarantee that pregnant women receive an LLIN as early in their pregnancy as possible without having to wait for the next distribution period
Is community-driven, requiring a pro-active role of households to initiate the process of obtaining new or additional LLIN (push-pull system)
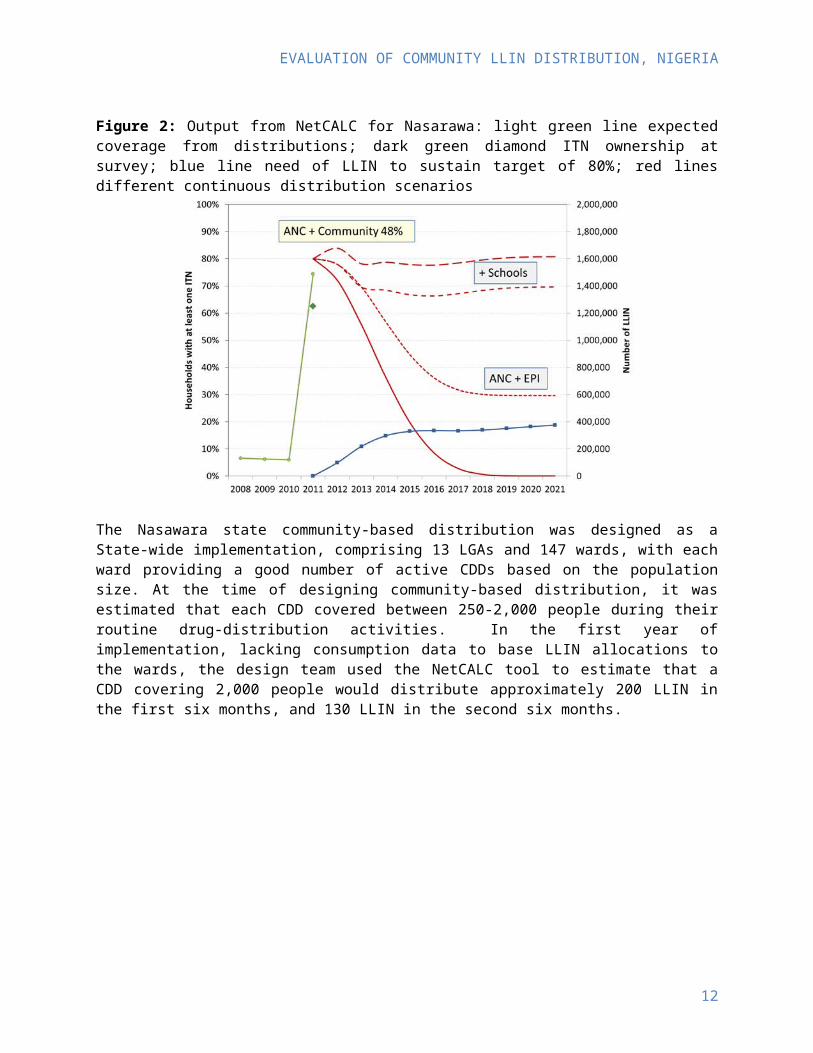
The NetCALC tool estimated the output that can be expected of various distribution channels (routine services including schools or community or market based) and compared these with the calculated need to sustain the defined target. Using data on access to services from the 2008 DHS such projections were made for Nasarawa and results are shown in Figure 2. These suggest that even if ANC and EPI distributions are used together with school-based distributions in primary and secondary schools, the target of 80% LLIN household ownership could not quite be sustained. However, if ANC distributions to protect pregnant women throughout their pregnancy were combined with a community-based distribution system (e.g. through CDD), approximately 50% of all households would need to receive a net through the community system each year, and the target of 80% LLIN ownership could be sustained. In such a scenario for 2012/13 about 58,000 LLIN annually would need to be channeled through ANC and 220,000 through the CDD system.
Figure 2: Output from NetCALC for Nasarawa: light green line expected coverage from distributions; dark green diamond ITN ownership at survey; blue line need of LLIN to sustain target of 80%; red lines different continuous distribution scenarios
8
EVALUATION OF COMMUNITY LLIN DISTRIBUTION, NIGERIA
The Nasawara state community-based distribution was designed as a State-wide implementation, comprising 13 LGAs and 147 wards, with each ward providing a good number of active CDDs based on the population size. At the time of designing community-based distribution, it was estimated that each CDD covered between 250-2,000 people during their routine drug-distribution activities. In the first year of implementation, lacking consumption data to base LLIN allocations to the wards, the design team used the NetCALC tool to estimate that a CDD covering 2,000 people would distribute approximately 200 LLIN in the first six months, and 130 LLIN in the second six months.
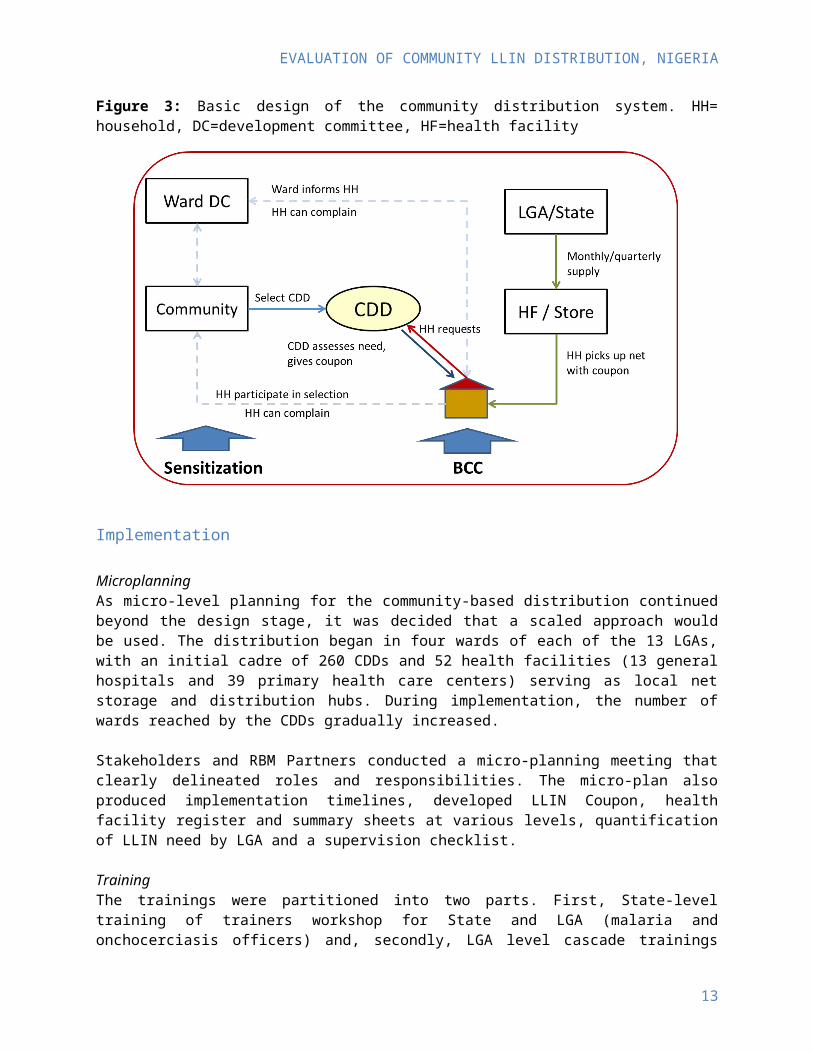
Figure 3: Basic design of the community distribution system. HH= household, DC=development committee, HF=health facility
Implementation
MicroplanningAs micro-level planning for the community-based distribution continued beyond the design stage, it was decided that a scaled approach would be used. The distribution began in four wards of each of the 13 LGAs, with an initial cadre of 260 CDDs and 52 health facilities (13 general hospitals and 39 primary health care centers) serving as local net storage and distribution hubs. During implementation, the number of wards reached by the CDDs gradually increased.
Stakeholders and RBM Partners conducted a micro-planning meeting that clearly delineated roles and responsibilities. The micro-plan also produced implementation timelines, developed LLIN Coupon, health facility register and summary sheets at various levels, quantification of LLIN need by LGA and a supervision checklist.
Training
9

EVALUATION OF COMMUNITY LLIN DISTRIBUTION, NIGERIA
The trainings were partitioned into two parts. First, State-level training of trainers workshop for State and LGA (malaria and onchocerciasis officers) and, secondly, LGA level cascade trainings for in-charge of PHCs, CDDs and WDCs. A state-level training of trainers was held over a two-day period with two representatives per LGA (Roll Back Malaria focal persons and the Neglected Tropical Diseases focal person for each LGA). These 26 trainees in turn trained the five CDDs in each of the four selected wards of their LGA (260 CDDs) and the in-charge/head of the 52 health facilities that would serve as the hubs for storage and issuing of nets.
The cascade trainings brought together different caliber of personnel on a one-day basis on different days, to train the CDDs and the health facility head involved in the distribution. The training gave an overview of the LLIN distribution process through CDDs and how to complete the data collection tools, such as the LLIN gap assessment form, LLIN Coupon, health facility register and summary forms. Trainees also reviewed what messages to share with clients to health facilities to raise awareness about using LLINs and how to obtain one through the CDD system. The cascade training approach also created a mechanism for relaying important updates and feedback from the State Malaria Control Program through the LGA Roll Back Malaria focal persons to the health facility staff and CDDs.
Mobilization and BCCThe pull mechanism of this strategy depends on the demand for nets by potential beneficiaries. Demand generation activities have been conducted primarily through interpersonal communication directly with community members by the CDDs, the Ward Development Committees, and community-based organizations and volunteers involved with MAPS activities in Nasarawa.
Flow of activities:a. LLIN are allocated monthly/quarterly to LGA and hubs based on expected need, prioritization
and LLIN availability, after the initial phase consumption vs. expected need will also be considered
b. Nets and other supplies are transported to hubc. In parallel communities (and local leaders) are sensitized and reminded to select CDD where
there are no currently active onesd. CDD are called for a one day training on the processes and given materials (LLIN coupon
booklets, assessment form booklet, registers and forms)e. Communities are informed that during a given period, they can approach the CDD and express
their need for more netsf. CDD will visit these households and assess the need based on household members and existing,
viable nets and give LLIN coupon(s). This can be combined initially with a prioritization (based on clear criteria and an assessment aid) e.g. based on size of gap in household in order to ensure settlements and families missed during campaign are served first without exhausting the net supply. Once a steady state is reached (second year) this would no longer be necessary
g. Households take the LLIN coupon to the health facility (storage hub) or ward development committee to receive their net(s)
h. Supervisors (PHCs, LGA) meet with CDD monthly/quarterly to discuss issues, collect summary forms and issue supplies if needed
i. Summary reports from CDD and hub (distribution data) are sent monthly/quarterly to LGA and State.
Distribution
10
EVALUATION OF COMMUNITY LLIN DISTRIBUTION, NIGERIA
The distribution started effectively in June 2013 and by the endline survey in April 2014 a total of 82,307 LLIN had been delivered to the distribution points. As shown in Figure 4, the monthly distribution was highly variable with an initial peak August to October 2013 with monthly distributions between 7,000 and 9,000. This was followed by a low in November and December (approximately 4,000 per month) and another peak in February and March 2014 with 14,000 and 16,000 per month.
The exact number of LLIN delivered through ANC are not known but can be estimated at around 20,000, bringing the total LLIN delivered through public sector continuous distribution to around 102,000. This figure represents 42% of the 245,850 originally earmarked for this purpose and about 27% of the annual need to sustain universal coverage in Nasarawa State based on NetCALC projections.
Figure 4: Number of LLIN distributed by CDD up to the endline survey
Evaluation Methods
Evaluation objectives
The primary objectives of the survey was
1. To assess the outcome of two different approaches to continuous distribution, a community-based scheme in Nasarawa State with respect to LLIN ownership and sustaining or achieving universal coverage
2. To assess the level of net retention/attrition of campaign nets three years after the mass campaign3. To assess the use of nets in general and LLIN in particular by different population groups
Secondary objectives of the survey were as follows Measure the equity in access to nets from various sources Obtain detailed information about net use and sleeping patterns in the family Evaluate the success of the IEC and BCC activities associated with the program
The research question was:
Did the continuous distribution of LLIN through schools or community drug distributors maintain the household coverage achieved by the universal LLIN access campaign or even contribute to closing the gap left by the campaign?
11
EVALUATION OF COMMUNITY LLIN DISTRIBUTION, NIGERIA
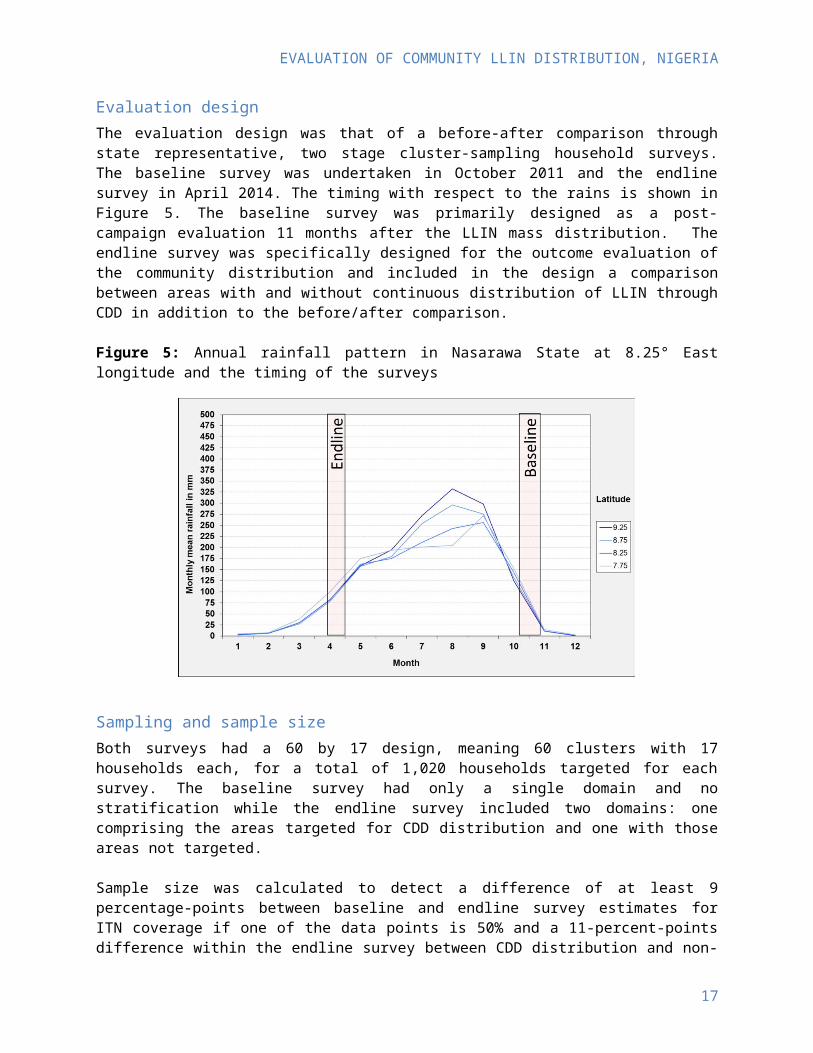
Evaluation designThe evaluation design was that of a before-after comparison through state representative, two stage cluster-sampling household surveys. The baseline survey was undertaken in October 2011 and the endline survey in April 2014. The timing with respect to the rains is shown in Figure 5. The baseline survey was primarily designed as a post-campaign evaluation 11 months after the LLIN mass distribution. The endline survey was specifically designed for the outcome evaluation of the community distribution and included in the design a comparison between areas with and without continuous distribution of LLIN through CDD in addition to the before/after comparison.
Figure 5: Annual rainfall pattern in Nasarawa State at 8.25° East longitude and the timing of the surveys
Sampling and sample size
Both surveys had a 60 by 17 design, meaning 60 clusters with 17 households each, for a total of 1,020 households targeted for each survey. The baseline survey had only a single domain and no stratification while the endline survey included two domains: one comprising the areas targeted for CDD distribution and one with those areas not targeted.
Sample size was calculated to detect a difference of at least 9 percentage-points between baseline and endline survey estimates for ITN coverage if one of the data points is 50% and a 11-percent-points difference within the endline survey between CDD distribution and non-distribution. The following assumptions were underlying the calculations of sample size:
Confidence interval 95% (alpha-error=0.05) Power 80% (beta-error=0.2) Design effect of 1.75 Non-response rate of 5%
Data collection
12
EVALUATION OF COMMUNITY LLIN DISTRIBUTION, NIGERIA
QuestionnairesFor data collection a pre-tested questionnaire was used. The primary respondent was the head of household or his/her spouse, and the person who went to the distribution point for net collection (where this was not the same person). The household module included questions regarding all existing mosquito nets and these were inspected by the survey team provided permission was given. The household/net module was followed by a questionnaire module for each child of eligible age in the household in order to assess the full immunization coverage and this section was addressed to the caretaker of the children. The household/net section of the questionnaire was identical with that used in the post-campaign surveys following the stand-alone LLIN campaigns in Kano and Anambra states while the immunization section was based on the respective questions used in the DHS questionnaire. The complete questionnaire used is presented in the Annex.
Visual aidsIn order to identify specific net brands and categorize them as LLIN the interviewers were provided visual aids showing all currently available LLIN brand labels and packages. In case access to the net was not granted to the interviewer the respondent was shown the visual aid and asked whether they could identify the brand of the net. Similarly, examples of the net cards used in the distribution and samples of the vitamin A capsules and the de-worming tablets used during the child heath campaigns were provided to the interviewers to be shown to the respondent.
Teams and Training Interviewers and supervisors were carefully selected to be culturally acceptable, to have good knowledge of the local language, and to have experience in household surveys. Each team had one supervisor and four to five interviewers. The week before the fieldwork, the field team was trained for four days. The training covered the purpose and exact procedures of the interviews following the interviewer’s guide and involved role playing as well as some pilot interviews.
Community Sensitization. This phase took place early October 2011. Local authorities were contacted for approval to conduct the survey. Visits were made to the relevant heads of settlements, and the purpose and procedures of the survey were explained to them. In all cases, the heads of each settlement granted authorization and in turn either personally notified the relevant heads of ward or referred the team to the heads of ward who were also informed of the survey objectives and procedures. The community mobilization specifically attempted to ensure that no further expectation of another distribution campaign after or during the survey was created.
Interviews. The interviews took place from October 24 to November 10. Each selected household was visited, and the head of household or one of his or her adult dependents was interviewed. If no appropriate respondent was found at the house, a new visit was scheduled later that day. At least three attempts were made to reach a respondent before dropping the household without replacing it.
Quality controlAt the end of each day, the team supervisor reviewed all questionnaires for completeness and possible inconsistencies and ensured that missing information was corrected while still in the field. In addition, spot-checks were performed on 12% of interviews conducted by each fieldworker.
13
EVALUATION OF COMMUNITY LLIN DISTRIBUTION, NIGERIA
Data analysis
Data entry was done using QPS software with double entry of all records. Both data sets were then compared, and any discrepant records were verified using the original questionnaires. After the first stage of cleaning, the data set was transferred to the STATA 11 statistical software package for further consistency checks and preparation of data files. The final data files (household, member, net, and child sections) were sent to the evaluation team for further processing.
Final analysis was done using STATA 11 software based on the previously defined outcome indicators broken down by background characteristics, including place of residence (urban and rural), whether a households had any children eligible for immunization i.e. under five years of age and socioeconomic status (wealth quintiles). Sampling weights were calculated based on the probability of cluster and household selection. All analyses were done adjusting for the cluster sampling by using the survey command family in STATA.
The wealth index was computed at the household level using principal component analysis (PCA) [5]. The variables for household amenities, assets, livestock, and other characteristics that are related to a household’s socioeconomic status were used for the computation. All variables were dichotomized except those of animal ownership where the total number owned was used. The first component of the PCA was used as the wealth index. Households were then classified according to their index value into quintiles. However, quintiles were calculates separately for urban and rural strata in order to adjust for rural-urban differences in socio-economic status. For analysis of individual members of the household or nets the quintile allocation of the household was applied. Concentration index and concentration curve (Lorenz curve) was used to analyze outcome differences by wealth. Standard errors and confidence intervals for the concentration indices were calculated using the formula suggested by Kakwani et al 1.
Responses related to questions on IEC/BCC where respondents were asked to choose on a scale were recorded. For questions 47 to 52, response options were recoded to read 2 for “definitely could,” 1 for “probably could,” –1 for “probably could not,” –2 for “definitely could not.” For questions 53 to 58, the responses were recoded to read 2 for “strongly agree,” 1 for “somewhat agree,” –1 for “somewhat disagree,” and –2 for “strongly disagree.” The recoding prevents distortion when computing the mean because, in general, for scaled responses people tend to choose the highest score (“definitely could” or “strongly agree”). After recoding all the questions, a mean score was computed to reflect the household ability/willingness to take action to prevent malaria infection or household knowledge about malaria. For questions on taking action, the households were then classified into two groups, the ones which are less likely to take action (score equal or less than 0) and those which are more likely to take action (score more than 0). For questions on knowledge, households were also classified into two groups (good knowledge for a score more than 0 and poor knowledge for a score equal or less than 0).
Ethical clearance
Ethical clearance for both surveys was obtained from the Institutional Review Board of the Johns Hopkins University, Baltimore, USA (baseline study number 3852; endline 5553) and the National Health Research Ethics Committee, Abuja, Nigeria.
1 Kakwani NC, Wagstaff A, van Doorslaer E: Socioeconomic inequalities in health: measurement, computation, and statistical inference. J Econometrics 1997, 77:87-103
14
EVALUATION OF COMMUNITY LLIN DISTRIBUTION, NIGERIA
Individual verbal informed consent was sought from all respondents before interviews were conducted. Before each interviewee was asked to give consent, the interviewer gave a brief description of the study objectives, the data collection procedure, the potential harm to participants, the expected benefits, and the voluntary nature of participation at all stages of the interview. In addition, consent was also sought from community representatives (chiefs). Participants were informed of the possibility that a repeat interview may be conducted by a different person to ensure data quality. They were also ensured that data would be kept confidential and would not be shared with non-project staff. Participants in the final data set were rendered anonymous by removing the variable “name” and all other information within a particular cluster that could help to identify individuals or households, and replacing these with a new numerical identification number generated to uniquely identify the individuals and the households.
15

EVALUATION OF COMMUNITY LLIN DISTRIBUTION, NIGERIA
Results
The sample
The final sample for analysis was 1015 (99.5% of target) for the base line survey and 1003 (98.3%) for the endline survey. The sampled population was 5323 at baseline and 4949 at endline with 95.3% and 98.0% of the population having stayed in the house the previous night (de-facto population) respectively.
Table 1 provides an overview over some demographic characteristics of the two survey samples. None of the indicators differed statistically significant between the two surveys 2.5 years apart, but the proportion of households with any young children and female headed households differed by 6-7 percentage-points. The proportion of children under five within the de-jure population was rather small compared to other data from the area, but consistent between the two surveys.
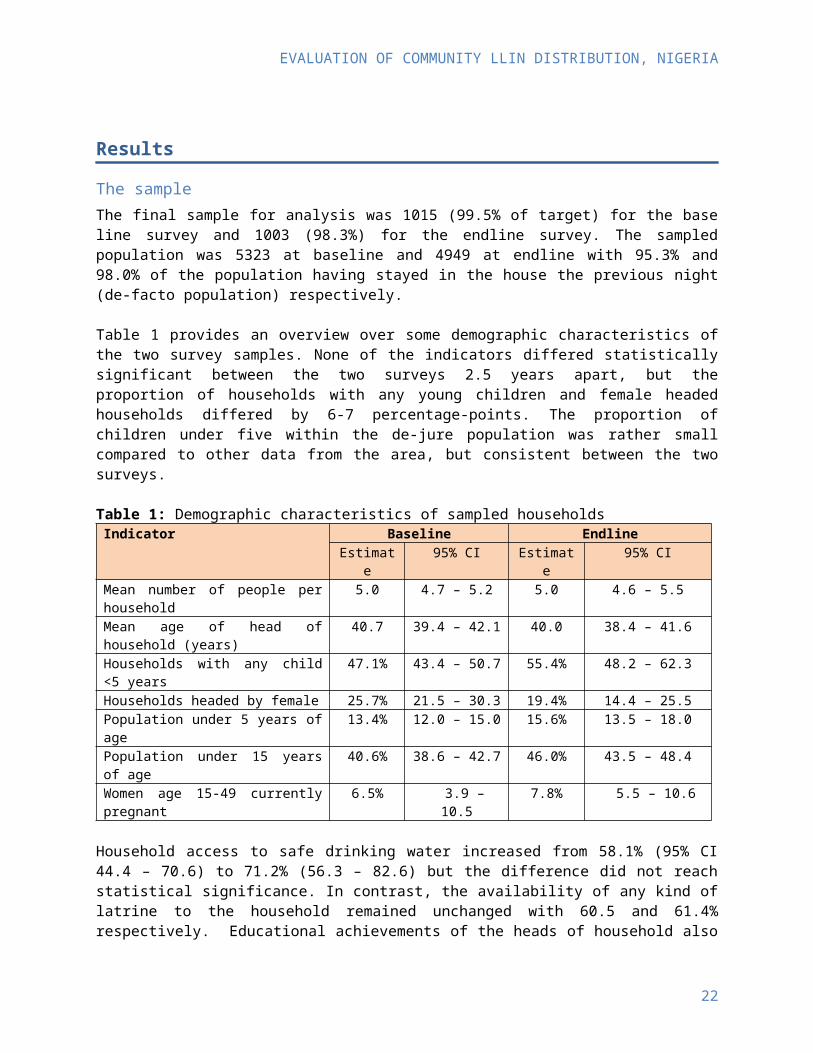
Table 1: Demographic characteristics of sampled householdsIndicator Baseline Endline
Estimate 95% CI Estimate 95% CIMean number of people per household 5.0 4.7 – 5.2 5.0 4.6 – 5.5Mean age of head of household (years) 40.7 39.4 – 42.1 40.0 38.4 – 41.6Households with any child <5 years 47.1% 43.4 – 50.7 55.4% 48.2 – 62.3Households headed by female 25.7% 21.5 – 30.3 19.4% 14.4 – 25.5Population under 5 years of age 13.4% 12.0 – 15.0 15.6% 13.5 – 18.0Population under 15 years of age 40.6% 38.6 – 42.7 46.0% 43.5 – 48.4Women age 15-49 currently pregnant 6.5% 3.9 – 10.5 7.8% 5.5 – 10.6
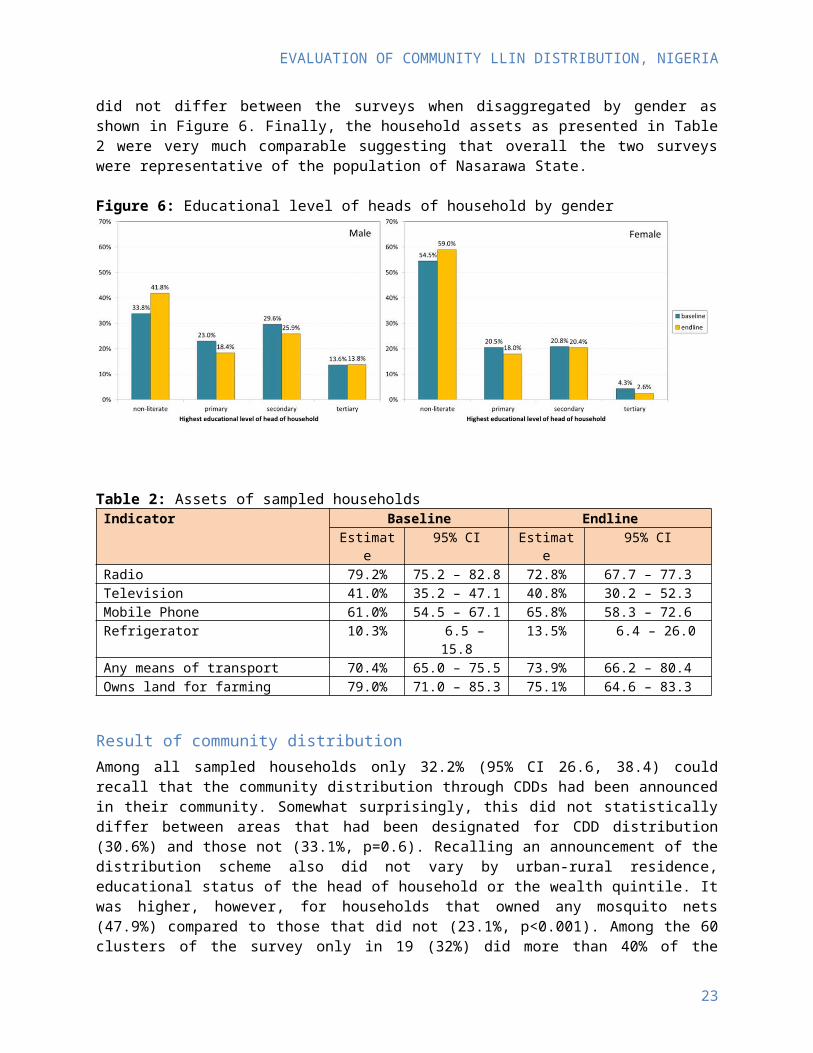
Household access to safe drinking water increased from 58.1% (95% CI 44.4 – 70.6) to 71.2% (56.3 – 82.6) but the difference did not reach statistical significance. In contrast, the availability of any kind of latrine to the household remained unchanged with 60.5 and 61.4% respectively. Educational achievements of the heads of household also did not differ between the surveys when disaggregated by gender as shown in Figure 6. Finally, the household assets as presented in Table 2 were very much comparable suggesting that overall the two surveys were representative of the population of Nasarawa State.
16
EVALUATION OF COMMUNITY LLIN DISTRIBUTION, NIGERIA
Figure 6: Educational level of heads of household by gender
Table 2: Assets of sampled households Indicator Baseline Endline
Estimate 95% CI Estimate 95% CIRadio 79.2% 75.2 – 82.8 72.8% 67.7 – 77.3Television 41.0% 35.2 – 47.1 40.8% 30.2 – 52.3Mobile Phone 61.0% 54.5 – 67.1 65.8% 58.3 – 72.6Refrigerator 10.3% 6.5 – 15.8 13.5% 6.4 – 26.0Any means of transport 70.4% 65.0 – 75.5 73.9% 66.2 – 80.4Owns land for farming 79.0% 71.0 – 85.3 75.1% 64.6 – 83.3
Result of community distribution
Among all sampled households only 32.2% (95% CI 26.6, 38.4) could recall that the community distribution through CDDs had been announced in their community. Somewhat surprisingly, this did not statistically differ between areas that had been designated for CDD distribution (30.6%) and those not (33.1%, p=0.6). Recalling an announcement of the distribution scheme also did not vary by urban-rural residence, educational status of the head of household or the wealth quintile. It was higher, however, for households that owned any mosquito nets (47.9%) compared to those that did not (23.1%, p<0.001). Among the 60 clusters of the survey only in 19 (32%) did more than 40% of the sampled households recall the CDD distribution announcement and only in 8 (13%) more than 50%. Interestingly, among those household respondents who did recall an announcement of the CDD scheme, 59.1% (48.1, 69.1) said that they also had informed others about it.
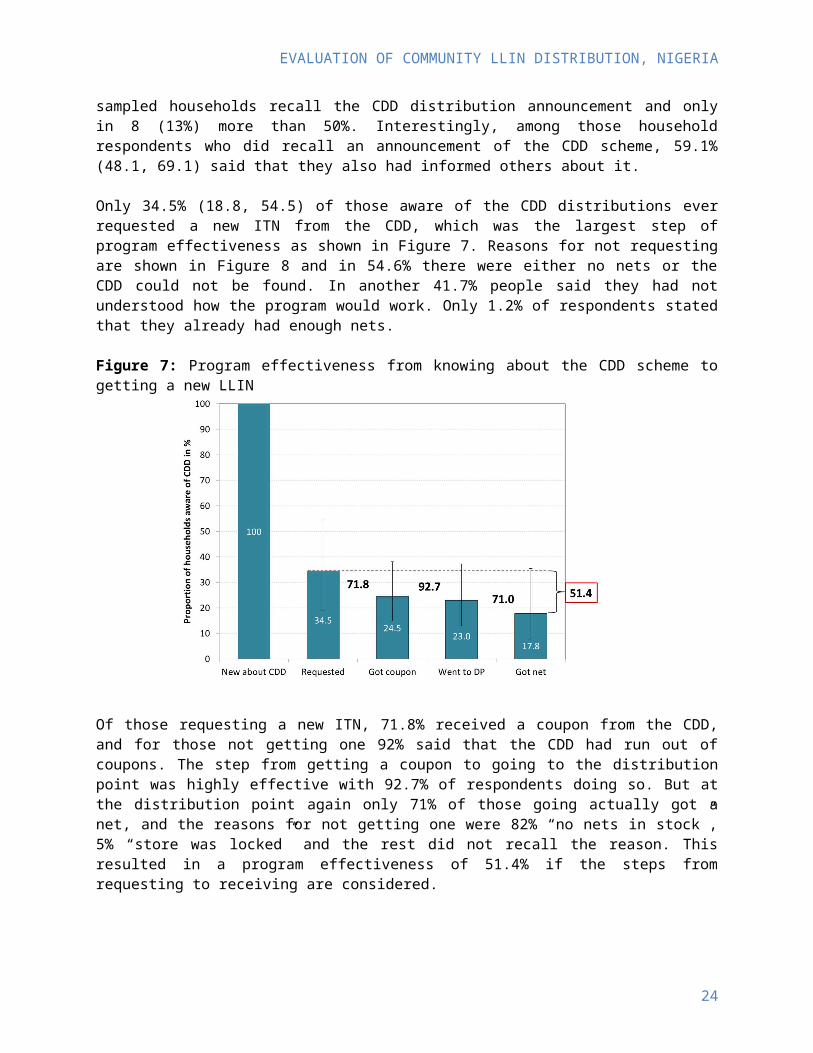
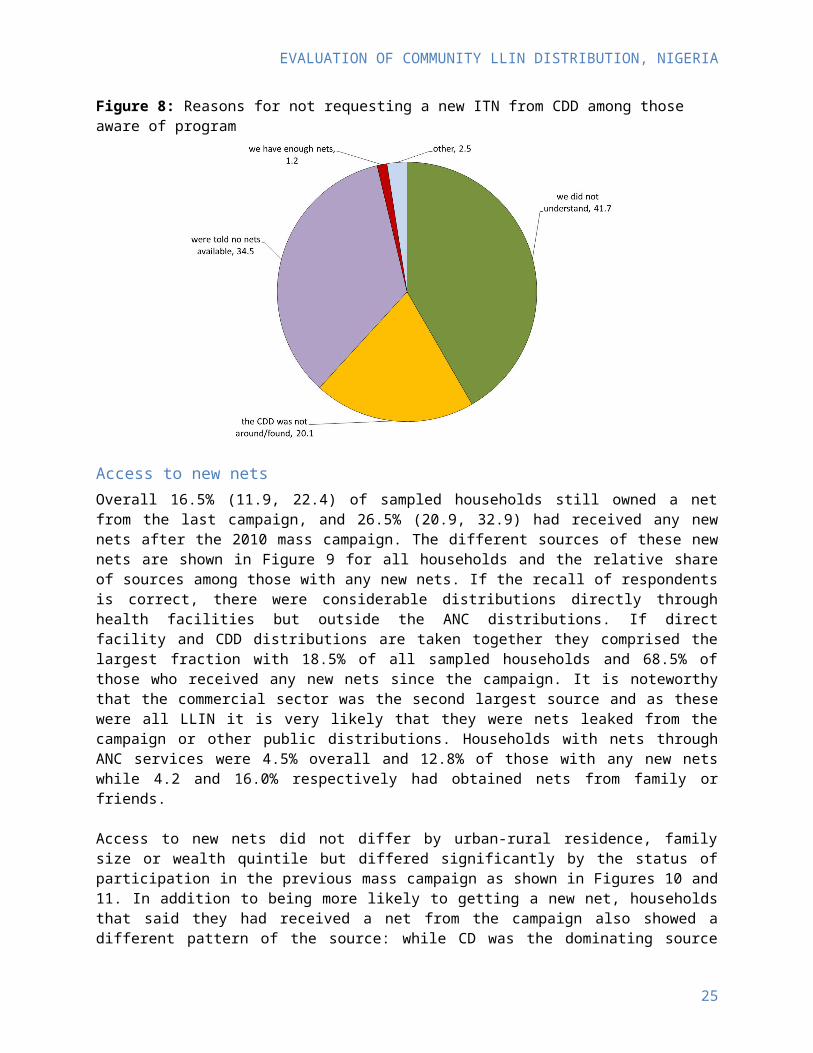
Only 34.5% (18.8, 54.5) of those aware of the CDD distributions ever requested a new ITN from the CDD, which was the largest step of program effectiveness as shown in Figure 7. Reasons for not requesting are shown in Figure 8 and in 54.6% there were either no nets or the CDD could not be found. In another 41.7% people said they had not understood how the program would work. Only 1.2% of respondents stated that they already had enough nets.
17
EVALUATION OF COMMUNITY LLIN DISTRIBUTION, NIGERIA
Figure 7: Program effectiveness from knowing about the CDD scheme to getting a new LLIN
Of those requesting a new ITN, 71.8% received a coupon from the CDD, and for those not getting one 92% said that the CDD had run out of coupons. The step from getting a coupon to going to the distribution point was highly effective with 92.7% of respondents doing so. But at the distribution point again only 71% of those going actually got a net, and the reasons for not getting one were 82% “no nets in stock”, 5% “store was locked” and the rest did not recall the reason. This resulted in a program effectiveness of 51.4% if the steps from requesting to receiving are considered.
Figure 8: Reasons for not requesting a new ITN from CDD among those aware of program
Access to new nets
18
EVALUATION OF COMMUNITY LLIN DISTRIBUTION, NIGERIA
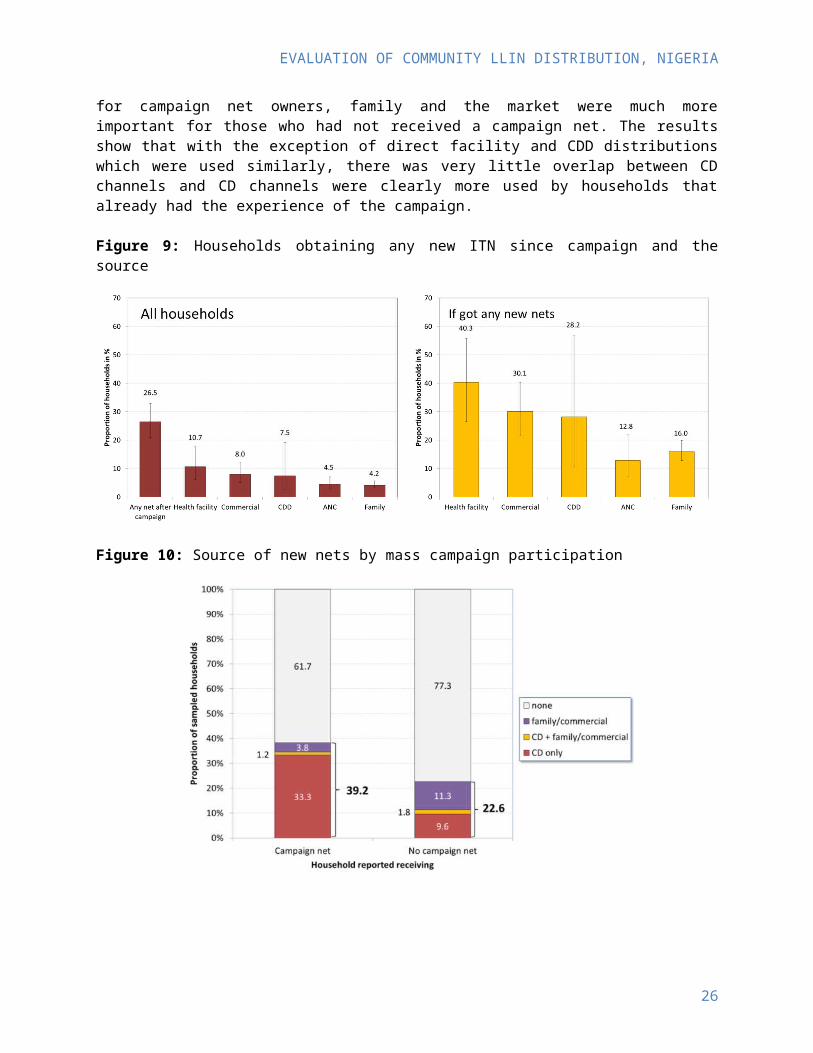
Overall 16.5% (11.9, 22.4) of sampled households still owned a net from the last campaign, and 26.5% (20.9, 32.9) had received any new nets after the 2010 mass campaign. The different sources of these new nets are shown in Figure 9 for all households and the relative share of sources among those with any new nets. If the recall of respondents is correct, there were considerable distributions directly through health facilities but outside the ANC distributions. If direct facility and CDD distributions are taken together they comprised the largest fraction with 18.5% of all sampled households and 68.5% of those who received any new nets since the campaign. It is noteworthy that the commercial sector was the second largest source and as these were all LLIN it is very likely that they were nets leaked from the campaign or other public distributions. Households with nets through ANC services were 4.5% overall and 12.8% of those with any new nets while 4.2 and 16.0% respectively had obtained nets from family or friends.
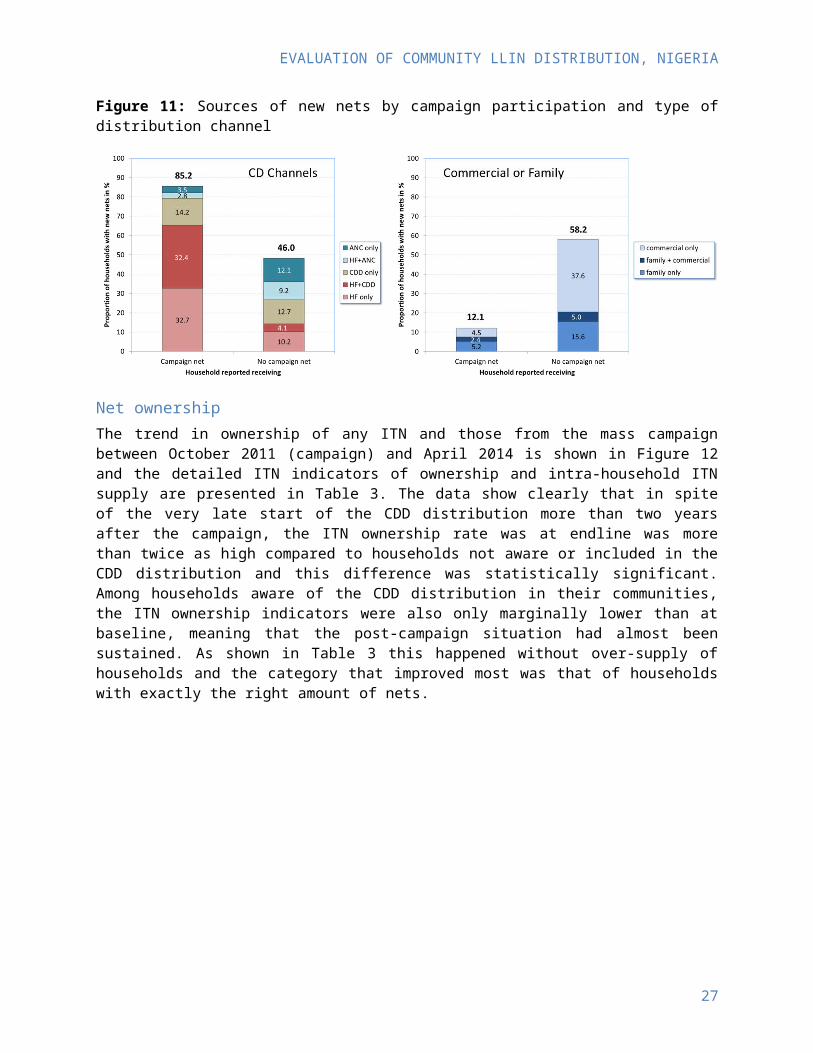
Access to new nets did not differ by urban-rural residence, family size or wealth quintile but differed significantly by the status of participation in the previous mass campaign as shown in Figures 10 and 11. In addition to being more likely to getting a new net, households that said they had received a net from the campaign also showed a different pattern of the source: while CD was the dominating source for campaign net owners, family and the market were much more important for those who had not received a campaign net. The results show that with the exception of direct facility and CDD distributions which were used similarly, there was very little overlap between CD channels and CD channels were clearly more used by households that already had the experience of the campaign.
Figure 9: Households obtaining any new ITN since campaign and the source
19
EVALUATION OF COMMUNITY LLIN DISTRIBUTION, NIGERIA
Figure 10: Source of new nets by mass campaign participation
Figure 11: Sources of new nets by campaign participation and type of distribution channel
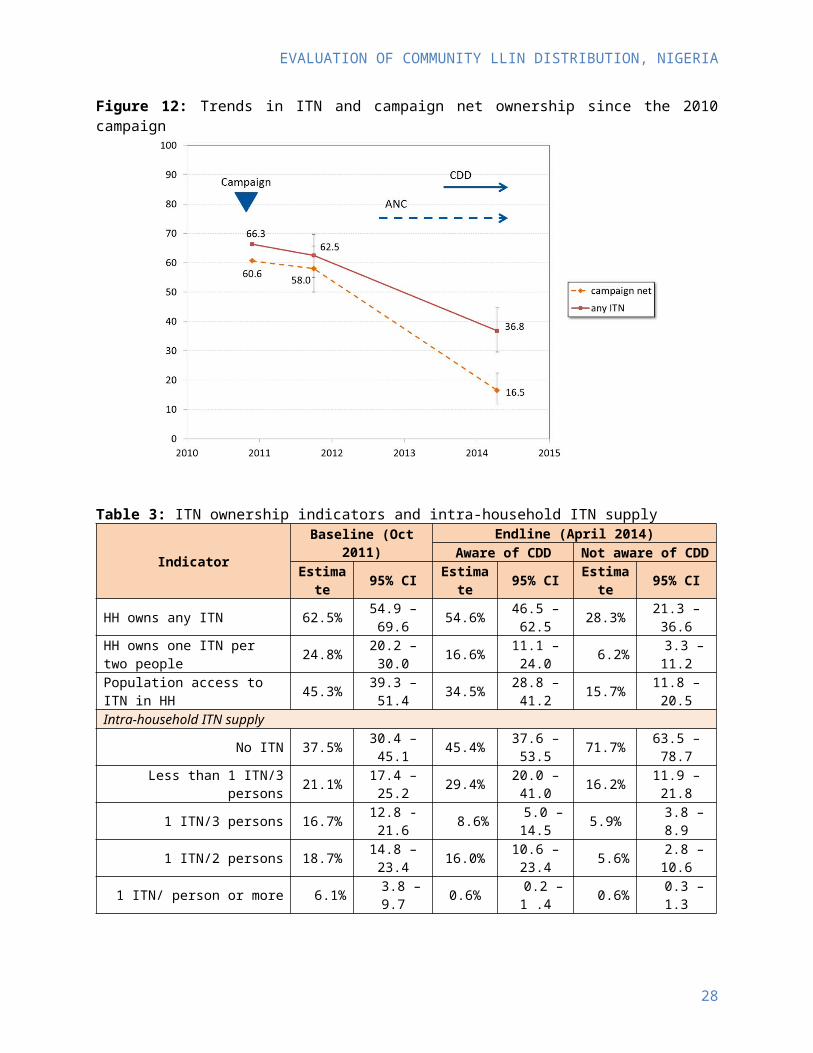
Net ownershipThe trend in ownership of any ITN and those from the mass campaign between October 2011 (campaign) and April 2014 is shown in Figure 12 and the detailed ITN indicators of ownership and intra-household ITN supply are presented in Table 3. The data show clearly that in spite of the very late start of the CDD distribution more than two years after the campaign, the ITN ownership rate was at endline was more than twice as high compared to households not aware or included in the CDD distribution and this difference was statistically significant. Among households aware of the CDD distribution in their communities, the ITN ownership indicators were also only marginally lower than at baseline, meaning that the post-campaign situation had almost been sustained. As shown in Table 3 this happened without over-supply of households and the category that improved most was that of households with exactly the right amount of nets.
20
EVALUATION OF COMMUNITY LLIN DISTRIBUTION, NIGERIA
Figure 12: Trends in ITN and campaign net ownership since the 2010 campaign
Table 3: ITN ownership indicators and intra-household ITN supply
Indicator Baseline (Oct 2011) Endline (April 2014)Aware of CDD Not aware of CDD
Estimate 95% CI Estimate 95% CI Estimate 95% CIHH owns any ITN 62.5% 54.9 – 69.6 54.6% 46.5 – 62.5 28.3% 21.3 – 36.6HH owns one ITN per two people 24.8% 20.2 – 30.0 16.6% 11.1 – 24.0 6.2% 3.3 – 11.2Population access to ITN in HH 45.3% 39.3 – 51.4 34.5% 28.8 – 41.2 15.7% 11.8 – 20.5Intra-household ITN supply
No ITN 37.5% 30.4 – 45.1 45.4% 37.6 – 53.5 71.7% 63.5 – 78.7Less than 1 ITN/3 persons 21.1% 17.4 – 25.2 29.4% 20.0 – 41.0 16.2% 11.9 – 21.8
1 ITN/3 persons 16.7% 12.8 -21.6 8.6% 5.0 – 14.5 5.9% 3.8 – 8.91 ITN/2 persons 18.7% 14.8 – 23.4 16.0% 10.6 – 23.4 5.6% 2.8 – 10.6
1 ITN/ person or more 6.1% 3.8 – 9.7 0.6% 0.2 – 1 .4 0.6% 0.3 – 1.3
Equity aspectsThe equity of distributions was first assessed by the concentration or Lorenz curves for ownership of any ITN and the population access to an ITN within the household (Figure 13). These curves plot the cumulative distribution of wealth quintiles in the overall sample against the cumulative distribution of wealth quintiles in the sub-sample of interest (here ITN ownership). If these distributions are exactly the same, i.e. if there is perfect equity, the resulting curve is identical with the equity line. A curve below (or to the right) of the equity line indicates a pro-rich inequity and above (or to the left) a pro-poor inequity. As can be seen in Figure 13 equity at baseline, i.e. approximately 11 months after the mass campaign, was highly equitable. At endline the curves suggest a slight pro-rich inequity for ownership of any ITN which was, however, less pronounced among households aware of the CDD distribution. For population access to ITN within the household the curves were similar, but the pro-rich inequity somewhat more pronounced and the difference between CDD and non CDD distribution areas was less.
21
EVALUATION OF COMMUNITY LLIN DISTRIBUTION, NIGERIA
Table 4 shows the equity situation expressed as concentration indices which is just a composite way to express the data of the Lorenz curve in a single value. Here 0 represents perfect equity, -1 maximum pro-poor inequity and +1 maximum pro-rich inequity. As can be seen, the indices show the same situation as described above.
Figure 13: Concentration curve (Lorenz curve) for any ITN ownership and population access to ITN
Table 4: Concentration indices for net ownership and access
Indicator Baseline (Oct 2011) Endline (April 2014)Aware of CDD Not aware of CDD
Index 95% CI Index 95% CI Index 95% CIHH owns any ITN 0.012 0.001 – 0.024 0.050 -0.014 – 0.114 0.121 0.055 – 0.187Population access to ITN in HH -0.001 -0.019 – 0.017 0.126 0.086 – 0.167 0.152 0.110 – 0.194
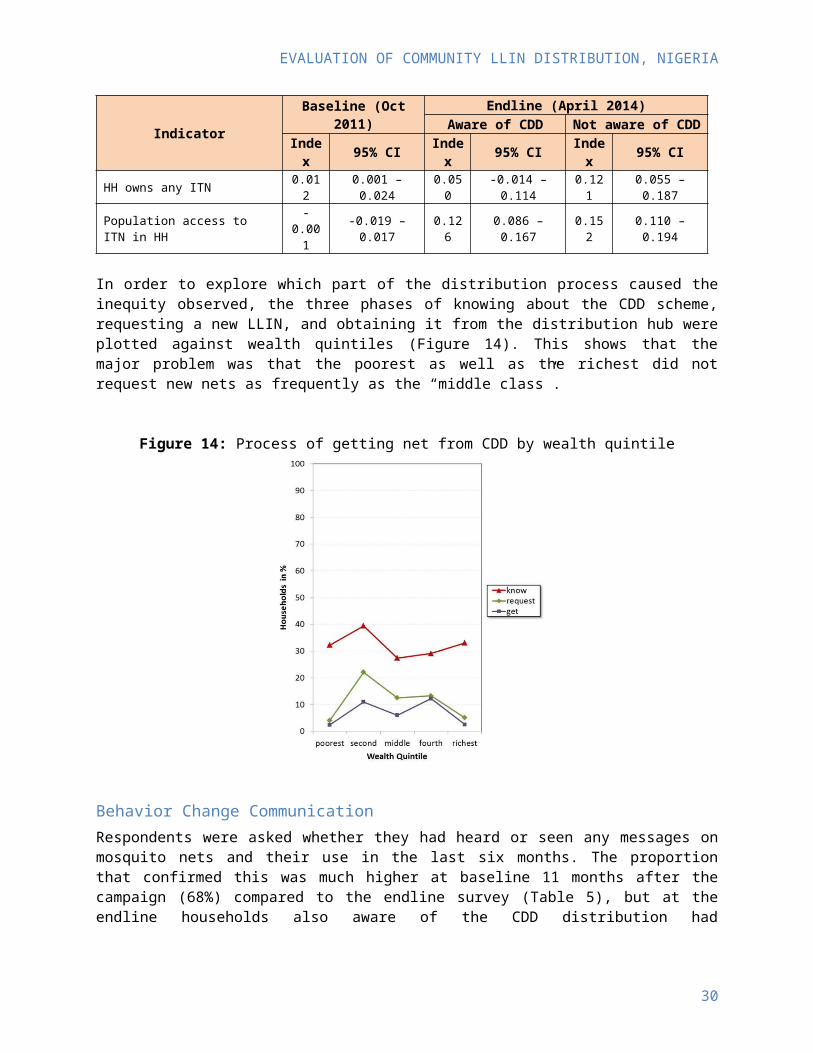
In order to explore which part of the distribution process caused the inequity observed, the three phases of knowing about the CDD scheme, requesting a new LLIN, and obtaining it from the distribution hub were plotted against wealth quintiles (Figure 14). This shows that the major problem was that the poorest as well as the richest did not request new nets as frequently as the “middle class”.
22
EVALUATION OF COMMUNITY LLIN DISTRIBUTION, NIGERIA
Figure 14: Process of getting net from CDD by wealth quintile
Behavior Change Communication
Respondents were asked whether they had heard or seen any messages on mosquito nets and their use in the last six months. The proportion that confirmed this was much higher at baseline 11 months after the campaign (68%) compared to the endline survey (Table 5), but at the endline households also aware of the CDD distribution had significantly higher BCC exposure (49%) than those unaware (27%, p<0.05).
On average respondents that were exposed to BCC recalled between one and two different information sources (mean 1.4) and this did not differ between the surveys or the CDD distribution and non-distribution. The information sources mentioned are presented in Figure 15 and show that 11 months after the campaign, health workers were the most common source of net related messages while in 2014 messages through radio were most common. There was a strong correlation between the number of information sources mentioned and the number of messages recalled and this was true for both surveys (p<0.0001). The most commonly recalled messages are shown in Figure 16. They were generally similar between the surveys with messages on net use and hang-up recalled most, but at the endline survey messages on net care and the malaria prevention aspects were more often recalled than at baseline. This latter is explained by the Nasarawa net care and repair BCC campaign that had been ongoing in 2013-2014, in portions of the state.
Table 5: Exposure to BCC messages last six months and household attitude towards net use
Indicator Baseline (Oct 2011) Endline (April 2014)Aware of CDD Not aware of CDD
Estimate 95% CI Estimate 95% CI Estimate 95% CIHeard any message about nets 67.7% 60.2 – 74.4 48.5% 39.4 – 57.7 26.6% 19.8 – 34.8Discussed net use in family
No BCC exposureBCC exposure
40.5%81.8%
33.0 – 48.576.6 – 86.0
63.3%81.1%
52.0 – 73.369.2 – 89.2
29.2%58.7%
20.8 – 39.342.8 – 73.0
Intends to use nets most nightsNo BCC exposure 68.0% 56.2 – 77.9 47.2% 32.6 – 62.4 41.9% 33.1 – 51.2
23
EVALUATION OF COMMUNITY LLIN DISTRIBUTION, NIGERIA
BCC exposure 85.8% 81.2 – 89.1 54.7% 36.8 – 71.5 41.6% 29.3 – 54.9
Figure 15: Sources of information (%) among respondents with BCC exposure
Figure 16: Frequency (%) of specific message recall if BCC exposure
From the series of questions on the respondent’s confidence to take action to protect the family with nets an “action score” was constructed (details see methods) and households were categorized as “very confident” which is equivalent to responding to all questions with agreement or strong agreement. When the source of nets of households that had been aware of the CDD distribution was compared between those “very confident” and those “less confident” it showed that for the ANC channel and nets from family or the commercial sector the difference between these groups was relatively small (Figure 17). But for the CDD and health facility channels very confident households were five times as likely to have obtained a new net through these channels. It is, however, not clear from the data whether they got the nets through these channels because they were confident or whether they were confident because they had gotten the nets.
24
EVALUATION OF COMMUNITY LLIN DISTRIBUTION, NIGERIA
Figure 17: Access to new ITN from different channels among households aware of CDD program by action score (less confident=<1.5, very confident ≥1.5)
Net useThe proportion of the de-facto population that used an ITN the night before the survey decreased from 32% at baseline to 8.9% at endline but in 2014 the use rate was significantly higher in the CDD distribution are compared to non-CDD distribution with 17% vs, 5%. There are two main reasons for this decline, first, the lower ITN ownership and access (see Table 3) and the fact that the endline survey was done at the end of the dry season when use tends to be lowest compared to the baseline which was done at the end of the rains (see Figure 5). As shown in Table 6, the seasonal use pattern resulted in a lower proportion of those that could have used an ITN (access) actually using it. In other words the behavior linked “use gap” increased from 39.3% at baseline to 59.5% at endline, but was somewhat lower in the CDD distribution area (50.6% vs. 69.4%) even though the difference did not quite reach statistical significance (p=0.13).
Table 6: ITN use last night and ITN use if access to ITN
Indicator Baseline (Oct 2011) Endline (April 2014)Aware of CDD Not aware of CDD
Estimate 95% CI Estimate 95% CI Estimate 95% CIUsed an ITN last night 32.0% 27.7 – 36.6 17.2% 10.3 – 27.3 4.8% 2.8 – 8.1Used ITN if access 70.7% 65.8 – 75.2 49.4% 30.6 – 68.4 30.6% 19.7 – 44.3
An analysis of ITN use by age group is presented in Figure 18 looking only at households with enough ITN for all members, so that behavioral aspects of use are not obscured by lack of ownership. This demonstrates that in general ITN use at baseline, i.e. at the end of the rains, was quite evenly distributed between age groups and that especially the older children and adolescents who usually exhibit a lower use rates did quite well. In contrast, at endline, i.e. at the end of the dry season, ITN use was much lower at all ages except for the under-fives which even in the dry season showed ITN use rates close to what had been seen in the rainy season.
25
EVALUATION OF COMMUNITY LLIN DISTRIBUTION, NIGERIA
Figure 18: ITN use by age group among households with enough ITN for all members
Finally, the source of the nets used by different age groups was explored to see which age groups used which nets and results are presented in Figure 19. The first finding is that nets from ANC services were primarily used by children under five and older children age 10-19 years, while CDD nets seem to have filled the gaps for the rest of this age group and for adults age 40-59. Children under 10 and adults 20-39 were predominantly covered by campaign nets and people above 60 years of age almost exclusively used nets from the campaign. Due to the small number of actual users it was not possible to also disaggregate by gender.
Figure 19: Sources of ITN used by net users at endline survey by age
26
EVALUATION OF COMMUNITY LLIN DISTRIBUTION, NIGERIA
Discussion
The primary purpose of this pilot community-based distribution of LLIN in Nasarawa State, Nigeria, was to show proof of principle for a functioning push-pull continuous distribution channel. In evaluating the outcomes one first has to consider the context of implementation of the pilot which included a number of factors that did not favor positive results:
The implementation of the pilot was delayed by several months and did not start until June 2013, 31 months after the mass distribution of LLIN. This only left ten months of implementation until the endline survey which was driven by the end of funding for the project.
Even during the implementation phase there were several stock-outs of LLIN from the central system as well as repeated stock-outs of the net coupons
During 2014 there were civil disturbances in many parts of Nasarawa State due to ethnic conflicts which made communication with some areas difficult
The basic design of the evaluation was a before-after comparison using a state-representative sampling approach equivalent to what is used in a DHS or MIS. Embedded in this design was an intervention-control comparison at endline between areas (Wards) earmarked for CDD distribution and those not. However, during the analysis it was found that no difference was seen between these two groups in awareness of CDD distribution, receiving new LLIN from CDD or any other major outcome. This implied that there had not been as strict a separation of these areas as anticipated, or that changes were made after the evaluation was designed. The analysis then used the actual awareness of households of the CDD distribution scheme as criterion for within endline survey comparison which can be seen as a “per protocol” analysis that still provides strong evidence, but not quite as strong as an “intention to treat” analysis would have provided.
The first major finding of the evaluation is the generally low awareness of the CDD scheme with only 32% of respondents recalling that the CDD scheme had been announced in their community, and that only 13% of the 60 surveyed communities had more than half of the sampled households aware of the CDD distribution. Although one has to consider that some respondents may have forgotten having heard the announcement 10 months earlier, these results strongly suggest that the communication about the scheme was not sufficient.
Program effectiveness, i.e. the steps from knowing about the scheme and actually getting a new LLIN was poor with only 18% of those knowing about the scheme actually obtaining a net. The biggest loss in effectiveness came from a very low rate of actually requesting new nets from the CDD (35%). This was not because people already had enough nets as this was mentioned by only 1.2% of respondents as the reason for not requesting if they knew about the distribution. The major reasons were logistical with either nets or coupons being not available (55%) or people not being clear how the scheme worked (42%). Once households had requested new nets, program effectiveness was significantly better with 51%, and here losses came again from unavailability of nets or coupons, or stores being closed when people came. The best effectiveness was seen between getting a coupon to going to the distribution point to redeem it which was 93% showing that people that understood the scheme also utilized it well. The program effectiveness in Nasarawa was generally lower due to the logistic and information deficits than had been seen in two other, similar community-based distributions which have been implemented
27
EVALUATION OF COMMUNITY LLIN DISTRIBUTION, NIGERIA
by the NetWorks project in Southern Sudan and Madagascar which had a request to receiving LLIN effectiveness of 93% and 80% respectively.
Considering the limitations outlined above, the impact of the CDD distribution on the ITN ownership indicators in the “per protocol” analysis were quite impressive as they were twice as high as in households without CDD distribution: 55% vs. 28% for any ITN ownership, 17% vs. 6% for at least one ITN for every two people in the household (enough ITN), and 35% vs. 16% for population access to ITN within the household. The rates among households aware of the CDD distribution were still lower than in the baseline survey 11 months after the campaign, but this is hardly surprising as the projections with the NetCALC tool (see Figure 2) were done assuming start of the continuous distribution within the first year after the campaign. Since this did not happen until more than two years after the campaign and a significant proportion of the population was not even aware of the CDD scheme, the LLIN distributed could not be expected to reach again the post-campaign level.
The data show, however, that the community-based distribution significantly improved the ITN coverage situation and did so without oversupplying those households it did reach and nicely complemented other LLIN distribution channels such as ANC, commercial sector and nets obtained from family or friends as there was very little overlap (see Figures 10 and 11). Furthermore, even though the distribution was not perfectly equitable as was the campaign distribution, the pro-rich inequality was not very pronounced with concentration indices not exceeding 0.15 whereas significant pro-rich inequality often is found to show indices of 0.3 or even 0.5. The major reason for the inequality could be identified as poorer households being less likely to request a new LLIN even when they knew about the CDD distribution and this issue can be addressed through BCC.
Given that the endline survey had to be conducted at the end of the dry season rather than at the end of the rains for funding reasons, it was not surprising to find a significantly lower use rate for people who had access to an ITN compared to the baseline survey which had been done at the end of the rains. Nonetheless, the use gap in households that participated in the CDD distributions and had consequently been exposed more often to ITN related messages was significantly lower compared to households not aware of the CDD scheme: of those that could have used an ITN 51% did NOT do so in the CDD group compared to 69% in the non-CDC group. This shows that the BCC linked to the community-based distribution was very effective to enhance net-use related behaviors, even though it had been insufficient to reach enough households with the knowledge and understanding about the CDD scheme.
Conclusion and Recommendations
The evaluation of this community-based distribution scheme showed that A community-based push-pull distribution system can work well to reach households missed by
the campaign, those who did not get enough nets or have lost the ones they had provided the scheme is well advertised and the logistics of supply function smoothly
These distributions do not oversupply households but help to supply just enough for all members to use ITN
There was very little overlap with other supply channels showing that these distributions complement each other in reaching all households
Community-based distribution in this setting is reasonably equitable and equity can be further improved if the poorest wealth quintile is encouraged to request new nets
28

EVALUATION OF COMMUNITY LLIN DISTRIBUTION, NIGERIA
BCC linked to the community-based distribution is an important contributor to enhance messages on ITN use resulting in better utilization by those with access
The following major recommendations can be made: Community-based distributions – like all other continuous channels – need to be started at least
within one year following a successful mass LLIN campaign which implies that preparations should always start even before the campaign takes place
Informing the population about the distribution scheme and carefully explaining how it works is critical and must be emphasized during roll-out as this will a the most important step to achieve high program effectiveness
Special attention should be paid to involving the poorest households to ensure that they feel encouraged to participate in the scheme
Logistics systems need to function smoothly and all efforts should be made to avoid stock-outs of LLIN and net coupons
BCC messages supporting use of nets should always be incorporated in such distributions
29
EVALUATION OF COMMUNITY LLIN DISTRIBUTION, NIGERIA
30