commonwealth of virginia - wia annual report narrative...commonwealth of virginia - wia annual...
TRANSCRIPT

WIA Annual Report October 2012 Page 1 of 32
Commonwealth of Virginia - WIA Annual Report Narrative
Table of Contents Status of State Evaluation Activities Cost of Workforce Investment Activities Approved Waivers Uniform Reporting Participants in the Workforce Investment System Unique programs and recent accomplishments Activities funded by the state’s discretionary funds Programs and strategies for serving employers at the state and local level Performance Improvement Strategies outlined in the WIA/WP State Plan Performance Data

WIA Annual Report October 2012 Page 2 of 32
Status of State Evaluation Activities Information on the status of state evaluation activities. State Evaluation Details
State Programs Community College Workforce
Alliance Wellmont Foundation
The timeline for starting and completing the evaluation;
a team from the VCCS system office conducted an on-site visit in May 2011
An on-site monitoring visit was completed by our evaluation team on March 23, 2012,
The questions the evaluation will/did address;
to review WIA funds for Career Readiness Certificate efforts.
to evaluate fiscal and programmatic compliance for the Appalachian Mountain Healthcare Workforce Development Initiative.
A description of the evaluation’s methodology, including description of any control or comparison group and description of the analysis techniques employed;
The team consisted of the Resource Administrator, the Asst. Vice Chancellor of Research and Evaluation, the lead program manager of the CRC initiative, and a monitor staff member.
The team consisted of the Asst. Vice Chancellor of Research and Evaluation and a monitor staff member. The review included an evaluation of all reimbursement requests, payments to participating community colleges, and students who received the grant awards.
The timeline for the final report and other deliverables; and
On October 26th, CCWA provided a corrective action plan that highlighted how it addressed the issues outlined in the review and provided appropriate documentation for certain findings.
The grantee was encouraged to continue follow-up efforts in order to collect employment outcome information on all program graduates.
Summary of evaluation findings, including a summary of best practices, for those evaluations completed during the program year for which the WIA Annual report is being submitted.
The review included several findings that required corrective action for CCWA in areas related to monitoring of sub-recipients, signed MOU’s with sub-recipients, approval of invoices, unallowable costs, and use of time sheets for tracking personnel time
The team’s review indicated no compliance findings in the use of awarded funds. The program goal of providing healthcare scholarships to 50 low-income students was exceeded by 13, and as of the review date, 23 students had employment offers.

WIA Annual Report October 2012 Page 3 of 32
Cost of Workforce Investment Activities Virginia is committed to analyzing information on the cost of workforce investment activities relative to the effect of the activities on the performance of participants. To that end, we have contracted with a joint research team from the University of Virginia and Virginia Commonwealth University to conduct a return on investment study (ROI) for the workforce development system. Two primary questions for investigation are: What is the return to taxpayers for their investment in providing public workforce development services to participants in workforce development programs? And, what specific impact does each workforce related service have on earnings and educational outcomes? The purpose of the ROI calculation is to compare the costs of an intervention with the value of its results. The value is determined by converting measurable outcomes into dollars, such as savings and profit margins. The ROI model that will be used for his study includes a social dimension, as well as matching and regression techniques. The study is currently underway, however, the research team is in the initial phases of the project and results are not available for inclusion in this report. Uniform Reporting Virginia hereby assures that all required elements are reported uniformly so that a state-by-state comparison can be made. Participants in the Workforce Investment System This section provides select information on participants in the workforce investment system (this information is also included in the performance results portion of the Annual Report). Approximately _176,726 WIA participants were served during PY2011. Virginia exceeded negotiated performance levels for six adult and dislocated worker measures. Despite the difficult economic climate in many local areas, on average, 76.8% of our adult and dislocated workers were placed into employment, and 89.4% achieved retention in employment. More than 1630,014 individuals received universal/core services through a Virginia Workforce Center (one stop centers in the Commonwealth).
Population PY11 Participants Cost per Participant Adults 5,855 $1,390 Dislocated Worker 10,939 $780 Youth 3,031 $2,713 Total 19,855 $1,253
Rapid Response As noted in our previous annual report, during PY 2010, Virginia’s State Dislocated Worker Unit (DWU) transitioned from a state level service delivery to a regional model, using designated Workforce Development Community College Programs. To increase efficiency and in conjunction with the transition, virtual employee needs assessments and automated evaluation and reporting tools were developed. As a result of increased data collection, this

WIA Annual Report October 2012 Page 4 of 32
report will include services provided to those employers who filed a Worker Adjustment and retraining Notification (WARN) and those who did not (NON WARN). During PY 2011 the DWU received 68 notices in response to the Worker Adjustment and Retraining Notification (WARN) Act. The charts below provide a comparison to the previous years.
PY 11 PY10 PY09 WARN Notices 68 58 50 # of Workers affected 7331 5,648 7,520 Average # of workers per event 107 97 150
PY11 PY10 Non-WARN Businesses served 42 46 # of workers affected 1167 2793 Average # of workers per event 28 61
In accordance with WARN Act requirements, Rapid Response staff contacted company officials within 48 hours of receipt of a WARN, followed by employer briefings held with management and planned employee briefings desired by the employer. Most briefings were held before the workers left their respective companies. Employee briefings, led by one of four Regional Rapid Response Coordinators, were provided by a team of local workforce development partners who provided direct services. The Rapid Response Coordinators were instrumental in planning and resourcing Job Fairs, onsite employer resource centers, independent employer resource centers, customized transition workshops and registration for WIA and partner services. Dislocated Worker Unit Initiatives for PY 2011
• Rapid Response Summits of regional workforce and economic development partners were conducted quarterly. This facilitated the development of Forecasting Teams to aid the layoff aversion process.
• Enhanced state and regional rapid response website pages.
• The rapid response regional staff developed Regional Plans of Service in conjunction
with workforce and economic development partners.
• Modification and implementation of the Rapid Response Self-Assessment Tool
• Developed and executed Memorandum of Understanding Addendum to clarify Regional Rapid Response Program deliverables

WIA Annual Report October 2012 Page 5 of 32
Approved Waivers The summary below provides a listing of the eight (8) waivers for which Virginia has received approval, information on how the waivers have changed the activities of the state and local areas, and how activities carried out under the waivers have directly or indirectly affected state and local area performance outcomes.
Waiver Description Impact on state and local areas and activities
Impact on performance
Waiver #1 – Waiver of WIA Section 133(b)(4) to increase the allowable transfer amount between adult and dislocated worker funding streams allocated to a local area. (Transfer authority up to 50%)
Allows the state to be flexible and responsive in meeting unique needs based on changes in local and regional economic conditions.
This increased flexibility has a positive impact on adult employment and wage rates.
Waiver #2 – Waiver of WIA Section 134(a) to permit local areas to use a portion of local funds for incumbent worker training. (Up to 20% of dislocated worker funds, only where part of layoff aversion strategy).
To date, no training has been delivered with this waiver. The state is in the process of evaluating possible training options as a part of its layoff aversion strategy.
N/A
Waiver #3 – Waiver of WIA Section 134(a)(1)(A) to permit a portion of the funds reserved for rapid response activities to be used for incumbent worker training and other statewide activities.
Virginia has not identified statewide activities that would fully comply with the parameters outlined by ETA. However, identification of potential statewide activities will be conducted as a part of the Integrated WIA/W-P State Plan and layoff aversion strategy.
N/A
Waiver #4 – Waiver of the prohibition at 20CFR 664.510 on the use of Individual Training Accounts for older and out-of-school youth.
The majority of youth served under WIA are currently being trained with traditional youth strategies
The impact of the waiver on eligible youth performance is still being evaluated
Waiver #5 – Waiver to permit the State to replace the performance measure at WIA Section 136(b) with the common measures.
State and local areas have successfully implemented common measures.
VA meets or exceeds all adult measures.
Waiver #6 – Waiver of the provision at 20CFR Part 663.530 that prescribes a time limit on the period of initial eligibility for training providers.
The waiver has resulted in an increased and robust set of eligible providers than otherwise would be eligible
N/A
Waiver # 7 – Waiver of WIA section 123 requirements to competitively select providers of youth program elements which applies to section 129(c)(2)(D),(G), and (I); and 20 CFR 664.410(a)(4), (7), and (8),(9), and (10).
There have been not requests submitted to date for use of this waiver; a recent survey of youth programs revealed that at least one local area plans to submit a request under this waiver for the upcoming program year
N/A

WIA Annual Report October 2012 Page 6 of 32
Unique Programs and Recent Accomplishments The Commonwealth is pleased to share several examples of unique programs and recent accomplishments for Virginia’s Workforce Network. Northern Virginia Workforce Investment Area 11 - Fairfax SkillSource Centers
Dislocated Worker Success, Ticket-to-Work, and Career Advancement
Mrs. Smith walked into the Fairfax SkillSource Center-Reston after being laid off as a sales manager for a major furniture company. She had worked for this company for over 15 years and was back in the market with obsolete skills while receiving unemployment benefits. She realized that she could not get a job in her previous field so decided to switch careers to the medical (in-demand) field to be a Clinical Medical Assistant and was enrolled in the WIA program. Mrs. Smith successfully completed the Medical Assistant Certificate training while also completing an internship to pass the MA certificate requirements. While attending training she attended workshops, updated her resume, and networked with colleagues and friends. Shortly, after her WIA training she emailed saying “I did pass my MA Certification and am now working for George Washington University Medical Faculty Associates. I work in the Reston Hospital complex as a Medical/Minor Surgical Assistant for a team of premier ENT, Vascular and Neuro Surgeons. It is part-time for now but should soon go to full-time. I love my new team and my boss is awesome.”
Mr. Zribi was employed at Nortel in Africa as a Quality Assurance Engineer from 1993 to 1996 when he lost his eye sight. He later owned/managed "Early Bird Express" in Alexandria and most recently worked as a "Mediation Intern" with Fairfax County. He holds three (3) Masters Degrees and had not been successful finding employment after his last position ended. Mr. Zribi attended the WIA Orientation and was enrolled in April 2011. He worked with the Social Security Administrations Ticket to Work program to help secure employment. Thru the collaboration of WIA and Ticket-to-Work, he received information about an On the Job Training (OJT) Program. A participating employer, American College of Commerce and Technology, expressed an interest in hiring him as a Professor to teach Master's Level online computer training working directly as an assistant to the Online Teacher. He was hired as an “Academic Assistant” in the OJT program earning $19.00 an hour and was provided assistive technology to perform his job requirements. He retained the position after the OJT contract ended and remains employed at American College of Commerce and Technology.
Last January, Richard moved to Northern Virginia from Detroit, Michigan hoping to find a better employment opportunity. He had been making less than $12.00 an hour all his life. He was pleased with the Fairfax SkillSource Center – Alexandria and decided to take advantage of the WIA program. He continued to conduct job search activities each day with the help of the One-Stop center staff and took advantage of all employment activities. He interviewed at a company in Chantilly, Virginia called A&A Transfer. He was offered a permanent position as an equipment technician making $13.00 an hour with benefits and started July 23, 2012. Richard came by recently to let us know that he loves the new job and his supervisor is very pleased with his performance.

WIA Annual Report October 2012 Page 7 of 32
Unique Programs and Recent Accomplishments (continued) Region 2000 Workforce Investment Area 7 Return, Learn and Earn! - A job readiness training program for ex-offenders:
The “Return, Learn, and Earn!” program is a job readiness program which focuses on job search strategies specific to the ex-offender population. The six-week, one-hour per week, program helps the client restore their self-esteem, learn how to make an impression, and how to develop relationships with prospective employers to increase their odds of landing a job. Each of six modules lasts about 1 to 1 ½ hours and covers topics such as conducting a proactive job search and effective interview skills.From April 2012 through June 2012, 11 clients made 35 visits to the program. Three of those clients completed four or more overall visits during that quarter and received a certificate of completion.
“The most important thing that a job readiness program can do for someone who has been previously incarcerated is to restore their sense of worth, be reliable in supporting the client, and help the client avoid an attitude of cynicism that will deflate their motivation.”
Steve Monetti, “Return, Learn, and Earn!” presenter Success in the program has ranged from finding employment to maintaining a dialogue with the presenter while conducting an active job search. Attendees are evaluated for possible eligibility for further re-training under the Workforce Investment Act.The popularity of the program has grown with local probation and parole officers serving to promote the mission of the One-Stop Workforce Services Center to the local community.
“Many thanks for all your help. My participation in “Return, Learn, and Earn!” has helped me to secure two full time temporary positions. I will continue to seek permanent work but I am excited to be able to work a combined 60 hours weekly so that I can take care of my family and pay my bills.”
Doug -“Return, Learn, and Earn!” participant The “Blue Ridge Re-Entry Council”
Concurrent with the initiation of the “Return, Learn, and Earn!” program in the fourth quarter, the Region 2000 Workforce Services Center in Lynchburg, VA, has taken a leadership role in establishing a collaborative council as a forum of local agencies that provide services in whole or in part to the ex-offender population. Member agencies include the Department of Corrections, Social Services offices from the City of Lynchburg as well as the four surrounding counties, the Department of Aging and Rehabilitative Services, the Central Virginia Community Services Board, the Commonwealth Attorney’s Office, Goodwill Industries, the Salvation Army, and many non-profit and faith-based prison ministries. Over 70 agencies are represented and no less than 45 representatives of those

WIA Annual Report October 2012 Page 8 of 32
agencies are in attendance at every group meeting. Beyond the networking aspects of the council, goals include developing a formalized referral process, and rationalizing a resource map.
“Through the Blue Ridge Re-Entry Council I have made contact with the regional director of Oxford House, a self-directed home for those struggling with addictions, which is now another resource that I can provide to our clients!” Roger Paul, Progressive Release Director, Interfaith Outreach
Activities Funded by the State’s Discretionary Funds This section describes activities funded in whole or in part with Virginia’s 5% discretionary funds, and how those activities directly or indirectly affect performance.
• The Canon Connect Employment and Training Pipeline is a multi-agency collaboration with Canon Virginia in Newport News. The pipeline provides training and recruitment to fill 880 jobs over four years. A total of 471 technicians have been hired as a result of the work of the regional partners during the first three years.
• The Middle College Program allows individuals without a high school diploma to
increase their income and employability by simultaneously pursuing a GED, post-secondary education and a workforce certification in a college environment. To date, the Middle College program has helped more than 70 percent of active participants receive a GED, more than 50% of GED completers to enroll in a post-secondary education program, and approximately 60 percent of GED completers to earn a Career Readiness Certificate.
• The Great Expectations Program helps at-risk youth in foster care to complete high
school and prepare for college and/or employment. Across the state, 12 community colleges provide comprehensive services to at-risk foster youth, including career assessment, goal setting, education and training opportunities, life skills training, preparation for employment, tutoring, mentoring, case management and job placement or college enrollment assistance.
• The Appalachian Mountain Healthcare Workforce Development Initiative provided
training to low-income jobseekers in the Appalachian Mountain region of Southwest Virginia. This WIA funded project resulted in 63 individuals receiving necessary skills and credentials for employment and career advancement in the healthcare industry, and provides a direct route to employment with Wellmont Health System and other healthcare providers.
• WIA funding was leveraged with private grant funding to implement Career
Pathways in Virginia. This systems approach allows individuals to secure employment within a specific occupational sector and to advance over time to higher levels of education and employment in that industry. The process includes building cross agency partnerships, engaging employers to conduct gap analyses of

WIA Annual Report October 2012 Page 9 of 32
labor market needs and educational capacity, mapping support services, leveraging funding sources, and identifying outcomes and metrics.
Programs and Strategies for Serving employers at the State and Local Level The following is a discussion of programs and strategies used by the Virginia Workforce Network for serving employers at the state and local level. During the upcoming program year, in conjunction with the 5-year WIA/W-P State Plan, Virginia will develop performance metrics to measure the effectiveness of such services. GATE: Virginia Continues Integrating Entrepreneurship Development Into Public Workforce Service Delivery The Virginia Growing America Through Entrepreneurship (GATE) initiative, awarded to the Virginia Community College System in 2009 ended in June 2012. This initiative, one of four sites in the nation selected for the GATE II efforts funded by Labor’s Employment and Training Administration, focused on entrepreneurship development for older dislocated workers (45 years plus) in two regions, Northern Virginia and Greater Richmond. The completed project resulted in the creation of over 158 new small businesses in Northern Virginia and Richmond and has set the stage for the public workforce system to have an important role in entrepreneurship development throughout the Commonwealth of Virginia. Also in June 2012, the SkillSource Group, Inc. (the non-profit arm of the Northern Virginia Workforce Investment Board, Area #11) was awarded $8,355,590 through the U.S. Department of Labor's (USDOL) National Workforce Innovation Fund to lead a collaborative effort with the Capital Region Workforce Partnership (Area #9) in Richmond and Opportunity, Inc. (Area #16) in Virginia Beach and Norfolk. The Virginia Employment Through Entrepreneurship Consortium (VETEC) will provide 1,000 adult and dislocated workers (a minimum of at least 20% will be veterans) eligible for Workforce Investment Act (WIA) services with comprehensive entrepreneurial training and technical assistance over the 52 month grant to directly assist with new job creation and small business growth. The Virginia Consortium was one of 26 sites selected in the United States for this project. The VETEC grant expanded current USDOL-funded efforts in Northern Virginia and Richmond, to the Norfolk region and target new small business development. This effort will seek to integrate entrepreneurship services within the public workforce system to enable hundreds of job seekers to grow assets and attain long-term self-sufficiency through self-employment. The VETEC Project will target all WIA-eligible adults and dislocated workers, ages 18 years and older. Along with the three regional workforce boards, the other Consortium partner organizations include the Virginia Community College System, Northern Virginia Community College, the Community College Workforce Alliance, Tidewater Community College, Old Dominion University, the Fairfax County Department of Family Services, the Business Development Assistance Group, and IMPAQ, International. The GATE initiative will allows the U.S. Department of Labor to effectively measure and evaluate the impact the public workforce system has on supporting all WIA-eligible job

WIA Annual Report October 2012 Page 10 of 32
seekers to consider entrepreneurship and to start their own business. The Consortium effort also provides a model that can be replicated in other Virginia workforce areas and throughout the United States. Performance Improvement Strategies outlined in the WIA/WP State Plan Several initiatives and activities are outlined in Virginia’s WIA and Wagner-Peyser Act State Strategic Plan to improve performance. State performance accountability system Virginia has taken several steps to develop a state performance and accountability system that goes beyond federal reporting requirements. This includes the development of a longitudinal data system that comprises both education and workforce data, the development of a WIA scorecard with additional metrics focused on costs per participant and training outcomes, and the planned development of a workforce system scorecard. The Virginia Longitudinal Data System (VLDS) is a joint initiative of workforce and education partners to develop a longitudinal system that allows access to data for research and reporting while maintaining the security and confidentiality of the data. The system is based on a federated data system model that de-identifies data in a two-step process to ensure that matched data sets across agencies cannot be re-identified. The goal of the system is to enable agencies and researches to merge data across programs and agencies to identify methods to improve program performance. The Virginia Community College System, the State Council for Higher Education in Virginia, the Virginia Employment Commission, and the Virginia Department of Education recently entered into a contract with the University of Virginia and Virginia Commonwealth University to conduct a study related to return on investment for workforce programs using the VLDS data. This study is expected to be completed in the summer of 2013 and will provide a framework to replicate in the future. Outcomes of the ROI study are expected to be incorporated into the scorecards discussed below. In addition to longitudinal data, Virginia is also working to develop scorecards for WIA programs and for the workforce system. Through the work of the Virginia Workforce Council, sample scorecards have been developed and presented to relevant committees and are expected to be finalized in November 2012. The WIA program data will provide outcome data related to the common measures but includes additional metrics related to credential attainment, Career Readiness Certificate Attainment, employment in related training occupations and average costs per participant data. Additional measures are expected to be added related to employer services and customer satisfaction in the coming year. Data will be provided for Virginia and by each local workforce area to identify areas of improvement. The system scorecard focuses on training related outcomes for secondary and postsecondary, as well as, employment development data related economic indicators
WIA Annual Report October 2012 Page 11 of 32
and job growth. In addition, one metric focuses specifically on STEM-H occupations and training to ensure that participants receive critical training for jobs that are in demand. Use of wage record information to measure performance progress Virginia employs multiple strategies to provide and use quarterly wage records information. First, state wage record information is shared with several agencies to meet federal, state and local performance requirements. The VEC has data sharing agreements provide state wage record matches for reporting of wage and earning outcomes for the Wagner-Peyser, WIA, Trade Act, DVOP, LVER, Adult Education, postsecondary Carl D. Perkins, Vocational Rehabilitation, Supplemental Nutrition Assistance Program Employment and Training Program (SNAP) and TANF programs. Local areas also have the ability to access wage information after entering into a data sharing agreement with the VEC. Second, Virginia also participates in two national programs related to wage records exchanges. The first is the Wage Records Interchange System (WRIS), which provides data to other states for the purposes of meeting federal DOL reporting requirements. Federal DOL programs listed above also received data from other states as part of this exchange to meet their reporting requirements. The second is the Federal Employment Data Exchanges Services (FEDES) which allows Virginia to access select federal employment records. Last, as part of Virginia’s Longitudinal Data System (VLDS) development, the VEC will be providing wage record data to interface initially with secondary and postsecondary data. Additional programs, such as WIA, Trade, SNAP, TANF, VR and registered apprenticeship are expected to be available in the summer of 2013. The VLDS utilizes a customized de-identification process to allow access to sensitive data while maintaining data confidentiality. Alignment of Service Delivery The Governor established a senior administration leadership position in 2010 to ensure service delivery alignment throughout the state in accordance with the goals and strategies in the Governor’s Workforce Development Strategic Plan, to include the following.
• Aligning workforce development with economic development strategies • Aligning job demand and workforce development efforts • Increasing the use of Career Pathways Programs, including apprenticeship, on-
the-job training and other “Earn While You Learn” models • Improving policy development and performance reporting • Expanding teaching of economics in high school • Expediting veterans and military into healthcare and technology workforce, and • Fully funding non-credit courses at community colleges

WIA Annual Report October 2012 Page 12 of 32
Fully integrated service delivery that includes co-location of mandatory and optional partner programs is encouraged in Virginia. In such centers, the One-stop Center operator leads the partner management team, and all programs share costs for common services and operations. Under the Virginia Workforce Council Minimum Standards for One-stop Centers, Wagner-Peyser services are required to be physically located on site in any certified comprehensive one-stop center. This document also specifies what partner services are to be physically located, and what others are to provide information at the center with referral to direct services available. The Virginia Employment Commission (VEC), the state agency for Wagner-Peyser programs, maintains a physical presence in all comprehensive one-stop centers in Virginia, and as such, Wagner-Peyser funds contribute greatly to service provision and shared operational costs.
Career Pathways To date, regional career pathways systems in Virginia are targeting populations from middle school students to displaced workers to prepare them for careers in high performance manufacturing, allied health, and energy. Building upon this foundation, a portion of WIA Incentive Awards issued during the program year was used to fund two $75,000 grants to foster local coordination. Region 2000 and the Greater Peninsula will focus on improving local performance through initiatives that support career pathways: including development of a comprehensive career pathway information portal for WIA Youth participants, a Future Focus Expo to connect youth to employers and education and training leading to career placement, an in school Youth Career Café, and an out of school youth Middle College, or bridge program, serving low skilled, low wage young adults without a high school diploma that will prepare participants for the GED, postsecondary education, and careers in the allied health sector. Continued coordination and partnerships with economic development on a state and local level to broaden employer contacts and view economic development are also critical to business service development and a multi-regional effort. For example, the partnership with the Virginia Department of Business Assistance brings leveraged resources with programs like, The Virginia Jobs Investment Program (VJIP). VJIP is one of Virginia's most actively used economic development incentives. The program encourages the expansion of existing Virginia businesses and start-up of new business operations in Virginia. It specifically addresses the top concerns of existing businesses and economic development prospects – finding and developing a skilled workforce. VJIP exists to support private sector job creation. It helps offset recruiting and training costs incurred by companies that are either creating new jobs or implementing technological upgrades.

WIA Annual Report October 2012 Page 13 of 32
Strategies to Improve Youth Program Performance Beginning in April 2010, state staff began a capacity building effort to educate all local areas on the common measures. This included two regional one-day trainings. Over 140 individuals attended the training sessions and included WIB directors, one-stop operators, service providers, and case managers. In addition, follow-up training sessions were conducted at all 15 LWIAs in PY 2010 and 2011. The sessions covered (1) overall definitions and mechanics of the measures and the (2) use of the Virginia’s virtual one-stop system the Virginia Workforce Connection (VaWC) to capture the data and consequences not capturing data. These meetings with all youth service providers provided the opportunity to discuss the new youth measures and ensure that providers understood the significant changes in program design that must occur to ensure that Virginia meets the proposed targets for the program. State staff committed to continuing these efforts with the focus on (1) raising awareness of the importance of the measures and (2) emphasizing the consequences if targets are not met. This included one-on-one meetings, site visits and consultation at all levels including WIB staff, service provider staff from a technical and program perspective. The technical component refers to understanding the mechanics of the measures, such as what individuals are included in the measures, how the measures are counted, how the data are captured in the system, and when the measures are calculated. The program perspective refers to the areas of overall program management, delivery and design. This work entailed intense discussions with WIB staff and Service Providers that consisted of:
• Review of causes/reasons for failed outcomes • Strategies to correct the deficiencies/failures:
o These strategies must show actions that will be taken to impact areas such as program intensity, program design framework and the ten elements – direct link to common measures (successful outcomes)
o Strategies to sustain a programmatic process that ensures/produces successful outcomes for participants
o Provided spreadsheets that enabled their ability to track in real time the requirements for literacy numeracy (see attachment).
• Negotiations with the Department of Education – Adult Education Division to arrange for all LWIAs staff in our youth programs is to get TABE certification training through the Virginia Adult Learning Resource Center’s TABE Certification Training Online and TABE Certification Training Online Refresher course.
This process began showing improvement in performance between PY 2009, 2010 and 2011 (see Tables). We will continue visits and discussions until all LWIAs achieved their negotiated performance outcomes. This improvement must be evidenced by quarterly and annual performance reports.

WIA Annual Report October 2012 Page 14 of 32
Performance Data This section presents Virginia’s performance data on the core measures, including progress of local areas in the state in achieving local performance measures. II. Table Section
Table B-Adult Program Results
Reported Information
Negotiated Performance Level
Actual Performance Level
Entered Employment Rate
74.0 67.7 1,611 2,379
Employment Retention Rate
82.0 84.3 1,876 2,225
Average Earnings
$10,500 11,450.9 20,783,402 1,815
Employment & Credential Rate
61.0 50.5 1,098 2,176
Table C-Outcomes for Adult Special Populations
Reported Information
Public Assistance Recipients Receiving Intensive or Training
Services
Veterans Individuals with Disabilities
Older Individuals
Entered Employment Rate
69.1 891
67.4 122 42.0 34 67.2 119
1,289
181 81 177
Employment Retention Rate
82.0 909
78.6 103 73.0 27 76.5 91
1,108
131 37 119
Average Earnings
9,227.5 7,981,828
14,787.9 1,449,215 10,317.7 268,261 13,094.9 1,126,164
865
98 26 86
Employment & Cred Rate
51.5 533 41.8 64 29.6 16 51.2 62 1,034 153 54 121
Table D – Other Outcome Information for the Adult Program
Reported Information Individuals Who Received Training Services
Individuals Who Only Received Core and Intensive Services
Entered Employment Rate
69.2 1,083 64.9 528 1,566 813
Employment Retention Rate
85.3 1,350 81.8 526 1,582 643
Average Earnings
11,675.2 15,282,897 10,870.6 5,500,505 1,309 506

WIA Annual Report October 2012 Page 15 of 32
Table E – Dislocated Worker Program Results
Reported Information
Negotiated Performance Level
Actual Performance Level
Entered Employment Rate
79.0 81.8 3,571 4,364
Employment Retention Rate
87.0 92.3 3,262 3,535
Average Earnings
$13,300 19,833.2 61,443,285 3,098
Employment & Credential Rate
65.0 56.9 1,259 2,212
Table F – Outcomes for Dislocated Worker Special Populations
Reported Information
Veterans Individuals with Disabilities Older Individuals Displaced Homemakers
Entered Employment Rate
76.8 307
73.3 33 67.3 513 75.0 6
400
45 762 8
Employment Retention Rate
93.0 343
92.1 35 89.1 432 60.0 3
369
38 485 5
Average Earnings Rate
24,175.0 7,832,700
17,707.7 584,355 19,017.6 7,664,106 11,226.7 33,680
324
33 403 3
Employment & Credential Rate
48.8 101 64.3 9 50.5 155 75.0 6 207 14 307 8
Table G – Other Outcome Information for the Dislocated Worker Program
Reported Information Individuals Who Received Training Services
Individuals Who Only Received Core and Intensive Services
Entered Employment Rate
84.6 1,848 79.1 1,723 2,185 2,179
Employment Retention Rate
92.0 1,563 92.5 1,699 1,699 1,836
Average Earnings
18,278.6 26,942,703 21,244.2 34,500,581 1,474 1,624

WIA Annual Report October 2012 Page 16 of 32
Table H.1 – Youth (14 -21) Program Results
Reported Information Negotiated Performance Levels
Actual Performance Level
Placement in Employment or Education
59.0 54.1 643 1,188
Attainment of Degree or Certificate
51.0 61.0 562 922
Literacy-Numeracy Gains
50.0 39.7 203 511
Table L – Other Reported Information
Reported Information
12 Month Employment
Retention Rate
12 Month Earning Increase (Adults & Older Youth) or 12 Months Earning Replacement (Dislocated Workers)
Placement in Non-Traditional Employment
Wages at Entry Into Employment For Those Individuals Who Entered Unsubsidized Employment
Entry Into Unsubsidized Employment Related to Training of Those
Adults 84.4 1,667 3,593.2 6,809,038 5.5 88 4,852.0 7,627,391 30.4 329 1,974 1,895 1,611 1,572 1,083
Dislocated Workers
92.4 2,922 100.8 55,664,754 8.7 312 8,574.9 29,677,838 32.9 608 3,163 55,228,036 3,571 3,461 1,848
Older Youths
73.1 193 2,620.9 647,354 6.1 14 2,483.1 531,379 264 247 228 214
Table M – Participant Levels
Reported Information Total Participants Served Total Exiters Total Adult Customers 176,726 159,356 Total Adults (self-service only) 163,014 152,192 WIA Adults 168,256 154,962 WIA Dislocated Workers 8,644 4,484 Total Youth (14 – 21) 3,327 1,644 Younger Youth (14 – 18) 2,332 1,056 Older Youth (19 – 21) 995 588 Out-of-School Youth 1,124 732 In-School Youth 2,203 912

WIA Annual Report October 2012 Page 17 of 32
Table N – Cost of Program Activities
Program Activity Total Federal Spending Local Adults $9,206,574 Local Dislocated Workers $10,025,305 Local Youth $9,752,823 Rapid Response (up to 25%) WIA Section 134(a)(2)(B) $5,758,788 Statewide Required Activities (up to 15%) WIA Section 134(a)(2)(B) $2,435,601
Statewide Allowable Activities WIA Section 134(a)(3)
(A)(ii) Capacity Building & Technical Assistance
$143,260
(A)(vii) Other activities the State determines necessary (see following):
$2,341,996
a. Middle College ($716,671) b. Career Coaches ($498,701) c. Governor’s STEM Academies
($389,931)
d. Adult Transition Specialists ($116,265)
e. Career Readiness Certificate (CRC) ($190,469)
f. Other Projects ($429,989)
Total of All Federal Spending Listed Above $39,664,347

WIA Annual Report October 2012 Page 18 of 32
Table O – Local Performance
Local Area Name Southwestern Virginia
Total Participants Served
Adults - 5426 Dislocated Workers - 201
Youth (14-21) Report Total Youth - 256
ETA Assigned # 51045
Total Exiters
Adults – 4707 Dislocated Workers – 116
Youth (14-21) Report Total Youth – 80
Reported Information Negotiated Performance Actual
Entered Employment Rates Adults 74.0 62.1 Dislocated Workers 82.0 71.3
Retention Rates Adults 82.0 94.0 Dislocated Workers 87.0 90.2
Average Earnings (Adults/DWs) Six Months Earnings Increase (Youth)
Adults $10,500 $20,351.6 Dislocated Workers $13,300 $15,247.6
Placement in Employment or Education Youth (14-21) 59.0 53.1 Attainment of Degree or Certificate Youth (14-21) 51.0 50.0 Literacy and Numeracy Gains Youth (14-21) 50.0 0.0 Description of Other State Indicators of Performance (WIA Section 136(d) (1) – Insert additional rows if there are more than two other state indicators of performance.
Adult Employment and Credential Rate 62.0 47.7
Dislocated Worker Employment and Credential Rate 55.0 47.4
Overall Status of Local Performance
Not Met Met Exceeded
3 4 4

WIA Annual Report October 2012 Page 19 of 32
Table O – Local Performance
Local Area Name New River/Mt. Rogers
Total Participants Served
Adults – 10702 Dislocated Workers – 622
Youth (14-21) Report Total Youth – 320
ETA Assigned # 51045
Total Exiters
Adults – 9484 Dislocated Workers – 315
Youth (14-21) Report Total Youth – 136
Reported Information Negotiated Performance Actual
Entered Employment Rates Adults 74.0 79.0 Dislocated Workers 78.0 87.9
Retention Rates Adults 82.0 84.0 Dislocated Workers 88.0 95.7
Average Earnings (Adults/DWs) Six Months Earnings Increase (Youth)
Adults $8,400 $9,395.9 Dislocated Workers $11,500 $21,244.0
Placement in Employment or Education Youth (14-21) 56.0 77.2 Attainment of Degree or Certificate Youth (14-21) 60.0 88.8 Literacy and Numeracy Gains Youth (14-21) 50.0 74.4 Description of Other State Indicators of Performance (WIA Section 136(d) (1) – Insert additional rows if there are more than two other state indicators of performance.
Adult Employment and Credential Rate 60.0 61.1
Dislocated Worker Employment and Credential Rate 60.0 63.1
Overall Status of Local Performance
Not Met Met Exceeded
0 0 11

WIA Annual Report October 2012 Page 20 of 32
Table O – Local Performance
Local Area Name Western Virginia
Total Participants Served
Adults – 10485 Dislocated Workers – 421
Youth (14-21) Report Total Youth – 204
ETA Assigned # 51095
Total Exiters
Adults – 9979 Dislocated Workers – 213
Youth (14-21) Report Total Youth – 85
Reported Information Negotiated Performance Actual
Entered Employment Rates Adults 73.0 77.1 Dislocated Workers 78.0 87.3
Retention Rates Adults 80.0 81.7 Dislocated Workers 85.0 90.5
Average Earnings (Adults/DWs) Six Months Earnings Increase (Youth)
Adults $7,638 $8,014.5 Dislocated Workers $12,500 $15,905.5
Placement in Employment or Education Youth (14-21) 60.0 78.9 Attainment of Degree or Certificate Youth (14-21) 55.0 86.5 Literacy and Numeracy Gains Youth (14-21) 50.0 72.7 Description of Other State Indicators of Performance (WIA Section 136(d) (1) – Insert additional rows if there are more than two other state indicators of performance.
Adult Employment and Credential Rate 52.0 65.5
Dislocated Worker Employment and Credential Rate 52.0 56.9
Overall Status of Local Performance
Not Met Met Exceeded
0 1 10

WIA Annual Report October 2012 Page 21 of 32
Table O – Local Performance
Local Area Name Shenandoah Valley
Total Participants Served
Adults – 13,494 Dislocated Workers – 528
Youth (14-21) Report Total Youth – 269
ETA Assigned # 51120
Total Exiters
Adults – 12,604 Dislocated Workers – 319
Youth (14-21) Report Total Youth – 100
Reported Information Negotiated Performance Actual
Entered Employment Rates Adults 70.0 94.5 Dislocated Workers 71.0 89.1
Retention Rates Adults 86.0 92.1 Dislocated Workers 87.0 92.4
Average Earnings (Adults/DWs) Six Months Earnings Increase (Youth)
Adults $8,491 $12,046.0 Dislocated Workers $10,332 $15,322.9
Placement in Employment or Education Youth (14-21) 50.0 44.3 Attainment of Degree or Certificate Youth (14-21) 45.0 28.8 Literacy and Numeracy Gains Youth (14-21) 50.0 22.2 Description of Other State Indicators of Performance (WIA Section 136(d) (1) – Insert additional rows if there are more than two other state indicators of performance.
Adult Employment and Credential Rate 60.0 81.8
Dislocated Worker Employment and Credential Rate 58.0 71.7
Overall Status of Local Performance
Not Met Met Exceeded
2 1 8
WIA Annual Report October 2012 Page 22 of 32
Table O – Local Performance
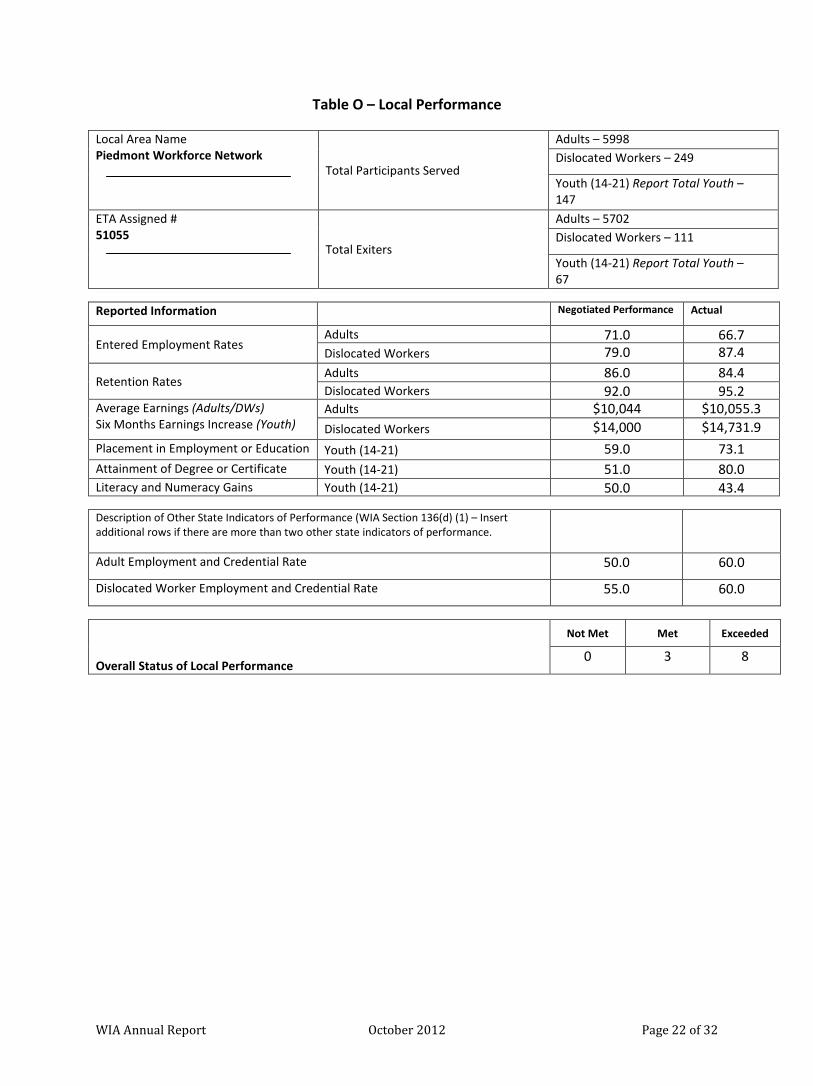
Local Area Name Piedmont Workforce Network
Total Participants Served
Adults – 5998 Dislocated Workers – 249
Youth (14-21) Report Total Youth – 147
ETA Assigned # 51055
Total Exiters
Adults – 5702 Dislocated Workers – 111
Youth (14-21) Report Total Youth – 67
Reported Information Negotiated Performance Actual
Entered Employment Rates Adults 71.0 66.7 Dislocated Workers 79.0 87.4
Retention Rates Adults 86.0 84.4 Dislocated Workers 92.0 95.2
Average Earnings (Adults/DWs) Six Months Earnings Increase (Youth)
Adults $10,044 $10,055.3 Dislocated Workers $14,000 $14,731.9
Placement in Employment or Education Youth (14-21) 59.0 73.1 Attainment of Degree or Certificate Youth (14-21) 51.0 80.0 Literacy and Numeracy Gains Youth (14-21) 50.0 43.4 Description of Other State Indicators of Performance (WIA Section 136(d) (1) – Insert additional rows if there are more than two other state indicators of performance.
Adult Employment and Credential Rate 50.0 60.0
Dislocated Worker Employment and Credential Rate 55.0 60.0
Overall Status of Local Performance
Not Met Met Exceeded
0 3 8

WIA Annual Report October 2012 Page 23 of 32
Table O – Local Performance
Local Area Name Region 2000 Central Virginia
Total Participants Served
Adults – 6765 Dislocated Workers – 344
Youth (14-21) Report Total Youth – 35
ETA Assigned # 51110
Total Exiters
Adults – 6064 Dislocated Workers – 162
Youth (14-21) Report Total Youth – 23
Reported Information Negotiated Performance Actual
Entered Employment Rates Adults 85.0 83.3 Dislocated Workers 85.0 85.1
Retention Rates Adults 87.0 100.0 Dislocated Workers 90.0 94.4
Average Earnings (Adults/DWs) Six Months Earnings Increase (Youth)
Adults $10,850 $11,857.7 Dislocated Workers $9,750 $12,638.4
Placement in Employment or Education Youth (14-21) 59.0 60.0 Attainment of Degree or Certificate Youth (14-21) 51.0 75.0 Literacy and Numeracy Gains Youth (14-21) 50.0 33.3 Description of Other State Indicators of Performance (WIA Section 136(d) (1) – Insert additional rows if there are more than two other state indicators of performance.
Adult Employment and Credential Rate 64.0 68.2
Dislocated Worker Employment and Credential Rate 68.0 76.9
Overall Status of Local Performance
Not Met Met Exceeded
1 1 9

WIA Annual Report October 2012 Page 24 of 32
Table O – Local Performance
Local Area Name South Central
Total Participants Served
Adults – 4399 Dislocated Workers – 488
Youth (14-21) Report Total Youth – 162
ETA Assigned # 51115
Total Exiters
Adults – 4067 Dislocated Workers – 241
Youth (14-21) Report Total Youth – 99
Reported Information Negotiated Performance Actual
Entered Employment Rates Adults 62.0 75.8 Dislocated Workers 70.0 84.5
Retention Rates Adults 80.0 80.8 Dislocated Workers 87.0 84.6
Average Earnings (Adults/DWs) Six Months Earnings Increase (Youth)
Adults $7,500 $9,932.3 Dislocated Workers $9,000 $13,620.0
Placement in Employment or Education Youth (14-21) 45.0 54.8 Attainment of Degree or Certificate Youth (14-21) 43.0 68.5 Literacy and Numeracy Gains Youth (14-21) 50.0 45.0 Description of Other State Indicators of Performance (WIA Section 136(d) (1) – Insert additional rows if there are more than two other state indicators of performance.
Adult Employment and Credential Rate 41.0 51.4
Dislocated Worker Employment and Credential Rate 63.0 48.6
Overall Status of Local Performance
Not Met Met Exceeded
1 2 8

WIA Annual Report October 2012 Page 25 of 32
Table O – Local Performance
Local Area Name Capital Regional Workforce Partnership Total Participants Served
Adults – 17088 Dislocated Workers – 1560
Youth (14-21) Report Total Youth – 225
ETA Assigned # 51125
Total Exiters
Adults – 15,835 Dislocated Workers – 927
Youth (14-21) Report Total Youth – 80
Reported Information Negotiated Performance Actual
Entered Employment Rates Adults 70.0 55.1 Dislocated Workers 79.0 80.4
Retention Rates Adults 75.0 84.1 Dislocated Workers 87.0 92.2
Average Earnings (Adults/DWs) Six Months Earnings Increase (Youth)
Adults $9,500 $9,766.0 Dislocated Workers $13,300 $25,028.1
Placement in Employment or Education Youth (14-21) 50.0 50.0 Attainment of Degree or Certificate Youth (14-21) 35.0 15.4 Literacy and Numeracy Gains Youth (14-21) 50.0 21.3 Description of Other State Indicators of Performance (WIA Section 136(d) (1) – Insert additional rows if there are more than two other state indicators of performance.
Adult Employment and Credential Rate 30.0 36.7
Dislocated Worker Employment and Credential Rate 30.0 29.4
Overall Status of Local Performance
Not Met Met Exceeded
3 1 7

WIA Annual Report October 2012 Page 26 of 32
Table O – Local Performance
Local Area Name Northern Virginia
Total Participants Served
Adults – 10,503 Dislocated Workers – 591
Youth (14-21) Report Total Youth – 149
ETA Assigned # 51010
Total Exiters
Adults – 9726 Dislocated Workers – 381
Youth (14-21) Report Total Youth - 50
Reported Information Negotiated Performance Actual
Entered Employment Rates Adults 74.0 74.5 Dislocated Workers 76.0 83.3
Retention Rates Adults 78.5 94.4 Dislocated Workers 85.0 93.4
Average Earnings (Adults/DWs) Six Months Earnings Increase (Youth)
Adults $12,000 $16,699.1 Dislocated Workers $15,000 $26,065.8
Placement in Employment or Education Youth (14-21) 56.4 67.9 Attainment of Degree or Certificate Youth (14-21) 51.0 52.6 Literacy and Numeracy Gains Youth (14-21) 50.0 63.9 Description of Other State Indicators of Performance (WIA Section 136(d) (1) – Insert additional rows if there are more than two other state indicators of performance.
Adult Employment and Credential Rate 75.0 68.8
Dislocated Worker Employment and Credential Rate 79.0 76.5
Overall Status of Local Performance
Not Met Met Exceeded
0 2 9

WIA Annual Report October 2012 Page 27 of 32
Table O – Local Performance
Local Area Name Alexandria/Arlington
Total Participants Served
Adults – 14,176 Dislocated Workers – 115
Youth (14-21) Report Total Youth – 76
ETA Assigned # 51005
Total Exiters
Adults – 13,219 Dislocated Workers – 60
Youth (14-21) Report Total Youth – 35
Reported Information Negotiated Performance Actual
Entered Employment Rates Adults 75.0 94.7 Dislocated Workers 75.0 93.1
Retention Rates Adults 85.0 81.0 Dislocated Workers 85.0 98.0
Average Earnings (Adults/DWs) Six Months Earnings Increase (Youth)
Adults $13,000 $10,181.9 Dislocated Workers $16,000 $27,727.2
Placement in Employment or Education Youth (14-21) 50.0 78.4 Attainment of Degree or Certificate Youth (14-21) 60.0 70.0 Literacy and Numeracy Gains Youth (14-21) 50.0 11.1 Description of Other State Indicators of Performance (WIA Section 136(d) (1) – Insert additional rows if there are more than two other state indicators of performance.
Adult Employment and Credential Rate 30.0 87.5
Dislocated Worker Employment and Credential Rate 30.0 89.1
Overall Status of Local Performance
Not Met Met Exceeded
2 1 8

WIA Annual Report October 2012 Page 28 of 32
Table O – Local Performance
Local Area Name Bay Consortium
Total Participants Served
Adults - 10,105 Dislocated Workers – 284
Youth (14-21) Report Total Youth – 189
ETA Assigned # 51070
Total Exiters
Adults - 9,492 Dislocated Workers – 108
Youth (14-21) Report Total Youth – 103
Reported Information Negotiated Performance Actual
Entered Employment Rates Adults 76.0 74.0 Dislocated Workers 81.0 79.7
Retention Rates Adults 84.0 88.0 Dislocated Workers 91.0 82.1
Average Earnings (Adults/DWs) Six Months Earnings Increase (Youth)
Adults $8,880 $10,492.4 Dislocated Workers $9,410 $15,164.0
Placement in Employment or Education Youth (14-21) 60.0 70.3 Attainment of Degree or Certificate Youth (14-21) 52.0 65.5 Literacy and Numeracy Gains Youth (14-21) 51.0 24.4 Description of Other State Indicators of Performance (WIA Section 136(d) (1) – Insert additional rows if there are more than two other state indicators of performance.
Adult Employment and Credential Rate 50.0 71.2
Dislocated Worker Employment and Credential Rate 50.0 46.2
Overall Status of Local Performance
Not Met Met Exceeded
1 4 6

WIA Annual Report October 2012 Page 29 of 32
Table O – Local Performance
Local Area Name Greater Peninsula
Total Participants Served
Adults – 12,801 Dislocated Workers – 366
Youth (14-21) Report Total Youth – 167
ETA Assigned # 51020
Total Exiters
Adults – 11,892 Dislocated Workers – 218
Youth (14-21) Report Total Youth – 107
Reported Information Negotiated Performance Actual
Entered Employment Rates Adults 67.0 57.8 Dislocated Workers 75.0 75.2
Retention Rates Adults 65.0 81.4 Dislocated Workers 75.0 92.5
Average Earnings (Adults/DWs) Six Months Earnings Increase (Youth)
Adults $8,308 $10,951.8 Dislocated Workers $10,502 $14,723.3
Placement in Employment or Education Youth (14-21) 57.0 55.2 Attainment of Degree or Certificate Youth (14-21) 51.0 76.6 Literacy and Numeracy Gains Youth (14-21) 50.0 71.2 Description of Other State Indicators of Performance (WIA Section 136(d) (1) – Insert additional rows if there are more than two other state indicators of performance.
Adult Employment and Credential Rate 45.0 61.5
Dislocated Worker Employment and Credential Rate 47.0 68.5
Overall Status of Local Performance
Not Met Met Exceeded
0 2 9

WIA Annual Report October 2012 Page 30 of 32
Table O – Local Performance
Local Area Name Crater Area
Total Participants Served
Adults – 11,805 Dislocated Workers – 150
Youth (14-21) Report Total Youth – 150
ETA Assigned # 51100
Total Exiters
Adults – 10,577 Dislocated Workers – 89
Youth (14-21) Report Total Youth – 68
Reported Information Negotiated Performance Actual
Entered Employment Rates Adults 68.0 71.1 Dislocated Workers 72.0 90.6
Retention Rates Adults 74.0 83.1 Dislocated Workers 75.0 92.2
Average Earnings (Adults/DWs) Six Months Earnings Increase (Youth)
Adults $8,500 $11,093.3 Dislocated Workers $12,000 $19,815.6
Placement in Employment or Education Youth (14-21) 59.0 50.8 Attainment of Degree or Certificate Youth (14-21) 51.0 50.9 Literacy and Numeracy Gains Youth (14-21) 50.0 40.0 Description of Other State Indicators of Performance (WIA Section 136(d) (1) – Insert additional rows if there are more than two other state indicators of performance.
Adult Employment and Credential Rate 50.0 50.8
Dislocated Worker Employment and Credential Rate 70.0 72.5
Overall Status of Local Performance
Not Met Met Exceeded
0 3 8

WIA Annual Report October 2012 Page 31 of 32
Table O – Local Performance
Local Area Name Hampton Roads
Total Participants Served
Adults- 27,313 Dislocated Workers – 460
Youth (14-21) Report Total Youth – 561
ETA Assigned # 51035
Total Exiters
Adults – 25,294 Dislocated Workers – 290
Youth (14-21) Report Total Youth – 399
Reported Information Negotiated Performance Actual
Entered Employment Rates Adults 58.0 63.1 Dislocated Workers 58.0 68.5
Retention Rates Adults 60.0 82.2 Dislocated Workers 60.0 89.4
Average Earnings (Adults/DWs) Six Months Earnings Increase (Youth)
Adults $7,000 $11,021.4 Dislocated Workers $9,000 $17,463.7
Placement in Employment or Education Youth (14-21) 40.0 42.6 Attainment of Degree or Certificate Youth (14-21) 40.0 53.3 Literacy and Numeracy Gains Youth (14-21) 50.0 41.0 Description of Other State Indicators of Performance (WIA Section 136(d) (1) – Insert additional rows if there are more than two other state indicators of performance.
Adult Employment and Credential Rate 45.0 42.7
Dislocated Worker Employment and Credential Rate 45.0 45.8
Overall Status of Local Performance
Not Met Met Exceeded
0 2 9
WIA Annual Report October 2012 Page 32 of 32
Table O – Local Performance
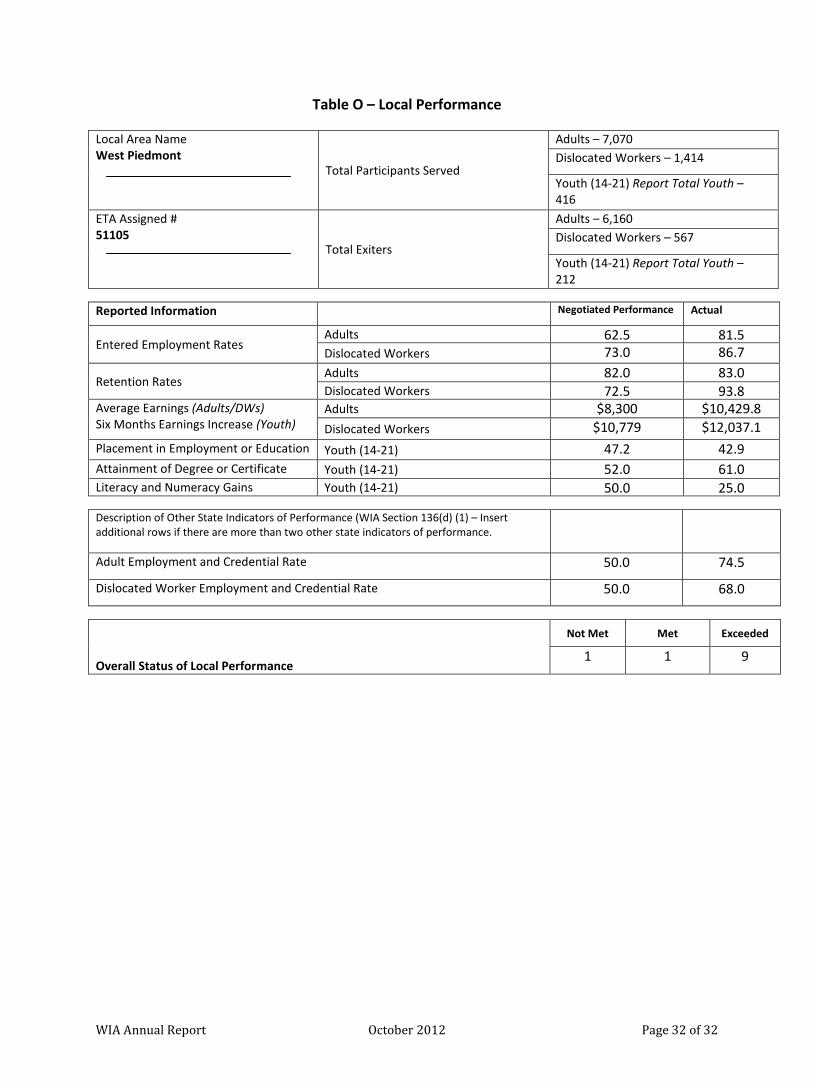
Local Area Name West Piedmont
Total Participants Served
Adults – 7,070 Dislocated Workers – 1,414
Youth (14-21) Report Total Youth – 416
ETA Assigned # 51105
Total Exiters
Adults – 6,160 Dislocated Workers – 567
Youth (14-21) Report Total Youth – 212
Reported Information Negotiated Performance Actual
Entered Employment Rates Adults 62.5 81.5 Dislocated Workers 73.0 86.7
Retention Rates Adults 82.0 83.0 Dislocated Workers 72.5 93.8
Average Earnings (Adults/DWs) Six Months Earnings Increase (Youth)
Adults $8,300 $10,429.8 Dislocated Workers $10,779 $12,037.1
Placement in Employment or Education Youth (14-21) 47.2 42.9 Attainment of Degree or Certificate Youth (14-21) 52.0 61.0 Literacy and Numeracy Gains Youth (14-21) 50.0 25.0 Description of Other State Indicators of Performance (WIA Section 136(d) (1) – Insert additional rows if there are more than two other state indicators of performance.
Adult Employment and Credential Rate 50.0 74.5
Dislocated Worker Employment and Credential Rate 50.0 68.0
Overall Status of Local Performance
Not Met Met Exceeded
1 1 9