common-user terminals the ship to quay interface
TRANSCRIPT

COMMON-USER TERMINALS THE SHIP TO QUAY INTERFACE
Bernard M. BrownNational Institute of Labour Studies
ABSTRACT:
Container' terminal oper>ato1"s face a balance bet:ween tuJo competinginterfaces. On one hand~ the ship to quay 'interface, on the other,the quay to transpopt" This paper diseusses some Dj' the operationalpr>obZems encountered a:t the 'ship intepfaee' which inhibit eontainervessel ppoductivity. It suggests that cwnuZative losses in theterm-inal process leading up to the 'lift':> although well indicated,a:re, in pI'actice, ZaPgeZy ignored..
263

BROWN
INTRODUCTION
The increasing value of ships cargoes and the development ofinternational trade can mean large amounts of capital are inactivewhile a vessel is at sea The average speed of ocean-going ships hasbeen progressively increased from ten to twenty knots per hour sincethe 1950's in an effort to reduce the burden of inactive seabornecapital IAndruszkiewicz 1983) Technological improvements in shipdesign construction and on board cargo handling methods have had theeffect. over this period. of shrinking economic distances between portsthroughout the world. In the deep-sea general cargo tr'ades this hasoccur'red principally through the diffusion of unitisation in the formof the container ship,
Ship surface speeds can accelerate the rotation of capital which istied-in to ships cargoes. Speed of transportation can also meansavings to the shipper in such things as inventory costs and interestpayments on cargo, which otherwise would have been incurred Thesavings to the shipowner or carrier must be measured over the entiretransport r'oute, This includes the port component Rapid cargothroughput and efficient infrastructure facilities ar'e essential inorder to shorten the non-r'evenue earning time during which a vesselstays in port. Delays to vessels in port can often eliminate savingsaChieved on other' sections of a ship s itinerary
Ports are an important component within the maritime physicaldistribution cycle, but their individual well-being inclUding theirtechnological development, depends on their ability to match the cargohandling demands of shipowners, These demands may be identified asbeing technological responses by shipowners to the competition in themarket place. The shipping industry' forces the pace' of technologicalchange in ports.
~ ESSENTIAL PROBLEM
Research into ports throughout the world reveals a var'iety ofdifficulties confronting container terminal operators {Johnson andGarnett, 1971; Meeuse, 1977; Imakita, 1978; Harding and Ryder 1918;National Ports Council 1978; National Por'ts Council, 1981 j Jansson andShneerson 1982; Travers Morgan 1983; Roberts, 1984; Ogden 19841Within the framework of these studies operational ploblems betweenterminals appear to differ in degree rather than kind
264

COMMON-USER TERMINALS
In Australia,shipping costs
there has been a growing awarenessare comparatively high and are:
that shore-based
among the factors which determine the competitiveness ofAustralian exports and the price of our imports' ft)
intereststransport
transportin the
A Shore-Based Shipping Costs Seminar in July, 1984, identified specificproblem aleas in which it was considered remedial action was necessaryThese included:
il problems at the interface of the transport modes whichcreate unnecessary costs.
ii I the trend towards sub'-optimisation bywhich I'esultS in uncoordinated links'chain
The seminar concluded that there was a need for research to properlyexamine the issues and identify practical remedies to achieve overallcost reductions.' A Task Force, formed as a result of the seminar iscurrently examining these 'ar'eas of concern identified by delegates,and is expected to report in December 1985
The essential problem' within common-user container terminals is thatof operational delays These may be induced as a result of attemptingto cope with what are often uncoordinated vessel and shor'e transportarrival times To users and operators of these terminals this commonproblem manifests itself in increased costs To the transportindustr'y. it represents a large scale misallocation of resources Thispaper written ,in September, 1984, does not seek to pre-empt orduplicate any of the work of the Task Force Much of the work of thatmajor study could be expected to be terminal specific Instead, itaddresses some of the operational problems encountered at the commonuser terminal 'ship interface' which inhibit cargo handling efficiency
TERMINAL CHARACTERISTICS
There is a fundamental difference between a sole or limited-user and acommon or multi-user container terminal A sole-user terminal maysimply be a component in a vertically integrated operation. such as adedicated terminal, which has the financial suppor't and backing of aparent shipping line or group of shipping companies. In contrast, acommon,·user terminal is frequently a port authority capital ventureestablished to service the regular and often random requirements of anumber of shipping lines - the equity risk being borne by the operator,not the user
The Hon Petel'Opening Address
JUly 1984
MOI'r'is M.P Federal Minister forto Shore-Based Shipping Costs Sem~nar
TransportSydney
265

BROWN
Although sole-users experience similar operational problemsuser terminals, the latter experience unique problems.
this. this paper consideI'S issues mOI'e applicable toterminals
to commonBecause ofcommon-user
The I'aison d' etre of a container terminal is to service containervessels, This primary objective which is often underestimated bylandside tranSpOI t operators I is what sets container terminals apar'tfr'om container depots, container ft'eight bases or similar inland'ports'. Unfortunately. it also places container terminal operationsunder the transport industry's collective microscope
The efficiency with which the terminal operator performs his mainstreamactivity determines the service standards he is able to offer otherterminal users The reason for this is clear-cut. A containerterminal has a very high capital gearing, This means that the capitalcost element of each container handled may only be reduced tocommercially acceptable levels by increasing throughput Increases inthroughput per se, through the addition of more shipping lines, orlarger cargoes can have a recoil effect of reducing service standardsfor existing users
The terminal operator is therefore faced with a balance between twocompeting interfaces, On one hand, the ship to quay interface, on theother, the quay to transport, It is between these two interfaces thatthe terminal operator seeks to expand his activity base Whilstmaintaining customer service levels, In the context of this paper, theeffects of efficiency inhibitors on the ship to quay interface will beexamined,
The sea container or box is a standard multi-modal cargo transporter,measured as a twenty foot equivalent unit ITEU) (1 J Var'ious sizes ofcontainers are available but generally either 'twenty foot' or 'fortyfoot' containers (the latter' favoured particularly by U.S shippers)are employed load factors vary between tI'ade and commodity ar'eas, buta twenty usually 'avenges' ten tonnes and a forty foot eighteen tonnesof cargo, r'espectively.. A cellular' container vessels capacity ismeasured by the number of twenty foot container s, or their equivalentsITEU's) it can accommodate
1, 20 x 8' x 8 (or 8 6" J International Standards Organisation (ISO)dimensions 6,,1m x 2, 44m x 2,59m,
266

COMMON-USER TERMINALS
A container ship differs from a conventional general cargo ship inseveral ways, Apart from their obvious physical appearances (mostgeneral cargo vessels being self-geared) the most significantdifference is in their method of loading cargo Instead of a generalcargo vessels myriad of differential cargo spaces, a container shipshatch or 'bay is subdivided into ce11s- vertical and lateral guideswhich stow identically sized car'go packages (containeIs) intopredetermined slots This means that the traditional in-portstevedoring skills of good stowage are virtually redundant The. skill' in loading ships is transferred ashoI'e Cargo is pre-stowed toa precise plan whilst the carrying vessel is seaborne
Forward planning is the most important element in efficient containercargo handling operations For a variety of reasons it can becomeincreasingly difficult to implement
EFFICIENCY MEASURES
There are numerous factorsinhibit container vesseloperational problems may becontrol
which if leftproductivitywithin others
unchecked, can combine toSome of the solutions tooutside of the operators
Productivity analysis between common-user terminals poses partiCUlardifficulties not least because productivity differences between them(firm effects) do not readily avail themselves of comparative analysisNot all of these terminals operate in a common competitive environmentIn other WOlds some terminals operate under highly constrainedcircumstances As an example institutional constraints (in the formof terminal working practises) significantly increase the gap between avessels non~productive time (alongside time i e time spent at berth)and productive (cargo handling) time
Where pl'oductivity comparisons are available, (National Ports Council1981; TravelS Morgan, 1983; BUleau of Transport Economics 1984) - themost orthodox methods being cargo handling tempor'al measures of eithergross or net Clane rates per hour (see append1x) they shouldnevertheless be treated with caution
Table 1 is useful It provides information supplied by severalshipping lines and gives handling r'ates for identical vessels callingat different ports It is interesting for two reasons Firstly itinadvertently underlines the commonality of container vessels tradingworldwid8, compared with the disparateness of the container terminalswhich seek to service them Commonality of container terminals wouldbe a more appropriate measure and complete the equation as one wouldbe comparing like with like The data is largely supplied by theusers not the operators of these terminals.
Secondly. and more importantly, it expresses crane rates, acrosscontinents in gross containers pel hour. There al'e various views onthe choice of this as an adequate productivity measure Net containersper hour (a measure of the rate of carrying out the cargo work devoidOf any delay time) provides the shipowner and terminal operator with adaily working tally' of productivity Gross containers per hourinclUdes the effect of delaying factors The differ'ence between thelatter and the net crane rate is a measure of the significance of the
267

BROWN
delays found at a terminal,will illustrate:
This is impoI'tant I as a simple example
TABLE 1: HANDLING RA,TESFOR IDENTICAL VESSELS CfU.,LI:N:G l\TDIFFERENT PORTS
19 7 9/1980Z t L'e a lone -
Berth Perfor!:'".ance1 Por t Performance2POf't/!'erminal
Container's Containers. Gr'os5 C.. P.. H.. Per' Day Gross C.P.H" Per Day
Great Britain
E 1'7,,5 368 9 .7 233F 21.,7 521 16 .7 401
Eurooe
EC 30.5 732 17 .. 1 410EE 25 .. 1 602 25.1 456EO 30.1 722 167 401EH 33.3 741 293 703EJ 22.0 506 9 .. 3 223EK 23.8 476 13 .. 3 320EL 11.,5 276 6 .. 4 154EM 16 .. 4 361 7 .. 8 187
North America
NB 47,,4 1090 34 .. 0 816NO 343 755 16 .. 9 406NO 35 .. 0 805 24 .. 5 583NH 25 .. 1 552 11.,4 274NJ 352 810 11..7 281NO 25 .. 3 582 10 .. 0 240
Australasia
AA 12.2 281 8 .. 6 206AB 10 .. 5 252 3 .. 3 79AC 202 485 10 .. 4 250AD 11.1 266 2.6 62AE 28;6 429 8 .. 4 202AF 33 .. 7 506 16.8 403AO 247 371 16 .. 7 401AH 30 .. 6 459 21.3 511
1" Berth Performance· Gross containers per hour': The number of container's,including restoll/age, handled dUI'ing the gt'oss ship wot'king time"
2.. Port Performance - Cr'oss container's per' hour': As above but based on thetotal port time including non-operating time and time for locking.'IIaiting for' a berth, etc"
Source: National Ports Council 1981----------------268

COMMON-USER TERMINALS
If 100 moves were achieved in an 8 hour shift (gross) then100/8 = 12 5 containers per hour
but if 100 moves were achieved in a 6 75 hour shift (netl then100/6 75 = 14 8 containers per hour
Ostensibly 14.8 containers per hour is a higher productivity rateand one which is usually preferred on a day to day basis as it appearsto reflect the delays actually encountered at the ship/quay interfaceThese delays, however will only be those which are identified andrecorded by the ship's checker or tally clerk The rate disguises anelement of unrecorded or lost vessel productivity overall, 13,6 percent in this case" Not all of this percentage loss will have beengenerated on, or at the ship's side
It was noted earlier, that for obvious reasons, a vessel at berth isthe priority or mainstream activity within a terminal, Because ofthis throughput and thus productivity measures are largely attributedto the ship There is a tendency to assume that this is the only areawhere vessel productivity may be gained or lost As a result,cumulative losses in the terminal process leading up to the lift' arenot monitored as closely. Fr'om the data in table 1, the substantiallybetter performances achieved at North American terminals reflect thegreater attention given by them to breakpoints in the terminal process
Gross productivity for a vessel is calculated when it has finishedcargo handling operations Gross productivity is an index by whichcontractual throughput rates (if appropriate) or more general productivity rates may be measur'ed, In practice there are various pitfallsIn monitoring productivity Some of these are summarised below:
It is generally accepted, (for example, in the case of acontractual arrangement) that, provided contracted boxthroughput rates are achieved on each vessel, or series ofvessels, then the oper~tion short of any major catastrophehas been a success
2 Common-users frequently service one-off vessels Evenamong regular users some of their vessels may be cellularothers semi or non-cellular, Productivity comparisons aredifficult, if not impossible, in such cases
3 Much of the analysis of productivity measures takes placeaway from the tex'minal Once a dynamic container terminalsystem is in operation. however unsatisfactory it may beanother element 'inevitable loss. tends to arise Thisloss can quickly become an accepted terminal norm'
4 The operator on the ground is often swamped by anaccumulation of operational problems. Because the commonuser is dealing with multi-port multi-user customers whosevessel start and finish times do not always coincide witheach other', the root cause of lost ship productivity may notalways be identifiable,
5 Each vessel operation at a common-user terminal is virtuallya separate venture There is no standard terminal shipplanning system for container vessels, Most existing systemsare hybrids of one form or another, Some shipping linesinsist on using their own individual stowage and ship
269

BROWN
planningoperators
procedures These multiple systemsability to sustain productivity rates
inhibi t theover time,
exchange ratesreflects theof capital,
Productivity comparisons, in the form of containerbetween terminals, are limited unless their analysisoptimum operating conditions of those terminals in termsequipment and throughput, per man employed
Table 2 represents an attempt to assess this throughputcontainers per annum per item of plant or man employeddata fI'om five British container terminals
It I'efeI'S toand includes
TABLE 2: CONTAINERS PER~ i£B ITEM OF PLANT OR MAN EMPLOYED
Terminalper
QuayCrane
perStraddleCarrier
per man(Total
Labour fOI ce I
per man(ManagementSupervisors.
etc )
per man(DockWorkers I
per man(Maintenance
Worker s)
A 21,800 5,458 242 710 512 139
B(1 ) 23,300 3, 890 374 1,944 660 555
C 22 600 4 250 156 739 240 096
0 43 600 6 600 231 038 307 600
E 20 BOO 3 467 127 520 217 721(2)
111 Terminal a operates a two shift system wi th overtime"all other terminals work three shifts.
121 The maintenance dept. at this terminal has significantlymore items of plant to maintain than the other terminals,
~: As Table 1,
Clearly, throughput varies widely between the five termina~s andreflects a considerable degree of overmanning in terminals C and E.Container crane utilisation at four of the terminals is less than 50per cent (see section on Thr'oughput Assessment) Van carrier (straddlecarrier) utilisation is marginally better
Table 2, whilst providing a measure Of productivity differ'entialsbetween terminals, does not r'eflect optimum operating conditions, or,more importantly, the capital investment/expected benefit ratioRecently, Australian data. derived from terminals under commonownership, has attempted to illustrate the investment relationshipSee Tables 3 and 4
270

COMMON-USER TERMINALS
TABLE 3: TERMINAL THROUGHPUT' CALENDAR YEAR ~
Throughput
Terminal
Port BotanyWebb DockNewstead
CapacityfaJ
160 000180 000
25,000
Utilisation(per cent)
7a7092
Manning
(number)
460390
75
(TEU's per
year)
125 327{b)126,197(c)
22 a95
(TEU's per
man)
272324305
I a II blI c I
with current equipmentCoastal 25 000 per yearCoastal 60 000 per year
operating methods work practicesoverseas 100,000 per year,overseas 60,000 per year
etc
The original estimate for Botany Bay capacity was 250 000 TEU s per yearThe best year to date achieved 145,000 TEU's throughput
Source; Bureau of Transport Economics, 1984
TABLE 4: rEU THROUGHPUT £fR MAN- CALENDAR YEAR ~
Terminal
Port BotanyWebb DockNewstead
Assets employed1983~84
($ million)
4221
1 5
Manning(number)
460390
75
Investmentper man
1$0001
915420
Throughput(TEU s
per man)
272324305
Source: As Table 3
Although tables 3 and 4 are self-explanatory, the following points maybe raised All the terminals are heavily utilised but throughput perman in dollar terms is varied Table 4, for example shows that forevery $91 000 invested per man in Port Botany considerably lowerthroughput ratios are achieved than in Newstead
These data draw similar conclusions to Table 2 The terminals of PortBotany and Webb Dock are overmanned, The difficulty in productivitycomparison analysis is that there are no measures of tne growth ofcapital assets relative to the increased (assumed) contribution of thelabour force In other words as Stubbs (19.83) has argued; it isdiffiCUlt to measure their (capital and labour) relative contributionsto increased pr'oductivity:
'Any such calculationgrowth of capital stockwell as changes in hoursformer are not available
op cit p 189
would require that records ofin wharfside equipment be keptworked by waterside workers;
111
271
theas
the

BROWN
The problem is not unique to Australia The difficulty of productivityanalysis manifests itself in many overseas terminals
WiAI. DETERMINES I1!f llilftl'?
Factors which act as ainto two broad groups.factol'S,
brake upon terminal productivity can be dividedThese will be termed primaI'Y and secondsI'y
Figur'e 1terminalcranesback··upof data
Primary factors include components within the hardware side of thesystem, such as, vessel type and size, terminal utilisation. plant andequipment choice, terminal size and layout. and ship handlingperformance Secondary factors, though less discernible. comprise the. software' package and include working practises. terminal shipplanning proceduI'es I container infor'matico control systems, the degreeof loading versus discharging operations. and the type and skills ofthe available labour force
There are other extraneous components within the system. which. whencomparisons with other terminals aI'e made. can make an otherwiseefficient terminal appear unproductive. Principal among these is thegeographical position of a terminal within a ship's itinerary As anexample, if a vessel calls at a range of ports to load or dischargecontainers {as in the Australia-UK/continent tradel then the finalEur'opean terminal operator may often inherit restowing, lashing andloading problems generated in earlier ports. Many vessels carry acomplete set of lashing gear for' a 'full ship' When ships arrive PaItloaded, it may be necessary to break~'down and transfer coastwiselashings before deep-sea loading and lashing operations can begin,
THROUGHPUT ASSESSMENT
The discussion, so far. has described inhibitors which affect cargohandling efficiency Before examining some of these inhibitoI'S. it maybe useful to explain the ship/quay interface in some detail For thispur'pose, a common-user container terminal model has been constructed,
.ltl..g. Interface
the Model T illustrates a typical handy-sized' cammon-user'A continuous quay 1100 metres long is served by five gantr'yThe 22 hectare container park has an additional 26 hectare
area To assess its per'formance over any given task. a seriesneed to be built in
Craneage
A fully utilised single lift container crane should achieve athr'oughput of between 30/40000 units per annum (National Ports Council,1976) and 50000 units per annum (National Ports Council 1981). (Thevariation probably reflects new crane technology in the years 197a~81)
For the purposes of the model a crane lift capacity of 40000 units perannum will be assumed
272

COMMON-USER TERMINALS
Terminal Movements
The land side movement of containers can be achieved by a variety ofprocesses Some of the most commOn include:
Principal carrier Container route (assumes discharge anddelivery process)
Van Carrier: Container Craneto quay
Quay to containerstacking area
Container stackingarea to
I'Dad/rail interchange
discharge
delivery
2 As ProcessCarrier
but using a Fork lift truck instead of Van
3, Yard tractor/trailer: Container crane to yar'dtractor/trailer
Yard tractor/trailer toVan carrier waiting incontainer stacking area
Van c~rrier to containerstacking area
Van carr'ier to road/railinterchange
discharge
delivery
4 Transtainer: Container crane to yard tractor/tlailel.
Yard tractor'/trailer totranstainer
discharge
Transtainer to containerstacking area or directto road/rail interchange
5 Any selective Pelmutation of 1-4 above
completion ofdischarge 01delivery
Van carriers ale the most flexible item of plant in a common·-userterminals dedicated operational fleet. This is because they arecapable of picking and deliveI'ing containers out of sequence and almostat landom, and also of switching quickly between ship and roadtransport tasks to suit operational needs This is important Theoften tandom aI'Iival of vessels, because of delays in other ports, badweather or industrial disputation, can result in unanticipated ttafficpeaks The cumUlative effects of operational delays caused by thesepeaks may require the delivery of certain imports, or acceptance ofexports, to be on a priority basis A van carrier can perform thesefunctions with minimum disruption to shipside operations by, forexample dir'ect delivery from or to, the gantry,
273

BROWN
Another important aspect is in their ability to cope with irregularship wOI'k As an example, a vessel s hatch may contain a mix of dryand refrigerated cargoes An additional carrier transferred to a ship'sgang can be used to connect import containers to a refrigeration plant,(An operation generally carried out under an engineer's supervision).Allocating an additional carrier for this specific activity, which isusually performed some distance from the main stacking area, releasesthe ship's carriers from what could otherwise be a time consuming taskThus through one additional carrier, selectively allocated, work flowrates ex the ship can be maintained, if not enhanced This is achievedby simultaneously feeding refrigerated containers via yardtractol/trailers to the 'extra carrier, while the ship s carrierscontinue discharging dry import containers from the same hatch into themain stacking area
oo
I274

COMMON-USER TERMINALS
It is a feature of common-user terminals that peak activity in onesection may be offset by off-peak conditions in another, Because ofits operational flexibility a van carriers overall performance isoften affected by the level of ancillary activities it is called uponto perform, These may include such operations as shortening the Quay,servicing a grou'page shed, or working with Qverheight equipment
As a guide, a van carrier working between interfaces should be able tohandle in excess of 7000 units per annum, each container being handled,on average 2,,5 times (National Ports Council 1981),
Capacity - What £lll the operator assume?
If a dedicated van carrier operation (Process 1) is chosen for themodel, then to achieve a forecast throughput of 40000 units per craneper annum at the ship/quay interface the model requir'es six vancarriers per crane These machines would have to be programmed tohandle all landside movements inclUding receiving and delivery at thequay/transport interface,
Based upon these figures it is possible to compute that, in containerstacking ter'ms, 2750 rEU container park ground slots will be r'equiredThis gives a working storage slot capacity of 3667 IEU's In otherwords, the operator should avoid storing more than this number of IEU'sat anyone time. The calculations for these figures are explainedbelow
Containers are normally stacked up to 1 667 one and two-thirds onaverage Gl'ound slots are an estimate of the mix in a van carrierfleets performance characteristics and the type and size of containersto be handled Some carr'ien may be capable of stacking twenty footcontainers three high (or one over two) These are usually firstgeneration machines still with several more years operational lifelater model van carriers may be capable of stacking forty footcontainers three high,
To determine annual capacity for the model some assumptions have to bemade Available data indicates that terminals can peak up to 33 percent above the average throughout a vessels call, Other estimatessuggest that 20 per cent of a terminals gX'Qund slots should be reservedfor marshalling, planning or contingency use {National Ports Council,197 BJ
Following these conventions, the model s theoretically achievableannual park capacity is as follows:
A x B x C x D
E x F
where ABCo
E
TEU ground slotsstorage probabilityPark capacity available i e SOZ of ParkWorking days in period (ignores seasonal or
other variations)Average container dwell time, in days
(e,g for an import) lhis assumes; two days
275

BROWN
to discharge and clear customs, three days'free of Quay I'ent' prior to collection
F average fluctuation above traffic flow,
Thus: 2750 x 1 667 x 80 x 365201293 rEU s per annum"
5 x 1 33
Container parks experience congestion when 607. or more, of availablecontainer slots are occupied The mean occupation of a container parkis therefore:
cMO
F
Thus: MO o 80
1 33
o 60 (607. slot utilisation)
The number of static or standing slots referred to above may becalculated:
2750 x ',,667 x 80 = 3667 rEU s
This figure of 3667 rEU's gives the operator acapacity figure which is advisable at anyone time
working storage
In practice throughput capacity is dependent on the number of timeseach rEU working slot is used, This in turn depends on the averagedwell time for each container on the park and to some extent on shipsizes and trading patterns As an example a daily container serviceof approximately 150 TEU s per ship call will probably require ashorter dwell time per container than a 2500 TEU fortnightlY containerservice The number of gr'ound slots required for the larger vesselwill reflect the longer dwell times for each container Simply statedbigger ships reqUire bigger terminals
Summary
These data representpurposes of this papercargo handling problems
a fairly loose set of assumptions Forthey provide a framework by which some of
of common-user terminals may be illustrated
thethe
Throughput estimates enable operators to organise sufficient plantequipment and labour resources to meet anticipated demand Theseestimates should be treated as 'best case assumptions As an example,container crane throughputs are a function of the level of thetechnology in the crane times the number of cranes assigned to a ship'State of the art craneage has an 'engineering physical lift capacityof 50 containers per 60 minute cycle (1.2 minutes per move) Thisassumes a single lift spreader flifting/locking frame) butsimultaneous loading and discharging oper'ations Single lift workingof this order of magnitude is not achievable over a sustained period
EfficiencY inhibitors exist at breakpointsThese individual contributions to cargodifficult to quantifY The next sectionfactor s
276
within a terminal processhandling losses can be
considers some breakpoint

COMMON-USER TERMINALS
ltlf TERMINAL PROCESS
TheIe are numeI'OUS interrelated factorsproductivity. No list is exhaustiveelements in the terminal process will be
which inhibit container vesselIn this section. two key
discussed, These are:
Ships plans and container loading systems,
2. Labour practises
Ships plans AnQ container loading systems
It was noted earlier that theI'e is no standard system of ship planningin use in common-user terminals Jointly operated or private-userterminals can exercise a high degree of operational, and thusproductivity control through the adoption of their own standardisedship loading procedures These systems. often computerised, aredesigned with the parameter's of the loading vessels in mind,Conversely, common-users are confronted by a range of shipping lineseach with their own vessel types Many of these lines use individualplanning systems
A computerised container information system is the optimum solution forplotting container park locations or cheCking ship loading lists. Themajority of checking functions, however, are 'post-event' Inpractice the extent to which computerised cargo control directlyassists in the loading process is determined by the type and range ofvessels to be serviced
Experience has shown that container vessel loading is most suitablycontrolled from one point - the base of the gantry crane, A containership's foreman unlike his conventional cargo counterpart, rarely needsto go on boar'd ship, From his central control point (the inter'face ofsea and land container routes) the loading supervisor can direct cargooperations
Figurevesselberth
2 illustrates an information flow chart for a seQuenced loadingberthed at Model T' terminal The figure is based upon 14
the stacking areas being 41 to 4W and 4X to 4Z
From the figure, it can be seen that information flows from 14 berthoffice in two directions. One set of instructions flow to thequay/transport interface The other set to the ship In this example,which is fairly typical, van carriers 04 to 06 service the quay/transport interchange grid, The common-user' can never accuratelypredict road transport arrival times Where peak~ can be forecast(Roberts, 1964) they do not always indicate the mix of trafficexpected This means carriers may service road vehicles carryingexports for future vessels, not just those vehicles carrying containersfor the loading vessel at T4 berth In other words the quay/transportinterface in a common-,user terminal accepts containers as theyarrive' The common-user does not differentiate between terminalusers, This is the main reason why the quay/transport interface islargely a discrete operation
Information flows to the ship in two forms; written information and tilespoken word The written form usually preferred is the ships plan.Computer 'PIint outs' can be used as working ship loading l~sts, but
277

BROWN
ID00~
" " ~ ~ID 0 0 0~c " " "H ID ID ID
~rl rl rl
" " "" " " "0 0 0 00< U U U•C C C C0 0 0 0
" ~ ~ ~8,~0
"0<
"IDrl""OMUO
C
"0
ID~
CC 00 ID "H " ID~ " rl
• '" "":f c ONrl UO
"' "00 0 C
rl0 0~ ~0 00
Crl
" C" ID 0
" C C "ID rl~ 0< c8 0 rl 0
ID~ ID ~ HC " 00 ~0 0 0·rl U ~ ~~
~ 80 ~ -8 ~
!J ~
""ID
ID ~
~
0•""'"c ·1rl
"00~
00
" "ID• rlC "rl "0 OH~ UOC0 CU ;<
FIGURE 2: INFORMATION FLOW CHART,MODEL IT'
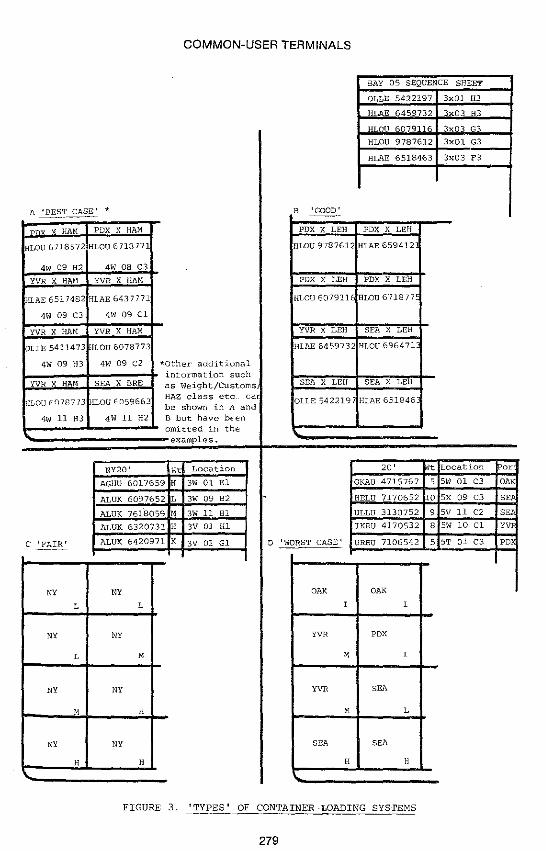
they pose ceI'tain difficulties Firstly they can contain too muchunnecessary information, and secondly, they are difficult to I'ead inartificial light on the quayside Figure 3 shows some examples of shipsplans in common usage, These represent four plan 'types' which havebeen in use simultaneously in a terminal The personnel involved in theloading process are representative of these types of operation Thesesystems are closely linked to the information flow chart in figure 2
278
COMMON-USER TERMINALS
BAY 05 SEQUENCE SHEET
OLLE 5422197 3xOl H3
BLAE 6459732 3x03 H3
HI, U 6079116 3xO G3
BLOO 9787612 3x01 G3
BLAE 6518463 3x03 F3
, 'BES'I' CASE' • B 'GOOD.~-------r pny 'I HA~l PDX X HAM PDX X LEH PDX X LEA
H1.oU 6)]8572 BLOV 6718771 gLOV 9787612 BIAE 659412
4w 09 H2 4W 08 C3
YVR X HM1 YVR X HAM PDX X LEH PDX X LEH
BIAE 6517482 BIAE 643'7 771 BLOO 6079116 HLOD 6'71877
41" 09 C3 4W 09 Cl
YVR X HAM YVR X HAM YVR X LEH SEA X LEH
101IE 5411473 IOU 6078773 BIAE 6459732 HLOV 596471
41.. 09 83 4W 09 C2 *Other additionalinformation such
YVR X HAM SE' X BRE as Weight/Customs SEA X LEH SEA X LEH
fHLOUf078773 r.ou ('.rl59563HAZ class etc ca
OlIE 5422197 BIAE 651846ba shown in A and
4W 11 H3 4W 11 H2 B but have bE enomitted in the
examples.
NY20' W, Location 20' t Location or
AGHD 6017659 H 3W 01 El OKAU 4715767 5 SW 01 C3 OA-
ALUK 6097652 L 3W 09 82 .. HELU 7170652 0 5X 09 C3 SE
ALUK 7618059 11 3W 11 HI ULLU 3130752 9 5v 11 C2 SE
ALUK 6320731 H 3V 01 HI IKRU 4170532 8 5W 10 Cl YV
C ~.!~ALUK 6420971 K 3V 01 Gl D '1;<lORST CASE' URRU 7106542 5 5T 01 C3 PD
NY NY OAK 0"
L L 1 1
NY NY YVR POX
L M M 1
MY NY YVR SEA
M H M L
MY MY SEA SEA
H H H H
279

BROWN
Type lA) is a best case All loading information is contained on onepiece of paper (the bay plan) Cargo is sequenced on the ship, whichalso allows the stacking area to be sequenced (see below) This hascertain advantages Because the vessel is sequenced. minimalinstI'uctions need to be given to the gantryman (the container spotter'who relays picking instructions via radio to the ship's van carriers),It also allows him to plan his own job without waiting forinstructions, The essence of a smooth cargo handling operation is tominimise the flow of information actually required to load the ship
The checkpoint' in the system is the planman Communicating by radioonly with 14 berth office, the planman recoI'ds on a blank plan whereeach container is loaded and its slot number. These data are thenr'elayed back to the berth office, The computerised ship loading listis then steadily deleted Type (A) is particularly effective whereover lapping shift changes are employed 'Hand-over' problems ar'eminimised, Fully sequenced terminals can eliminate Quay side personnelAs an example, T4 berth office in radio contact with ship's carr~ers
could effectively replace gantrymen
Plan types CB) and (C) are var'iations Type (BI is very similar to (AIexcept the sequence sheet is separate Thus, personnel are only giventheir relevant 'bits' of the plan Type (Cl can be very effective,Where it fails, however, is when large volumes are being loaded, As anexample, if 250 NY containers were being simultaneously loaded onto onevessel by three container cranes, this could result in gantrymendetailing can iers to the same container stacking rows, even for thesame containers This congestion can be overcome by gantrymen workingtogether, However such large volumes mean bulky loading lists at thequayside which cannot be successfully 'split
Type (Cl is the optimum where container stacks ar'e laid down simply byweight and port For example, six rows in 3W divided into NY 'lights','mediums and heavys' could be very rapidly 19aded Van carrierdrivers would not have to identify specific container numbers
Type (DJ is a worst case Here, multi-port hatches are unsequencedThe loading list identifies port and weight. In practice, gantrymenprepare 'mini' sequence sheets for each hatch lost' boxes or boxes'expected but not yet on the terminal can create many loading problemswith Type (DJ Overall this is the most unsatisfactory system
is closely linked to vessel planningberth, (e,g Bow West 1600') theto ensure that all export containers
Import containers would be placedtheir point of delivery'· T4 berth
Clearly, container park planningFor a 700' vessel berthed at T4container park would be stackedwould be sequenced into 4W and 4Xinto 4T or 4Z, the areas nearestoffice transport interchange,
Successful container park seQuencing (i e. the laying-down ofcontainers in an order which directly matches the ships loadingrequirementsl and the ultimate productivity rates of the loadingvessel depend on container park segregation This is a fundamentalproblem A high degree of terminal utilisation can result in ashortage of suitable working storage slots For example, a vesselwhich normally operates from T3 berth would be severely disadvantagedif because of congestion in T3, its exports were assigned to 5WSimilarly, the terminal would suffer the productivity loss
280

COMMON-USER TERMINALS
Inevitably, overstowing does occur When it does, crane handling ratescan be particularly sensitive to delays incurred through van carriers'digging-out' containers in the stacking area
~ practises
Unlike conventional cargo operations, container terminal labour cannotbe used to supplement shortfalls in cargo handling plant and equipment.The container is solely reliant on artificial lifting aids Because ofthis the ntio of plant drivers to general duty workers in terminalstends to be high,
Labour disposition in terminals can vary between two extremes, Someterminals employ a permanently attached workforce who are allocated tospecific machines or jobs, or who rotate between jobs within theter'minal Other terminals, particularly common-users, may be allocatedworkers who rotate through conventional cargo berths as well as thecontainer terminal, Terminals which achieve consistently highproductivity rates tend to be those with the minimum amount of jobrotation
Tables 5 and 6 provide rotational manning scales for a common·-userterminal. From the data, it is evident that the operator at thisterminal employs a large reservoir of static labour', As an example
TABLE 5: MOBILE PLANT DRIVERS - MODEL 'T.'. MANNING SCALE (A)
--'-~------_._---"--------_._---_._----_._------------
Job Title Personnel Plant
road transport interchangeT3 berth officeT4T5
rail transport inte~change
gantryvan carriersyard tractor/trailers
555
236
3 van carriers33
1 gantry2 van can:iers4 units
pershift
pershift
shipworkcontainer cranesvan carrierstugmaster
groupagevan carriersSt., fork lift truckslOt ..
1025
4
224
1
5 container cranes)15 van carriers )per
4 tugmasters ) shift
1 van carrier24 St '. fork lift trucks
1 lOt.,
assumesdayshJ.ftonly
supervisorplantforemen 2 )per shift
(A) Does not include permanent 'reserves l
Source: Personal Communication.
281

TABLE 6. GENERAL DUTY AND ANCILLARY LABOUR - MODEL tT.' MANNING SCALE
~
Job Title
road transport interchangeT3 berth office
T4
T5
gate houselorry queue
rail transport interchangegeneral duty man
checker
shipworkholdsmancheCker
deckhandgantry manforeman and assistantfore ;n' afterplanman
park foreman
Direct Labour
2
2
2
31
4
1
40la
10la10
5
Duties
basic documentationand inspection
documentationmarshal! ing
l foreman3 general dutiesbas~c documentation
snipboard duties/laShingcargo handling delaysand baSic documentationgantry driver liaisonvan carrier contactsuperv~sion
lashing
Ancillary Staff
B
B
B
5
(see above)
5
4
Duties
all documentationassociated withshipworK and )landside transport)operations )
documentation
(see above)
"
container loadingrecordscontainer stacKplanning
pershift
pershift
pershift
pershift
III:0o:;:z
groupageporter
foremanwharfingericounter-off
Source: As Table 5
36 pacKing and unpaCKing
of containers I·
l superVlsl0n
I J20 cargo contrOl and
documentation
assumesdayshiftonly

COMMON-USER TERMINALS
as table 5 shows, to balance plant labour supply against variableoperational demand, the terminal operator over-employs plant drivers ona daily basis, When the terminal is slack, labour sUI'plusses occur"
Within this terminal oveI'-manning, there are a further set of factors,In nearly all co~tinuous operation terminals, cargo handling jobs are'over-manned', sometimes to the extent of double the actual number ofworkers necessary to complete the task. (see Table 6) The reasonsfor this are to allow cover's for 'rolling' tea-breaks and also torelieve fatigue in certain key operators such as container cranedriver s. MUltiple manning, however'. does not overcome lostproductivity as a result of labour inflexibility"
Examples of lost pr'oductivity due to inflexible working practises arisewhere:
Drivers refuse to be allocated to more than one machine/jobin a working period
2 Van carrier driversterminal canteen andof a ter'minal bus
change over' with their relief at thenot at the ship, despite the provision
3 Mobile plant is parked at random' around the terminal or atthe nearest point to the car par'k at the close of each shift
Rotational plant dr ivers have to be dr'afted in from otherberths This results in delays before machines actuallystart moving,
5" Drivers are unwilling to transfer to another ship oncompletion of their work
6 Gangs employed on shipwork insist on their full unit ofmanning This means crane., van carrier and tugmaster driversmust be hired even if there is a requirement for onlyla shing
7 Rotational labour means that plant drivers are only at theter'minal for relatively short periods Because of this, lackof interest may be shown
B.
Clearlyseverelydemand,ancillar'y
Because a lot of shipwork for example, discharging andbackloading the same hatch, does not require holdsmen inattendance there is a tendency for them to 'drift' from thejob, in some cases from the terminal. A flexible manningsystem would allow these workers to be usefully employedelsewhere
the operator of the terminal shown in Tables 5 and 6 isrestricted in his ability to balance labour supply againstThis is particularly true for his permanently assignedstaff who constitute 25 per cent of his total labour force
Formal manning agreements can be used to identify working arrangementswhich restrict productivity However these productivity losses areusually recorded losses which can be 'negotiated out Whereunrecorded productivity shortfalls occur within existing labour
283

BROWN
agreements it is quite often a case of lapsed or inefficient terminalrule keeping
CONCLUSION
Internationally comparable productivity measures reflect a considerabledegI'ee of overmanning within container terminals A major difficultyin productivity comparison analysis appears to be that there are noreliable measures of the growth of capital assets in containerterminals, relative to any assumed increase in manpower productivity
Within the general par'ameter's of a common-user terminal, this paper hasdiscussed some of the factors which inhibit container vessel cargohandling productivity By concentrating on the ship to quay interfaceit has been suggested that some breakpoints in the terminal processleading up to the 'lift although well indicated, are in practice,largely ignored, Using two key elements has illustrated why there canbe marked productivity differences between what is theoreticallyfeasible and what is actually achievable, at the ship interface
These examplesindicate thatirrespective of
even allowing forsome improvement isexternal constraints
284
static labourpossible at the
inflexibility,terminal level

COMMON-USER TERMINALS
ApPENDIX
Terminology
~~ -~ Containers ftl Hour
Ship' 5 throughput divided by the total Gross Crane Working Hours(see definition 2) accumulated during a ship call gives the numberof containers handled per crane per hour. This is the rate of workwhich includes the effects of delaying factors, By its nature itwill vary as a result of delays and therefoI'e the differencebetween this rate and Net Crane Rate is a measure of thesignificance of the delays found at a terminal
2" Gross Crane Working Hours
Number of hours spent on cargo working recorded at each crane fromstart to completion of its work, but excluding time when theterminal does not normally work i e. meal breaks and time betweenshifts, Also excluded would be holidays which are not worked ortime when the terminal decides not to work the ship Gross timeincludes delays due to mechanical failure, strikes, etc , when itis intended that work should be in progress, The hours of eachcrane used on a particular ship are accumulated to give the GrossCrane Working Hours for the ship.
3 Crane Rate - Ne!. Containers ill Hour
Ship 5 throughput divided by the total Net Crane Working Hours(see definition 4) accumulated during a ship call gives the numberof containers handled per ~rane per net hour'. It is a measure ofthe rate of carrying out the cargo work devoid of delay time,
Net Crane Working Hours accumulate in the same way as Gross CraneWorking Hours The difference between the two is that alldelays, measured in crane hours, due to mechanical failure,strikes, etc" are substracted from the gross hours to give nethours. Net Working Hours is therefore the time spent on targo workand the ancillary tasks connected with it such as moving hatchlids, lashing and changing spreaders,
285

BROWN
REFERENCES
Andruszkiewicz, W, (19831 'Time as a factor in Increasing the EconomicEfficiency of Ports and Sea-Land TI'ansport" in.I.!:!g Economics of LongDistance Transportation International Economic Association New York
Bureau of Transport Economics (1984) A ReviewOther System Characteristics· Backglound paper toCosts Seminar, Sydney
of Performance andShole~Based Shipping
Harding, A,,$ and Ryder, S C.Arrivals on liner Term1nals w1thCentre, University of Liverpool
(1978) The~ of Irregular ihiQ,High Fixed Costs Marine Transport
Imakita, (1978)System Saxon House
A Techno Economic Analysis of ihg Port Transport
Jansson J 0, and Shneerson 0 (1982) Port Economics M,I T
Johnson K.M and Garnett H CContainerisation George AlIen ~ Unwin
( 19711 Economics
Meeuse G"C, (1977) Transport decisions in an age of uncertaintyTrends in port research' in Proceedings of the third World Conferenceon Transport Research, Martinus Nijhoff The Hague
National Ports Council (1978)A survey of current practice,
National Ports Council (1981)Final NPC BUlletin, London,
Containers Their Handling and TransportNPC, London
'Review of Br i tish Container Terminals'
Ogden, K.W (19B4) Shore Based Shipping Costs~ The Urban FreightComponent" BUI'eau of Transport Economics, ShaI'e-·Sased Shipping CostsSeminar Sydney
Roberts, A H (1 9B4 ) 'Case Study: The Effects of Uncoordinated RoadMovements at Wharfside Installations' Bur'eau of Transport Economics,Shore,-Based Shipping Costs Seminar Sydney
Stubbs, P (19B3) Australia .and..t..!J..g Maritime Industries AustralianIndustries Oevelopment Association
R Travers Morgan (19B3)Sydney: Final Report'Freight Transport Industry
Study of Container Transport andReport prepared for New SouthCouncil, Sydney
286
Handling inWales Road