commodity monthly monitor
TRANSCRIPT

Summary
• Contents
Commodities market overview 1
Summary tables 4
• CFTC net positioning 5
Inventories 9
Moving average and volumes 13
Futures curves 17
• Recent publications 21
•
Commodity Monthly Matrix1 Performance
2- 1 Mth - 6 Mth - 12 Mth
All Commodities 0.5% 13.0% 32.8%
Energy 1.3% 22.8% 37.1%
WTI Oil 68.7 -4.1% 11.7% -10.7% -16% 0.4% 1 1 Industrial Metals -0.1% 9.6% 36.2%
Brent Oil 72.7 -2.4% 12.9% -2.8% - 1.4% 3 3 Precious Metals 0.1% 1.4% -8.1%
Natural Gas 4.37 10.0% 43.8% 28.7% -21% -0.4% (2) 0 Agriculture 0.3% 11.7% 53.8%
Gasoline 2.27 -1.7% 18.8% -2.8% 1% 7.3% 3 2 MSCI World 2.2% 13.2% 28.3%
Heating Oil 2.11 -1.6% 13.6% -2.2% 28% 0.1% 3 0 US Aggregate Bond -0.1% 1.5% 0.2%
Carbon 59.0 11.6% 33.6% - - 0.0% 0 0
Wheat 7.19 6.5% 8.7% -1.1% 7% -1.9% 2 (1)
Corn 5.58 1.7% -2.5% -1.3% 10% 0.8% 3 0
Soybeans 13.6 -4.2% -3.0% 3.7% -15% 2.7% (2) 1
Sugar 0.20 9.2% 20.1% - 12% -3.1% 1 (1)
Cotton 0.96 6.1% 14.4% -3.6% 22% 1.5% 4 4
Coffee 1.90 -6.1% 33.3% -8.4% -4% -1.4% (1) (1)
Soybean Oil 0.61 -7.5% 10.9% 10.6% 3% 1.3% 1 1
Cocoa 2,602 8.7% 4.0% - 3488% 0.8% 4 (4) CFTC Net Speculative PositioningAluminium 2,641 5.5% 16.1% -22.9% 11% -0.2% 2 2 (in '000 contracts)
Copper (COMEX) 4.32 -5.0% 5.6% -17.9% -78% 0.0% (1) 3
Copper (LME) 9,414 -3.4% 5.1% 105.5% 13% 0.0% 1 (1)
Zinc 2,996 0.7% 4.9% -21.4% 17% -0.1% 2 (1)
Nickel 19,014 -1.7% 7.7% -21.2% -3% 0.0% 1 2
Lead 2,331 -0.8% 9.9% 36.5% -4% 0.9% (1) 0
Tin 34,090 -2.9% 21.4% -59.6% 2% 0.7% 3 2
Gold 1,817 1.0% 0.4% - 7% 0.0% 4 (4)
Silver 24.1 -2.3% -7.1% - -35% 0.0% (4) (4)
Platinum 1,006 -4.0% -10.4% - -26% 0.0% (4) (3)
Palladium 2,402 -7.8% -6.3% - -141% -0.1% (4) (3)
Live Cattle 1.22 -0.8% 3.7% - 28% -5.5% 0 (3)
Lean Hogs 0.91 -15.6% -2.6% - -8% 9.2% (1) 0
Feeder Cattle 1.65 2.5% 14.2% - 30% -2.2% 1 0Source: WisdomTree, Commodity Futures Trading Commission (CFTC), Bloomberg
1
Bloomberg TR Indexes for basket returns, data to Friday 27 August 2021. Source:
WisdomTree, Bloomberg
The score matrix is designed to highlight significant changes in key variables but should not be viewed as predictor of performance. Source: WisdomTree,
- Information not available. Green = returns positive, inventories falling, positioning rising, roll yield positive. Red = the opposite. Black = neutral. 1 Detailed explanation of the matrix calculations can be found at the end of this
report. 2 All prices are futures prices to Friday 27 Aug 21. Broad sector returns based on Bloomberg Commodity Index family. 3 % change in inventory over the past 3 months except for sugar and coffee which are based on
past 6 months as data is updated bi-annually by USDA. 4 CFTC futures and LME COTR net positioning as at Aug 24, 2021 and Aug 27, 2021 respectively, % change from previous month. 5 Calculated as % difference between
front month and second month futures prices on report date.
Current
Price2
Returns
(-1 Mth)
Positioning4
(- 1 Mth)
27 Aug
Score
16 Jul
Score
Inventories3
(- 3 Mths)
Price vs 200
days MARoll Yield
5
Commodity Monthly Monitor
Even the fittest runners need a break27 July 2021 - 27 Aug 2021
Commodities have been on a stellar run this year. Even the word ‘supercycle’ has returned to the
commonly used terms section in investor handbooks. In the last edition of this report, we observed that
the second quarter of this year marked the strongest quarterly return for commodities when the
Bloomberg Commodity Total Return (BCOM TR) Index was up 13.3%. As of the end of August, BCOM TR
Index has outpaced the S&P 500 Index – remarkable given US equities too are on a roll. But alas,
athletes need breaks and bull runs take pauses. August was one such month for commodities.
Strong US labour market data at the start of August indicated that the economic recovery is on track –
supposedly a good sign for cyclicals. Nonetheless, strong data quickly morphed into concerns of
tapering from the US Federal Reserve (Fed). This helped lift the US dollar and put pressure on
commodities across the board. Over the course of the month, however, hawkish concerns subsided,
dollar gave back some of its gains, and commodities bounced back. Overall, commodities finished
broadly flat over the month.
Annual inflation in the US for July remained elevated at 5.4%, the same reading as June challenging
the Fed’s narrative of inflation being transitory and making the central bank’s September meeting one
that commodity investors will be observing closely. Eurozone inflation also jumped to 3% in August, up
from 2.2% in July. Broad commodities are likely to remain attractive for investors as a hedge against
these rises in inflation, a role the asset class has played effectively in the past.
So where might the next trigger for positive momentum come from for commodities? Most recently,
the slowdown in China’s economic activity, as evident from a contractionary manufacturing
Purchasing Managers’ Index (PMI) for August has not helped. China’s long term growth prospects and
demand for commodities go hand in hand, but individual data points can help stimulate market
sentiment. Support may also come if additional pressure mounts on the dollar. Rising levels of inflation
in Europe may help narrow expectations of interest rate differentials between Europe and the US. This
could cap the advance of the US dollar and help boost commodities.
Nitesh Shah
Director
Mobeen Tahir
Associate Director
Precious metals retreat then recover to end the month broadly flat. Gold fell initially in response to
strong US labour market data at the start of August but then recovered as the Fed maintained its
dovish stance at the Jackson Hole symposium.
Agricultural commodity performance bifurcated by changing supply situation. Sugar, wheat, and
cotton continue to benefit from a tighter supply situation in key producer nations. Cocoa prices
benefited from a steep rise in net speculative positioning however the ample supply situation is
likely to remain a headwind for further upside.
Industrial metals unable to recover their positive momentum in August as Chinese economic data
points to a slowdown. While the industrial metals basket was broadly flat over the month, aluminium
proved to be a notable bright spot with the metal being supported by improving fundamentals.
Hurricane Ida makes its presence felt in the energy sector. The extensive damage caused by
Hurricane Ida in the US is raising concerns on reduced supply of Liquified Natural Gas (LNG) to
Europe. This in turn is pushing the demand for carbon as high natural gas prices in Europe drive gas-
to-coal switching in the power sector. Crude oil processing could take longer to recover than
crude oil production owing to the ongoing power outages caused by Hurricane Ida which could
result in the increase in crude oil stocks.
Aneeka Gupta
Director
-1,000
-500
0
500
1,000
1,500
2,000
2,500
3,000
3,500
2016 2017 2018 2019 2020
Precious Metals Livestock Industrial Metals
Energy Agriculture
Historical performance is not an indication of future performance and any investments may go down in value.

Agriculture Agriculture - August Returns*
•
•
Source: Bloomberg
Industrial Metals Industrial Metals - August Returns*
•
•
•
Source: Bloomberg
Energy Energy - August Returns*
•
•
Source: Bloomberg
Precious Metals Precious Metals - August Returns*
•
•
•
•
2
Source: Bloomberg
*Note: all returns are based on front month futures prices in the month to Friday 27 August 2021.
Historical performance is not an indication of future performance and any investments may go down in value.
Industrial metals, as a group, were down 0.1% last month, the second consecutive month of mixed
performance across the range. Industrial metals have been hampered by three key headwinds
since July. First, China has been selling state reserves of copper, aluminium, and zinc, in undisclosed
quantities to control the prices of these metals since July. While markets initially priced in the worst,
the impact of this on total market balance has turned out to be less severe than anticipated. As a
result, the headwind continued to subside over August. Second, US dollar’s recent strength has
weighed on industrial metals. And third, strong US labour market data at the start of August – a
good sign for the economy and cyclical assets – ignited apprehensions of a hawkish shift from the
Federal Reserve – a not-so-great sign for risk assets. Ultimately, the Fed quashed such concerns
when Jay Powell made what markets perceived as a dovish speech at Jackson Hole. Industrial
metals, like other risk assets, breathed a sigh of relief.
Most recently, a cooldown in Chinese economic data has dampened the positive sentiment in
industrial metals. China’s Manufacturing Purchasing Managers’ Index (PMI) for August fell into
contractionary territory in August for the first time since the first quarter of 2020. Even though the key
themes driving industrial metals are medium-to-long term, i.e., reflation, infrastructure spending by
governments, and the energy transition, short-term economic data – particularly from China – will
continue to determine how quickly the rally can resume its positive momentum.
Aluminium was, however, a bright spot among industrial metals last month rising 5.5%. The global
pandemic hit the automobile industry particularly hard, with semiconductor shortages impeding
manufacturing activity even after the economic recovery had otherwise begun. Early signs of
these shortages easing may be on the horizon. Since the transport sector accounts for 23% of
aluminium demand (Statista 2021), this is a positive sign for the metal. On the supply side, China’s
crackdown on coal-powered aluminium production for environmental reasons since the start of
this year has resulted in supply cuts and producers looking to transition towards alternative energy
sources. With China being the largest aluminium producer by far, this could keep the market
undersupplied for years. Market pricing is beginning to reflect this ‘tightness’ with aluminium’s
futures curve going from contango to backwardation in recent months, a relatively unusual state
for an industrial metal.
Sugar prices are being driven higher by the prospect of lower sugar production in Brazil. After
severe drought at the start of the year, followed by extreme frost in the Centre-South growing
region in July, the volume of sugar cane in 2021/22 has been adjusted lower by the Brazilian
Sugarcane Industry Association (Unica). Unica now envisages the volume of sugar cane to be
around only 530mn tons compared to 605mn tons last year. Added to that, the world’s second
biggest sugar producer India is considering withdrawing its sugar export subsidies from the new
season beginning in October given the strong sugar prices. The lack of incentives for the next
season could weigh on sugar exports from India. The International Sugar Organisation increased its
sugar deficit estimate for the 2021/22 season to 3.83mn tons compared to the prior forecast of a
deficit of 2.65mn tons. Global production is expected to increase marginally by 0.2% over the prior
year to 170mn tons, while consumption is expected to rise by 1.6% versus last year to 174.5mn tons
in 2021/22.
Cotton prices are trading near a seven year high. The unexpected downward revision of the US
cotton crop estimate by the United States Department of Agriculture (USDA) coupled with the
prospect of tropical storms in key US cotton plantations is lending buoyancy to cotton prices. The
impact of the lower US crop is being reflected in global figures. USDA expects the global cotton
crop to total 118.8mn bales, with ending stocks set to fall to 87.2mn bales, which is 500,000 bales
lower than the prior forecasts. At the same time world consumption has staged a strong
comeback at 119mn bales in 2020/21 reported last month, representing a sharp rise from the prior
estimates of 102.8mn bales during the pandemic levels.
Sector Overview
Carbon (European Union Carbon Emissions Allowances) staged a strong recovery over the prior
month benefitting from the price rally in the European gas market. The extensive damage caused
by Hurricane Ida in the US is raising concerns on reduced supply of LNG to Europe. The supply
situation on the gas market is already tight and could tighten further owing to the damage caused
by Hurricane Ida. Higher gas prices raise the need to switch to produce coal-fired (emission
intensive) electricity, which should subsequently push demand for allowances higher. In addition,
the auction supply which tends to be low at this time of the year is also lending a tailwind to
carbon prices.
Oil prices came under pressure last month ahead of the meeting of the Organization of the
Petroleum Exporting Countries and its partners (OPEC+). As expected, OPEC+ agreed to continue
the monthly production hikes by 400,000 barrels per day (bpd) through May 2022. OPEC+ was
confident that the oil market will remain in a deficit until year end due to increasing demand
driving the need for additional supply. However, the outlook is expected to change next year.
Despite the increase in the demand forecast for 2022 by 920,000 bpd by OPEC+ Joint Technical
Committee (JTC), the oil market is expected to see an oversupply of 1.6mn bpd next year due to a
simultaneous surge in oil supply. Oil prices are likely to remain under pressure as uncertainties
continue to lurk on the horizon. For one, demand remains under threat from the emergence of new
coronavirus strains. In addition, the US and Iran could still reach a deal allowing for a gradual
increase of Iranian oil exports.
Precious metals were up 0.1% last month with gold being the only metal in the basket ending the
month in positive territory.
The month was split into two halves for precious metals. In the first half, the basket retreated as
strong US labour market data prompted investors to worry about the Fed adopting a hawkish
policy stance. By the second half of the month, markets began anticipating a continuation of the
ongoing dovishness from the Fed. This expectation turned out to be true when Jay Powell made no
hawkish announcements during his Jackson Hole speech. The basket recovered to end the month
broadly flat. Under the hood, however, gold recouped its losses from earlier in the month, but silver,
platinum, and palladium finished in negative territory.
US consumer price index inflation rate remained at 5.4% for July, the same reading as the month
before. More recently, eurozone inflation has also shot up to 3% in August, up from 2.2% in July.
Persistently elevated levels of inflation have not yet managed to lift speculative positioning for
gold which remains meaningfully below this time last year. Focus now turns to the Fed’s September
meeting in which it may signal what its policy course might be for the rest of the year, although a
sharp deviation from status quo seems unlikely.
Platinum was down 4% while palladium was down 7.8% last month. The fates of platinum and
palladium are inextricably tied to the dynamics of the automobile market, given auto catalysts are
the largest demand source for the two metals. Demand growth since the pandemic has been
under the cloud of semiconductor shortages facing the automobile industry, i.e., fewer
semiconductors for automobiles means fewer cars manufactured and, therefore, lower demand
for auto catalyst materials. If gold lifts further, respite may come for both platinum and palladium
on account of their correlation with gold. Issues in the automobile supply chains may take a bit
longer to resolve but once they do, the strong fundamentals of the two metals should prove fruitful.
-6%
-4%
-2%
0%
2%
4%
6%
8%
10%
12%
14%
Ca
rbo
n
Na
tura
l G
as
He
atin
g O
il
Ga
solin
e
Bre
nt
Oil
WTI
Oil
-20%
-15%
-10%
-5%
0%
5%
10%
15%
Su
ga
r
Co
co
a
Wh
ea
t
Co
tto
n
Fe
ed
er
Ca
ttle
Co
rn
Live
Ca
ttle
So
yb
ea
ns
Co
ffe
e
So
yb
ea
n O
il
Lea
n H
og
s
-9.0%
-8.0%
-7.0%
-6.0%
-5.0%
-4.0%
-3.0%
-2.0%
-1.0%
0.0%
1.0%
2.0%
Go
ld
Silv
er
Pla
tin
um
Pa
llad
ium
-6%
-4%
-2%
0%
2%
4%
6%
8%
Alu
min
um
Zin
c
Lea
d
Nic
ke
l
Tin
Co
pp
er
(LM
E)
Co
pp
er
(CO
MEX
)
`
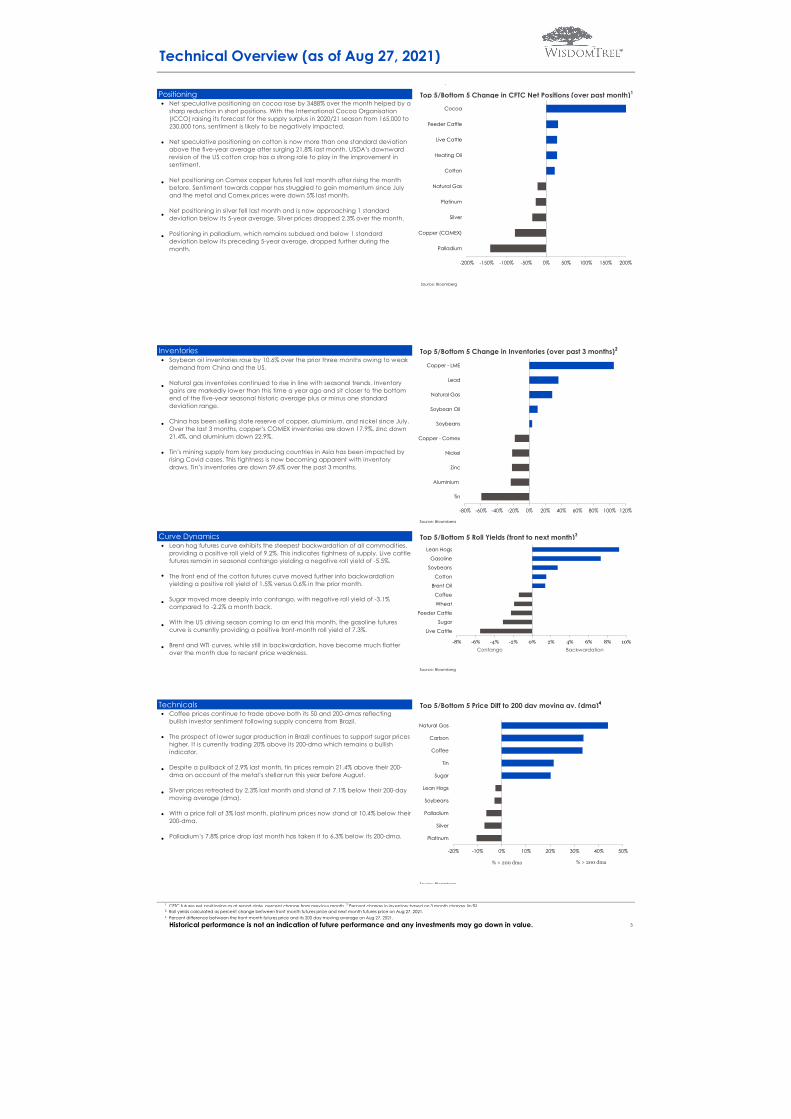
Positioning Top 5/Bottom 5 Change in CFTC Net Positions (over past month)1
•
•
•
•
•
Source: Bloomberg
Inventories Top 5/Bottom 5 Change in Inventories (over past 3 months)2
•
•
•
•
Curve Dynamics Top 5/Bottom 5 Roll Yields (front to next month)3
•
•
•
•
•
Source: Bloomberg
Technicals Top 5/Bottom 5 Price Diff to 200 day moving av. (dma)4
•
•
•
•
•
•
Source: Bloomberg
1 CFTC futures net positioning as at report date, percent change from previous month. 2 Percent change in inventory based on 3 month change (in %).
3 Roll yields calculated as percent change between front month futures price and next month futures price on Aug 27, 2021.4 Percent difference between the front month futures price and its 200 day moving average on Aug 27, 2021.
3
Coffee prices continue to trade above both its 50 and 200-dmas reflecting
bullish investor sentiment following supply concerns from Brazil.
The prospect of lower sugar production in Brazil continues to support sugar prices
higher. It is currently trading 20% above its 200-dma which remains a bullish
indicator.
Despite a pullback of 2.9% last month, tin prices remain 21.4% above their 200-
dma on account of the metal’s stellar run this year before August.
Silver prices retreated by 2.3% last month and stand at 7.1% below their 200-day
moving average (dma).
With a price fall of 3% last month, platinum prices now stand at 10.4% below their
200-dma.
Palladium’s 7.8% price drop last month has taken it to 6.3% below its 200-dma.
Historical performance is not an indication of future performance and any investments may go down in value.
Technical Overview (as of Aug 27, 2021)
Net speculative positioning on cocoa rose by 3488% over the month helped by a
sharp reduction in short positions. With the International Cocoa Organisation
(ICCO) raising its forecast for the supply surplus in 2020/21 season from 165,000 to
230,000 tons, sentiment is likely to be negatively impacted.
Net speculative positioning on cotton is now more than one standard deviation
above the five-year average after surging 21.8% last month. USDA’s downward
revision of the US cotton crop has a strong role to play in the improvement in
sentiment.
Net positioning on Comex copper futures fell last month after rising the month
before. Sentiment towards copper has struggled to gain momentum since July
and the metal and Comex prices were down 5% last month.
Net positioning in silver fell last month and is now approaching 1 standard
deviation below its 5-year average. Silver prices dropped 2.3% over the month.
Positioning in palladium, which remains subdued and below 1 standard
deviation below its preceding 5-year average, dropped further during the
month.
Lean hog futures curve exhibits the steepest backwardation of all commodities,
providing a positive roll yield of 9.2%. This indicates tightness of supply. Live cattle
futures remain in seasonal contango yielding a negative roll yield of -5.5%.
The front end of the cotton futures curve moved further into backwardation
yielding a positive roll yield of 1.5% versus 0.6% in the prior month.
Sugar moved more deeply into contango, with negative roll yield of -3.1%
compared to -2.2% a month back.
With the US driving season coming to an end this month, the gasoline futures
curve is currently providing a positive front-month roll yield of 7.3%.
Brent and WTI curves, while still in backwardation, have become much flatter
over the month due to recent price weakness.
Soybean oil inventories rose by 10.6% over the prior three months owing to weak
demand from China and the US.
Natural gas inventories continued to rise in line with seasonal trends. Inventory
gains are markedly lower than this time a year ago and sit closer to the bottom
end of the five-year seasonal historic average plus or minus one standard
deviation range.
China has been selling state reserve of copper, aluminium, and nickel since July.
Over the last 3 months, copper’s COMEX inventories are down 17.9%, zinc down
21.4%, and aluminium down 22.9%.
Tin’s mining supply from key producing countries in Asia has been impacted by
rising Covid cases. This tightness is now becoming apparent with inventory
draws. Tin’s inventories are down 59.6% over the past 3 months.
Source: Bloomberg
-80% -60% -40% -20% 0% 20% 40% 60% 80% 100% 120%
Copper - LME
Lead
Natural Gas
Soybean Oil
Soybeans
Copper - Comex
Nickel
Zinc
Aluminium
Tin
-20% -10% 0% 10% 20% 30% 40% 50%
Natural Gas
Carbon
Coffee
Tin
Sugar
Lean Hogs
Soybeans
Palladium
Silver
Platinum
% < 200 dma % > 200 dma
-8% -6% -4% -2% 0% 2% 4% 6% 8% 10%
Lean Hogs
Gasoline
Soybeans
Cotton
Brent Oil
Coffee
Wheat
Feeder Cattle
Sugar
Live Cattle
Contango Backwardation
-200% -150% -100% -50% 0% 50% 100% 150% 200%
Cocoa
Feeder Cattle
Live Cattle
Heating Oil
Cotton
Natural Gas
Platinum
Silver
Copper (COMEX)
Palladium

4 23 42 61 4 3
Energy Energy
WTI Oil 68.7 USD/bbl. -4.1% 2.8% 11.8% 59.7% WTI Oil USD/bbl. NYMEX 0.4% 0.3% 0.7% 0.4%
Brent Oil 72.7 USD/bbl. -2.4% 4.7% 9.9% 61.2% Brent Oil USD/bbl. ICE 1.4% 0.7% 1.3% 0.4%
Natural Gas 4.37 USD/MMBtu 10.0% 47.7% 57.7% 69.4% Natural Gas USD/MMBtu NYMEX -0.4% -0.4% 0.7% -0.7%
Gasoline 2.27 USd/gal. -1.7% 5.7% 21.2% 77.0% Gasoline USd/gal. NYMEX 7.3% 7.1% 1.4% -0.2%
Heating Oil 2.11 USd/gal. -1.6% 2.6% 13.6% 74.2% Heating Oil USd/gal. NYMEX 0.1% -0.1% -0.1% 0.1%
Carbon 59.0 EUR/MT 11.6% 13.9% 58.4% 108.0% Carbon EUR/MT ICE 0.0% 0.0% 0.0% 0.0%
Agriculture
Wheat 7.2 USd/bu. 6.5% 6.2% 9.7% 32.4% Wheat USd/bu. CBOT -1.9% -1.9% -1.4% -0.5%
Corn 5.6 USd/bu. 1.7% -16.0% 0.5% 62.1% Corn USd/bu. CBOT 0.8% 0.3% 0.5% 13.5%
Soybeans 13.6 USd/bu. -4.2% -11.6% -3.3% 45.0% Soybeans USd/bu. CBOT 2.7% 0.2% 3.7% 3.3%
Sugar 0.20 USd/lb. 9.2% 17.1% 14.3% 56.9% Sugar USd/lb. NYBOT -3.1% -3.3% -2.2% -0.6%
Cotton 0.96 USd/lb. 6.1% 16.5% 9.6% 48.7% Cotton USd/lb. NYBOT 1.5% 0.9% 0.6% -1.6%
Coffee 1.90 USd/lb. -6.1% 22.0% 38.5% 54.1% Coffee USd/lb. NYBOT -1.4% -1.8% -1.4% -1.2%
Soybean Oil 0.61 USd/lb. -7.5% -8.2% 19.4% 84.0% Soybean Oil USd/lb. CBOT 1.3% 1.3% 2.9% 5.7%
Cocoa 2,602 USD/MT 8.7% 7.1% -3.7% 0.5% Cocoa USD/MT NYBOT 0.8% 0.5% -1.8% -1.5%
Industrial Metals Industrial Metals
Aluminum 2,641 USD/MT 5.5% 7.3% 23.9% 50.8% Aluminum USD/MT LME -0.2% -0.2% 0.4% -0.4%
Copper 4.32 USd/lb. -5.0% -7.5% 5.4% 45.6% Copper USd/lb. COMEX 0.0% -0.1% 0.1% 0.1%
Copper (LME) 9,414 USD/MT -3.4% -7.8% 3.5% 41.9% Copper (LME) USD/MT LME 0.0% 0.0% -0.1% -0.1%
Zinc 2,996 USD/MT 0.7% -1.7% 7.8% 21.4% Zinc USD/MT LME -0.1% -0.1% -0.2% -0.2%
Nickel 19,014 USD/MT -1.7% 6.4% 2.6% 25.4% Nickel USD/MT LME 0.0% 0.0% 0.0% -0.1%
Lead 2,331 USD/MT -0.8% 6.5% 14.1% 18.7% Lead USD/MT LME 0.9% 0.4% 0.2% -0.3%
Tin 34,090 USD/MT -2.9% 8.2% 28.9% 91.2% Tin USD/MT LME 0.7% 0.4% 0.6% 2.0%
Precious Metals Precious Metals
Gold 1,817 USD/t oz. 1.0% -4.2% 5.1% -5.5% Gold USD/t oz. COMEX 0.0% 0.0% 0.0% -0.1%
Silver 24.1 USD/t oz. -2.3% -13.8% -8.9% -10.9% Silver USD/t oz. COMEX 0.0% 0.0% 0.0% -0.1%
Platinum 1,006 USD/t oz. -4.0% -14.6% -15.0% 8.8% Platinum USD/t oz. NYMEX 0.0% 0.0% 0.0% -0.1%
Palladium 2,402 USD/t oz. -7.8% -14.3% 4.0% 11.4% Palladium USD/t oz. NYMEX -0.1% -0.1% -0.1% -0.1%
Livestock Livestock
Live Cattle 1.22 USd/lb. -0.8% 4.9% 7.9% 18.5% Live Cattle USd/lb. CME -5.5% -3.7% -4.3% -2.6%
Lean Hogs 0.91 USd/lb. -15.6% -21.6% 4.1% 62.8% Lean Hogs USd/lb. CME 9.2% 8.5% 16.2% -0.8%
Feeder Cattle 1.65 USd/lb. 2.5% 20.8% 18.7% 16.0% Feeder Cattle USd/lb. CME -2.2% -3.9% -2.0% -10.8%
EnergyE
nEnergy
WTI Oil 443,604 513,318 526,691 558,799 522,555 Oil - US 432,564 7.4% -1% -11% -11%
Brent Oil** 0 159,281 0 44,565 -91,220 Oil - OECD Europe** 342 7% 0.1% -2.8% -5%
Natural Gas -165,976 -67,434 -136,646 27,959 14,751 Natural Gas - DOE 2,851 6.5% 5% 29% 55%
Gasoline 37,214 73,215 36,976 47,211 72,011 Gasoline - DOE 225,924 3.6% -4% -3% -7%
Heating Oil 34,227 16,776 26,807 4,164 15,035 Heating Oil - DOE 8,423 4% -7% -2% 2%
Agriculture Industrial Metals
Wheat 26,788 -14,476 25,134 39,743 15,238 Aluminum 1,587,051 -15% -5% -23% -4%
Corn 338,914 84,970 308,484 504,397 18,339 Aluminum - LME 1,338,125 -5% -5% -22% 1%
Soybeans 80,524 59,713 94,947 214,968 139,868 Aluminium - SHFE 248,926 -46% -7% -26% -26%
Sugar 298,345 67,378 266,807 248,667 236,597 Copper 387,201 -24% 6% -5% 32%
Cotton 106,345 58,618 87,283 97,552 63,079 Copper - LME 254,250 13% 13% 105% 234%
Coffee 49,934 -5,576 52,269 57,041 42,753 Copper - SHFE 82,390 -53% -14% -63% -44%
Soybean Oil 59,851 44,890 58,045 128,664 79,308 Copper - COMEX 50,561 -53% 13% -18% -27%
Cocoa 26,840 13,972 748 33,104 33,539 Nickel - LME 195,252 -26% -10% -21% -22%
Industrial Metals5 Zinc 290,432 -3% 2% -21% -25%
Copper (COMEX) 8,123 17,472 37,670 75,754 48,338 Zinc - LME 238,275 13% -4% -17% -12%
Copper (LME) 45,833 41,953 40,642 66,327 67,348 Zinc - SHFE 52,157 -42% 43% -37% -55%
Aluminum 174,717 165,714 157,450 204,004 192,435 Lead 250,885 60% 14% 36% 86%
Nickel 30,268 24,251 31,091 43,088 34,378 Lead - LME 55,450 -53% -10% -44% -41%
Zinc 83,850 51,890 71,691 73,462 57,856 Lead - SHFE 195,435 406% 24% 131% 381%
Lead 63,106 53,617 65,937 58,608 57,116 Tin 2,782 -69% -49% -60% -72%
Tin 6,456 8,178 6,301 8,259 8,099 Tin - LME 1,585 -53% -32% 85% -8%
Precious Metals Tin - SHFE 1,197 -79% -62% -80% -86%
Gold 220,506 191,075 205,700 216,845 250,097A
gAgriculture
Silver 19,278 39,300 29,558 48,982 37,095 Wheat - USDA 292 -99.8% -1.7% -1.1% -1.3%
Platinum 8,892 22,876 12,024 34,515 19,828 Corn - USDA 279,860 115% -0.3% -1.3% -7.6%
Palladium -454 10,506 1,118 405 2,551 Soybeans - USDA 94,490 59% 2.1% 3.7% 9%
Livestock Sugar - USDA 1,468 -96% - - 0%
Live Cattle 119,550 88,354 93,583 109,862 82,021 Cotton - USDA 87,740 38% -1.7% -3.6% -6.1%
Lean Hogs 91,858 46,861 99,671 81,729 37,685 Coffee - USDA 36,566 5% 14.2% -8.4% -8%
Feeder Cattle 11,428 6,401 8,782 3,885 9,663 Soybean Oil - USDA 4,522 11% 9.2% 11% 0%
1Performance of front month futures from 27 Aug 20 (1 Year), 27 Feb 21 (6 Month), 27 May 21 (3 Month) and 27 Jul 21 (1 Month) to 27 Aug 21.
2Roll return non-annualised from front month futures into second " month on 27 May 21 (3 Month), 27 Jul 21 (1 Month), 20 Aug 21 (1 Week), 27 Aug 21.
4
3 Month 1 Month1 Week27-Aug
6 Month
3Net positions in number of contracts.
4Current inventories relative to 1, 3, 6 months ago. Under the column "5 yr average" is the current inventory level relative to 5 year average inventory.
For energy, 5 yr average is the average of the same month as report month over the past 5 years. SHFE started reporting inventory data from April 2015. 5All Industrial metals positioning
data (excluding copper) is sourced from LME COTR data in Bloomberg from 30 January 2018 (first available date) under post-MIFID rules. **Brent 5 Yr average of net positions from January
2011 as positions were not reported by CFTC before then and inventory data (OECD) reported with 3 month lag with current = May 2021.
Historical performance is not an indication of future performance and any investments may go down in value.
Agriculture
1 YearCFTC NET POSITIONING3 6 MonthCurrent 3 Month
5 Yr
Average1 MonthCurrent
Summary Tables
INVENTORY LEVELS4
Current 1 Year
5 Yr
Average
PRICES1 3 Month
1 Month
6 Month1 Month Roll Yields2Unit Unit
Exchang
e

T
Agriculture
Source: Bloomberg, WisdomTree Source: Bloomberg, WisdomTree
Source: Bloomberg, WisdomTree Source: Bloomberg, WisdomTree
Source: Bloomberg, WisdomTree Source: Bloomberg, WisdomTree
Agricultur
·Source: Bloomberg, WisdomTree Source: Bloomberg, WisdomTree
Note: positioning in '000 contracts. Standard deviation based on 5 year average CFTC non-commercial net positioning 5
CFTC Speculative Net Long Futures Positions
All commodity futures price data is denominated in USD unless otherwise indicated. CFTC futures and LME COTR net positioning as at Aug 24, 2021 and Aug 27, 2021 respectively.
1,600
1,800
2,000
2,200
2,400
2,600
2,800
3,000
3,200
-50
-30
-10
10
30
50
70
90
110
Au
g-1
6
No
v-1
6
Fe
b-1
7
Ma
y-1
7
Au
g-1
7
No
v-1
7
Fe
b-1
8
Ma
y-1
8
Au
g-1
8
No
v-1
8
Fe
b-1
9
Ma
y-1
9
Au
g-1
9
No
v-1
9
Fe
b-2
0
Ma
y-2
0
Au
g-2
0
No
v-2
0
Fe
b-2
1
Ma
y-2
1
Au
g-2
1
Cocoa
CFTC non-commercial net positioning Price (RHS, USD/MT)
-1x stdv
-2x stdv
1x stdv
2x stdv
5 Yr Average
2
3
4
5
6
7
8
-350
-250
-150
-50
50
150
250
350
450
550
650
Au
g-1
6
No
v-1
6
Fe
b-1
7
Ma
y-1
7
Au
g-1
7
No
v-1
7
Fe
b-1
8
Ma
y-1
8
Au
g-1
8
No
v-1
8
Fe
b-1
9
Ma
y-1
9
Au
g-1
9
No
v-1
9
Fe
b-2
0
Ma
y-2
0
Au
g-2
0
No
v-2
0
Fe
b-2
1
Ma
y-2
1
Au
g-2
1
Corn
CFTC non-commercial net positioning Price (RHS, USd/bu.)
1x stdv
-1x stdv
2x stdv
-2x stdv
5 Yr Average
0.22
0.32
0.42
0.52
0.62
0.72
0.82
-100
-50
0
50
100
150
200
Au
g-1
6
No
v-1
6
Fe
b-1
7
Ma
y-1
7
Au
g-1
7
No
v-1
7
Fe
b-1
8
Ma
y-1
8
Au
g-1
8
No
v-1
8
Fe
b-1
9
Ma
y-1
9
Au
g-1
9
No
v-1
9
Fe
b-2
0
Ma
y-2
0
Au
g-2
0
No
v-2
0
Fe
b-2
1
Ma
y-2
1
Au
g-2
1
Soybean Oil
CFTC non-commercial net positioning Price (RHS, USd/lb.)
1x stdv
-1x stdv
2x stdv
-2x stdv
5 Yr Average
0.08
0.10
0.12
0.14
0.16
0.18
0.20
0.22
0.24
0.26
-300
-200
-100
0
100
200
300
400
Au
g-1
6
No
v-1
6
Fe
b-1
7
Ma
y-1
7
Au
g-1
7
No
v-1
7
Fe
b-1
8
Ma
y-1
8
Au
g-1
8
No
v-1
8
Fe
b-1
9
Ma
y-1
9
Au
g-1
9
No
v-1
9
Fe
b-2
0
Ma
y-2
0
Au
g-2
0
No
v-2
0
Fe
b-2
1
Ma
y-2
1
Au
g-2
1
Sugar
CFTC non-commercial net positioning Price (RHS, USd/lb.)
1x stdv
-1x stdv
2x stdv
-2x stdv
5 Yr Average
8
9
10
11
12
13
14
15
16
17
18
-200
-150
-100
-50
0
50
100
150
200
250
300
Au
g-1
6
No
v-1
6
Fe
b-1
7
Ma
y-1
7
Au
g-1
7
No
v-1
7
Fe
b-1
8
Ma
y-1
8
Au
g-1
8
No
v-1
8
Fe
b-1
9
Ma
y-1
9
Au
g-1
9
No
v-1
9
Fe
b-2
0
Ma
y-2
0
Au
g-2
0
No
v-2
0
Fe
b-2
1
Ma
y-2
1
Au
g-2
1
Soybeans
CFTC non-commercial net positioning Price (RHS, USd/bu.)
1x stdv
-1x stdv
2x stdv
-2x stdv
5 Yr Average
3
4
4
5
5
6
6
7
7
8
8
-200
-150
-100
-50
0
50
100
Au
g-1
6
No
v-1
6
Fe
b-1
7
Ma
y-1
7
Au
g-1
7
No
v-1
7
Fe
b-1
8
Ma
y-1
8
Au
g-1
8
No
v-1
8
Fe
b-1
9
Ma
y-1
9
Au
g-1
9
No
v-1
9
Fe
b-2
0
Ma
y-2
0
Au
g-2
0
No
v-2
0
Fe
b-2
1
Ma
y-2
1
Au
g-2
1
Wheat
CFTC non-commercial net positioning Price (RHS, USd/bu.)
1x stdv
-1x stdv
2x stdv
-2x stdv
5 Yr Average
0.3
0.5
0.7
0.9
1.1
1.3
1.5
1.7
1.9
2.1
2.3
-120
-70
-20
30
80
130
Au
g-1
6
No
v-1
6
Fe
b-1
7
Ma
y-1
7
Au
g-1
7
No
v-1
7
Fe
b-1
8
Ma
y-1
8
Au
g-1
8
No
v-1
8
Fe
b-1
9
Ma
y-1
9
Au
g-1
9
No
v-1
9
Fe
b-2
0
Ma
y-2
0
Au
g-2
0
No
v-2
0
Fe
b-2
1
Ma
y-2
1
Au
g-2
1
Coffee
CFTC non-commercial net positioning Price (RHS, USd/lb.)
1x stdv
-1x stdv
2x stdv
-2x stdv
5 Yr Average
0.5
0.6
0.6
0.7
0.7
0.8
0.8
0.9
0.9
1.0
1.0
-50
0
50
100
150
200
Au
g-1
6
No
v-1
6
Fe
b-1
7
Ma
y-1
7
Au
g-1
7
No
v-1
7
Fe
b-1
8
Ma
y-1
8
Au
g-1
8
No
v-1
8
Fe
b-1
9
Ma
y-1
9
Au
g-1
9
No
v-1
9
Fe
b-2
0
Ma
y-2
0
Au
g-2
0
No
v-2
0
Fe
b-2
1
Ma
y-2
1
Au
g-2
1
Cotton
CFTC non-commercial net positioning Price (RHS, USd/lb.)
1x stdv
-1x stdv
2x stdv
-2x stdv
5 Yr Average
Historical performance is not an indication of future performance and any investments may go down in value.

Energy
Source: Bloomberg, WisdomTree Source: Bloomberg, WisdomTree
Source: Bloomberg, WisdomTree Source: Bloomberg, WisdomTree
Source: Bloomberg, WisdomTree
6Note: positioning in '000 contracts. Standard deviation based on 5 year average CFTC non-commercial net positioning. All commodity futures price data is denominated in
USD unless otherwise indicated. *Brent average of net positions from January 2011 as positions were not reported by CFTC before then.
Historical performance is not an indication of future performance and any investments may go down in value.
0.5
1.0
1.5
2.0
2.5
3.0
-40
-20
0
20
40
60
80
Au
g-1
6
No
v-1
6
Fe
b-1
7
Ma
y-1
7
Au
g-1
7
No
v-1
7
Fe
b-1
8
Ma
y-1
8
Au
g-1
8
No
v-1
8
Fe
b-1
9
Ma
y-1
9
Au
g-1
9
No
v-1
9
Fe
b-2
0
Ma
y-2
0
Au
g-2
0
No
v-2
0
Fe
b-2
1
Ma
y-2
1
Au
g-2
1
Heating Oil
CFTC non-commercial net positioning Price (RHS, USd/gal.)
1x stdv
-1x stdv
2x stdv
-2x stdv
5 Yr Average
1.5
2.0
2.5
3.0
3.5
4.0
4.5
5.0
5.5
6.0
-300
-250
-200
-150
-100
-50
0
50
100
Au
g-1
6
No
v-1
6
Fe
b-1
7
Ma
y-1
7
Au
g-1
7
No
v-1
7
Fe
b-1
8
Ma
y-1
8
Au
g-1
8
No
v-1
8
Fe
b-1
9
Ma
y-1
9
Au
g-1
9
No
v-1
9
Fe
b-2
0
Ma
y-2
0
Au
g-2
0
No
v-2
0
Fe
b-2
1
Ma
y-2
1
Au
g-2
1
Natural Gas
CFTC non-commercial net positioning Price (RHS, USD/MMBtu)
1x stdv
-1x stdv
2x stdv
-2x stdv
5 Yr Average
15
25
35
45
55
65
75
85
95
-400
-300
-200
-100
0
100
200
300
400
500
600
Au
g-1
6
No
v-1
6
Fe
b-1
7
Ma
y-1
7
Au
g-1
7
No
v-1
7
Fe
b-1
8
Ma
y-1
8
Au
g-1
8
No
v-1
8
Fe
b-1
9
Ma
y-1
9
Au
g-1
9
No
v-1
9
Fe
b-2
0
Ma
y-2
0
Au
g-2
0
No
v-2
0
Fe
b-2
1
Ma
y-2
1
Au
g-2
1
Brent Oil
ICE managed money net positioning Price (RHS, USD/bbl.)
1x stdv
-1x stdv
2x stdv
-2x stdv
5 Yr Average
0.3
0.8
1.3
1.8
2.3
30
50
70
90
110
130
Au
g-1
6
No
v-1
6
Fe
b-1
7
Ma
y-1
7
Au
g-1
7
No
v-1
7
Fe
b-1
8
Ma
y-1
8
Au
g-1
8
No
v-1
8
Fe
b-1
9
Ma
y-1
9
Au
g-1
9
No
v-1
9
Fe
b-2
0
Ma
y-2
0
Au
g-2
0
No
v-2
0
Fe
b-2
1
Ma
y-2
1
Au
g-2
1
Gasoline
CFTC non-commercial net positioning Price (RHS, USd/gal.)
-1x stdv
2x stdv
-2x stdv
5 Yr Average
1x stdv
5
15
25
35
45
55
65
75
85
100
200
300
400
500
600
700
800
900
Au
g-1
6
No
v-1
6
Fe
b-1
7
Ma
y-1
7
Au
g-1
7
No
v-1
7
Fe
b-1
8
Ma
y-1
8
Au
g-1
8
No
v-1
8
Fe
b-1
9
Ma
y-1
9
Au
g-1
9
No
v-1
9
Fe
b-2
0
Ma
y-2
0
Au
g-2
0
No
v-2
0
Fe
b-2
1
Ma
y-2
1
Au
g-2
1
WTI Oil
CFTC non-commercial net positioning Price (RHS, USD/bbl.)
1x stdv
-1x stdv
2x stdv
-2x stdv
5 Yr Average

Industrial Metals
Source: Bloomberg, WisdomTree Source: Bloomberg, WisdomTree
Source: Bloomberg, WisdomTree Source: Bloomberg, WisdomTree
Source: Bloomberg, WisdomTree Source: Bloomberg, WisdomTree
Source: Bloomberg, WisdomTree
7Note: positioning in '000 contracts. Standard deviation based on 5 year average CFTC non-commercial net positioning. LME non-commercial net positions from 30 January
2018 post MIFID II data and respective graphs represent daily data. All commodity futures price data is denominated in USD unless otherwise indicated.
Historical performance is not an indication of future performance and any investments may go down in value.
4,000
5,000
6,000
7,000
8,000
9,000
10,000
11,000
0
10
20
30
40
50
60
70
80
Ja
n-1
8Fe
b-1
8M
ar-
18
Ap
r-18
Ma
y-1
8Ju
n-1
8Ju
l-18
Au
g-1
8Se
p-1
8O
ct-
18
No
v-1
8D
ec
-18
Ja
n-1
9Fe
b-1
9M
ar-
19
Ap
r-19
Ma
y-1
9Ju
n-1
9Ju
l-19
Au
g-1
9Se
p-1
9O
ct-
19
No
v-1
9D
ec
-19
Ja
n-2
0Fe
b-2
0M
ar-
20
Ap
r-20
Ma
y-2
0Ju
n-2
0Ju
l-20
Au
g-2
0Se
p-2
0O
ct-
20
No
v-2
0D
ec
-20
Ja
n-2
1Fe
b-2
1M
ar-
21
Ap
r-21
Ma
y-2
1Ju
n-2
1Ju
l-21
Copper (LME)
LME non-commercial net positioning Price (RHS, USD/MT)
1,700
1,900
2,100
2,300
2,500
2,700
2,900
3,100
3,300
3,500
3,700
0
10
20
30
40
50
60
70
80
90
Ja
n-1
8Fe
b-1
8M
ar-
18
Ap
r-18
Ma
y-1
8Ju
n-1
8Ju
l-18
Au
g-1
8Se
p-1
8O
ct-
18
No
v-1
8D
ec
-18
Ja
n-1
9Fe
b-1
9M
ar-
19
Ap
r-19
Ma
y-1
9Ju
n-1
9Ju
l-19
Au
g-1
9Se
p-1
9O
ct-
19
No
v-1
9D
ec
-19
Ja
n-2
0Fe
b-2
0M
ar-
20
Ap
r-20
Ma
y-2
0Ju
n-2
0Ju
l-20
Au
g-2
0Se
p-2
0O
ct-
20
No
v-2
0D
ec
-20
Ja
n-2
1Fe
b-2
1M
ar-
21
Ap
r-21
Ma
y-2
1Ju
n-2
1Ju
l-21
Zinc
LME non-commercial net positioning Price (RHS, USD/MT)
1,500
1,700
1,900
2,100
2,300
2,500
2,700
10
20
30
40
50
60
70
80
Ja
n-1
8Fe
b-1
8M
ar-
18
Ap
r-18
Ma
y-1
8Ju
n-1
8Ju
l-1
8A
ug
-18
Se
p-1
8O
ct-
18
No
v-1
8D
ec
-18
Ja
n-1
9Fe
b-1
9M
ar-
19
Ap
r-19
Ma
y-1
9Ju
n-1
9Ju
l-1
9A
ug
-19
Se
p-1
9O
ct-
19
No
v-1
9D
ec
-19
Ja
n-2
0Fe
b-2
0M
ar-
20
Ap
r-20
Ma
y-2
0Ju
n-2
0Ju
l-2
0A
ug
-20
Se
p-2
0O
ct-
20
No
v-2
0D
ec
-20
Ja
n-2
1Fe
b-2
1M
ar-
21
Ap
r-21
Ma
y-2
1Ju
n-2
1Ju
l-2
1
Lead
LME non-commercial net positioning Price (RHS, USD/MT)
9,800
11,800
13,800
15,800
17,800
19,800
21,800
-14
-9
-4
1
6
11
16
21
26
31
36
41
46
51
Ja
n-1
8Fe
b-1
8M
ar-
18
Ap
r-18
Ma
y-1
8Ju
n-1
8Ju
l-1
8A
ug
-18
Se
p-1
8O
ct-
18
No
v-1
8D
ec
-18
Ja
n-1
9Fe
b-1
9M
ar-
19
Ap
r-19
Ma
y-1
9Ju
n-1
9Ju
l-1
9A
ug
-19
Se
p-1
9O
ct-
19
No
v-1
9D
ec
-19
Ja
n-2
0Fe
b-2
0M
ar-
20
Ap
r-20
Ma
y-2
0Ju
n-2
0Ju
l-2
0A
ug
-20
Se
p-2
0O
ct-
20
No
v-2
0D
ec
-20
Ja
n-2
1Fe
b-2
1M
ar-
21
Ap
r-21
Ma
y-2
1Ju
n-2
1Ju
l-2
1
Nickel
LME non-commercial net positioning Price (RHS, USD/MT)
1,400
1,600
1,800
2,000
2,200
2,400
2,600
2,800
70
90
110
130
150
170
190
210
230
Ja
n-1
8Fe
b-1
8M
ar-
18
Ap
r-1
8M
ay-1
8Ju
n-1
8Ju
l-18
Au
g-1
8Se
p-1
8O
ct-
18
No
v-1
8D
ec
-18
Ja
n-1
9Fe
b-1
9M
ar-
19
Ap
r-1
9M
ay-1
9Ju
n-1
9Ju
l-19
Au
g-1
9Se
p-1
9O
ct-
19
No
v-1
9D
ec
-19
Ja
n-2
0Fe
b-2
0M
ar-
20
Ap
r-2
0M
ay-2
0Ju
n-2
0Ju
l-20
Au
g-2
0Se
p-2
0O
ct-
20
No
v-2
0D
ec
-20
Ja
n-2
1Fe
b-2
1M
ar-
21
Ap
r-2
1M
ay-2
1Ju
n-2
1Ju
l-21
Aluminum
LME non-commercial net positioning Price (RHS, USD/MT)
1.7
2.2
2.7
3.2
3.7
4.2
4.7
5.2
-80
-60
-40
-20
0
20
40
60
80
100
Au
g-1
6
No
v-1
6
Fe
b-1
7
Ma
y-1
7
Au
g-1
7
No
v-1
7
Fe
b-1
8
Ma
y-1
8
Au
g-1
8
No
v-1
8
Fe
b-1
9
Ma
y-1
9
Au
g-1
9
No
v-1
9
Fe
b-2
0
Ma
y-2
0
Au
g-2
0
No
v-2
0
Fe
b-2
1
Ma
y-2
1
Au
g-2
1
Copper (COMEX)
CFTC non-commercial net positioning Price (RHS, USd/lb.)
1x stdv
-1x stdv
2x stdv
-2x stdv
5 Yr Average
12,500
17,500
22,500
27,500
32,500
37,500
0
5
10
15
Ja
n-1
8Fe
b-1
8M
ar-
18
Ap
r-18
Ma
y-1
8Ju
n-1
8Ju
l-1
8A
ug
-18
Se
p-1
8O
ct-
18
No
v-1
8D
ec
-18
Ja
n-1
9Fe
b-1
9M
ar-
19
Ap
r-19
Ma
y-1
9Ju
n-1
9Ju
l-1
9A
ug
-19
Se
p-1
9O
ct-
19
No
v-1
9D
ec
-19
Ja
n-2
0Fe
b-2
0M
ar-
20
Ap
r-20
Ma
y-2
0Ju
n-2
0Ju
l-2
0A
ug
-20
Se
p-2
0O
ct-
20
No
v-2
0D
ec
-20
Ja
n-2
1Fe
b-2
1M
ar-
21
Ap
r-21
Ma
y-2
1Ju
n-2
1Ju
l-2
1
Tin
LME non-commercial net positioning Price (RHS, USD/MT)

Precious Metals
Source: Bloomberg, WisdomTree Source: Bloomberg, WisdomTree
Source: Bloomberg, WisdomTree Source: Bloomberg, WisdomTree
Livestock
Source: Bloomberg, WisdomTree Source: Bloomberg, WisdomTree
Source: Bloomberg, WisdomTree
8Note: positioning in '000 contracts. Standard deviation based on 5 year average CFTC non-commercial net positioning. respective graphs represent daily data. All
commodity futures price data is denominated in USD unless otherwise indicated.
Historical performance is not an indication of future performance and any investments may go down in value.
0.4
0.5
0.6
0.7
0.8
0.9
1.0
1.1
1.2
1.3
-20
0
20
40
60
80
100
120
Au
g-1
6
No
v-1
6
Fe
b-1
7
Ma
y-1
7
Au
g-1
7
No
v-1
7
Fe
b-1
8
Ma
y-1
8
Au
g-1
8
No
v-1
8
Fe
b-1
9
Ma
y-1
9
Au
g-1
9
No
v-1
9
Fe
b-2
0
Ma
y-2
0
Au
g-2
0
No
v-2
0
Fe
b-2
1
Ma
y-2
1
Au
g-2
1
Lean Hogs
CFTC non-commercial net positioning Price (RHS, USd/lb.)
1x stdv
-1x stdv
2x stdv
-2x stdv
5 Yr Average
0.5
0.6
0.7
0.8
0.9
1.0
1.1
1.2
1.3
1.4
0
20
40
60
80
100
120
140
160
180
200
Au
g-1
6
No
v-1
6
Fe
b-1
7
Ma
y-1
7
Au
g-1
7
No
v-1
7
Fe
b-1
8
Ma
y-1
8
Au
g-1
8
No
v-1
8
Fe
b-1
9
Ma
y-1
9
Au
g-1
9
No
v-1
9
Fe
b-2
0
Ma
y-2
0
Au
g-2
0
No
v-2
0
Fe
b-2
1
Ma
y-2
1
Au
g-2
1
Live Cattle
CFTC non-commercial net positioning Price (RHS, USd/lb.)
1x stdv
-1x stdv
2x stdv
-2x stdv
5 Yr Average
1.0
1.1
1.2
1.3
1.4
1.5
1.6
1.7
-10
-5
0
5
10
15
20
25
Au
g-1
6
No
v-1
6
Fe
b-1
7
Ma
y-1
7
Au
g-1
7
No
v-1
7
Fe
b-1
8
Ma
y-1
8
Au
g-1
8
No
v-1
8
Fe
b-1
9
Ma
y-1
9
Au
g-1
9
No
v-1
9
Fe
b-2
0
Ma
y-2
0
Au
g-2
0
No
v-2
0
Fe
b-2
1
Ma
y-2
1
Au
g-2
1
Feeder Cattle
CFTC non-commercial net positioning Price (RHS, USd/lb.)
1x stdv
-1x stdv
2x stdv
-2x stdv
5 Yr Average
10
17
24
31
-40
-20
0
20
40
60
80
100
120
Au
g-1
6
No
v-1
6
Fe
b-1
7
Ma
y-1
7
Au
g-1
7
No
v-1
7
Fe
b-1
8
Ma
y-1
8
Au
g-1
8
No
v-1
8
Fe
b-1
9
Ma
y-1
9
Au
g-1
9
No
v-1
9
Fe
b-2
0
Ma
y-2
0
Au
g-2
0
No
v-2
0
Fe
b-2
1
Ma
y-2
1
Au
g-2
1
Silver
CFTC non-commercial net positioning Price (RHS, USD/t oz.)
1x stdv
-1x stdv
2x stdv
-2x stdv
5 Yr Average
900
1,100
1,300
1,500
1,700
1,900
2,100
-100
-50
0
50
100
150
200
250
300
350
400
450
Au
g-1
6
No
v-1
6
Fe
b-1
7
Ma
y-1
7
Au
g-1
7
No
v-1
7
Fe
b-1
8
Ma
y-1
8
Au
g-1
8
No
v-1
8
Fe
b-1
9
Ma
y-1
9
Au
g-1
9
No
v-1
9
Fe
b-2
0
Ma
y-2
0
Au
g-2
0
No
v-2
0
Fe
b-2
1
Ma
y-2
1
Au
g-2
1
Gold
CFTC non-commercial net positioning Price (RHS, USD/t oz.)
1x stdv
-1x stdv
2x stdv
-2x stdv
5 Yr Average
300
800
1,300
1,800
2,300
2,800
3,300
-2
3
8
13
18
23
28
33
Au
g-1
6
No
v-1
6
Fe
b-1
7
Ma
y-1
7
Au
g-1
7
No
v-1
7
Fe
b-1
8
Ma
y-1
8
Au
g-1
8
No
v-1
8
Fe
b-1
9
Ma
y-1
9
Au
g-1
9
No
v-1
9
Fe
b-2
0
Ma
y-2
0
Au
g-2
0
No
v-2
0
Fe
b-2
1
Ma
y-2
1
Au
g-2
1
Palladium
CFTC non-commercial net positioning Price (RHS, USD/t oz.)
1x stdv
-1x stdv
2x stdv
-2x stdv
5 Yr Average
550
750
950
1,150
1,350
1,550
1,750
1,950
-20
-10
0
10
20
30
40
50
60
70
80
Au
g-1
6
No
v-1
6
Fe
b-1
7
Ma
y-1
7
Au
g-1
7
No
v-1
7
Fe
b-1
8
Ma
y-1
8
Au
g-1
8
No
v-1
8
Fe
b-1
9
Ma
y-1
9
Au
g-1
9
No
v-1
9
Fe
b-2
0
Ma
y-2
0
Au
g-2
0
No
v-2
0
Fe
b-2
1
Ma
y-2
1
Au
g-2
1
Platinum
CFTC non-commercial net positioning Price (RHS, USD/t oz.)
1x stdv
-1x stdv
2x stdv
-2x stdv
5 Yr Average

T
Agriculture
Source: USDA, Bloomberg,WisdomTree Source: USDA, Bloomberg,WisdomTree
Source: USDA, Bloomberg, WisdomTree Source: USDA, Bloomberg, WisdomTree
Source: USDA, Bloomberg,WisdomTree Source: USDA, Bloomberg, WisdomTree
Agricultur
·Source: USDA, Bloomberg, WisdomTree Source: USDA, Bloomberg, WisdomTree
9
Inventories
Note: Ending stocks, inventories and stock to use data from the USDA are annual with monthly update of 2020/2021 estimates.
Historical performance is not an indication of future performance and any investments may go down in value.
0
5
10
15
20
25
30
35
40
45
50
83
/84
85
/86
87
/88
89
/90
91
/92
93
/94
95
/96
97
/98
99
/00
01
/02
03
/04
05
/06
07
/08
09
/10
11
/12
13
/14
15
/16
17
/18
19
/20
21
/22
Corn - Stock to Use
Annual data in %, from 1980 to 2021
% chg in projections vs.
previous = 1.7%
0
50
100
150
200
250
83
/84
85
/86
87
/88
89
/90
91
/92
93
/94
95
/96
97
/98
99
/00
01
/02
03
/04
05
/06
07
/08
09
/10
11
/12
13
/14
15
/16
17
/18
19
/20
21
/22
Coffee - Stock to UseAnnual data in %, from 1980 to 2021
% chg in projections
vs. previous = -6.6%
0
20
40
60
80
100
120
85
/86
87
/88
89
/90
91
/92
93
/94
95
/96
97
/98
99
/00
01
/02
03
/04
05
/06
07
/08
09
/10
11
/12
13
/14
15
/16
17
/18
19
/20
21
/22
Cotton - Stock to UseAnnual data in %, from 1980 to 2021
% chg in projections
vs. previous = -1.2%
0
5
10
15
20
25
30
35
85
/86
87
/88
89
/90
91
/92
93
/94
95
/96
97
/98
99
/00
01
/02
03
/04
05
/06
07
/08
09
/10
11
/12
13
/14
15
/16
17
/18
19
/20
21
/22
Soybeans - Stock to UseAnnual data in %, from 1980 to 2021
% chg in projections vs. previous = 7.1%
0
20
40
60
80
100
120
140
85
/86
87/8
8
89/9
0
91/9
2
93/9
4
95/9
6
97/9
8
99/0
0
01/0
2
03/0
4
05
/06
07/0
8
09/1
0
11/1
2
13/1
4
15/1
6
17/1
8
19/2
0
21/2
2
Soybeans - Ending StocksAnnual data in '000 metric tons, from 1980 to 2021
chg in projections vs. previous = 3.4
0
10
20
30
40
50
60
83
/84
85
/86
87
/88
89
/90
91
/92
93
/94
95
/96
97
/98
99
/00
01
/02
03
/04
05
/06
07
/08
09
/10
11
/12
13
/14
15
/16
17
/18
19
/20
21
/22
Coffee - Ending StocksAnnual data in mln bags (60 kg), from 1980 to 2021
chg in projections
vs. previous = -3.3
0
20
40
60
80
100
120
85/8
6
87/8
8
89/9
0
91/9
2
93/9
4
95/9
6
97/9
8
99/0
0
01/0
2
03/0
4
05/0
6
07/0
8
09/1
0
11
/12
13/1
4
15/1
6
17/1
8
19
/20
21/2
2
Cotton - Ending StocksAnnual data in mln 480 lb Bales, from 1980 to 2021
chg in projections vs.
previous = -3.3
0
50
100
150
200
250
300
350
400
83
/84
85
/86
87
/88
89
/90
91
/92
93
/94
95
/96
97
/98
99
/00
01
/02
03
/04
05
/06
07
/08
09
/10
11
/12
13
/14
15
/16
17
/18
19
/20
21
/22
Corn - Ending Stocks
Annual data in mln tons, from 1980 to 2021
chg in projections
vs. previous = -3.7
Source: USDA, Bloomberg, WisdomTree Source: USDA, Bloomberg, WisdomTree
Source: USDA, Bloomberg, WisdomTree Source: USDA, Bloomberg, WisdomTree
Source: USDA, Bloomberg, WisdomTree Source: USDA, Bloomberg, WisdomTree
Source: International Cocoa Organisation, Bloomberg, WisdomTree
10Note: Ending stocks, inventories and stock to use data from the USDA are annual with monthly update of 2020/2021 estimates.
Historical performance is not an indication of future performance and any investments may go down in value.
0
5
10
15
20
25
30
35
40
45
85
/86
87
/88
89
/90
91
/92
93
/94
95
/96
97
/98
99
/00
01
/02
03
/04
05
/06
07
/08
09
/10
11
/12
13
/14
15
/16
17
/18
19
/20
21
/22
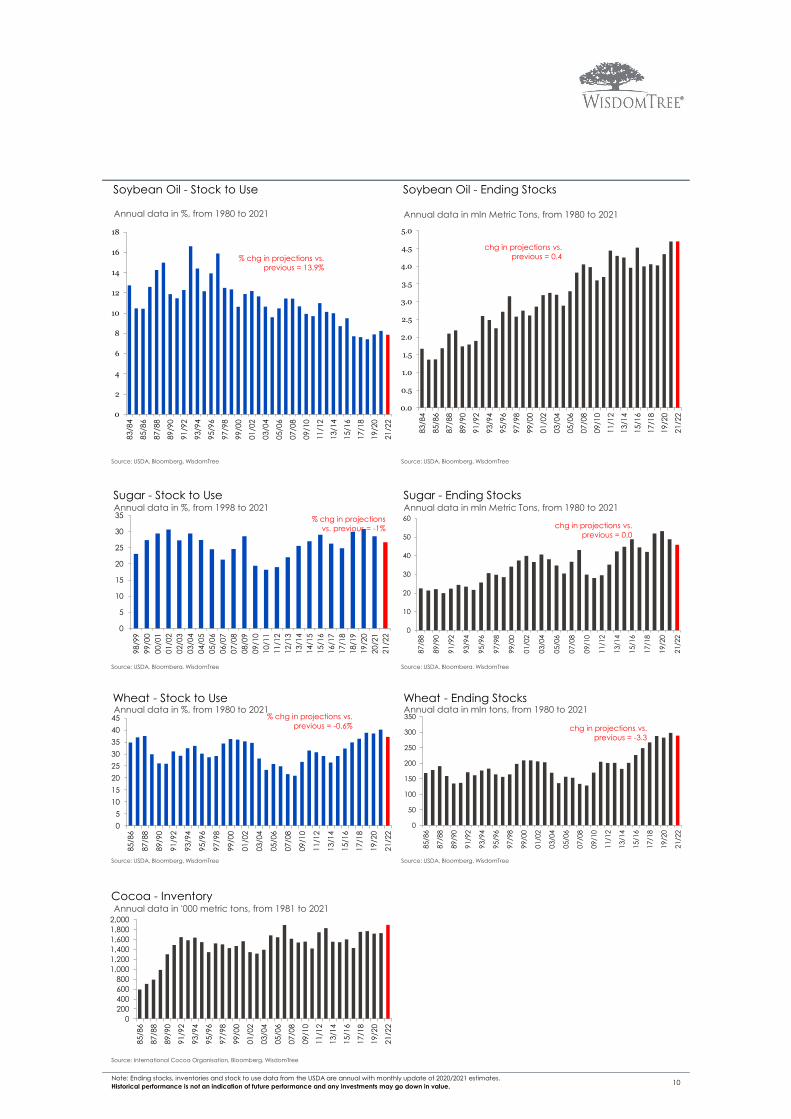
Wheat - Stock to UseAnnual data in %, from 1980 to 2021
% chg in projections vs.
previous = -0.6%
0
5
10
15
20
25
30
35
98
/99
99
/00
00
/01
01
/02
02
/03
03
/04
04
/05
05
/06
06
/07
07
/08
08
/09
09
/10
10
/11
11
/12
12
/13
13
/14
14
/15
15
/16
16
/17
17
/18
18
/19
19
/20
20
/21
21
/22
Sugar - Stock to UseAnnual data in %, from 1998 to 2021
% chg in projections
vs. previous = -1%
0
2
4
6
8
10
12
14
16
18
83
/84
85
/86
87
/88
89
/90
91
/92
93
/94
95
/96
97
/98
99
/00
01
/02
03
/04
05
/06
07
/08
09
/10
11
/12
13
/14
15
/16
17
/18
19
/20
21
/22
Soybean Oil - Stock to Use
Annual data in %, from 1980 to 2021
% chg in projections vs.
previous = 13.9%
0
50
100
150
200
250
300
350
85
/86
87/8
8
89/9
0
91/9
2
93/9
4
95/9
6
97/9
8
99/0
0
01/0
2
03/0
4
05/0
6
07
/08
09/1
0
11/1
2
13
/14
15/1
6
17/1
8
19
/20
21/2
2
Wheat - Ending StocksAnnual data in mln tons, from 1980 to 2021
chg in projections vs.
previous = -3.3
0
10
20
30
40
50
60
87/8
8
89/9
0
91/9
2
93/9
4
95/9
6
97/9
8
99
/00
01/0
2
03/0
4
05/0
6
07/0
8
09/1
0
11/1
2
13/1
4
15/1
6
17/1
8
19/2
0
21/2
2
Sugar - Ending StocksAnnual data in mln Metric Tons, from 1980 to 2021
chg in projections vs.
previous = 0.0
0.0
0.5
1.0
1.5
2.0
2.5
3.0
3.5
4.0
4.5
5.0
83
/84
85
/86
87
/88
89
/90
91
/92
93
/94
95
/96
97
/98
99
/00
01
/02
03
/04
05
/06
07
/08
09
/10
11
/12
13
/14
15
/16
17
/18
19
/20
21
/22
Soybean Oil - Ending Stocks
Annual data in mln Metric Tons, from 1980 to 2021
chg in projections vs.
previous = 0.4
0
200
400
600
800
1,000
1,200
1,400
1,600
1,800
2,000
85
/86
87
/88
89
/90
91
/92
93
/94
95
/96
97
/98
99
/00
01
/02
03
/04
05
/06
07
/08
09
/10
11
/12
13
/14
15
/16
17
/18
19
/20
21
/22
Cocoa - InventoryAnnual data in '000 metric tons, from 1981 to 2021

Industrial Metals
Source: Bloomberg, WisdomTree Source: Bloomberg, WisdomTree
Source: LME, Bloomberg, WisdomTree Source: Bloomberg, WisdomTree
Source: Bloomberg, WisdomTree Source: LME, Bloomberg, WisdomTree
Livestock
Source: USDA, Bloomberg, WisdomTree Source: USDA, Bloomberg, WisdomTree
11Note: Ending stocks, inventories and stock to use data from the USDA are annual with monthly update of 2020/2021 estimates.
Historical performance is not an indication of future performance and any investments may go down in value.
0
2
4
6
8
10
12
Au
g-2
0
Se
p-2
0
Oc
t-20
No
v-2
0
De
c-2
0
Jan
-21
Fe
b-2
1
Ma
r-2
1
Ap
r-2
1
Ma
y-2
1
Ju
n-2
1
Ju
l-2
1
Au
g-2
1
Tin Inventory
LME Inventory (in '000 tonnes) SHFE Inventory (in '000 tonnes)
Daily data in '000 MT, from 27 Aug 20 to 27 Aug 21
50
100
150
200
250
300
Au
g 2
0
Se
p 2
0
Oc
t 2
0
No
v 2
0
De
c 2
0
Ja
n 2
1
Fe
b 2
1
Ma
r 2
1
Ap
r 2
1
Ma
y 2
1
Ju
n 2
1
Ju
l 21
Au
g 2
1
Lead Inventory
SHFE Inventory (in '000 tonnes) LME Inventory (in '000 tonnes)
Daily data, from 27 Aug 20 to 27 Aug 21
0
50
100
150
200
250
300
Au
g-2
0
Se
p-2
0
Oc
t-20
No
v-2
0
De
c-2
0
Ja
n-2
1
Fe
b-2
1
Ma
r-21
Ap
r-2
1
Ma
y-2
1
Ju
n-2
1
Ju
l-21
Au
g-2
1
Nickel InventoryDaily data in '000 MT, from 27 Aug 20 to 27 Aug 21
40
90
140
190
240
290
340
390
440
Au
g 2
0
Se
p 2
0
Oc
t 2
0
No
v 2
0
De
c 2
0
Jan
21
Fe
b 2
1
Ma
r 2
1
Ap
r 2
1
Ma
y 2
1
Ju
n 2
1
Jul 2
1
Au
g 2
1
Zinc Inventory
SHFE Inventory (in '000 tonnes) LME Inventory (in '000 tonnes)
Daily data, from 27 Aug 20 to 27 Aug 21
0
500
1,000
1,500
2,000
2,500
Au
g 2
0
Se
p 2
0
Oc
t 2
0
No
v 2
0
De
c 2
0
Ja
n 2
1
Fe
b 2
1
Ma
r 21
Ap
r 2
1
Ma
y 2
1
Ju
n 2
1
Ju
l 21
Au
g 2
1
Aluminum Inventory
SHFE Inventory (in '000 tonnes) LME Inventory (in '000 tonnes)
Daily data, from 27 Aug 20 to 27 Aug 21
0
50
100
150
200
250
300
350
400
450
500
Au
g 2
0
Se
p 2
0
Oc
t 20
No
v 2
0
De
c 2
0
Jan
21
Feb
21
Ma
r 21
Ap
r 21
Ma
y 2
1
Jun
21
Jul 2
1
Au
g 2
1
SHFE Inventory (in '000 tonnes) COMEX Inventory (in '000 tonnes)
LME Inventory (in '000 tonnes)
Copper Inventory
Daily data, from 27 Aug 20 to 27 Aug 21
0
100
200
300
400
500
600
700
800
900
86/8
7
88/8
9
90/9
1
92/9
3
94
/95
96/9
7
98/9
9
00/0
1
02/0
3
04/0
5
06
/07
08/0
9
10/1
1
12/1
3
14/1
5
16/1
7
18/1
9
20
/21
Lean Hogs InventoryAnnual data in mln Heads, from 1980 to 2021
900
950
1,000
1,050
1,100
1,150
86
/87
88
/89
90
/91
92
/93
94
/95
96
/97
98
/99
00
/01
02
/03
04
/05
06
/07
08
/09
10
/11
12
/13
14
/15
16
/17
18
/19
20
/21
Live Cattle InventoryAnnual data in mln Heads, from 1980 to 2021

Energy
Source: DOE, Bloomberg, WisdomTree Source: IEA, Bloomberg, WisdomTree
Source: DOE, Bloomberg, WisdomTree Source: DOE, Bloomberg, WisdomTree
Source: DOE, Bloomberg, WisdomTree
12Note: "Oil - OECD Inventory" represents OECD industry stocks and is reported with a 2 month lag.
Historical performance is not an indication of future performance and any investments may go down in value.
300
350
400
450
500
550
600
1 3 5 7 9 11 13 15 17 19 21 23 25 27 29 31 33 35 37 39 41 43 45 47 49 51
US Oil Inventory
5Yr Average +/-1 stdev 2020 2021
Weekly data in mln barrels, from Aug 16 to Aug 21
200
210
220
230
240
250
260
270
1 3 5 7 9 11 13 15 17 19 21 23 25 27 29 31 33 35 37 39 41 43 45 47 49 51
Gasoline Inventory
5Yr Average +/-1 stdev 2020 2021
Weekly data in mln barrels, from Aug 16 to Aug 21
500
1,000
1,500
2,000
2,500
3,000
3,500
4,000
4,500
1 3 5 7 9 111315171921232527293133353739414345474951
Natural Gas Inventory
5Yr Average +/-1 stdev 2020 2021
Weekly data in billion cubic feet, from Aug 16 to Aug 21
6
11
16
1 3 5 7 9 11 13 15 17 19 21 23 25 27 29 31 33 35 37 39 41 43 45 47 49 51
Heating Oil Inventory
5Yr Average +/-1 stdev 2020 2021
Weekly data in mln barrels, from Aug 16 to Aug 21
280
300
320
340
360
380
400
Jan Feb Mar Apr May Jun Jul Aug Sep Oct Nov Dec
OECD Europe Oil Industry Inventory
5Yr Average +/-1 stdev 2020 2021
Monthly data in mln barrels, from May 16 to May 21

T
Agriculture
Source: Bloomberg, WisdomTree Source: Bloomberg, WisdomTree
Source: Bloomberg, WisdomTree Source: Bloomberg, WisdomTree
Source: Bloomberg, WisdomTree Source: Bloomberg, WisdomTree
Agricultur
·
Source: Bloomberg, WisdomTree Source: Bloomberg, WisdomTree
13
Commodities Front Month Futures and
Trading Volumes
Note: all commodity futures trading volume and price data is denominated in USD unless otherwise indicated.
Historical performance is not an indication of future performance and any investments may go down in value.
$1,600
$1,800
$2,000
$2,200
$2,400
$2,600
$2,800
$3,000
0
500
1,000
1,500
2,000
2,500
Au
g 2
0
Se
p 2
0
Oc
t 2
0
No
v 2
0
De
c 2
0
Ja
n 2
1
Fe
b 2
1
Ma
r 21
Ap
r 21
Ma
y 2
1
Ju
n 2
1
Ju
l 21
Au
g 2
1
Cocoa Front Month Futures Price
Volume ($mn) Prices (RHS) 50 dma (RHS) 200 dma (RHS)
Daily data in USD/MT, from 27 Aug 20 to 27 Aug 21
$2.0
$3.0
$4.0
$5.0
$6.0
$7.0
$8.0
$9.0
0
5,000
10,000
15,000
20,000
25,000
30,000
35,000
Au
g 2
0
Se
p 2
0
Oc
t 2
0
No
v 2
0
De
c 2
0
Ja
n 2
1
Fe
b 2
1
Ma
r 21
Ap
r 21
Ma
y 2
1
Ju
n 2
1
Ju
l 21
Au
g 2
1
Corn Front Month Futures Price
Volume ($mn) Prices (RHS) 50 dma (RHS) 200 dma (RHS)
Daily data in USd/bu., from 27 Aug 20 to 27 Aug 21
$0.20
$0.30
$0.40
$0.50
$0.60
$0.70
$0.80
-500
500
1,500
2,500
3,500
4,500
5,500
Au
g 2
0
Se
p 2
0
Oc
t 2
0
No
v 2
0
De
c 2
0
Ja
n 2
1
Fe
b 2
1
Ma
r 21
Ap
r 21
Ma
y 2
1
Ju
n 2
1
Ju
l 21
Au
g 2
1
Soybean Oil Front Month Futures Price
Volume ($mn) Prices (RHS) 50 dma (RHS) 200 dma (RHS)
Daily data in USd/lb., from 27 Aug 20 to 27 Aug 21
$0.08
$0.10
$0.12
$0.14
$0.16
$0.18
$0.20
$0.22
0
1,000
2,000
3,000
4,000
5,000
6,000
7,000
Au
g 2
0
Se
p 2
0
Oc
t 2
0
No
v 2
0
De
c 2
0
Ja
n 2
1
Fe
b 2
1
Ma
r 2
1
Ap
r 2
1
Ma
y 2
1
Ju
n 2
1
Ju
l 21
Au
g 2
1
Sugar Front Month Futures Price
Volume ($mn) Prices (RHS) 50 dma (RHS) 200 dma (RHS)
Daily data in USd/lb., from 27 Aug 20 to 27 Aug 21
$0.7
$0.9
$1.1
$1.3
$1.5
$1.7
$1.9
$2.1
$2.3
0
1,000
2,000
3,000
4,000
5,000
6,000
7,000
8,000
Au
g 2
0
Se
p 2
0
Oc
t 2
0
No
v 2
0
De
c 2
0
Ja
n 2
1
Fe
b 2
1
Ma
r 21
Ap
r 2
1
Ma
y 2
1
Jun
21
Ju
l 21
Au
g 2
1
Coffee Front Month Futures Price
Volume ($mn) Prices (RHS) 50 dma (RHS) 200 dma (RHS)
Daily data in USd/lb., from 27 Aug 20 to 27 Aug 21
$0.50
$0.55
$0.60
$0.65
$0.70
$0.75
$0.80
$0.85
$0.90
$0.95
$1.00
-150
350
850
1,350
1,850
2,350
2,850
3,350
3,850
4,350
4,850
Au
g 2
0
Se
p 2
0
Oc
t 2
0
No
v 2
0
De
c 2
0
Ja
n 2
1
Fe
b 2
1
Ma
r 21
Ap
r 21
Ma
y 2
1
Ju
n 2
1
Ju
l 21
Au
g 2
1
Cotton Front Month Futures Price
Volume ($mn) Prices (RHS) 50 dma (RHS) 200 dma (RHS)
Daily data in USd/lb., from 27 Aug 20 to 27 Aug 21
$7.0
$9.0
$11.0
$13.0
$15.0
$17.0
$19.0
0
5,000
10,000
15,000
20,000
25,000
30,000
35,000
40,000
Au
g 2
0
Se
p 2
0
Oc
t 2
0
No
v 2
0
De
c 2
0
Ja
n 2
1
Fe
b 2
1
Ma
r 21
Ap
r 21
Ma
y 2
1
Ju
n 2
1
Ju
l 21
Au
g 2
1
Soybeans Front Month Futures Price
Volume ($mn) Prices (RHS) 50 dma (RHS) 200 dma (RHS)
Daily data in USd/bu., from 27 Aug 20 to 27 Aug 21
$3.5
$4.0
$4.5
$5.0
$5.5
$6.0
$6.5
$7.0
$7.5
$8.0
0
1,000
2,000
3,000
4,000
5,000
6,000
7,000
8,000
9,000
10,000
Au
g 2
0
Se
p 2
0
Oc
t 2
0
No
v 2
0
De
c 2
0
Ja
n 2
1
Fe
b 2
1
Ma
r 21
Ap
r 2
1
Ma
y 2
1
Ju
n 2
1
Ju
l 21
Au
g 2
1
Wheat Front Month Futures Price
Volume ($mn) Prices (RHS) 50 dma (RHS) 200 dma (RHS)
Daily data in USd/bu., from 27 Aug 20 to 27 Aug 21

Energy
Source: Bloomberg, WisdomTree Source: Bloomberg, WisdomTree
Source: Bloomberg, WisdomTree Source: Bloomberg, WisdomTree
Source: Bloomberg, WisdomTree
Carbon
Source: Bloomberg, WisdomTree
14Note: all commodity futures trading volume and price data is denominated in USD unless otherwise indicated.
Historical performance is not an indication of future performance and any investments may go down in value.
$15
$25
$35
$45
$55
$65
$75
$85
$0
$20,000
$40,000
$60,000
$80,000
$100,000
$120,000
$140,000
Au
g 2
0
Se
p 2
0
Oc
t 2
0
No
v 2
0
De
c 2
0
Ja
n 2
1
Fe
b 2
1
Ma
r 21
Ap
r 2
1
Ma
y 2
1
Ju
n 2
1
Ju
l 21
Au
g 2
1
Brent Oil Front Month Futures Price
Volume ($mn) Prices (RHS) 50 dma (RHS) 200 dma (RHS)
Daily data in USD/bbl., from 27 Aug 20 to 27 Aug 21
$1.4
$1.9
$2.4
$2.9
$3.4
$3.9
$4.4
$4.9
$0
$5,000
$10,000
$15,000
$20,000
$25,000
$30,000
Au
g 2
0
Se
p 2
0
Oc
t 2
0
No
v 2
0
De
c 2
0
Ja
n 2
1
Fe
b 2
1
Ma
r 2
1
Ap
r 2
1
Ma
y 2
1
Ju
n 2
1
Ju
l 21
Au
g 2
1
Natural Gas Front Month Futures Price
Volume ($mn) Prices (RHS) 50 dma (RHS) 200 dma (RHS)
Daily data in USD/MMBtu, from 27 Aug 20 to 27 Aug 21
$0.5
$0.7
$0.9
$1.1
$1.3
$1.5
$1.7
$1.9
$2.1
$2.3
$2.5
-$1,000
$4,000
$9,000
$14,000
$19,000
$24,000
$29,000
Au
g 2
0
Se
p 2
0
Oc
t 2
0
No
v 2
0
De
c 2
0
Ja
n 2
1
Fe
b 2
1
Ma
r 21
Ap
r 21
Ma
y 2
1
Ju
n 2
1
Ju
l 21
Au
g 2
1
Heating Oil Front Month Futures Price
Volume ($mn) Prices (RHS) 50 dma (RHS) 200 dma (RHS)
Daily data in USd/gal., from 27 Aug 20 to 27 Aug 21
3.4 €
13.4 €
23.4 €
33.4 €
43.4 €
53.4 €
63.4 €
€0
€500
€1,000
€1,500
€2,000
€2,500
€3,000
€3,500
€4,000
€4,500
Au
g 2
0
Se
p 2
0
Oc
t 2
0
No
v 2
0
De
c 2
0
Jan
21
Fe
b 2
1
Ma
r 2
1
Ap
r 21
Ma
y 2
1
Ju
n 2
1
Ju
l 21
Au
g 2
1
Carbon Front Month Futures Price
Volume ($mn) Prices (RHS) 50 dma (RHS) 200 dma (RHS)
Daily data in EUR/MT, from 27 Aug 20 to 27 Aug 21
-$50
-$30
-$10
$10
$30
$50
$70
$0
$20,000
$40,000
$60,000
$80,000
$100,000
$120,000
$140,000
Au
g 2
0
Se
p 2
0
Oc
t 2
0
No
v 2
0
De
c 2
0
Ja
n 2
1
Fe
b 2
1
Ma
r 21
Ap
r 21
Ma
y 2
1
Ju
n 2
1
Ju
l 21
Au
g 2
1
WTI Oil Front Month Futures Price
Volume ($mn) Prices (RHS) 50 dma (RHS) 200 dma (RHS)
Daily data in USD/bbl., from 27 Aug 20 to 27 Aug 21
$0.2
$0.7
$1.2
$1.7
$2.2
$2.7
$0
$5,000
$10,000
$15,000
$20,000
$25,000
$30,000
$35,000
$40,000
Au
g 2
0
Se
p 2
0
Oc
t 2
0
No
v 2
0
De
c 2
0
Ja
n 2
1
Fe
b 2
1
Ma
r 21
Ap
r 21
Ma
y 2
1
Ju
n 2
1
Ju
l 21
Au
g 2
1
Gasoline Front Month Futures Price
Volume ($mn) Prices (RHS) 50 dma (RHS) 200 dma (RHS)
Daily data in USd/gal., from 27 Aug 20 to 27 Aug 21

Industrial Metals
Source: Bloomberg, WisdomTree Source: Bloomberg, WisdomTree
Source: Bloomberg, WisdomTree Source: Bloomberg, WisdomTree
Source: Bloomberg, WisdomTree Source: Bloomberg, WisdomTree
Source: Bloomberg, WisdomTree
15Note: all commodity futures trading volume and price data is denominated in USD unless otherwise indicated.
Historical performance is not an indication of future performance and any investments may go down in value.
$1,300
$1,500
$1,700
$1,900
$2,100
$2,300
$2,500
$2,700
-$4,000
$1,000
$6,000
$11,000
$16,000
$21,000
$26,000
Au
g 2
0
Se
p 2
0
Oc
t 2
0
No
v 2
0
De
c 2
0
Ja
n 2
1
Fe
b 2
1
Ma
r 2
1
Ap
r 2
1
Ma
y 2
1
Ju
n 2
1
Ju
l 21
Au
g 2
1
Aluminum Front Month Futures Price
Volume ($mn) Prices (RHS) 50 dma (RHS) 200 dma (RHS)
Daily data in USD/MT, from 27 Aug 20 to 27 Aug 21
$1,700
$1,900
$2,100
$2,300
$2,500
$2,700
$2,900
$3,100
$3,300
$0
$2,000
$4,000
$6,000
$8,000
$10,000
$12,000
Au
g 2
0
Se
p 2
0
Oc
t 2
0
No
v 2
0
De
c 2
0
Ja
n 2
1
Fe
b 2
1
Ma
r 21
Ap
r 21
Ma
y 2
1
Ju
n 2
1
Ju
l 21
Au
g 2
1
Zinc Front Month Futures Price
Volume ($mn) Prices (RHS) 50 dma (RHS) 200 dma (RHS)
Daily data in USD/MT, from 27 Aug 20 to 27 Aug 21
$8,000
$10,000
$12,000
$14,000
$16,000
$18,000
$20,000
$22,000
$0
$2,000
$4,000
$6,000
$8,000
$10,000
$12,000
Au
g 2
0
Se
p 2
0
Oc
t 2
0
No
v 2
0
De
c 2
0
Ja
n 2
1
Fe
b 2
1
Ma
r 21
Ap
r 21
Ma
y 2
1
Ju
n 2
1
Jul 2
1
Au
g 2
1
Nickel Front Month Futures Price
Volume ($mn) Prices (RHS) 50 dma (RHS) 200 dma (RHS)
Daily data in USD/MT, from 27 Aug 20 to 27 Aug 21
$1.9
$2.4
$2.9
$3.4
$3.9
$4.4
$4.9
$5.4
$0
$5,000
$10,000
$15,000
$20,000
$25,000
$30,000
Au
g 2
0
Se
p 2
0
Oc
t 2
0
No
v 2
0
De
c 2
0
Ja
n 2
1
Fe
b 2
1
Ma
r 2
1
Ap
r 2
1
Ma
y 2
1
Ju
n 2
1
Ju
l 21
Au
g 2
1
Copper (COMEX) Front Month Futures Price
Volume ($mn) Prices (RHS) 50 dma (RHS) 200 dma (RHS)
Daily data in USd/lb., from 27 Aug 20 to 27 Aug 21
$12,000
$17,000
$22,000
$27,000
$32,000
$37,000
$42,000
$0
$100
$200
$300
$400
$500
$600
$700
$800
Au
g 2
0
Se
p 2
0
Oc
t 2
0
No
v 2
0
De
c 2
0
Ja
n 2
1
Fe
b 2
1
Ma
r 21
Ap
r 21
Ma
y 2
1
Ju
n 2
1
Ju
l 21
Au
g 2
1
Tin Front Month Futures Price
Volume ($mn) Prices (RHS) 50 dma (RHS) 200 dma (RHS)
Daily data in USD/MT, from 27 Aug 20 to 27 Aug 21
$1,500
$1,600
$1,700
$1,800
$1,900
$2,000
$2,100
$2,200
$2,300
$2,400
$2,500
$0
$500
$1,000
$1,500
$2,000
$2,500
$3,000
$3,500
$4,000
$4,500
Au
g 2
0
Se
p 2
0
Oc
t 2
0
No
v 2
0
De
c 2
0
Ja
n 2
1
Fe
b 2
1
Ma
r 21
Ap
r 21
Ma
y 2
1
Ju
n 2
1
Ju
l 21
Au
g 2
1
Lead Front Month Futures Price
Volume ($mn) Prices (RHS) 50 dma (RHS) 200 dma (RHS)
Daily data in USD/MT, from 27 Aug 20 to 27 Aug 21
$3,500
$4,500
$5,500
$6,500
$7,500
$8,500
$9,500
$10,500
$11,500
$0
$5,000
$10,000
$15,000
$20,000
$25,000
$30,000
$35,000
$40,000
$45,000
Au
g 2
0
Se
p 2
0
Oc
t 2
0
No
v 2
0
De
c 2
0
Ja
n 2
1
Fe
b 2
1
Ma
r 21
Ap
r 2
1
Ma
y 2
1
Ju
n 2
1
Ju
l 21
Au
g 2
1
Copper (LME) Front Month Futures Price
Volume ($mn) 200 dma (RHS) 50 dma (RHS) Prices (RHS)
Daily data in USD/MT, from 27 Aug 20 to 27 Aug 21

Precious Metals
Source: Bloomberg, WisdomTree Source: Bloomberg, WisdomTree
Source: Bloomberg, WisdomTree Source: Bloomberg, WisdomTree
Livestock
Source: Bloomberg, WisdomTree Source: Bloomberg, WisdomTree
Source: Bloomberg, WisdomTree
16Note: all commodity futures trading volume and price data is denominated in USD unless otherwise indicated.
Historical performance is not an indication of future performance and any investments may go down in value.
$1.00
$1.10
$1.20
$1.30
$1.40
$1.50
$1.60
$1.70
$0
$500
$1,000
$1,500
$2,000
$2,500
$3,000
Au
g 2
0
Se
p 2
0
Oc
t 2
0
No
v 2
0
De
c 2
0
Ja
n 2
1
Fe
b 2
1
Ma
r 21
Ap
r 21
Ma
y 2
1
Ju
n 2
1
Ju
l 21
Au
g 2
1
Feeder Cattle Front Month Futures Price
Volume ($mn) Prices (RHS) 50 dma (RHS) 200 dma (RHS)
Daily data in USd/lb., from 27 Aug 20 to 27 Aug 21
$0.32
$0.42
$0.52
$0.62
$0.72
$0.82
$0.92
$1.02
$200
$700
$1,200
$1,700
$2,200
$2,700
$3,200
$3,700
$4,200
$4,700
Au
g 2
0
Se
p 2
0
Oc
t 2
0
No
v 2
0
De
c 2
0
Ja
n 2
1
Fe
b 2
1
Ma
r 21
Ap
r 21
Ma
y 2
1
Ju
n 2
1
Ju
l 21
Au
g 2
1
Lean Hogs Front Month Futures Price
Volume ($mn) Prices (RHS) 50 dma (RHS) 200 dma (RHS)
Daily data in USd/lb., from 27 Aug 20 to 27 Aug 21
$550
$650
$750
$850
$950
$1,050
$1,150
$1,250
$1,350
$0
$500
$1,000
$1,500
$2,000
$2,500
Au
g 2
0
Se
p 2
0
Oc
t 2
0
No
v 2
0
De
c 2
0
Ja
n 2
1
Fe
b 2
1
Ma
r 21
Ap
r 21
Ma
y 2
1
Ju
n 2
1
Ju
l 21
Au
g 2
1
Platinum Front Month Futures Price
Volume ($mn) Prices (RHS) 50 dma (RHS) 200 dma (RHS)
Daily data in USD/t oz., from 27 Aug 20 to 27 Aug 21
$1,100
$1,200
$1,300
$1,400
$1,500
$1,600
$1,700
$1,800
$1,900
$2,000
$2,100
$0
$20,000
$40,000
$60,000
$80,000
$100,000
$120,000
Au
g 2
0
Se
p 2
0
Oc
t 2
0
No
v 2
0
De
c 2
0
Ja
n 2
1
Fe
b 2
1
Ma
r 21
Ap
r 21
Ma
y 2
1
Ju
n 2
1
Ju
l 21
Au
g 2
1
Gold Front Month Futures Price
Volume ($mn) Prices (RHS) 50 dma (RHS) 200 dma (RHS)
Daily data in USD/t oz., from 27 Aug 20 to 27 Aug 21
$0.80
$0.90
$1.00
$1.10
$1.20
$1.30
$1.40
$0
$1,000
$2,000
$3,000
$4,000
$5,000
$6,000
Au
g 2
0
Se
p 2
0
Oc
t 2
0
No
v 2
0
De
c 2
0
Ja
n 2
1
Fe
b 2
1
Ma
r 21
Ap
r 21
Ma
y 2
1
Ju
n 2
1
Ju
l 21
Au
g 2
1
Live Cattle Front Month Futures Price
Volume ($mn) Prices (RHS) 50 dma (RHS) 200 dma (RHS)
Daily data in USd/lb., from 27 Aug 20 to 27 Aug 21
$500
$1,000
$1,500
$2,000
$2,500
$3,000
$3,500
$0
$200
$400
$600
$800
$1,000
$1,200
$1,400
$1,600
$1,800
$2,000
Au
g 2
0
Se
p 2
0
Oc
t 2
0
No
v 2
0
De
c 2
0
Ja
n 2
1
Fe
b 2
1
Ma
r 21
Ap
r 2
1
Ma
y 2
1
Ju
n 2
1
Ju
l 21
Au
g 2
1
Palladium Front Month Futures Price
Volume ($mn) Prices (RHS) 50 dma (RHS) 200 dma (RHS)
Daily data in USD/t oz., from 27 Aug 20 to 27 Aug 21
$10$11$12$13$14$15$16$17$18$19$20$21$22$23$24$25$26$27$28$29$30$31
$0
$5,000
$10,000
$15,000
$20,000
$25,000
$30,000
$35,000
$40,000
$45,000
$50,000
Au
g 2
0
Se
p 2
0
Oc
t 2
0
No
v 2
0
De
c 2
0
Jan
21
Fe
b 2
1
Ma
r 21
Ap
r 21
Ma
y 2
1
Ju
n 2
1
Ju
l 21
Au
g 2
1
Silver Front Month Futures Price
Volume ($mn) Prices (RHS) 50 dma (RHS) 200 dma (RHS)
Daily data in USD/t oz., from 27 Aug 20 to 27 Aug 21

Agriculture
Source: Bloomberg, WisdomTree Source: Bloomberg, WisdomTree
Source: Bloomberg, WisdomTree Source: Bloomberg, WisdomTree
Source: Bloomberg, WisdomTree Source: Bloomberg, WisdomTree
Agricultur
·Source: Bloomberg, WisdomTree Source: Bloomberg, WisdomTree
17
Futures Curves
Note: all commodity futures price data is denominated in USD unless otherwise indicated.
Historical performance is not an indication of future performance and any investments may go down in value.
$2,250
$2,300
$2,350
$2,400
$2,450
$2,500
$2,550
$2,600
$2,650
M1 M2 M3 M4 M5 M6 M7 M8 M9 M10
Maturity (Month)
Cocoa Futures
27 Aug 21 20 Aug 21 27 Jul 21 27 May 21
USD/MT
$1.20
$1.30
$1.40
$1.50
$1.60
$1.70
$1.80
$1.90
$2.00
$2.10
$2.20
M1
M2
M3
M4
M5
M6
M7
M8
M9
M1
0
M1
1
M1
2
M1
3
M1
4
M1
5
Maturity (Month)
Coffee Futures
27 Aug 21 20 Aug 21 27 Jul 21 27 May 21
USd/lb.
$3.1
$3.6
$4.1
$4.6
$5.1
$5.6
$6.1
$6.6
$7.1
M1
M2
M3
M4
M5
M6
M7
M8
M9
M1
0
M1
1
M1
2
M1
3
M1
4
M1
5
Maturity (Month)
Corn Futures
27 Aug 21 20 Aug 21 27 Jul 21 27 May 21
USd/bu.
$0.70
$0.75
$0.80
$0.85
$0.90
$0.95
$1.00
M1
M2
M3
M4
M5
M6
M7
M8
M9
M1
0
M1
1
M1
2
M1
3
M1
4
M1
5
Maturity (Month)
Cotton Futures
27 Aug 21 20 Aug 21 27 Jul 21 27 May 21
USd/lb.
$0.450
$0.500
$0.550
$0.600
$0.650
$0.700
M1
M2
M3
M4
M5
M6
M7
M8
M9
M1
0
M1
1
M1
2
M1
3
M1
4
Maturity (Month)
Soybean Oil Futures
27 Aug 21 20 Aug 21 27 Jul 21 27 May 21
USd/lb.
$8.1
$9.1
$10.1
$11.1
$12.1
$13.1
$14.1
$15.1
$16.1
M1
M2
M3
M4
M5
M6
M7
M8
M9
M1
0
M1
1
M1
2
M1
3
M1
4
M1
5
M1
6
M1
7
M1
8
M1
9
M2
0
M2
1
Maturity (Month)
Soybeans Futures
27 Aug 21 20 Aug 21 27 Jul 21 27 May 21
USd/bu.
$0.090
$0.110
$0.130
$0.150
$0.170
$0.190
$0.210
$0.230
M1
M2
M3
M4
M5
M6
M7
M8
M9
M10
M11
M12
Maturity (Month)
Sugar Futures
27 Aug 21 20 Aug 21 27 Jul 21 27 May 21
USd/lb.
$5.5
$6.0
$6.5
$7.0
$7.5
$8.0
M1
M2
M3
M4
M5
M6
M7
M8
M9
M1
0
M1
1
M1
2
M1
3
Maturity (Month)
Wheat Futures
27 Aug 21 20 Aug 21 27 Jul 21 27 May 21
USd/bu.

Energy
Source: Bloomberg, WisdomTree Source: Bloomberg, WisdomTree
Source: Bloomberg, WisdomTree Source: Bloomberg, WisdomTree
Source: Bloomberg, WisdomTree
Carbon
Source: Bloomberg, WisdomTree
18Note: all commodity futures price data is denominated in USD unless otherwise indicated.
Historical performance is not an indication of future performance and any investments may go down in value.
$30
$35
$40
$45
$50
$55
$60
$65
$70
$75
$80
M1
M3
M5
M7
M9
M1
1
M1
3
M15
M17
M1
9
M2
1
M23
M25
M2
7
M2
9
M31
M33
M3
5
Maturity (Month)
Brent Oil Futures
27 Aug 21 27 Jul 21 27 May 21
USD/bbl.
$30
$35
$40
$45
$50
$55
$60
$65
$70
$75
M1
M3
M5
M7
M9
M1
1
M1
3
M1
5
M1
7
M1
9
M2
1
M2
3
M2
5
M2
7
M2
9
M3
1
M3
3
M3
5
Maturity (Month)
WTI Oil Futures
27 Aug 21 20 Aug 21 27 Jul 21 27 May 21
USD/bbl.
$1.5
$2.0
$2.5
$3.0
$3.5
$4.0
$4.5
$5.0
M1
M3
M5
M7
M9
M11
M13
M15
M17
M19
M21
M23
M25
M27
M29
M31
M33
M35
Maturity (Month)
Natural Gas Futures
27 Aug 21 20 Aug 21 27 Jul 21 27 May 21
USD/MMBtu
$0.35
$0.85
$1.35
$1.85
$2.35
$2.85
M1
M3
M5
M7
M9
M11
M13
M15
M17
M19
M21
M23
M25
M27
M29
M31
M33
M35
Maturity (Month)
Gasoline Futures
27 Aug 21 20 Aug 21 27 Jul 21 27 May 21
USd/gal.
$1.00
$1.20
$1.40
$1.60
$1.80
$2.00
$2.20
$2.40
M1
M3
M5
M7
M9
M11
M13
M15
M17
M19
M21
M23
M25
M27
M29
M31
M33
M35
Maturity (Month)
Heating Oil Futures
27 Aug 21 20 Aug 21 27 Jul 21 27 May 21
USd/gal.
20.0 €
25.0 €
30.0 €
35.0 €
40.0 €
45.0 €
50.0 €
55.0 €
60.0 €
65.0 €
70.0 €
M1
M2
M3
M4
M5
M6
M7
M8
M9
M10
M11
M12
M13
M14
M15
Maturity (Month)
Carbon Futures
27 Aug 21 20 Aug 21 27 Jul 21 27 May 21
EUR/MT

Industrial Metals
Source: Bloomberg, WisdomTree Source: Bloomberg, WisdomTree
Source: Bloomberg, WisdomTree Source: Bloomberg, WisdomTree
Source: Bloomberg, WisdomTree Source: Bloomberg, WisdomTree
Source: Bloomberg, WisdomTree
19Note: all commodity futures price data is denominated in USD unless otherwise indicated.
Historical performance is not an indication of future performance and any investments may go down in value.
$2,300
$2,350
$2,400
$2,450
$2,500
$2,550
$2,600
$2,650
$2,700
M1
M3
M5
M7
M9
M1
1
M1
3
M1
5
M1
7
M1
9
M2
1
M2
3
M2
5
M2
7
M2
9
M31
M3
3
M3
5
Maturity (Month)
Aluminum Futures
27 Aug 21 20 Aug 21 27 Jul 21 27 May 21
USD/MT
$1,500
$1,600
$1,700
$1,800
$1,900
$2,000
$2,100
$2,200
$2,300
$2,400
M1
M3
M5
M7
M9
M1
1
M1
3
M1
5
M1
7
M1
9
M2
1
M2
3
M2
5
M2
7
M2
9
M3
1
M3
3
M3
5
Maturity (Month)
Lead Futures
27 Aug 21 20 Aug 21 27 Jul 21 27 May 21
USD/MT
$2.80
$3.00
$3.20
$3.40
$3.60
$3.80
$4.00
$4.20
$4.40
$4.60
$4.80
M1
M2
M3
M4
M5
M6
M7
M8
M9
M10
M11
M12
M13
M14
M15
M16
M17
M18
M19
M20
M21
M22
M23
M24
M25
Maturity (Month)
Copper (COMEX) Futures
27 Aug 21 20 Aug 21 27 Jul 21 27 May 21
USd/lb.
$5,000
$6,000
$7,000
$8,000
$9,000
$10,000
$11,000
M1
M3
M5
M7
M9
M1
1
M1
3
M1
5
M1
7
M1
9
M2
1
M2
3
M2
5
M2
7
M2
9
M3
1
M3
3
M35
Maturity (Month)
Copper (LME) Futures
27 Aug 21 20 Aug 21 27 Jul 21 27 May 21
USD/MT
$17,000
$19,000
$21,000
$23,000
$25,000
$27,000
$29,000
$31,000
$33,000
$35,000
$37,000
M1
M2
M3
M4
M5
M6
M7
M8
M9
M1
0
M1
1
M1
2
M1
3
M1
4
M1
5
Maturity (Month)
Tin Futures
27 Aug 21 20 Aug 21 27 Jul 21 27 May 21
USD/MT
$12,000
$12,800
$13,600
$14,400
$15,200
$16,000
$16,800
$17,600
$18,400
$19,200
$20,000
M1
M3
M5
M7
M9
M1
1
M1
3
M1
5
M1
7
M1
9
M2
1
M2
3
M2
5
M2
7
M2
9
M3
1
M3
3
M35
Maturity (Month)
Nickel Futures
27 Aug 21 20 Aug 21 27 Jul 21 27 May 21
USD/MT
$2,000
$2,200
$2,400
$2,600
$2,800
$3,000
$3,200
M1
M3
M5
M7
M9
M1
1
M1
3
M1
5
M1
7
M1
9
M2
1
M2
3
M2
5
M2
7
M2
9
M31
M3
3
M3
5
Maturity (Month)
Zinc Futures
27 Aug 21 20 Aug 21 27 Jul 21 27 May 21
USD/MT

Precious Metals
Source: Bloomberg, WisdomTree Source: Bloomberg, WisdomTree
Source: Bloomberg, WisdomTree Source: Bloomberg, WisdomTree
Livestock
Source: Bloomberg, WisdomTree Source: Bloomberg, WisdomTree
Source: Bloomberg, WisdomTree
20Note: all commodity futures price data is denominated in USD unless otherwise indicated.
Historical performance is not an indication of future performance and any investments may go down in value.
$0.0
$5.0
$10.0
$15.0
$20.0
$25.0
$30.0
M1
M2
M3
M4
M5
M6
M7
M8
M9
M1
0
M1
1
M1
2
M1
3
M1
4
M1
5
M1
6
Maturity (Month)
Silver Futures
27 Aug 21 20 Aug 21 27 Jul 21 27 May 21
USD/t oz.
$1,650
$1,700
$1,750
$1,800
$1,850
$1,900
$1,950
$2,000
$2,050
M1
M2
M3
M4
M5
M6
M7
M8
M9
M1
0
M1
1
M1
2
M1
3
M1
4
M15
M1
6
M1
7
M1
8
M1
9
M2
0
Maturity (Month)
Gold Futures
27 Aug 21 20 Aug 21 27 Jul 21 27 May 21
USD/t oz.
$550
$650
$750
$850
$950
$1,050
$1,150
$1,250
M1 M2 M3 M4 M5Maturity (Month)
Platinum Futures
27 Aug 21 20 Aug 21 27 Jul 21 27 May 21
USD/t oz.
$2,000
$2,100
$2,200
$2,300
$2,400
$2,500
$2,600
$2,700
$2,800
$2,900
M1 M2 M3 M4 M5
Maturity (Month)
Palladium Futures
27 Aug 21 20 Aug 21 27 Jul 21 27 May 21
USD/t oz.
$0.35
$0.45
$0.55
$0.65
$0.75
$0.85
$0.95
$1.05
$1.15
$1.25
M1
M2
M3
M4
M5
M6
M7
M8
M9
M1
0
M11
M1
2
Maturity (Month)
Lean Hogs Futures
27 Aug 21 20 Aug 21 27 Jul 21 27 May 21
USd/lb.
$0.80
$0.90
$1.00
$1.10
$1.20
$1.30
$1.40
$1.50
M1 M2 M3 M4 M5 M6 M7 M8Maturity (Month)
Live Cattle Futures
27 Aug 21 20 Aug 21 27 Jul 21 27 May 21
USd/lb.
$1.20
$1.30
$1.40
$1.50
$1.60
$1.70
$1.80
M1 M2 M3 M4 M5 M6 M7 M8Maturity (Month)
Feeder Cattle Futures
27 Aug 21 20 Aug 21 27 Jul 21 27 May 21
USd/lb.

C
T
Commodity Monthly Matrix Explained
CALENDAR
WisdomTree - Recent Blogs
31-Aug-21 Aneeka Gupta https://www.wisdomtree.eu/en-gb/blog/2021-08-31/kicking-the-implicit-guarantee-of-state-owned-enterprise
31-Aug-21 Elvira Kuramshina https://www.wisdomtree.eu/en-gb/blog/2021-08-31/wisdomtree-quarterly-thematic-review-does-the-winner-take-it-all
27-Aug-21 Mobeen Tahir https://www.wisdomtree.eu/en-gb/blog/2021-08-27/whats-hot-aluminiums-fundamentals-keep-getting-better
27-Aug-21 WisdomTree https://www.wisdomtree.eu/en-gb/blog/2021-08-27/whats-hot-is-it-time-to-look-at-china-again
25-Aug-21 Pierre Debru https://www.wisdomtree.eu/en-gb/blog/2021-08-25/the-time-for-quality-is-nigh
•24-Aug-21 WisdomTree Introduction to Ethereum's dApps - Deep Dive into Aave
19-Aug-21 WisdomTree Key Takeaways from the Cloud 100
18-Aug-21 Bessemer Venture PartnersKey Takeaways from the Cloud 100
13-Aug-21 Aneeka Gupta Time to separate the wheat from the chaff
13-Aug-21 Aneeka Gupta What's Hot: Q2 Earnings season – Europe in pole position
11-Aug-21 WisdomTree Another Cloud Deal: Zoom Announces the Acquisition of Five9
09-Aug-21 WisdomTree China of Tomorrow Podcast: Digging Into Metals with Open Mineral
04-Aug-21 Didier Haenecour Is the recent fall in bond yields inflation related?
WisdomTree - Past Issues of Commodity Monthly Monitor
Jun - Jul 2021 Research Team Commodities had their best quarterly performance in a decade
May - Jun 2021 Research Team Nobody likes a show-off
Apr- May 2021 Research Team Inflation Underpins Commodity Strength
Mar - Apr 2021 Research Team Macro conditions remain supportive despite China sprinkling seeds of doubt
Feb - Mar 2021 Research Team Cyclicals ignore sell-off in equities
The research notes are for qualified investors only.
Key Reports
Current Next release
12-Jul-21 12-Aug-21 USDA World Agricultural Supply and Demand Estimates
07-Jul-21 10-Aug-21 EIA Short-Term Energy Outlook
10-Jul-21 12-Aug-21 OPEC OPEC Oil Market Report
13-Jul-21 12-Aug-21 IEA IEA Oil Market Report
DISCLAIMER
Important Information
Communications issued in the European Economic Area (“EEA”): This document has been issued and approved by WisdomTree Ireland Limited, which is authorised and regulated by the Central Bank of Ireland.
Communications issued in jurisdictions outside of the EEA: This document has been issued and approved by WisdomTree UK Limited, which is authorised and regulated by the United Kingdom Financial Conduct Authority.
WisdomTree Ireland Limited and WisdomTree UK Limited are each referred to as “WisdomTree” (as applicable). Our Conflicts of Interest Policy and Inventory are available on request.
For professional clients only. The information contained in this document is for your general information only and is neither an offer for sale nor a solicitation of an offer to buy securities or shares. This document should not be used
as the basis for any investment decision. Investments may go up or down in value and you may lose some or all of the amount invested. Past performance is not necessarily a guide to future performance. Any decision to invest
should be based on the information contained in the appropriate prospectus and after seeking independent investment, tax and legal advice.
This document is not, and under no circumstances is to be construed as, an advertisement or any other step in furtherance of a public offering of shares or securities in the United States or any province or territory thereof.
Neither this document nor any copy hereof should be taken, transmitted or distributed (directly or indirectly) into the United States.
This document may contain independent market commentary prepared by WisdomTree based on publicly available information. Although WisdomTree endeavours to ensure the accuracy of the content in this document,
WisdomTree does not warrant or guarantee its accuracy or correctness. Any third party data providers used to source the information in this document make no warranties or representation of any kind relating to such data.
Where WisdomTree has expressed its own opinions related to product or market activity, these views may change. Neither WisdomTree, nor any affiliate, nor any of their respective officers, directors, partners, or employees
accepts any liability whatsoever for any direct or consequential loss arising from any use of this document or its contents.
This document may contain forward looking statements including statements regarding current expectations or beliefs with regards to the performance of certain assets classes and/or sectors. Forward looking statements
are subject to certain risks, uncertainties and assumptions. There can be no assurance that such statements will be accurate and actual results could differ materially from those anticipated in such statements. WisdomTree
strongly recommends that you do not place undue reliance on these forward-looking statements.
Any historical performance included in this document may be based on back testing. Back testing is the process of evaluating an investment strategy by applying it to historical data to simulate what the performance of
such strategy would have been. However, back tested performance is purely hypothetical and is provided in this document solely for informational purposes. Back tested data does not represent actual performance and
should not be interpreted as an indication of actual or future performance.
Score based on unweighted sum of four fundamental/technical measures detailed below with each measure awarded a possible score of -1, 0, or 1
depending on whether variable is viewed as fundamentally negative, neutral or positive. Score ranging from -4 to +4. For commodities where data is not
available or not relevant, scores are calculated on remaining variables and adjusted to the -4 to +4 scale. The score matrix is designed to highlight significant
changes in key variables but should not be viewed as predictor of performance.
The four fundamental/technical measures are as follow:
- price vs. 200 days moving average: 1 when price is above 200dma and return is positive, -1 when price is below 200dma and return is negative, 0 otherwise
- % change in net positioning over the past month: 1 when % change is positive, -1 when % change is negative, 0 when no change
- % change in inventory level over the past 3 months: 1 when % is negative, -1 when % is positive, 0 when no change
- roll yield between the front and second month futures contracts: 1 when in backwardation, -1 when in contango, 0 when no change

·
•
•
••
•
CONTACT DETAILS
E [email protected] WisdomTree UK Limited
T +44 20 7448 4330 3 Lombard Street
F +44 20 7448 4366 London EC3V 9AA
United Kingdom