commercial forum presentation: economic outlook in uncertain times
TRANSCRIPT

Economic Outlook in Uncertain Times
Lawrence Yun, Ph.D.Chief Economist
NATIONAL ASSOCIATION OF REALTORS®
Presentation at NAR Annual Meeting New Orleans, LA
November 5, 2010

Federal Reserve FOMC • Ben Bernanke (Chairman):
• “Outlook remains unusually uncertain”
• Alan Greenspan (former Chairman):
• “If home prices start falling again, we could be facing a double-dip recession”
• James Bullard (St. Louis Fed): • “The U.S. is closer to a Japanese-style deflationary outcome”
• Thomas Hoenig (Kansas City Fed): • “Too rapid money creation results in eventual high inflation”
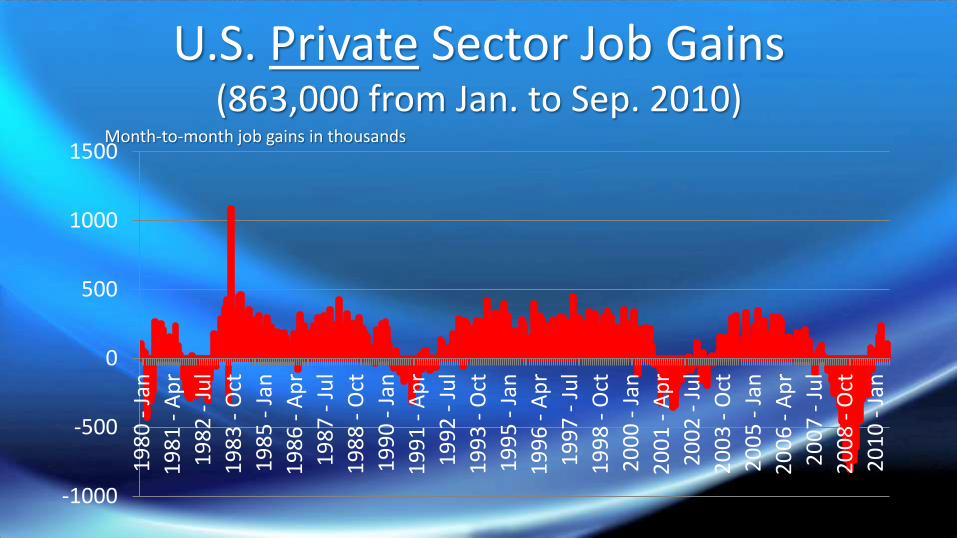
U.S. Private Sector Job Gains(863,000 from Jan. to Sep. 2010)
-1000
-500
0
500
1000
15001
98
0 -
Jan
19
81
- A
pr
19
82
- J
ul
19
83
- O
ct
19
85
- J
an
19
86
- A
pr
19
87
- J
ul
19
88
- O
ct
19
90
- J
an
19
91
- A
pr
19
92
- J
ul
19
93
- O
ct
19
95
- J
an
19
96
- A
pr
19
97
- J
ul
19
98
- O
ct
20
00
- J
an
20
01
- A
pr
20
02
- J
ul
20
03
- O
ct
20
05
- J
an
20
06
- A
pr
20
07
- J
ul
20
08
- O
ct
20
10
- J
an
Month-to-month job gains in thousands

Total Payroll Jobs in the U.S. (same as in 2000, but with 30 million more people)
124000
126000
128000
130000
132000
134000
136000
138000
1400002
00
0 -
Jan
20
00
- J
ul
20
01
- J
an
20
01
- J
ul
20
02
- J
an
20
02
- J
ul
20
03
- J
an
20
03
- J
ul
20
04
- J
an
20
04
- J
ul
20
05
- J
an
20
05
- J
ul
20
06
- J
an
20
06
- J
ul
20
07
- J
an
20
07
- J
ul
20
08
- J
an
20
08
- J
ul
20
09
- J
an
20
09
- J
ul
20
10
- J
an
20
10
- J
ul
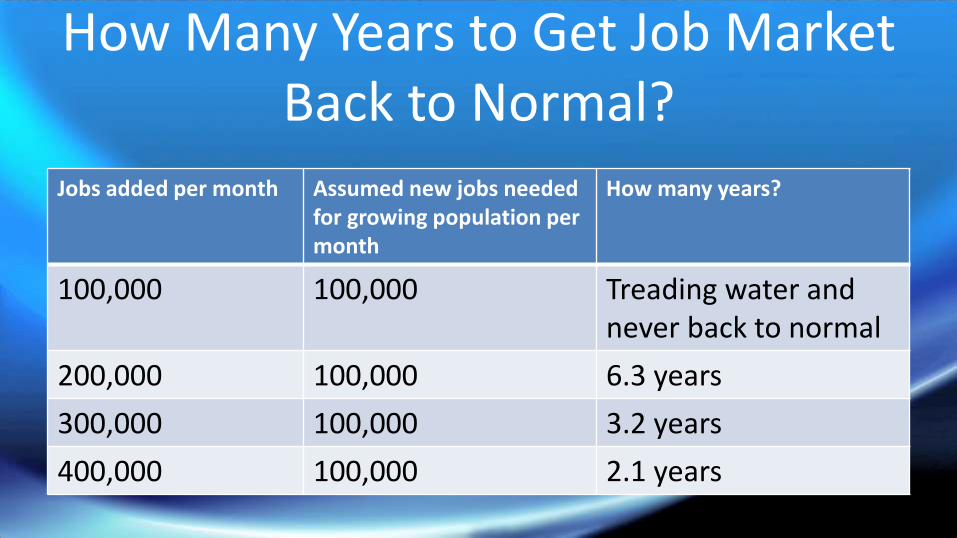
How Many Years to Get Job Market Back to Normal?
Jobs added per month Assumed new jobs needed for growing population per month
How many years?
100,000 100,000 Treading water and never back to normal
200,000 100,000 6.3 years
300,000 100,000 3.2 years
400,000 100,000 2.1 years

GDP Growing, but Deceleratingannualized % growth rate

Consumer Expenditure (Inflation adjusted in GDP accounting)
7000
7500
8000
8500
9000
9500 $ billion
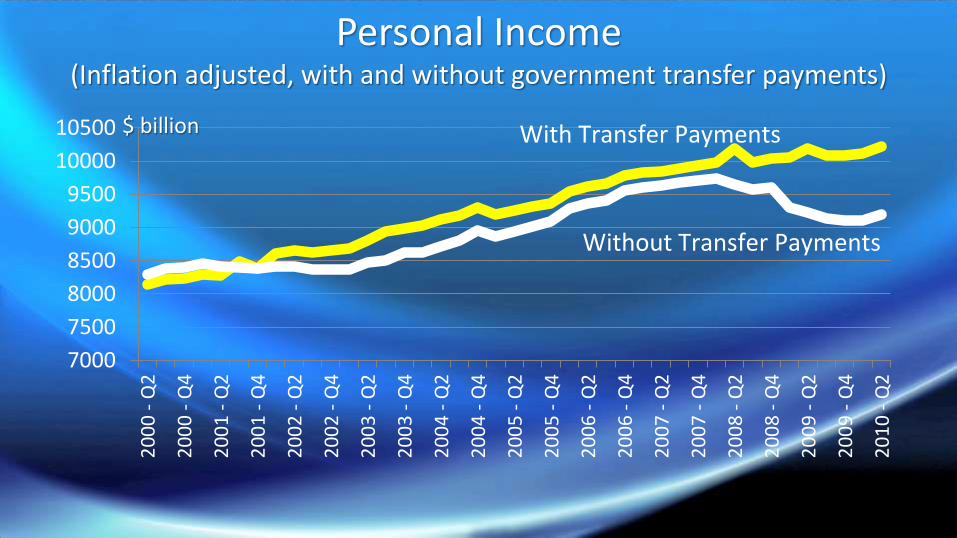
Personal Income(Inflation adjusted, with and without government transfer payments)
7000
7500
8000
8500
9000
9500
10000
105002
00
0 -
Q2
20
00
- Q
4
20
01
- Q
2
20
01
- Q
4
20
02
- Q
2
20
02
- Q
4
20
03
- Q
2
20
03
- Q
4
20
04
- Q
2
20
04
- Q
4
20
05
- Q
2
20
05
- Q
4
20
06
- Q
2
20
06
- Q
4
20
07
- Q
2
20
07
- Q
4
20
08
- Q
2
20
08
- Q
4
20
09
- Q
2
20
09
- Q
4
20
10
- Q
2
With Transfer Payments
Without Transfer Payments
$ billion
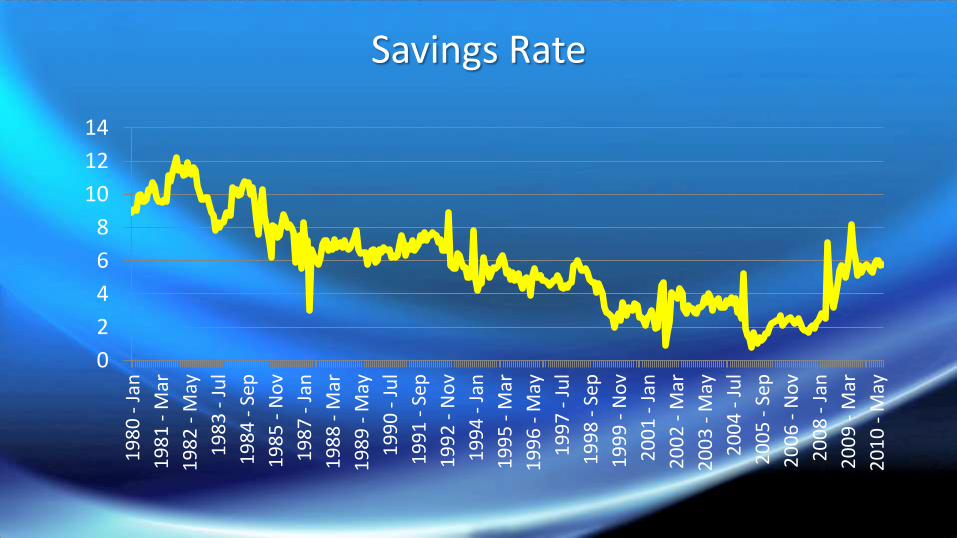
Savings Rate
0
2
4
6
8
10
12
141
98
0 -
Jan
19
81
- M
ar
19
82
- M
ay
19
83
- J
ul
19
84
- S
ep
19
85
- N
ov
19
87
- J
an
19
88
- M
ar
19
89
- M
ay
19
90
- J
ul
19
91
- S
ep
19
92
- N
ov
19
94
- J
an
19
95
- M
ar
19
96
- M
ay
19
97
- J
ul
19
98
- S
ep
19
99
- N
ov
20
01
- J
an
20
02
- M
ar
20
03
- M
ay
20
04
- J
ul
20
05
- S
ep
20
06
- N
ov
20
08
- J
an
20
09
- M
ar
20
10
- M
ay
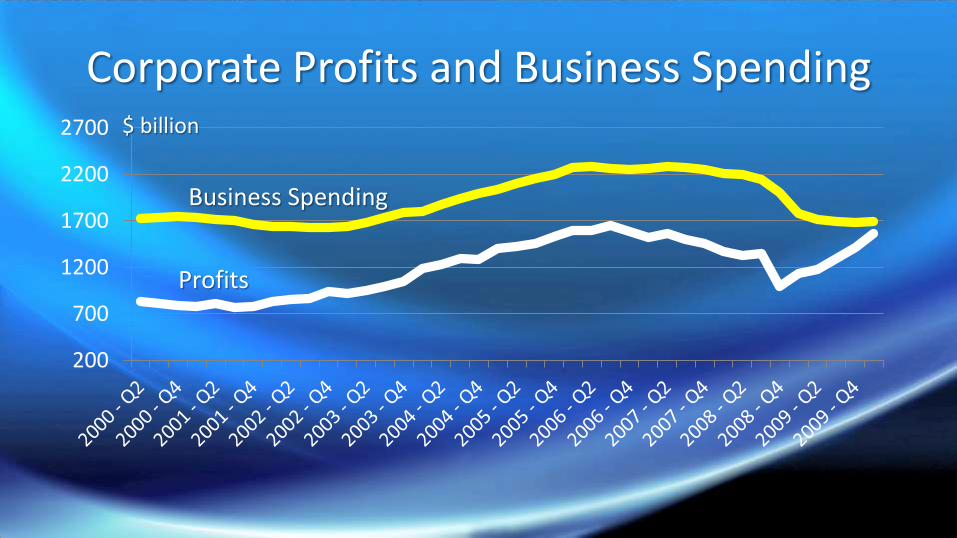
Corporate Profits and Business Spending
200
700
1200
1700
2200
2700
Business Spending
Profits
$ billion
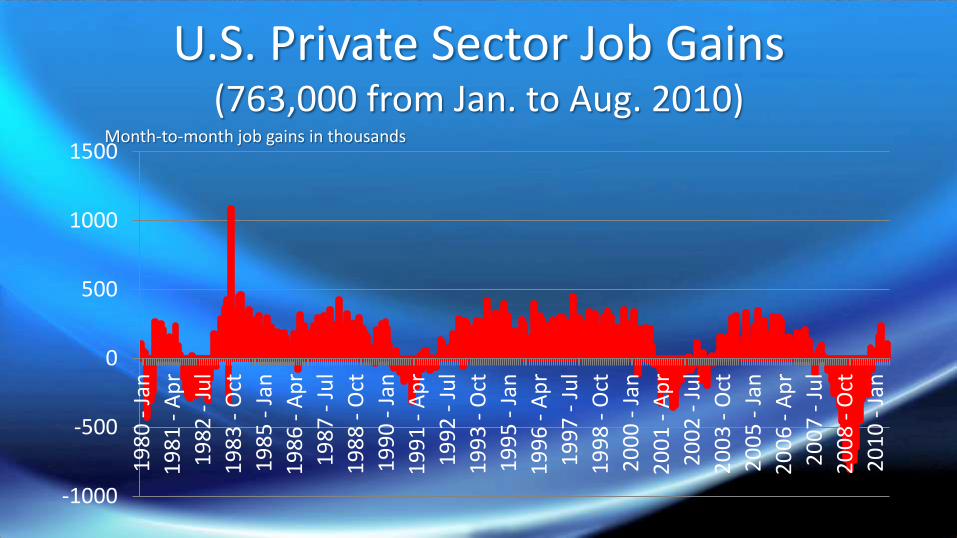
U.S. Private Sector Job Gains(763,000 from Jan. to Aug. 2010)
-1000
-500
0
500
1000
15001
98
0 -
Jan
19
81
- A
pr
19
82
- J
ul
19
83
- O
ct
19
85
- J
an
19
86
- A
pr
19
87
- J
ul
19
88
- O
ct
19
90
- J
an
19
91
- A
pr
19
92
- J
ul
19
93
- O
ct
19
95
- J
an
19
96
- A
pr
19
97
- J
ul
19
98
- O
ct
20
00
- J
an
20
01
- A
pr
20
02
- J
ul
20
03
- O
ct
20
05
- J
an
20
06
- A
pr
20
07
- J
ul
20
08
- O
ct
20
10
- J
an
Month-to-month job gains in thousands
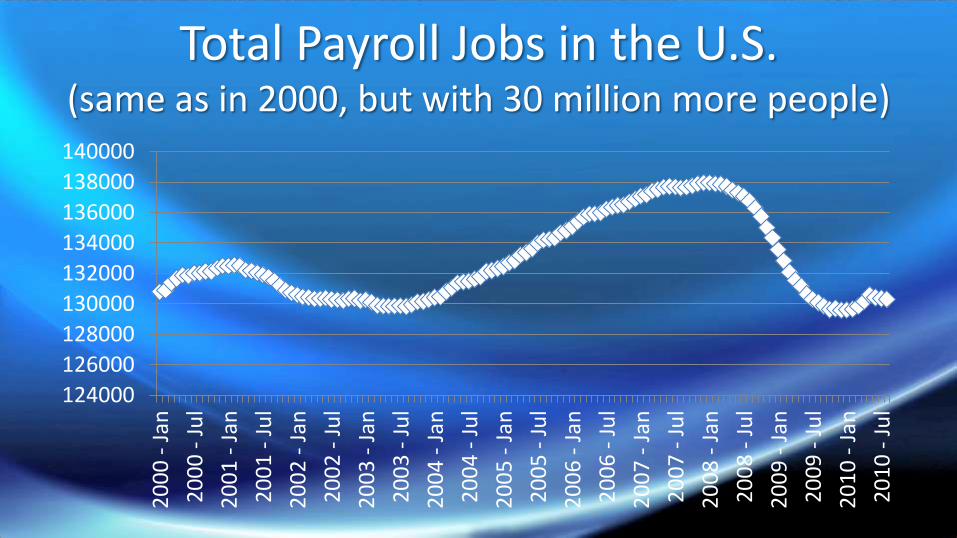
Total Payroll Jobs in the U.S. (same as in 2000, but with 30 million more people)
124000
126000
128000
130000
132000
134000
136000
138000
1400002
00
0 -
Jan
20
00
- J
ul
20
01
- J
an
20
01
- J
ul
20
02
- J
an
20
02
- J
ul
20
03
- J
an
20
03
- J
ul
20
04
- J
an
20
04
- J
ul
20
05
- J
an
20
05
- J
ul
20
06
- J
an
20
06
- J
ul
20
07
- J
an
20
07
- J
ul
20
08
- J
an
20
08
- J
ul
20
09
- J
an
20
09
- J
ul
20
10
- J
an
20
10
- J
ul

How Many Years to Get Job Market Back to Normal?
Jobs added per month Assumed new jobs needed for growing population per month
How many years?
100,000 100,000 Treading water and never back to normal
200,000 100,000 6.3 years
300,000 100,000 3.2 years
400,000 100,000 2.1 years
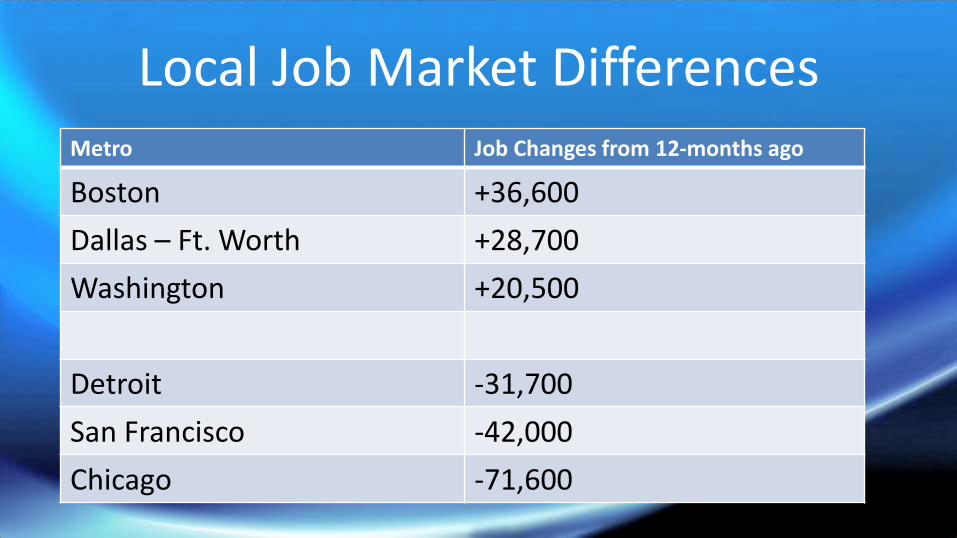
Local Job Market DifferencesMetro Job Changes from 12-months ago
Boston +36,600
Dallas – Ft. Worth +28,700
Washington +20,500
Detroit -31,700
San Francisco -42,000
Chicago -71,600
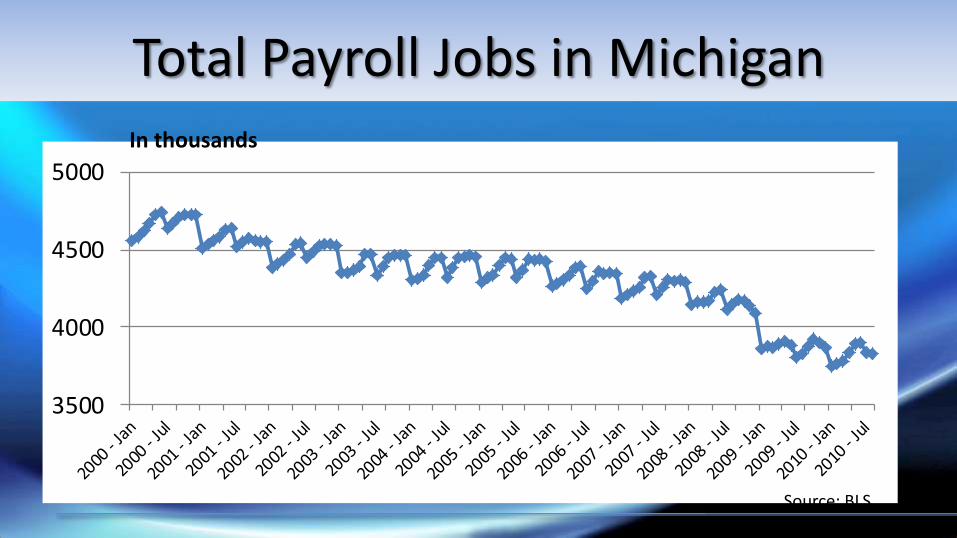
3500
4000
4500
5000
Source: BLS
In thousands
Total Payroll Jobs in Michigan
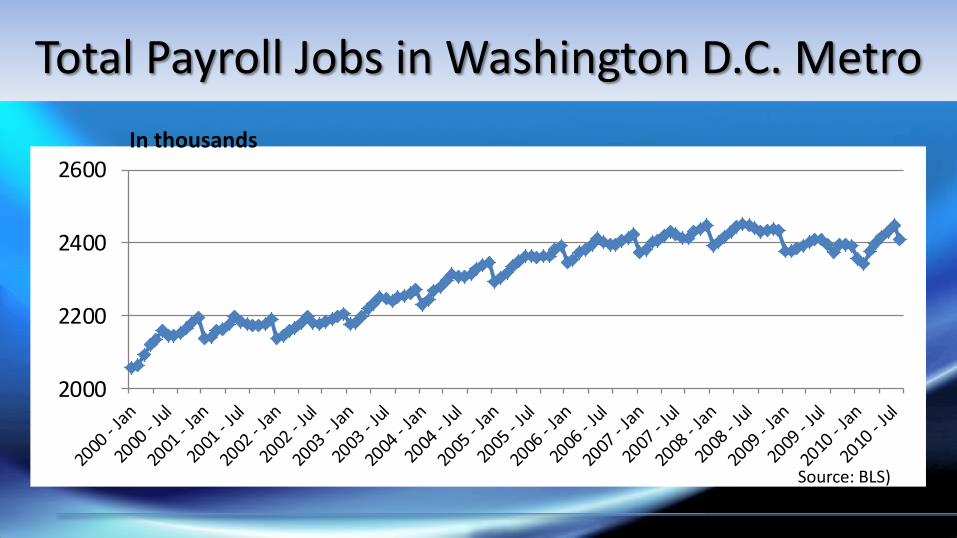
2000
2200
2400
2600
Source: BLS)
In thousands
Total Payroll Jobs in Washington D.C. Metro
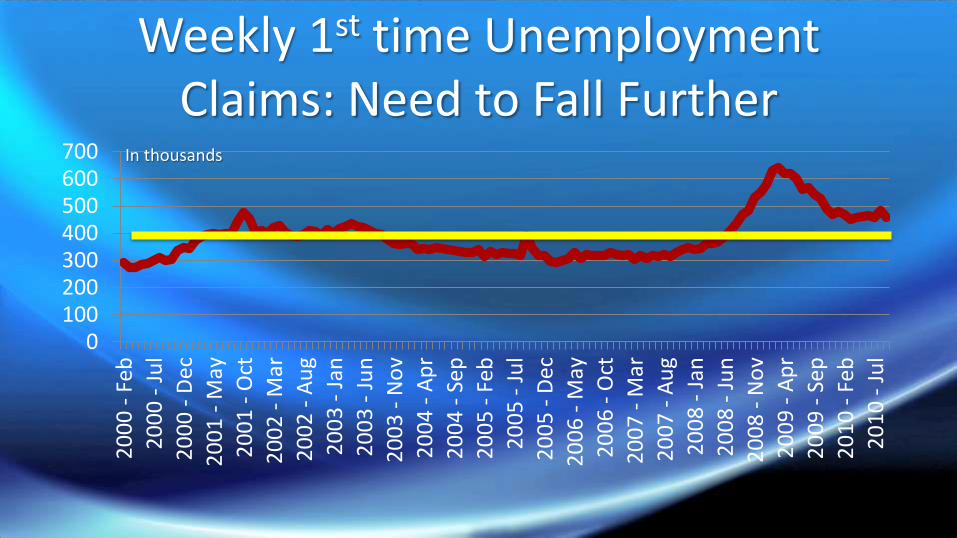
Weekly 1st time Unemployment Claims: Need to Fall Further
0100200300400500600700
20
00
- F
eb
20
00
- J
ul
20
00
- D
ec
20
01
- M
ay
20
01
- O
ct
20
02
- M
ar
20
02
- A
ug
20
03
- J
an
20
03
- J
un
20
03
- N
ov
20
04
- A
pr
20
04
- S
ep
20
05
- F
eb
20
05
- J
ul
20
05
- D
ec
20
06
- M
ay
20
06
- O
ct
20
07
- M
ar
20
07
- A
ug
20
08
- J
an
20
08
- J
un
20
08
- N
ov
20
09
- A
pr
20
09
- S
ep
20
10
- F
eb
20
10
- J
ul
In thousands
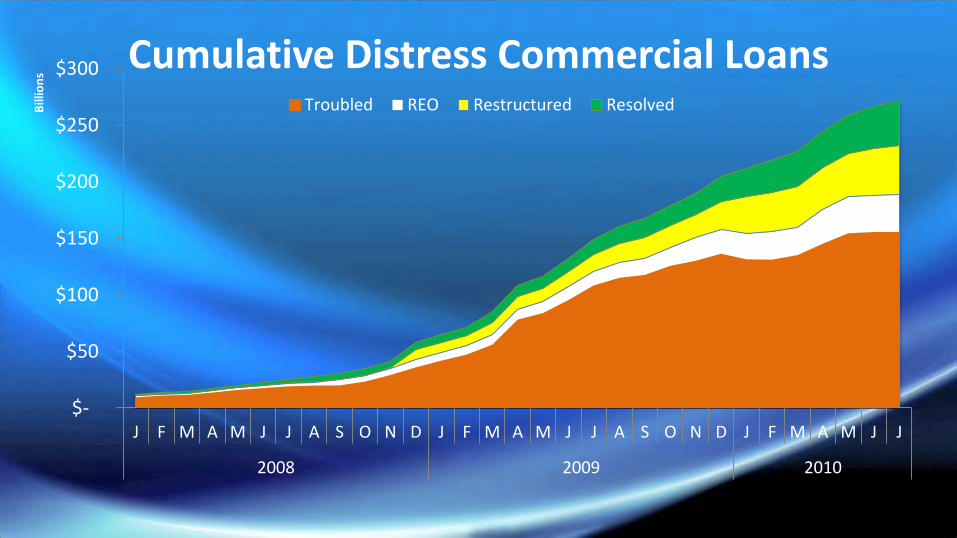
$-
$50
$100
$150
$200
$250
$300
J F M A M J J A S O N D J F M A M J J A S O N D J F M A M J J
2008 2009 2010
Bill
ion
s
Cumulative Distress Commercial LoansTroubled REO Restructured Resolved
Source: Real Capital Analytics
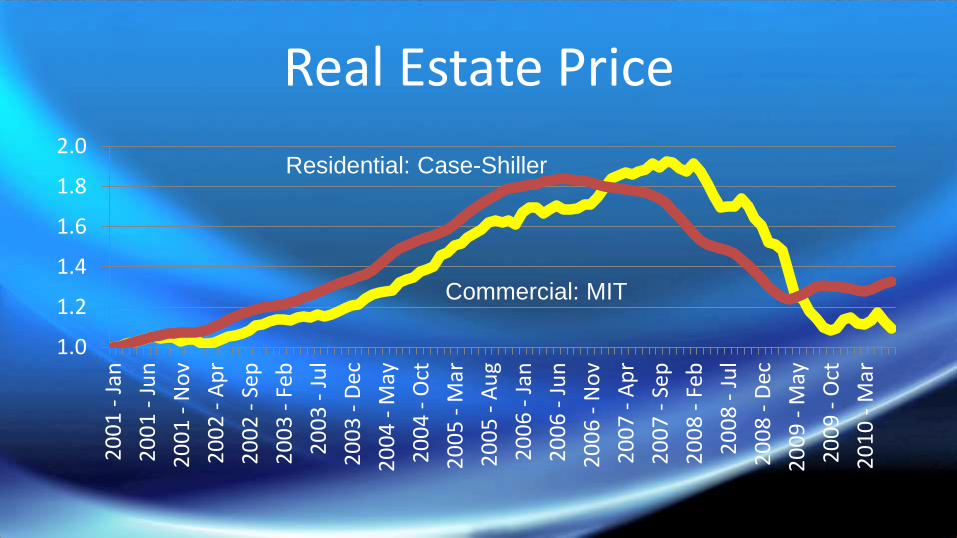
Real Estate Price
1.0
1.2
1.4
1.6
1.8
2.0
20
01
- J
an
20
01
- J
un
20
01
- N
ov
20
02
- A
pr
20
02
- S
ep
20
03
- F
eb
20
03
- J
ul
20
03
- D
ec
20
04
- M
ay
20
04
- O
ct
20
05
- M
ar
20
05
- A
ug
20
06
- J
an
20
06
- J
un
20
06
- N
ov
20
07
- A
pr
20
07
- S
ep
20
08
- F
eb
20
08
- J
ul
20
08
- D
ec
20
09
- M
ay
20
09
- O
ct
20
10
- M
ar
Residential: Case-Shiller
Commercial: MIT

-
5,000
10,000
15,000
20,000
25,000
30,000
35,000
40,000
45,000
50,000
J06
M M J S N J07
M M J S N J08
M M J S N J09
M M J S N J10
M M J S
Commercial Mortgage Backed Security IssuanceMonthly CMBS Issuance ($ Mil)
Source: Commercial Mortgage Alert
0
50
100
150
200
250
300
350
400
20
02
.Q1
20
02
.Q2
20
02
.Q3
20
02
.Q4
20
03
.Q1
20
03
.Q2
20
03
.Q3
20
03
.Q4
20
04
.Q1
20
04
.Q2
20
04
.Q3
20
04
.Q4
20
05
.Q1
20
05
.Q2
20
05
.Q3
20
05
.Q4
20
06
.Q1
20
06
.Q2
20
06
.Q3
20
06
.Q4
20
07
.Q1
20
07
.Q2
20
07
.Q3
20
07
.Q4
20
08
.Q1
20
08
.Q2
20
08
.Q3
20
08
.Q4
20
09
.Q1
20
09
.Q2
20
09
.Q3
20
09
.Q4
20
10
.Q1
20
10
.Q2
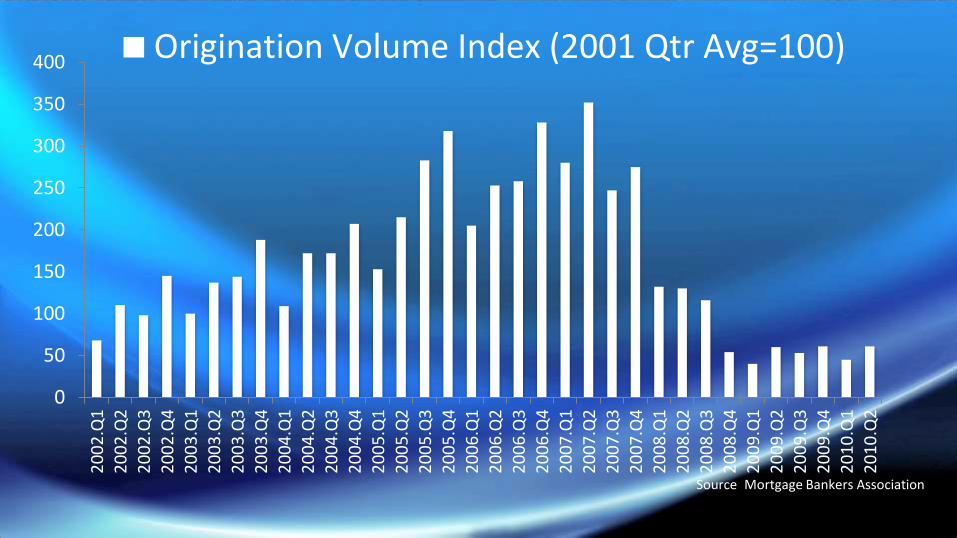
Origination Volume Index (2001 Qtr Avg=100)
Source: Mortgage Bankers Association
-
1,000
2,000
3,000
4,000
5,000
6,000
7,000
8,000
J06
F M A M J J A S O N D J07
F M A M J J A S O N D J08
F M A M J J A S O N D J09
F M A M J J A S O N D J10
F M A M J J A S
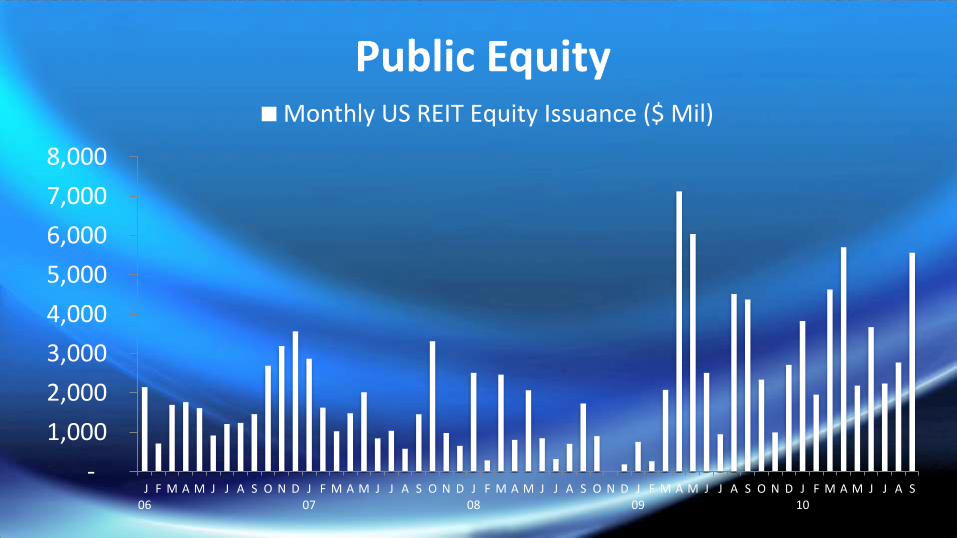
Public EquityMonthly US REIT Equity Issuance ($ Mil)
Source: NAREIT
14.0%
14.5%
15.0%
15.5%
16.0%
16.5%
17.0%
17.5%
-15000
-10000
-5000
0
5000
10000
15000
2009.4 2010.1 2010.2 2010.3 2010.4 2011.1 2011.2
Squ
are
Feet
('0
00
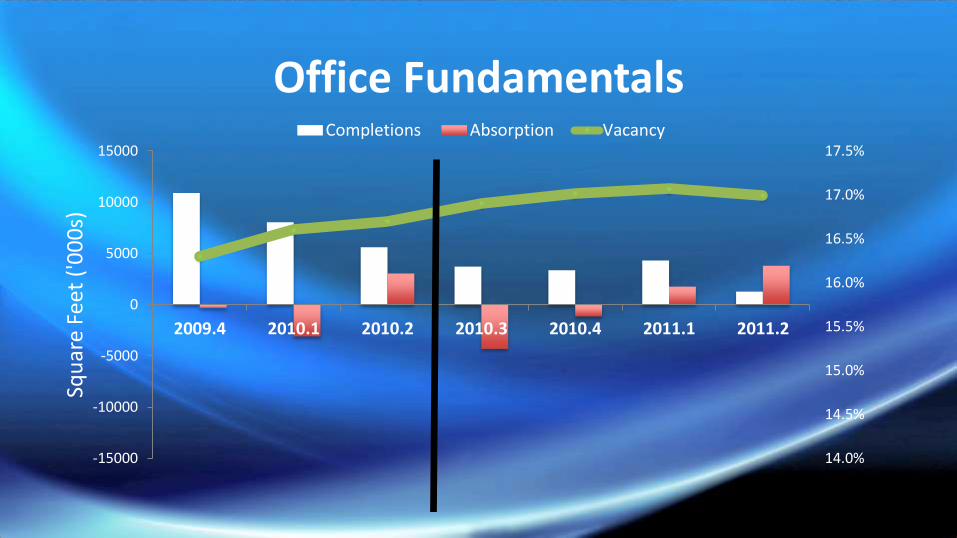
s)Office Fundamentals
Completions Absorption Vacancy
Source: NAR / CBRE-EA
0.0%
5.0%
10.0%
15.0%
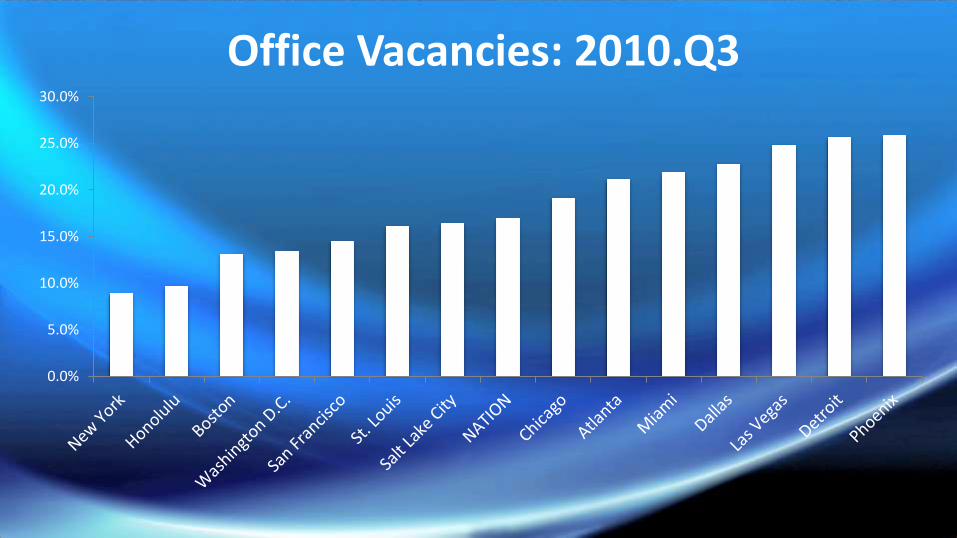
20.0%
25.0%
30.0%
Office Vacancies: 2010.Q3
Source: NAR / CBRE-EA
12.0%
12.5%
13.0%
13.5%
14.0%
14.5%
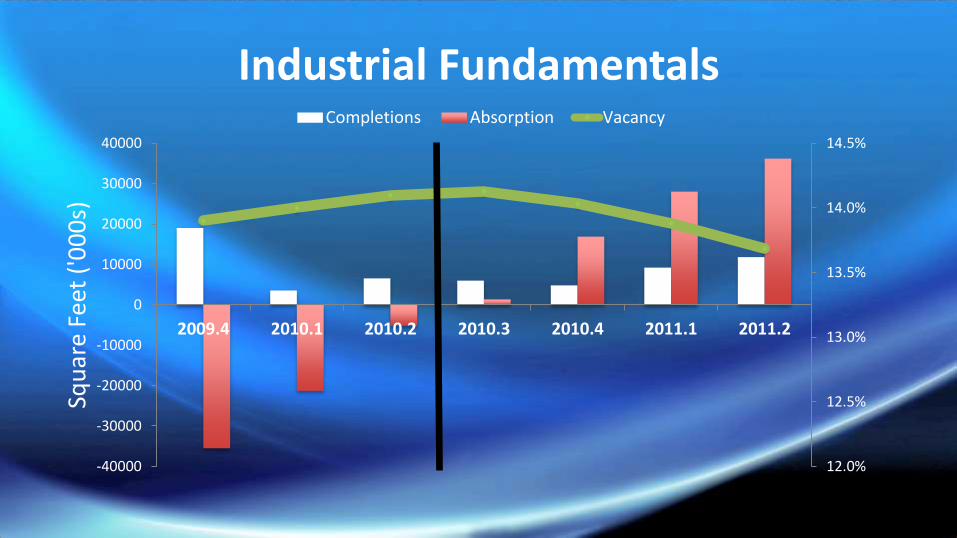
-40000
-30000
-20000
-10000
0
10000
20000
30000
40000
2009.4 2010.1 2010.2 2010.3 2010.4 2011.1 2011.2
Squ
are
Feet
('0
00
s)Industrial Fundamentals
Completions Absorption Vacancy
Source: NAR / CBRE-EA
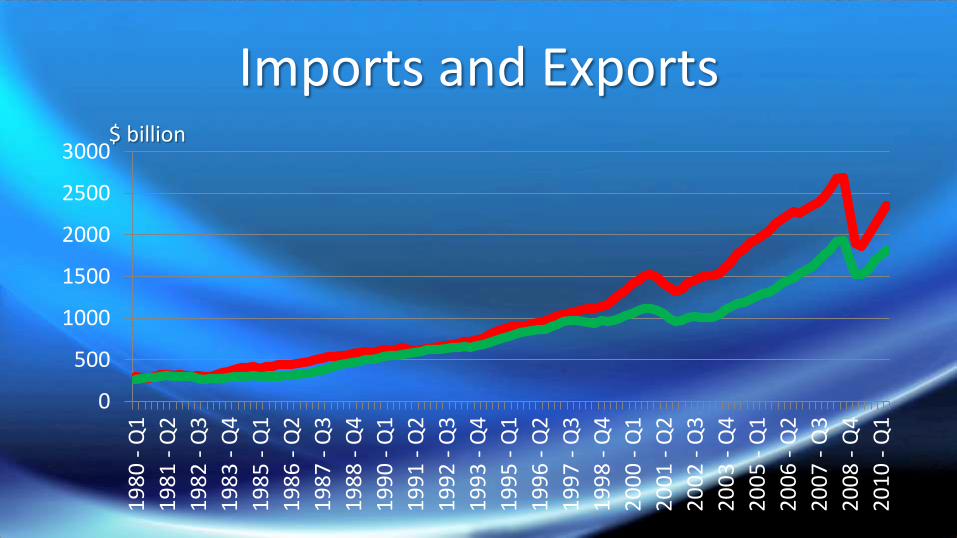
Imports and Exports
0
500
1000
1500
2000
2500
30001
98
0 -
Q1
19
81
- Q
2
19
82
- Q
3
19
83
- Q
4
19
85
- Q
1
19
86
- Q
2
19
87
- Q
3
19
88
- Q
4
19
90
- Q
1
19
91
- Q
2
19
92
- Q
3
19
93
- Q
4
19
95
- Q
1
19
96
- Q
2
19
97
- Q
3
19
98
- Q
4
20
00
- Q
1
20
01
- Q
2
20
02
- Q
3
20
03
- Q
4
20
05
- Q
1
20
06
- Q
2
20
07
- Q
3
20
08
- Q
4
20
10
- Q
1
$ billion
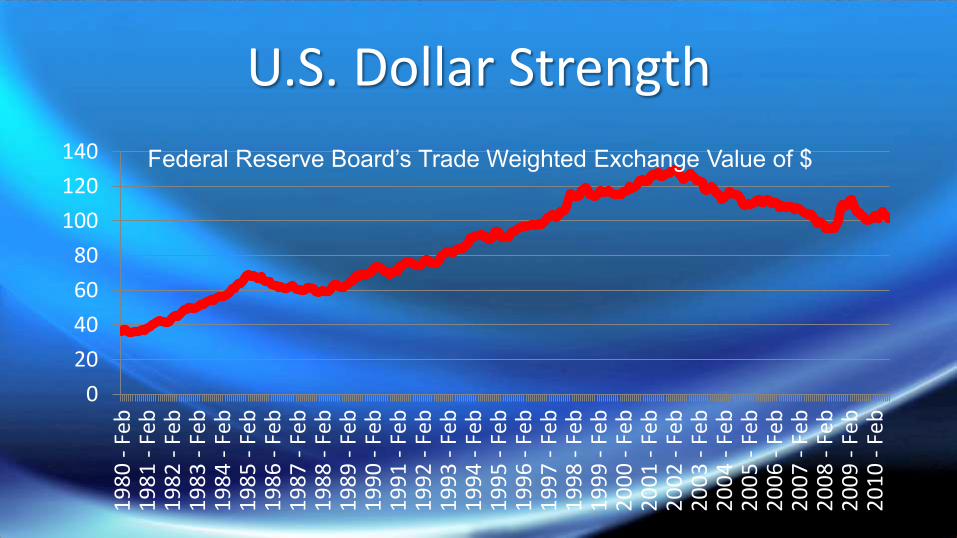
U.S. Dollar Strength
0
20
40
60
80
100
120
1401
98
0 -
Feb
19
81
- F
eb1
98
2 -
Feb
19
83
- F
eb1
98
4 -
Feb
19
85
- F
eb1
98
6 -
Feb
19
87
- F
eb1
98
8 -
Feb
19
89
- F
eb1
99
0 -
Feb
19
91
- F
eb1
99
2 -
Feb
19
93
- F
eb1
99
4 -
Feb
19
95
- F
eb1
99
6 -
Feb
19
97
- F
eb1
99
8 -
Feb
19
99
- F
eb2
00
0 -
Feb
20
01
- F
eb2
00
2 -
Feb
20
03
- F
eb2
00
4 -
Feb
20
05
- F
eb2
00
6 -
Feb
20
07
- F
eb2
00
8 -
Feb
20
09
- F
eb2
01
0 -
Feb
Federal Reserve Board’s Trade Weighted Exchange Value of $
0.0%
5.0%
10.0%
15.0%
20.0%
25.0%
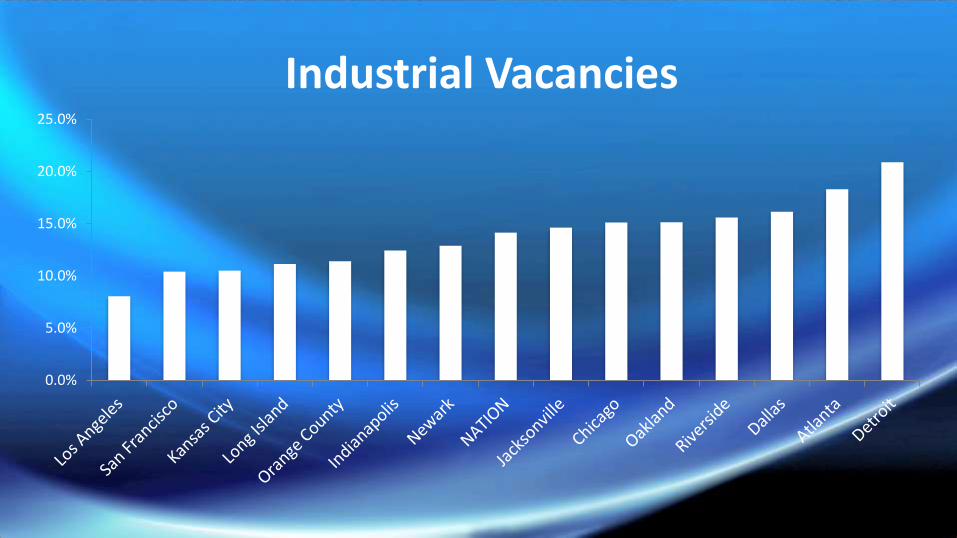
Industrial Vacancies
Source: NAR / CBRE-EA
11.0%
11.5%
12.0%
12.5%
13.0%
13.5%
-3000
-2000
-1000
0
1000
2000
3000
4000
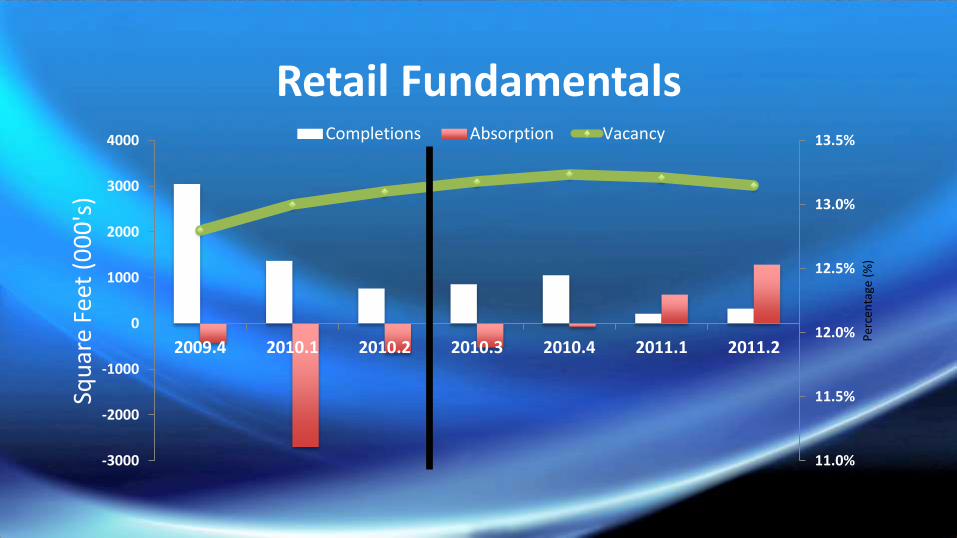
2009.4 2010.1 2010.2 2010.3 2010.4 2011.1 2011.2
Per
cen
tage
(%
)
Squ
are
Feet
(0
00
's)
Retail FundamentalsCompletions Absorption Vacancy
Source: NAR / CBRE-EA
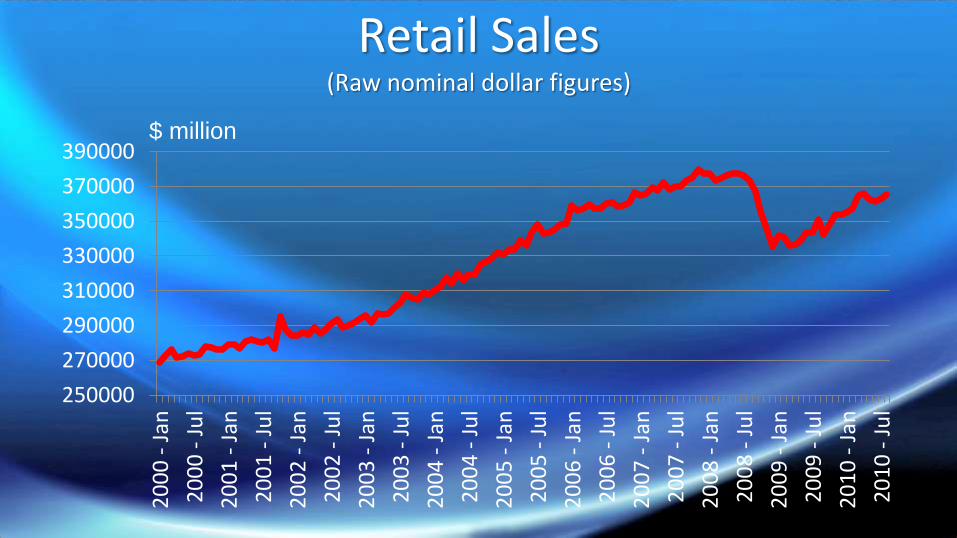
Retail Sales(Raw nominal dollar figures)
250000
270000
290000
310000
330000
350000
370000
3900002
00
0 -
Jan
20
00
- J
ul
20
01
- J
an
20
01
- J
ul
20
02
- J
an
20
02
- J
ul
20
03
- J
an
20
03
- J
ul
20
04
- J
an
20
04
- J
ul
20
05
- J
an
20
05
- J
ul
20
06
- J
an
20
06
- J
ul
20
07
- J
an
20
07
- J
ul
20
08
- J
an
20
08
- J
ul
20
09
- J
an
20
09
- J
ul
20
10
- J
an
20
10
- J
ul
$ million
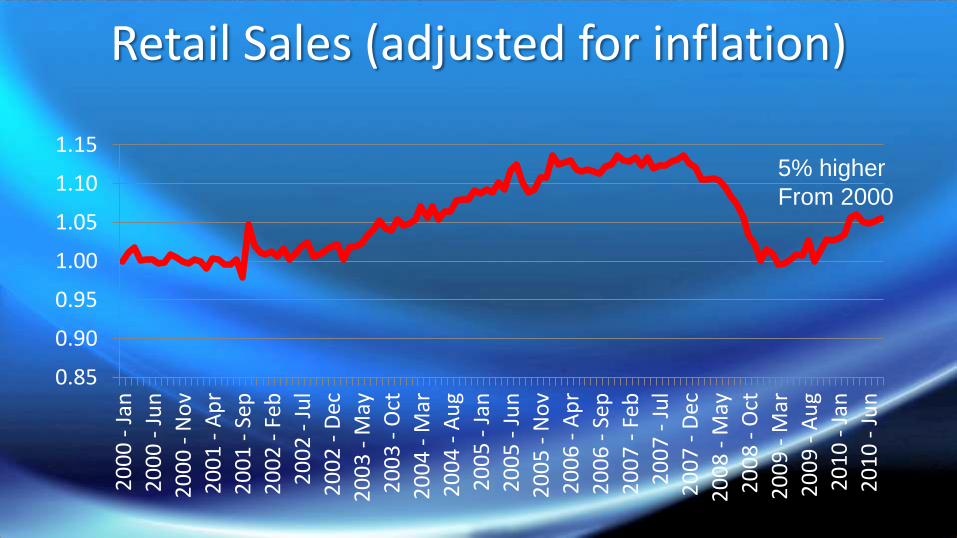
Retail Sales (adjusted for inflation)
0.85
0.90
0.95
1.00
1.05
1.10
1.152
00
0 -
Jan
20
00
- J
un
20
00
- N
ov
20
01
- A
pr
20
01
- S
ep2
00
2 -
Feb
20
02
- J
ul
20
02
- D
ec2
00
3 -
May
20
03
- O
ct2
00
4 -
Mar
20
04
- A
ug
20
05
- J
an2
00
5 -
Ju
n2
00
5 -
No
v2
00
6 -
Ap
r2
00
6 -
Sep
20
07
- F
eb2
00
7 -
Ju
l2
00
7 -
Dec
20
08
- M
ay2
00
8 -
Oct
20
09
- M
ar2
00
9 -
Au
g2
01
0 -
Jan
20
10
- J
un
5% higher
From 2000
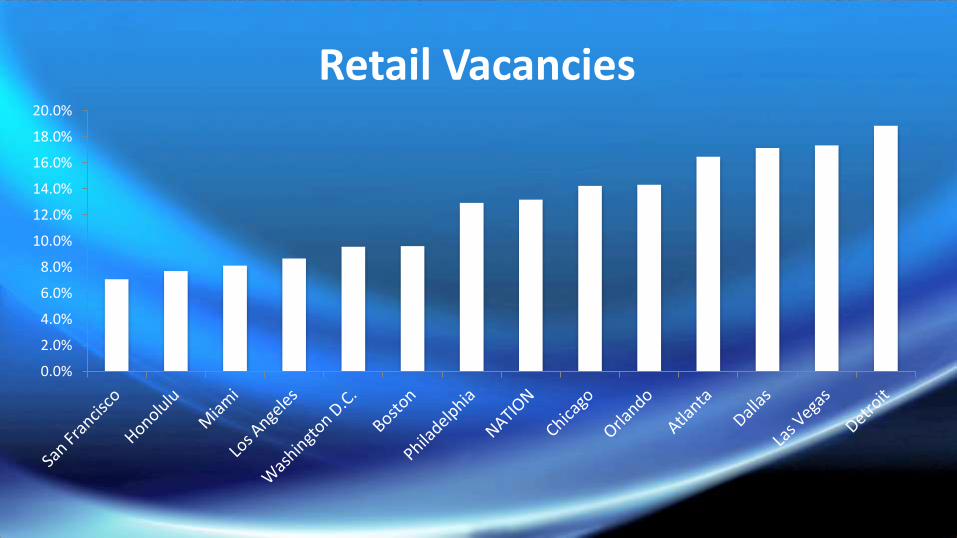
0.0%
2.0%
4.0%
6.0%
8.0%
10.0%
12.0%
14.0%
16.0%
18.0%
20.0%
Retail Vacancies
Source: NAR / CBRE-EA
3.0%
4.0%
5.0%
6.0%
7.0%
8.0%
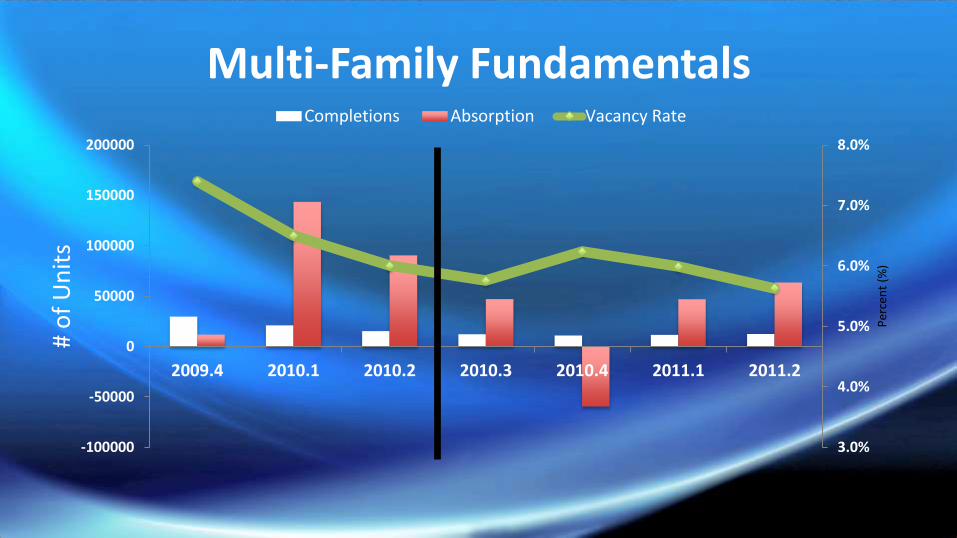
-100000
-50000
0
50000
100000
150000
200000
2009.4 2010.1 2010.2 2010.3 2010.4 2011.1 2011.2
Per
cen
t (%
)
# o
f U
nit
sMulti-Family Fundamentals
Completions Absorption Vacancy Rate
Source: NAR / CBRE-EA
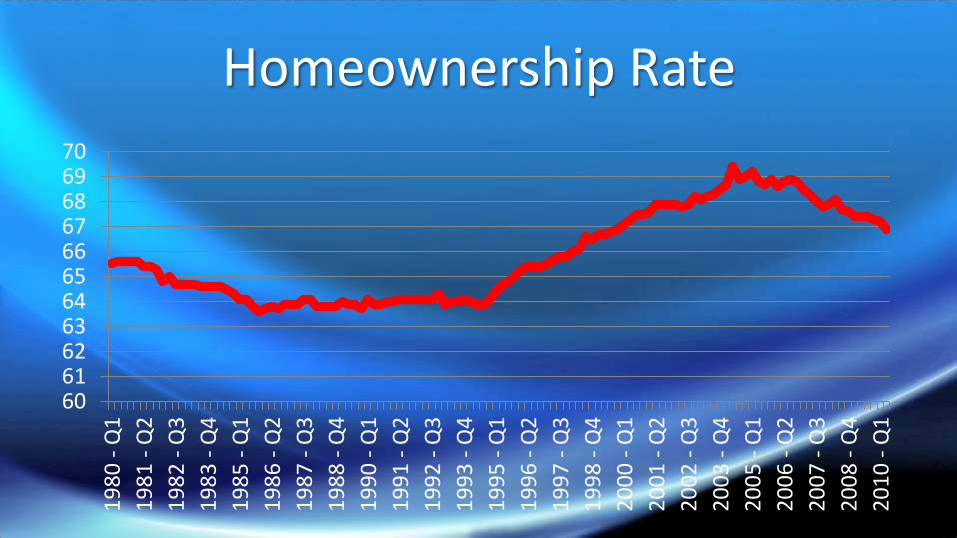
Homeownership Rate
6061626364656667686970
19
80
- Q
1
19
81
- Q
2
19
82
- Q
3
19
83
- Q
4
19
85
- Q
1
19
86
- Q
2
19
87
- Q
3
19
88
- Q
4
19
90
- Q
1
19
91
- Q
2
19
92
- Q
3
19
93
- Q
4
19
95
- Q
1
19
96
- Q
2
19
97
- Q
3
19
98
- Q
4
20
00
- Q
1
20
01
- Q
2
20
02
- Q
3
20
03
- Q
4
20
05
- Q
1
20
06
- Q
2
20
07
- Q
3
20
08
- Q
4
20
10
- Q
1
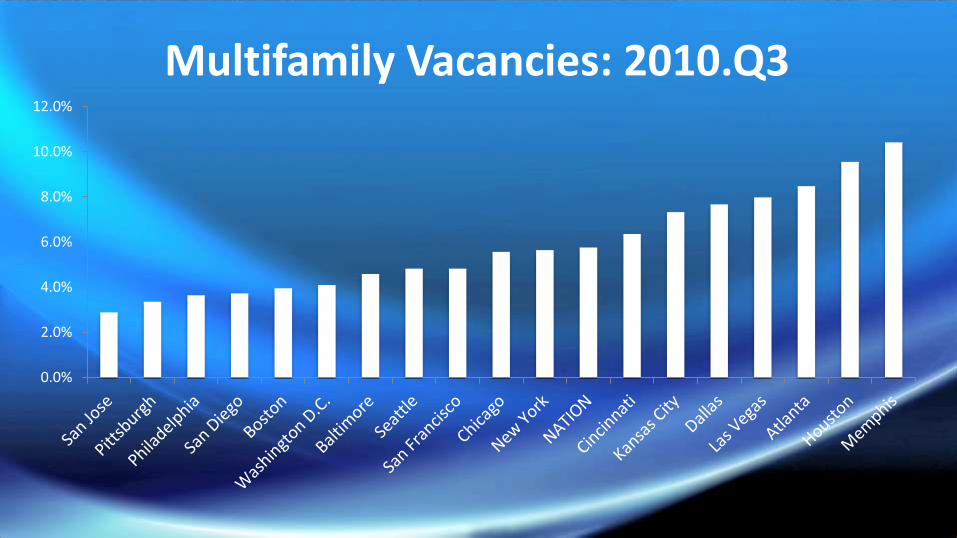
0.0%
2.0%
4.0%
6.0%
8.0%
10.0%
12.0%
Multifamily Vacancies: 2010.Q3
Source: NAR / CBRE-EA
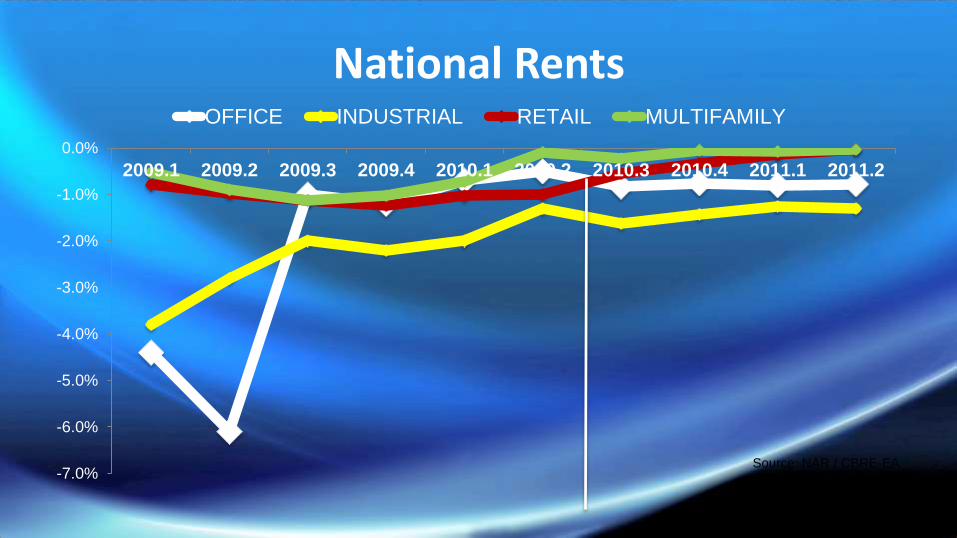
-7.0%
-6.0%
-5.0%
-4.0%
-3.0%
-2.0%
-1.0%
0.0%
2009.1 2009.2 2009.3 2009.4 2010.1 2010.2 2010.3 2010.4 2011.1 2011.2
National RentsOFFICE INDUSTRIAL RETAIL MULTIFAMILY
Source: NAR / CBRE-EA

57%43%
Did you complete a commercial sales transaction?
Yes
No
0%
10%
20%
30%
40%
50%
60%
70%
80%
90%
100%
Current ChallengesOther
Pricing Gapbetween Buyersand SellersNationalEconomy
Local Economy
Financing
Distress
Source: NAR
REALTORS® Commercial Activity: 2010.Q2
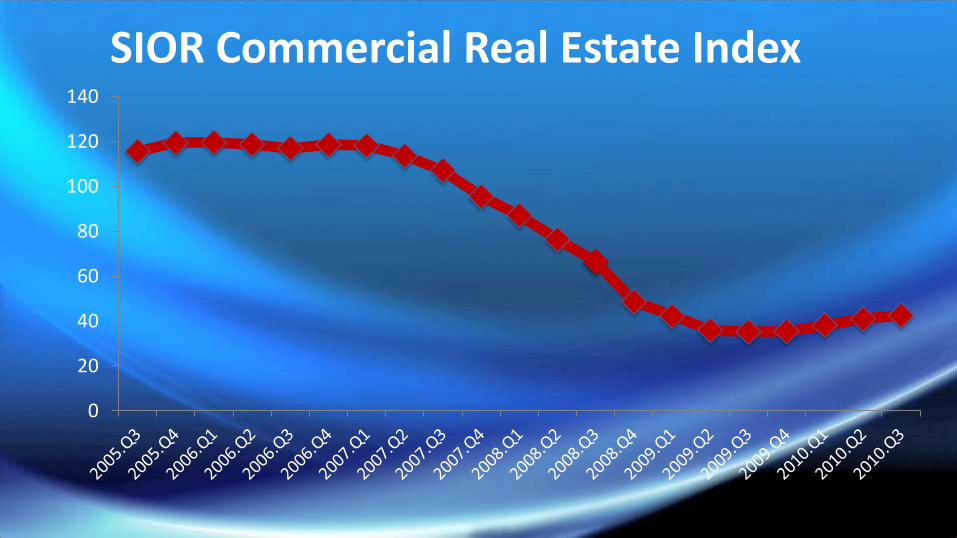
0
20
40
60
80
100
120
140
SIOR Commercial Real Estate Index
Source: SIOR, NAR
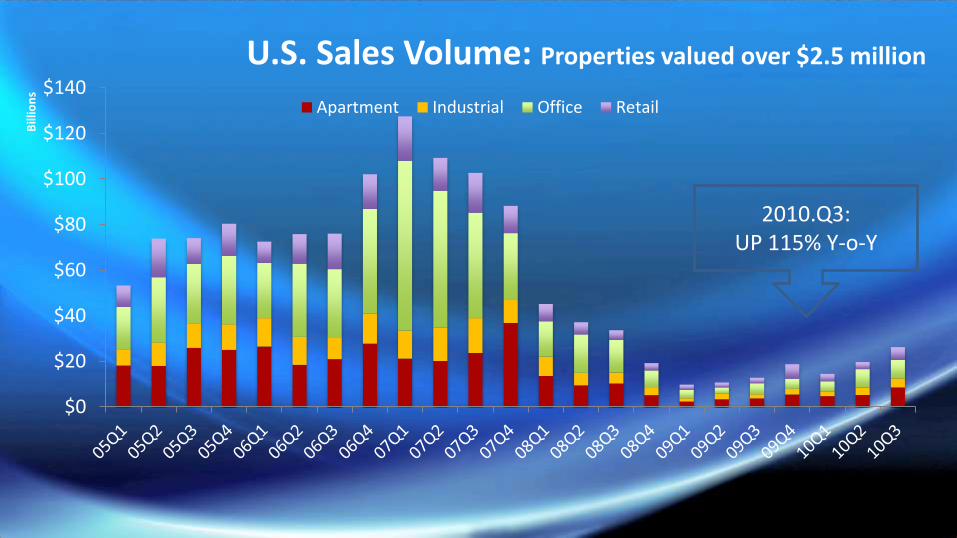
$0
$20
$40
$60
$80
$100
$120
$140
Bill
ion
s
U.S. Sales Volume: Properties valued over $2.5 million
Apartment Industrial Office Retail
Source: Real Capital Analytics
2010.Q3: UP 115% Y-o-Y

1%
2%
8%
13%
22%
54%
Over $10 M
Between $5 M and $10 M
$2 M and $5 M
Between $1 M and $2 M
Between $500K and $1 M
Under $500K
Dollar amount of last transaction
Source: NAR
REALTORS® Commercial Activity: 2010.Q2
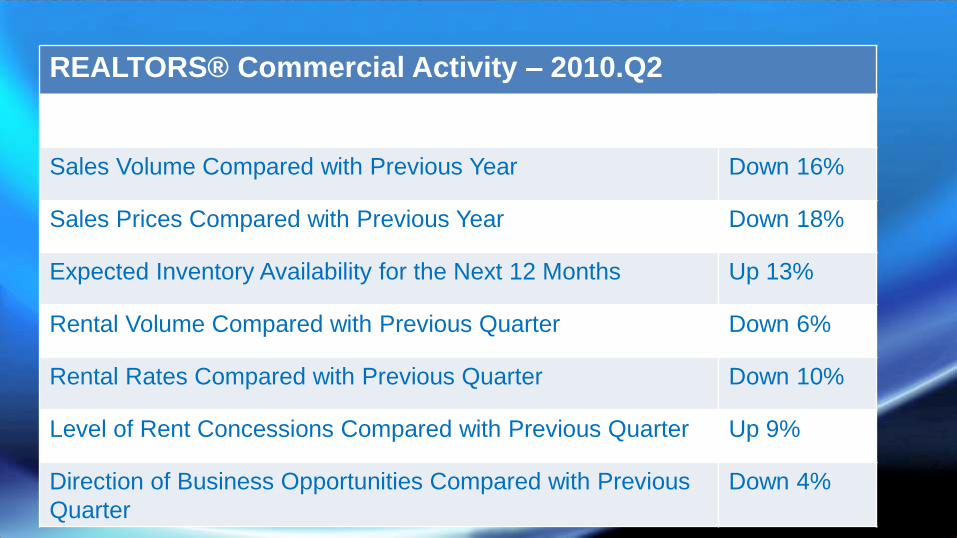
REALTORS® Commercial Activity – 2010.Q2
Sales Volume Compared with Previous Year Down 16%
Sales Prices Compared with Previous Year Down 18%
Expected Inventory Availability for the Next 12 Months Up 13%
Rental Volume Compared with Previous Quarter Down 6%
Rental Rates Compared with Previous Quarter Down 10%
Level of Rent Concessions Compared with Previous Quarter Up 9%
Direction of Business Opportunities Compared with Previous
Quarter
Down 4%
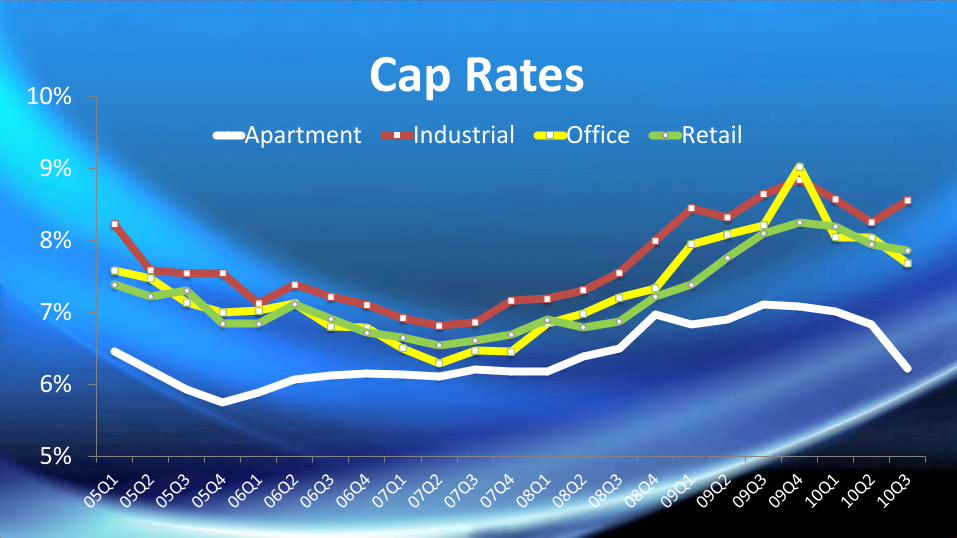
5%
6%
7%
8%
9%
10% Cap RatesApartment Industrial Office Retail
Source: Real Capital Analytics
0.0%
1.0%
2.0%
3.0%
4.0%
5.0%
6.0%
7.0%
8.0%
9.0%
10.0%
J'01
A J O J'02
A J O J'03
A J O J'04
A J O J'05
A J O J'06
A J O J'07
A J O J'08
A J O J'09
A J O J'10
A J
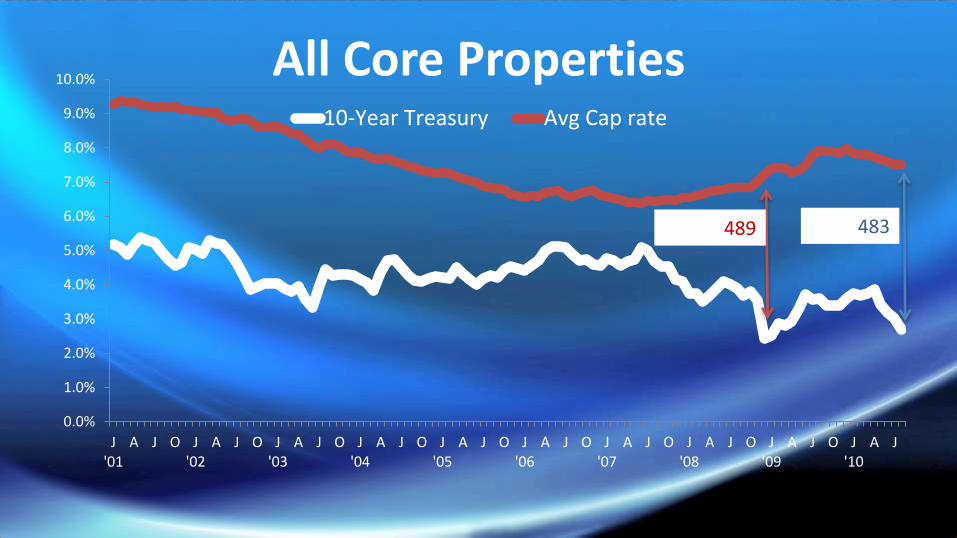
All Core Properties10-Year Treasury Avg Cap rate
Source: Real Capital Analytics
483489

10-Year Treasury impacted by Inflationary Expectations
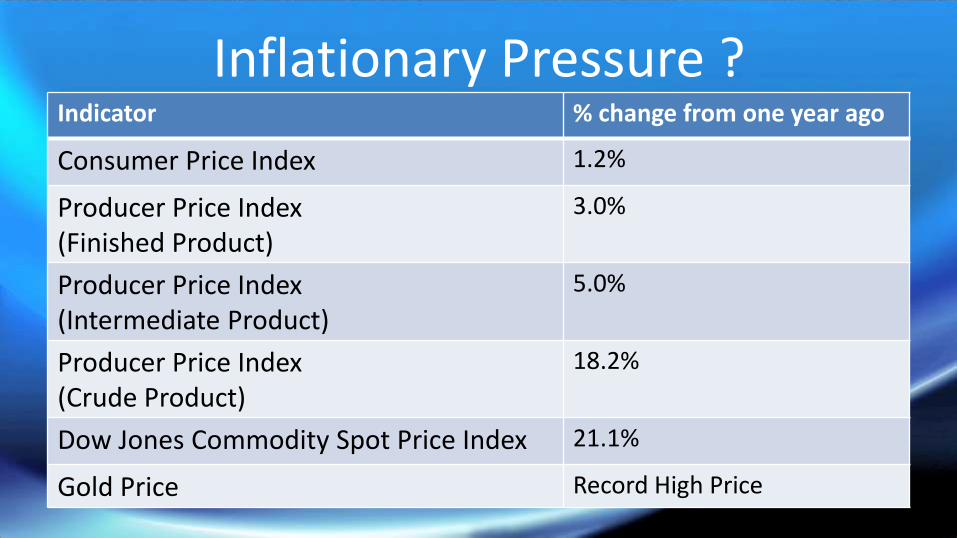
Inflationary Pressure ?Indicator % change from one year ago
Consumer Price Index 1.2%
Producer Price Index (Finished Product)
3.0%
Producer Price Index (Intermediate Product)
5.0%
Producer Price Index (Crude Product)
18.2%
Dow Jones Commodity Spot Price Index 21.1%
Gold Price Record High Price
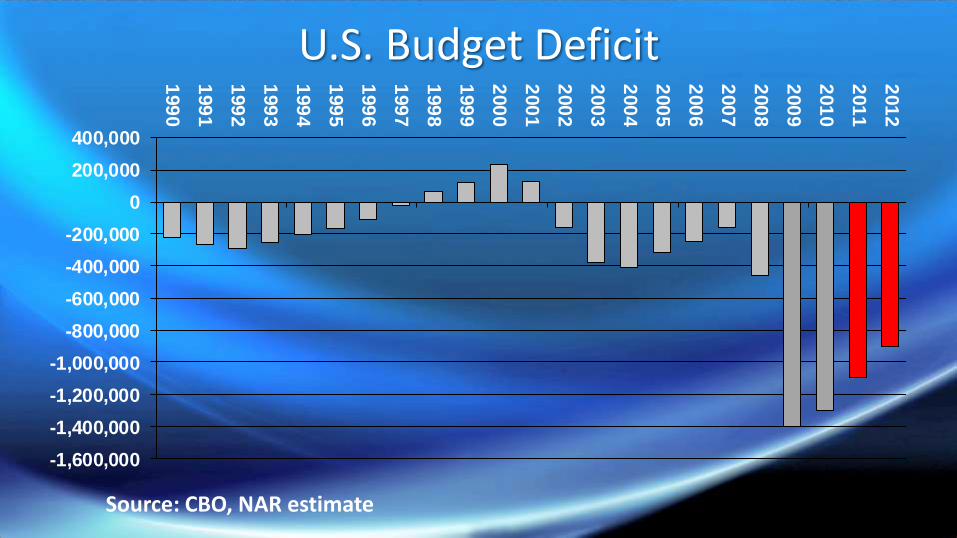
U.S. Budget Deficit
-1,600,000
-1,400,000
-1,200,000
-1,000,000
-800,000
-600,000
-400,000
-200,000
0
200,000
400,000
199
0
199
1
199
2
199
3
199
4
199
5
199
6
199
7
199
8
199
9
200
0
200
1
200
2
200
3
200
4
200
5
200
6
200
7
200
8
200
9
201
0
201
1
201
2
Source: CBO, NAR estimate
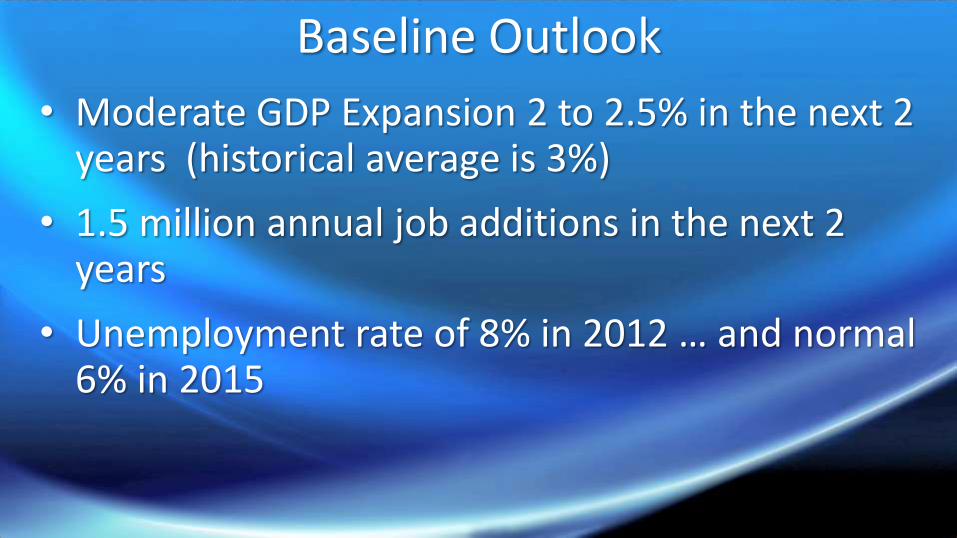
Baseline Outlook
• Moderate GDP Expansion 2 to 2.5% in the next 2 years (historical average is 3%)
• 1.5 million annual job additions in the next 2 years
• Unemployment rate of 8% in 2012 … and normal 6% in 2015
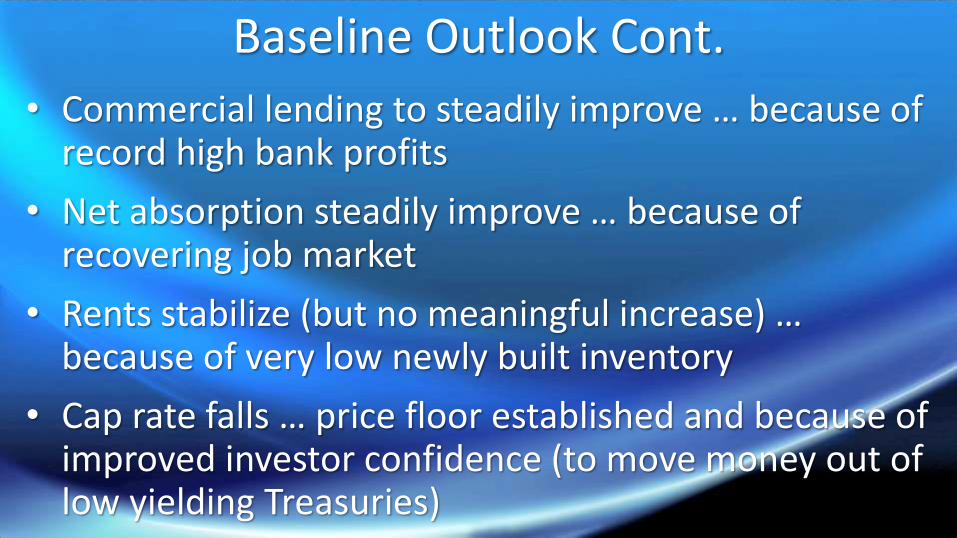
Baseline Outlook Cont.
• Commercial lending to steadily improve … because of record high bank profits
• Net absorption steadily improve … because of recovering job market
• Rents stabilize (but no meaningful increase) … because of very low newly built inventory
• Cap rate falls … price floor established and because of improved investor confidence (to move money out of low yielding Treasuries)

Alternative Outlooks• High inflation … people desire tangible investment like real estate, but
interest rate will be higher
• Deflation … investors hold back for better price … holds back economy
• Budget deficit tipping point … higher interest rate and sharp cut back in standard of living
• Sharp 4% to 5% GDP growth … business spending returns in line with profits … faster job creation … faster commercial market recovery